

Nitric Oxide and Globin Glb1 Regulate Fusarium oxysporum Infection of Arabidopsis thaliana
 , and
, and 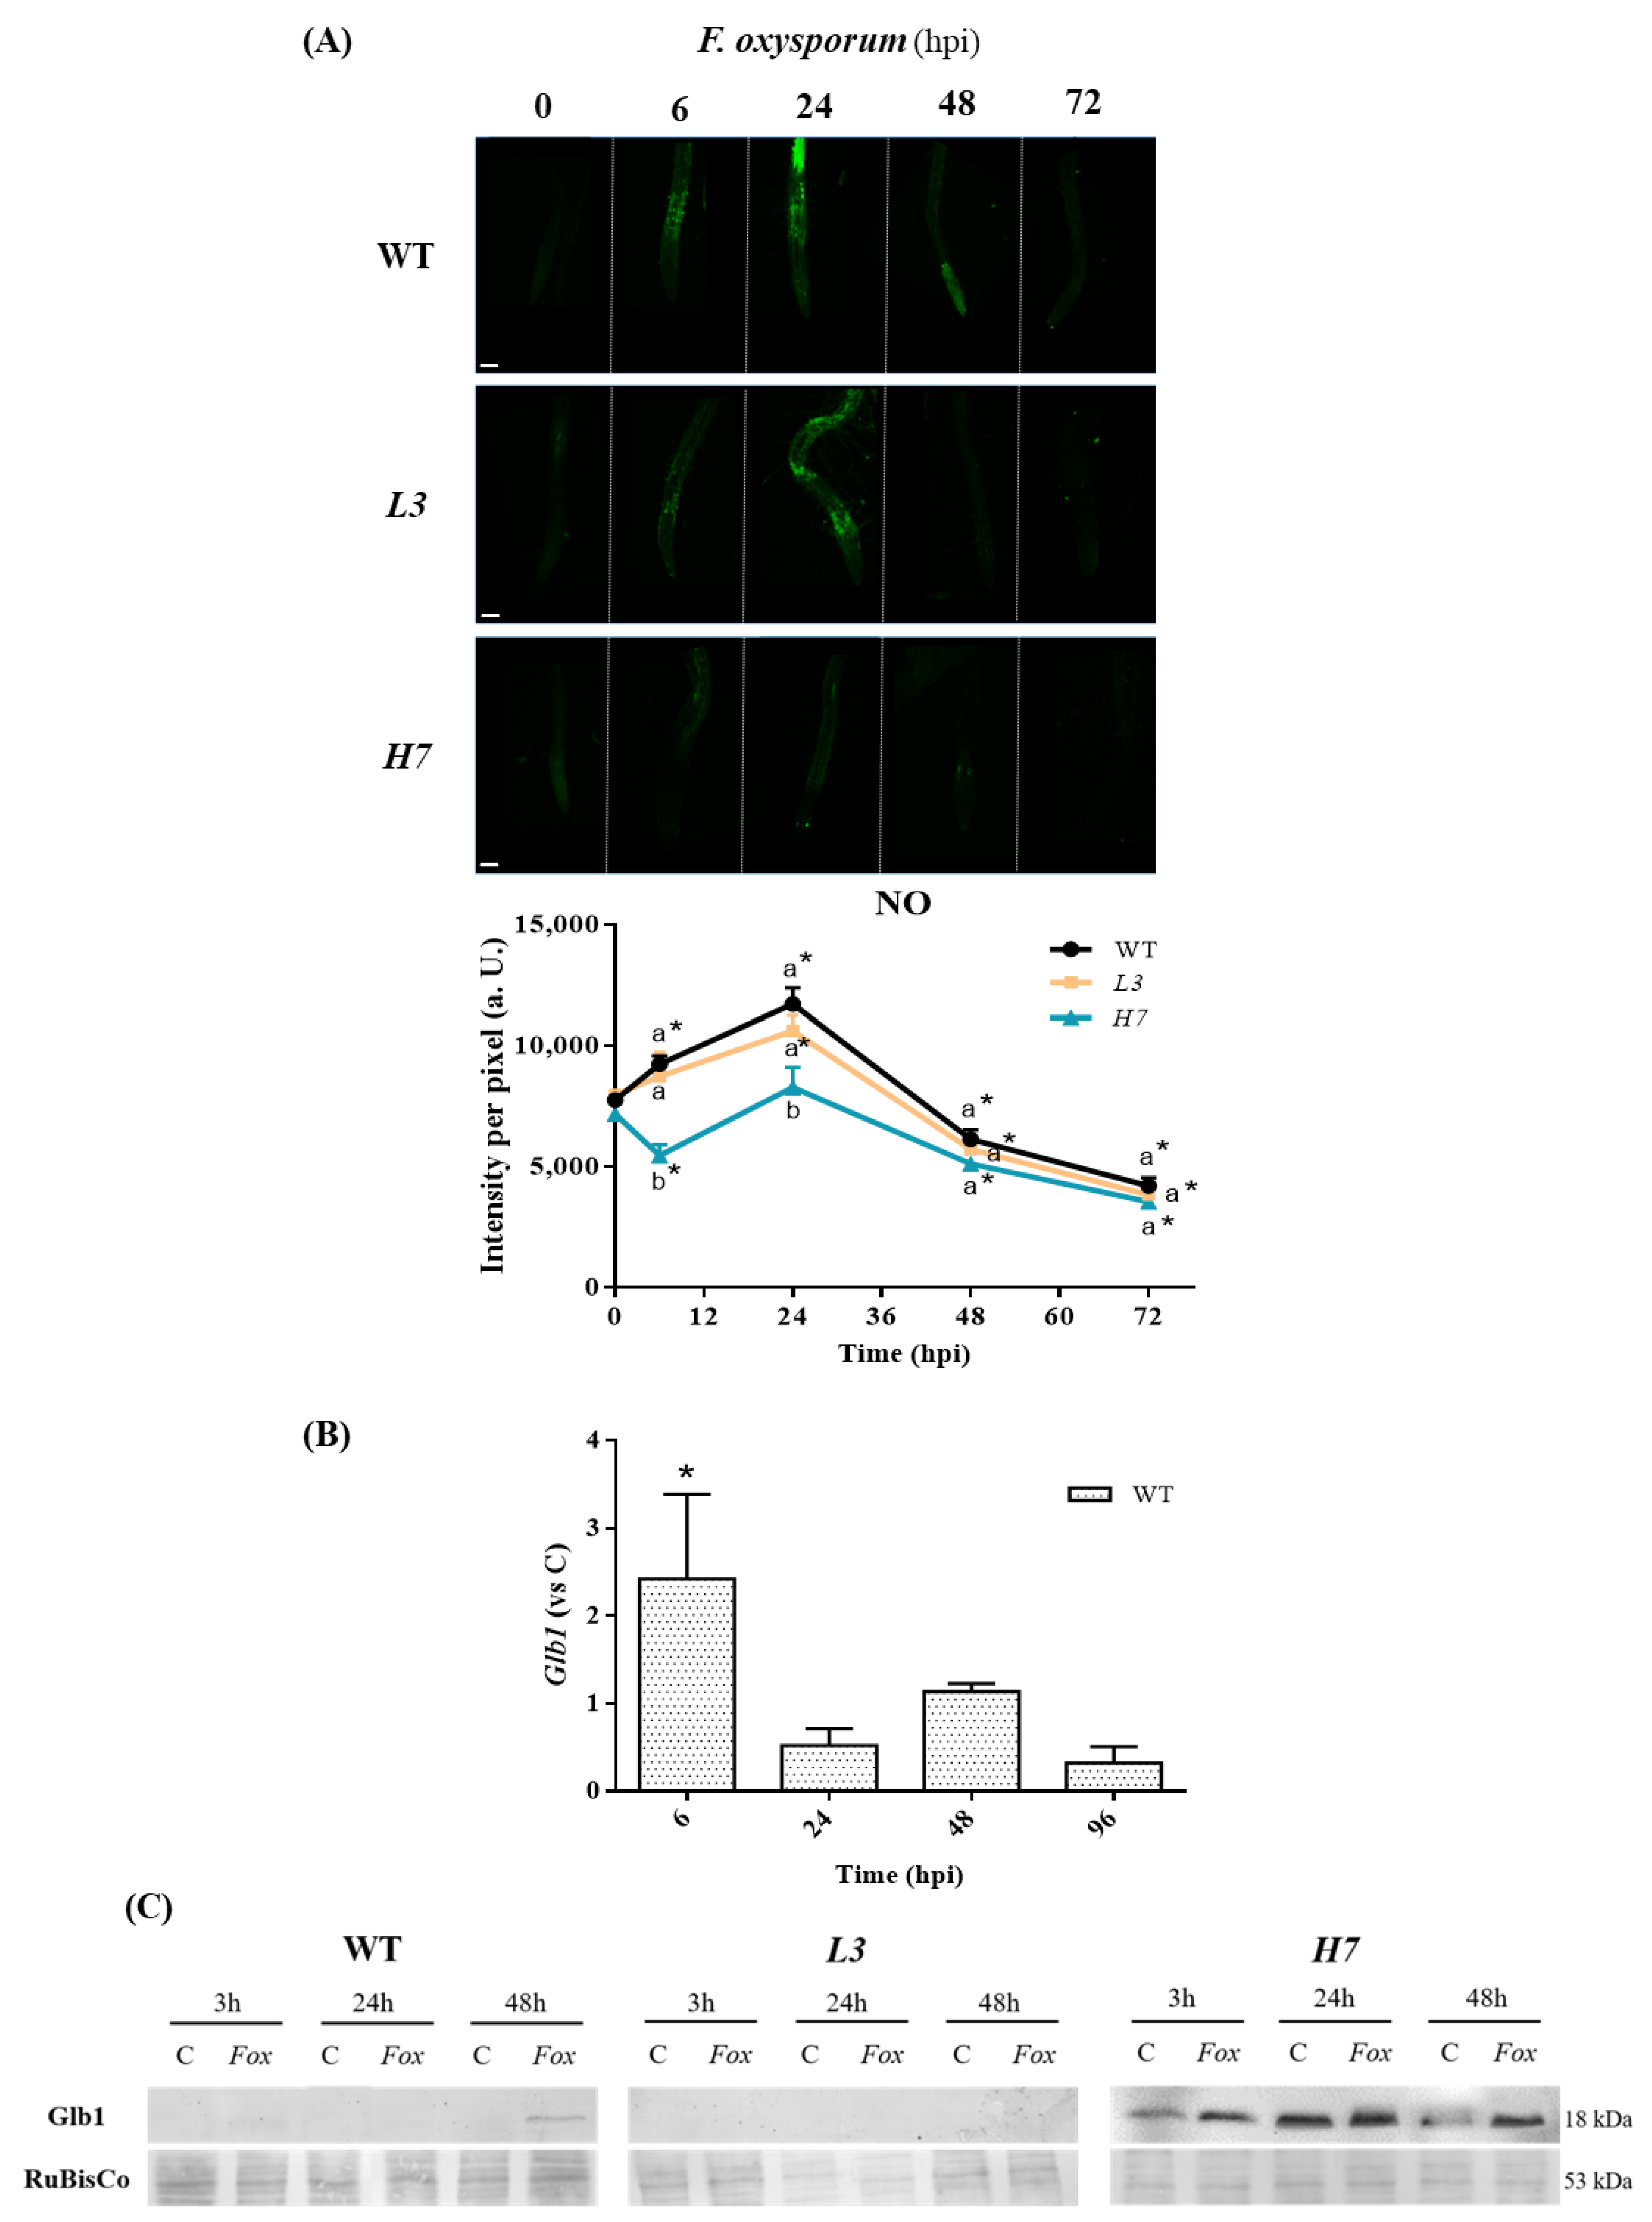
Abstract
:1. Introduction
2. Materials and Methods
2.1. Plant Growth Conditions and Fungal Strains
2.2. Plant Infection Assays
2.3. Gene Expression and Fungal Burden Quantification Using Real-Time Quantitative PCR (RT-qPCR)
2.4. Nitric Oxide and ROS Detection
2.5. Ferric-Chelate Reductase, Peroxidase Activities, and Western Blot
2.6. Quantification of Phenolic Compounds from Root Exudates
2.7. Principal Component Analysis
2.8. Statistical Analyzes
3. Results and Discussion
3.1. NO Production and Glb1 in Arabidopsis after Inoculation with Fusarium oxysporum
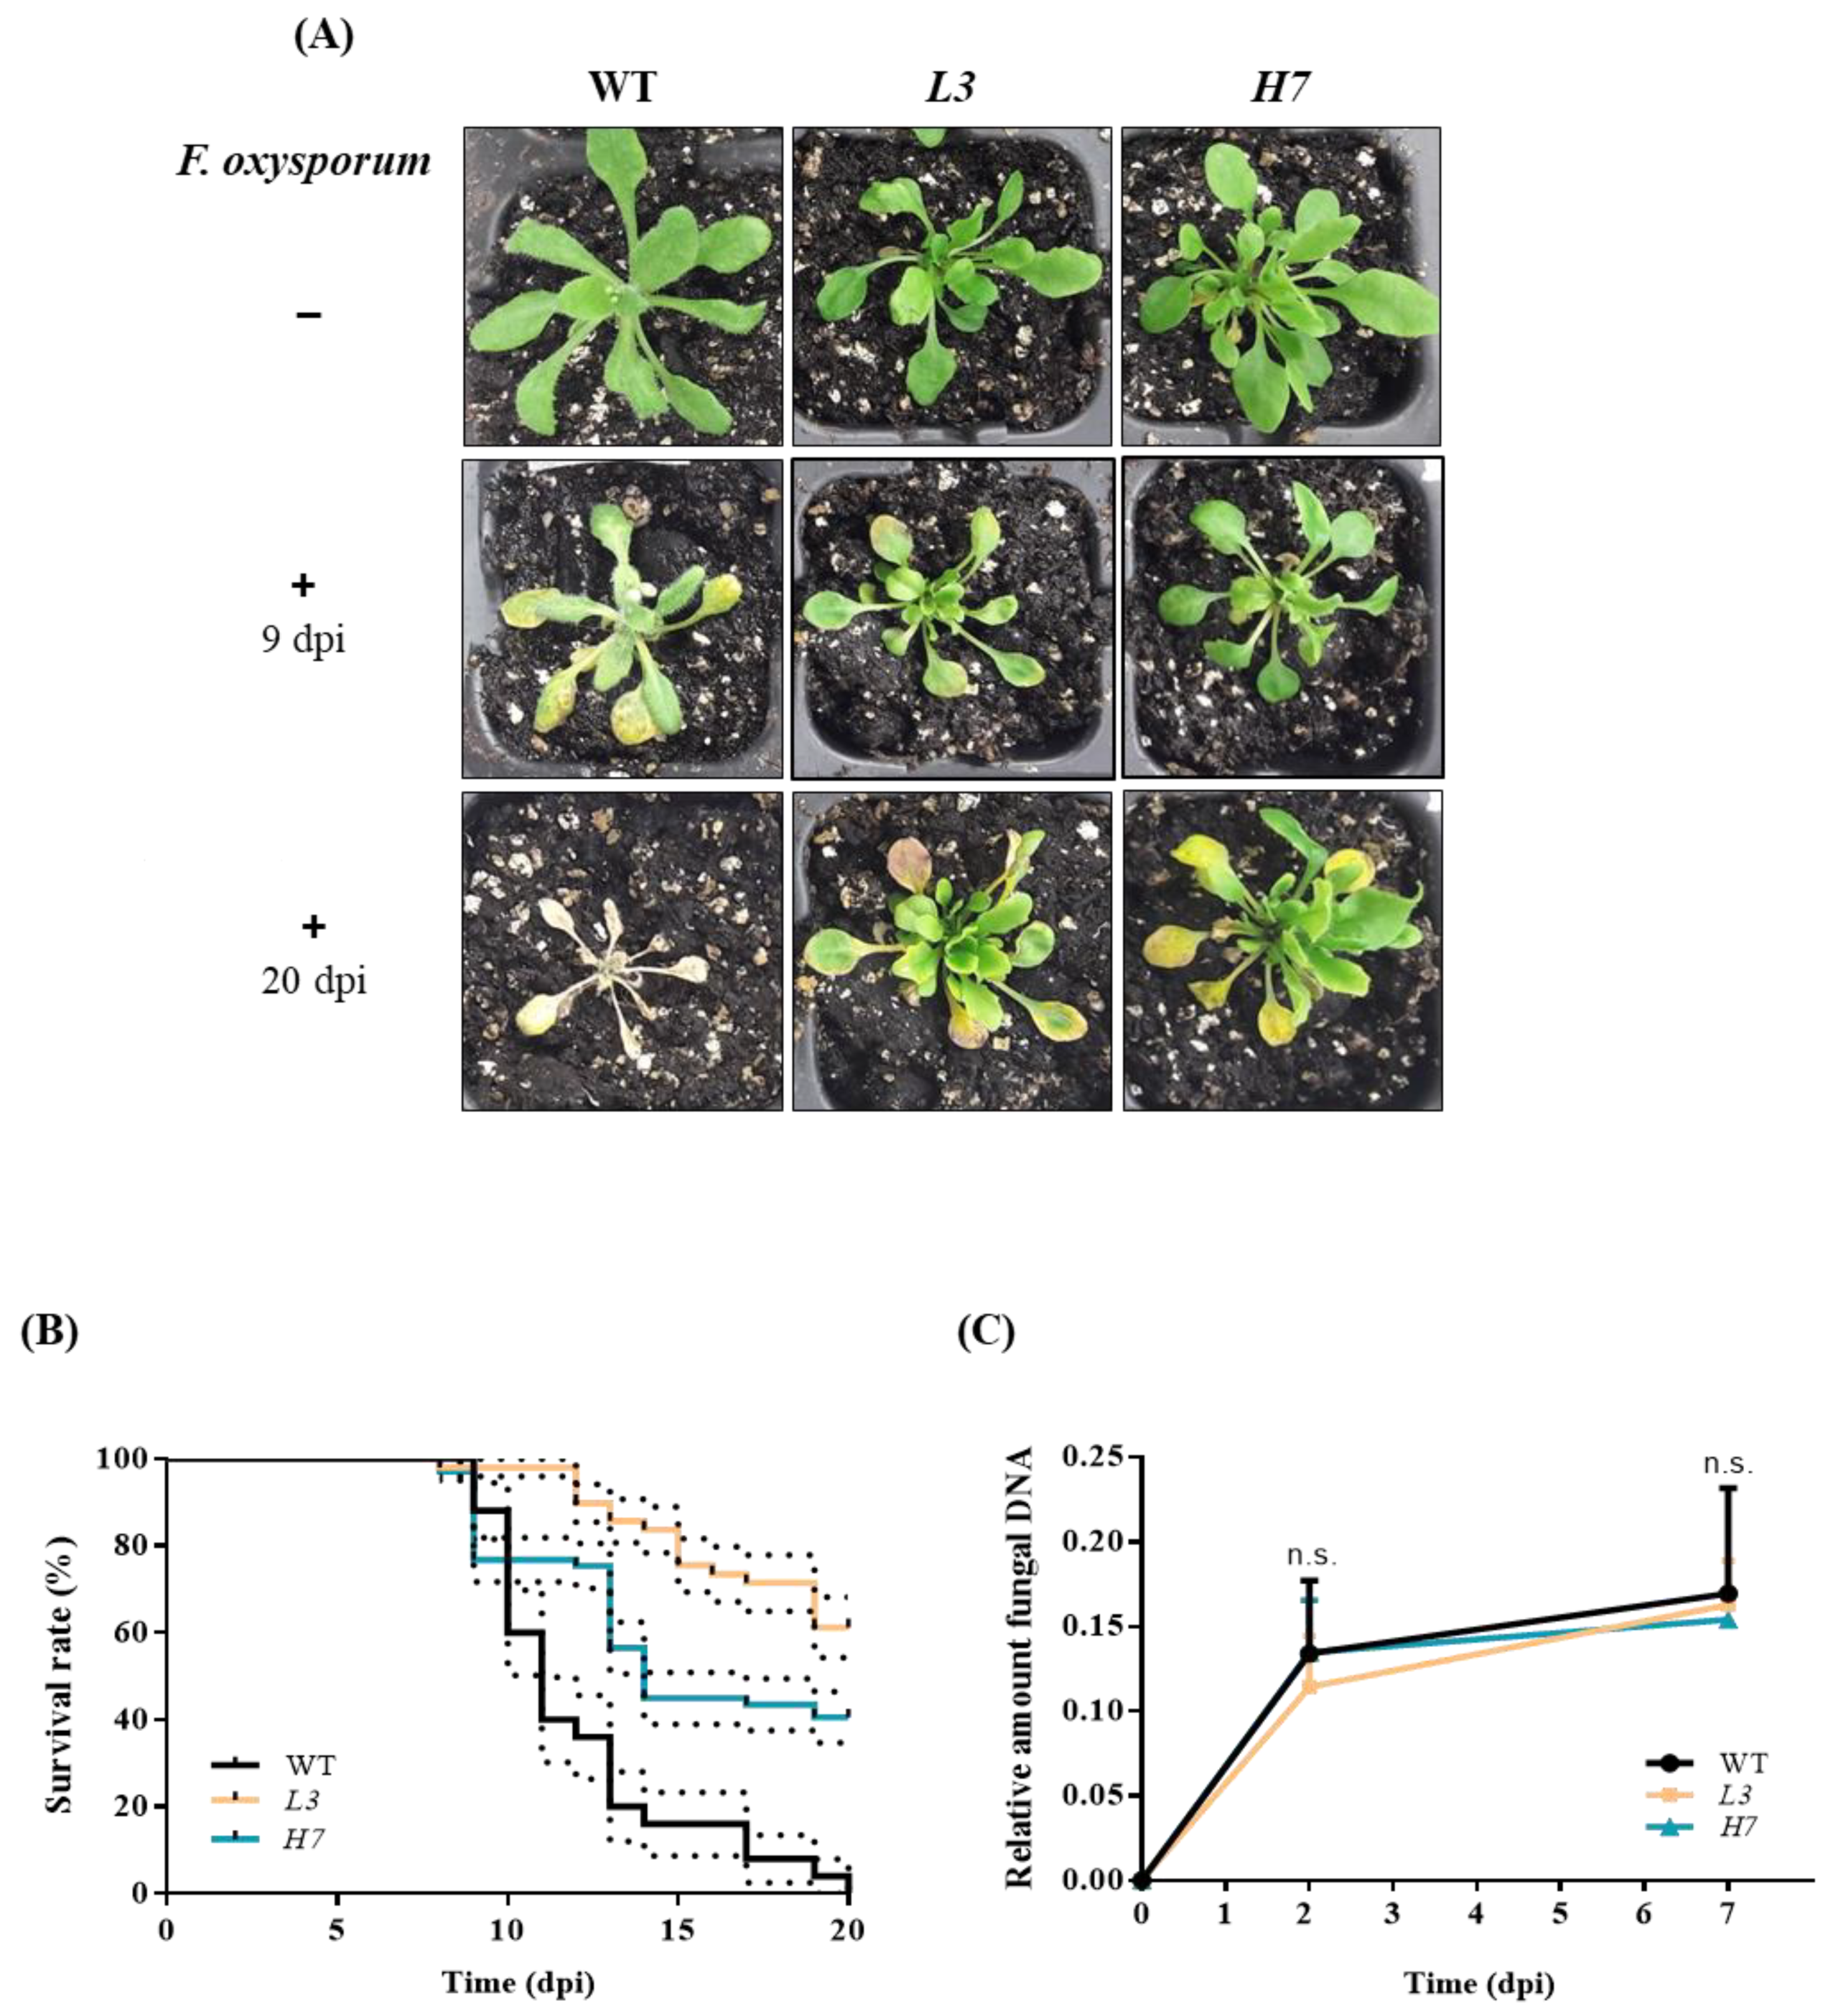
3.2. Plant Survival in the WT and Glb1 Lines after Inoculation with Fusarium oxysporum
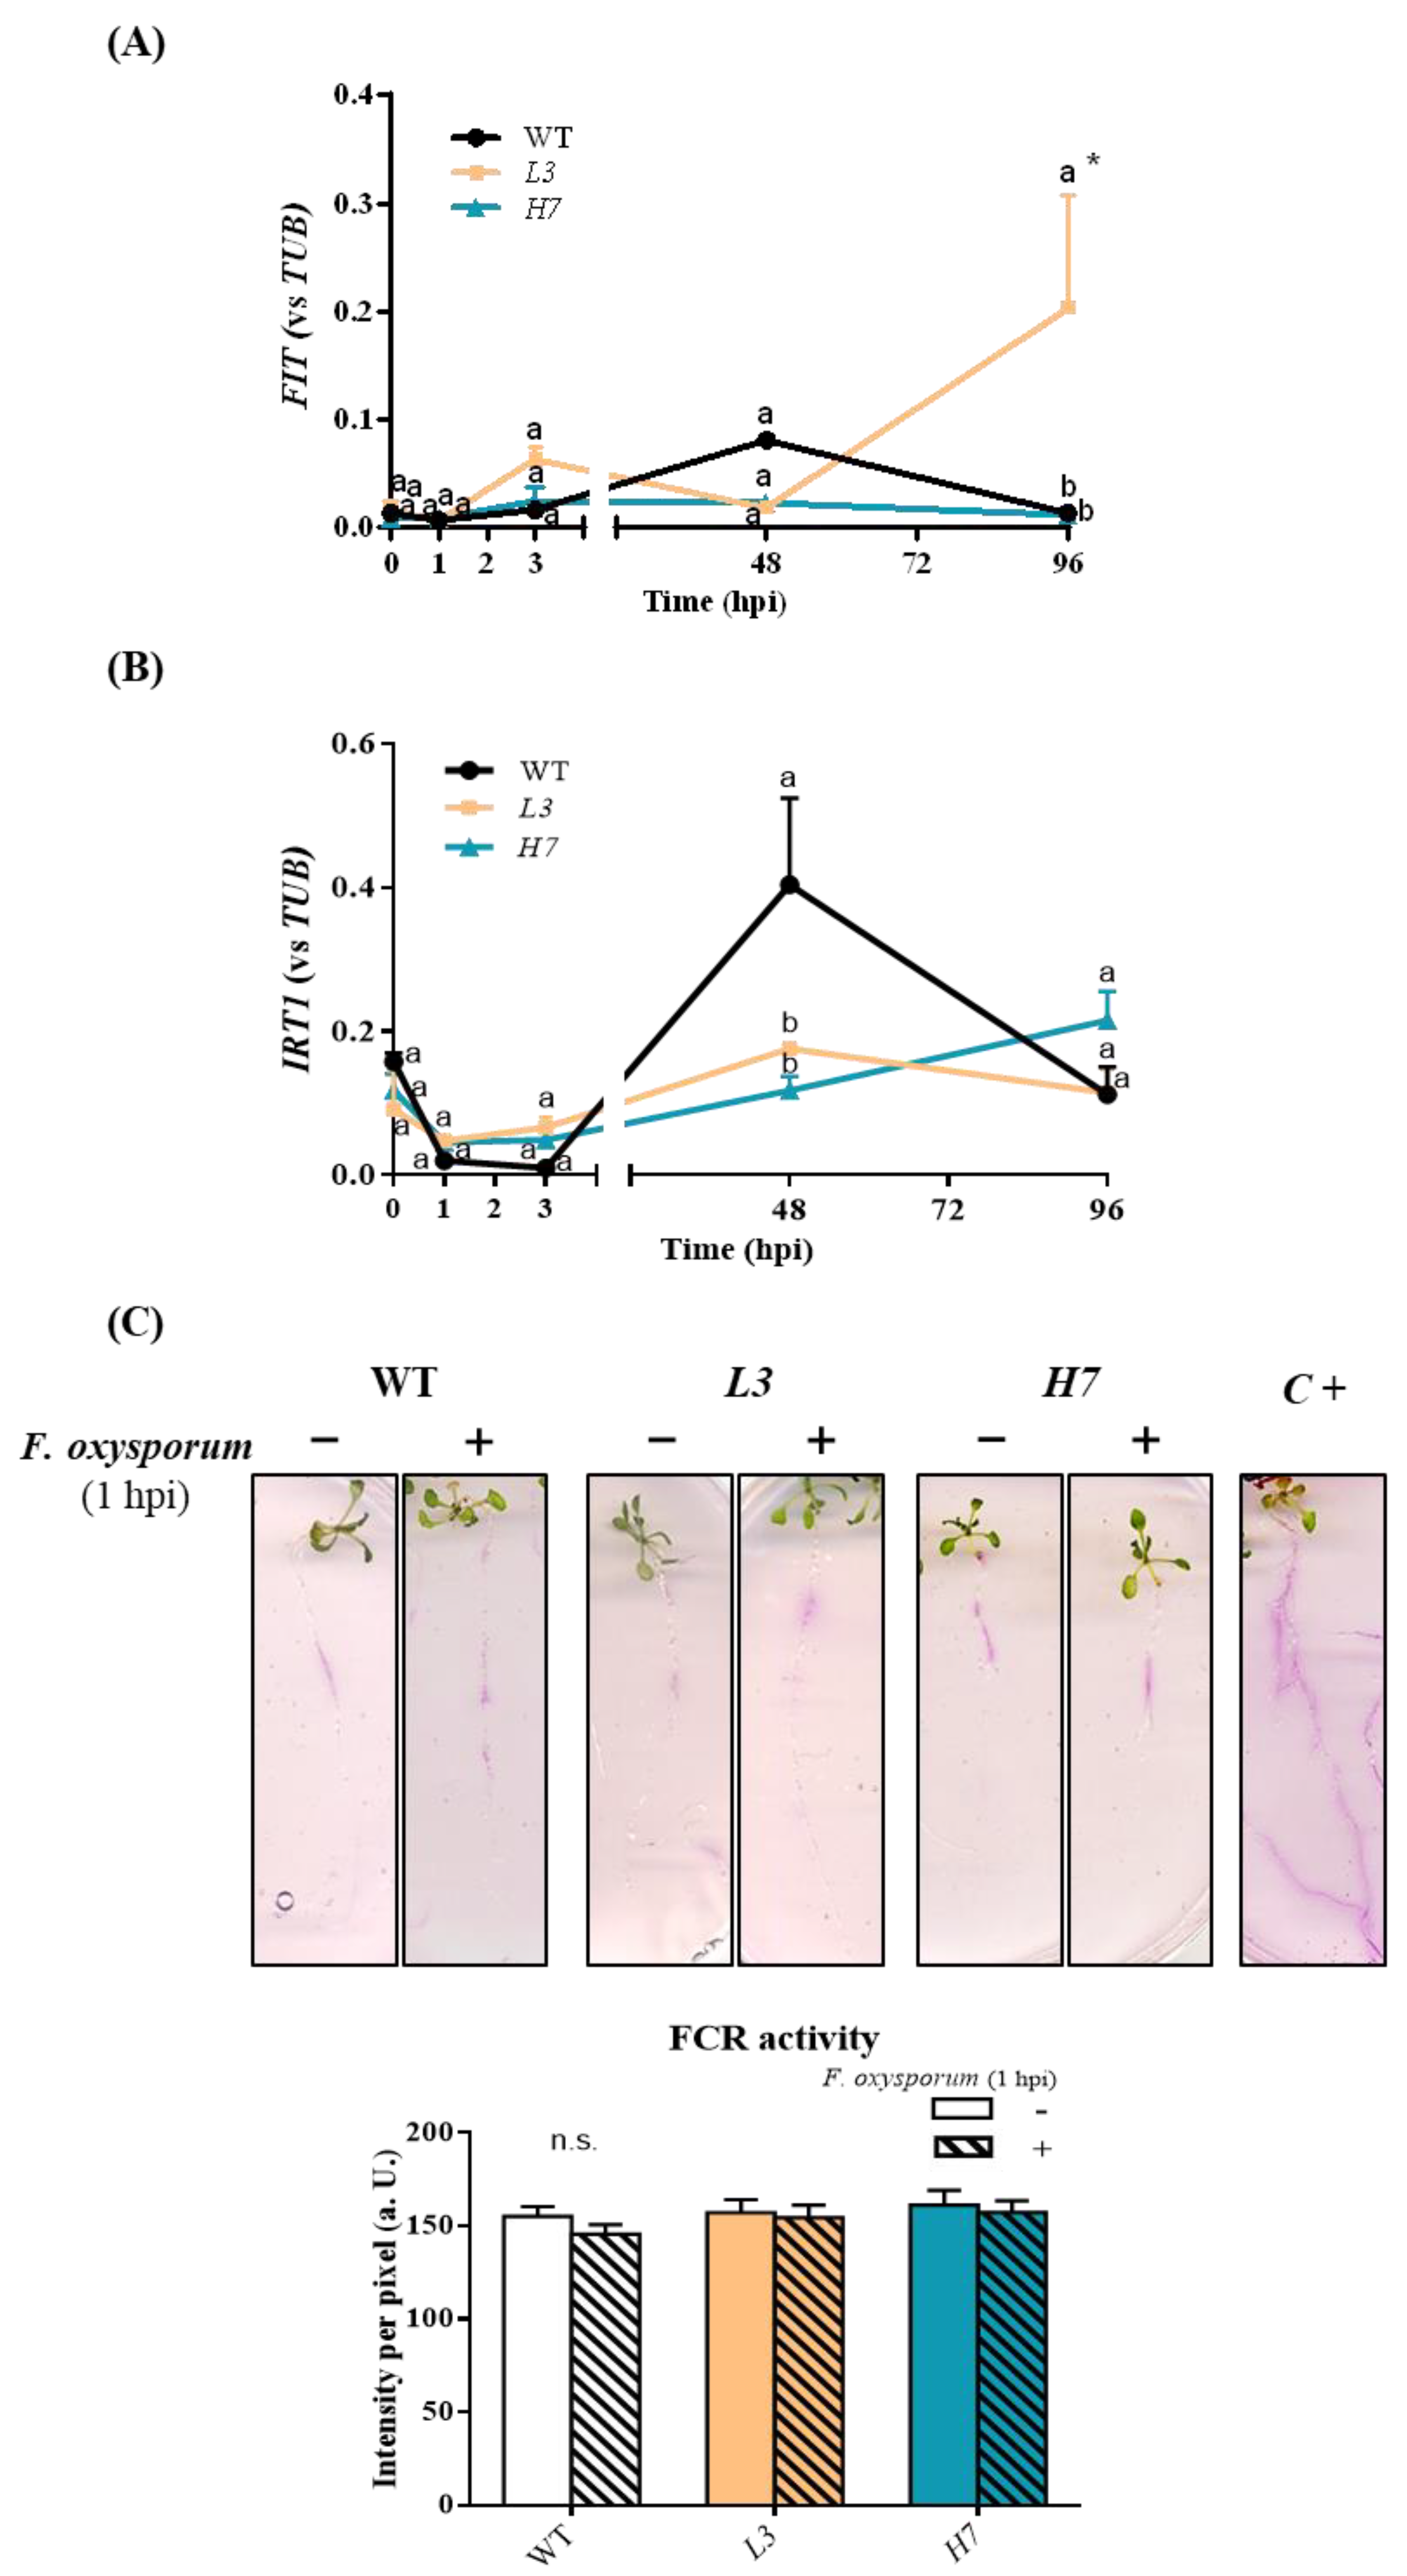
3.3. Iron Metabolism in Arabidopsis Plants in Response to F. oxysporum
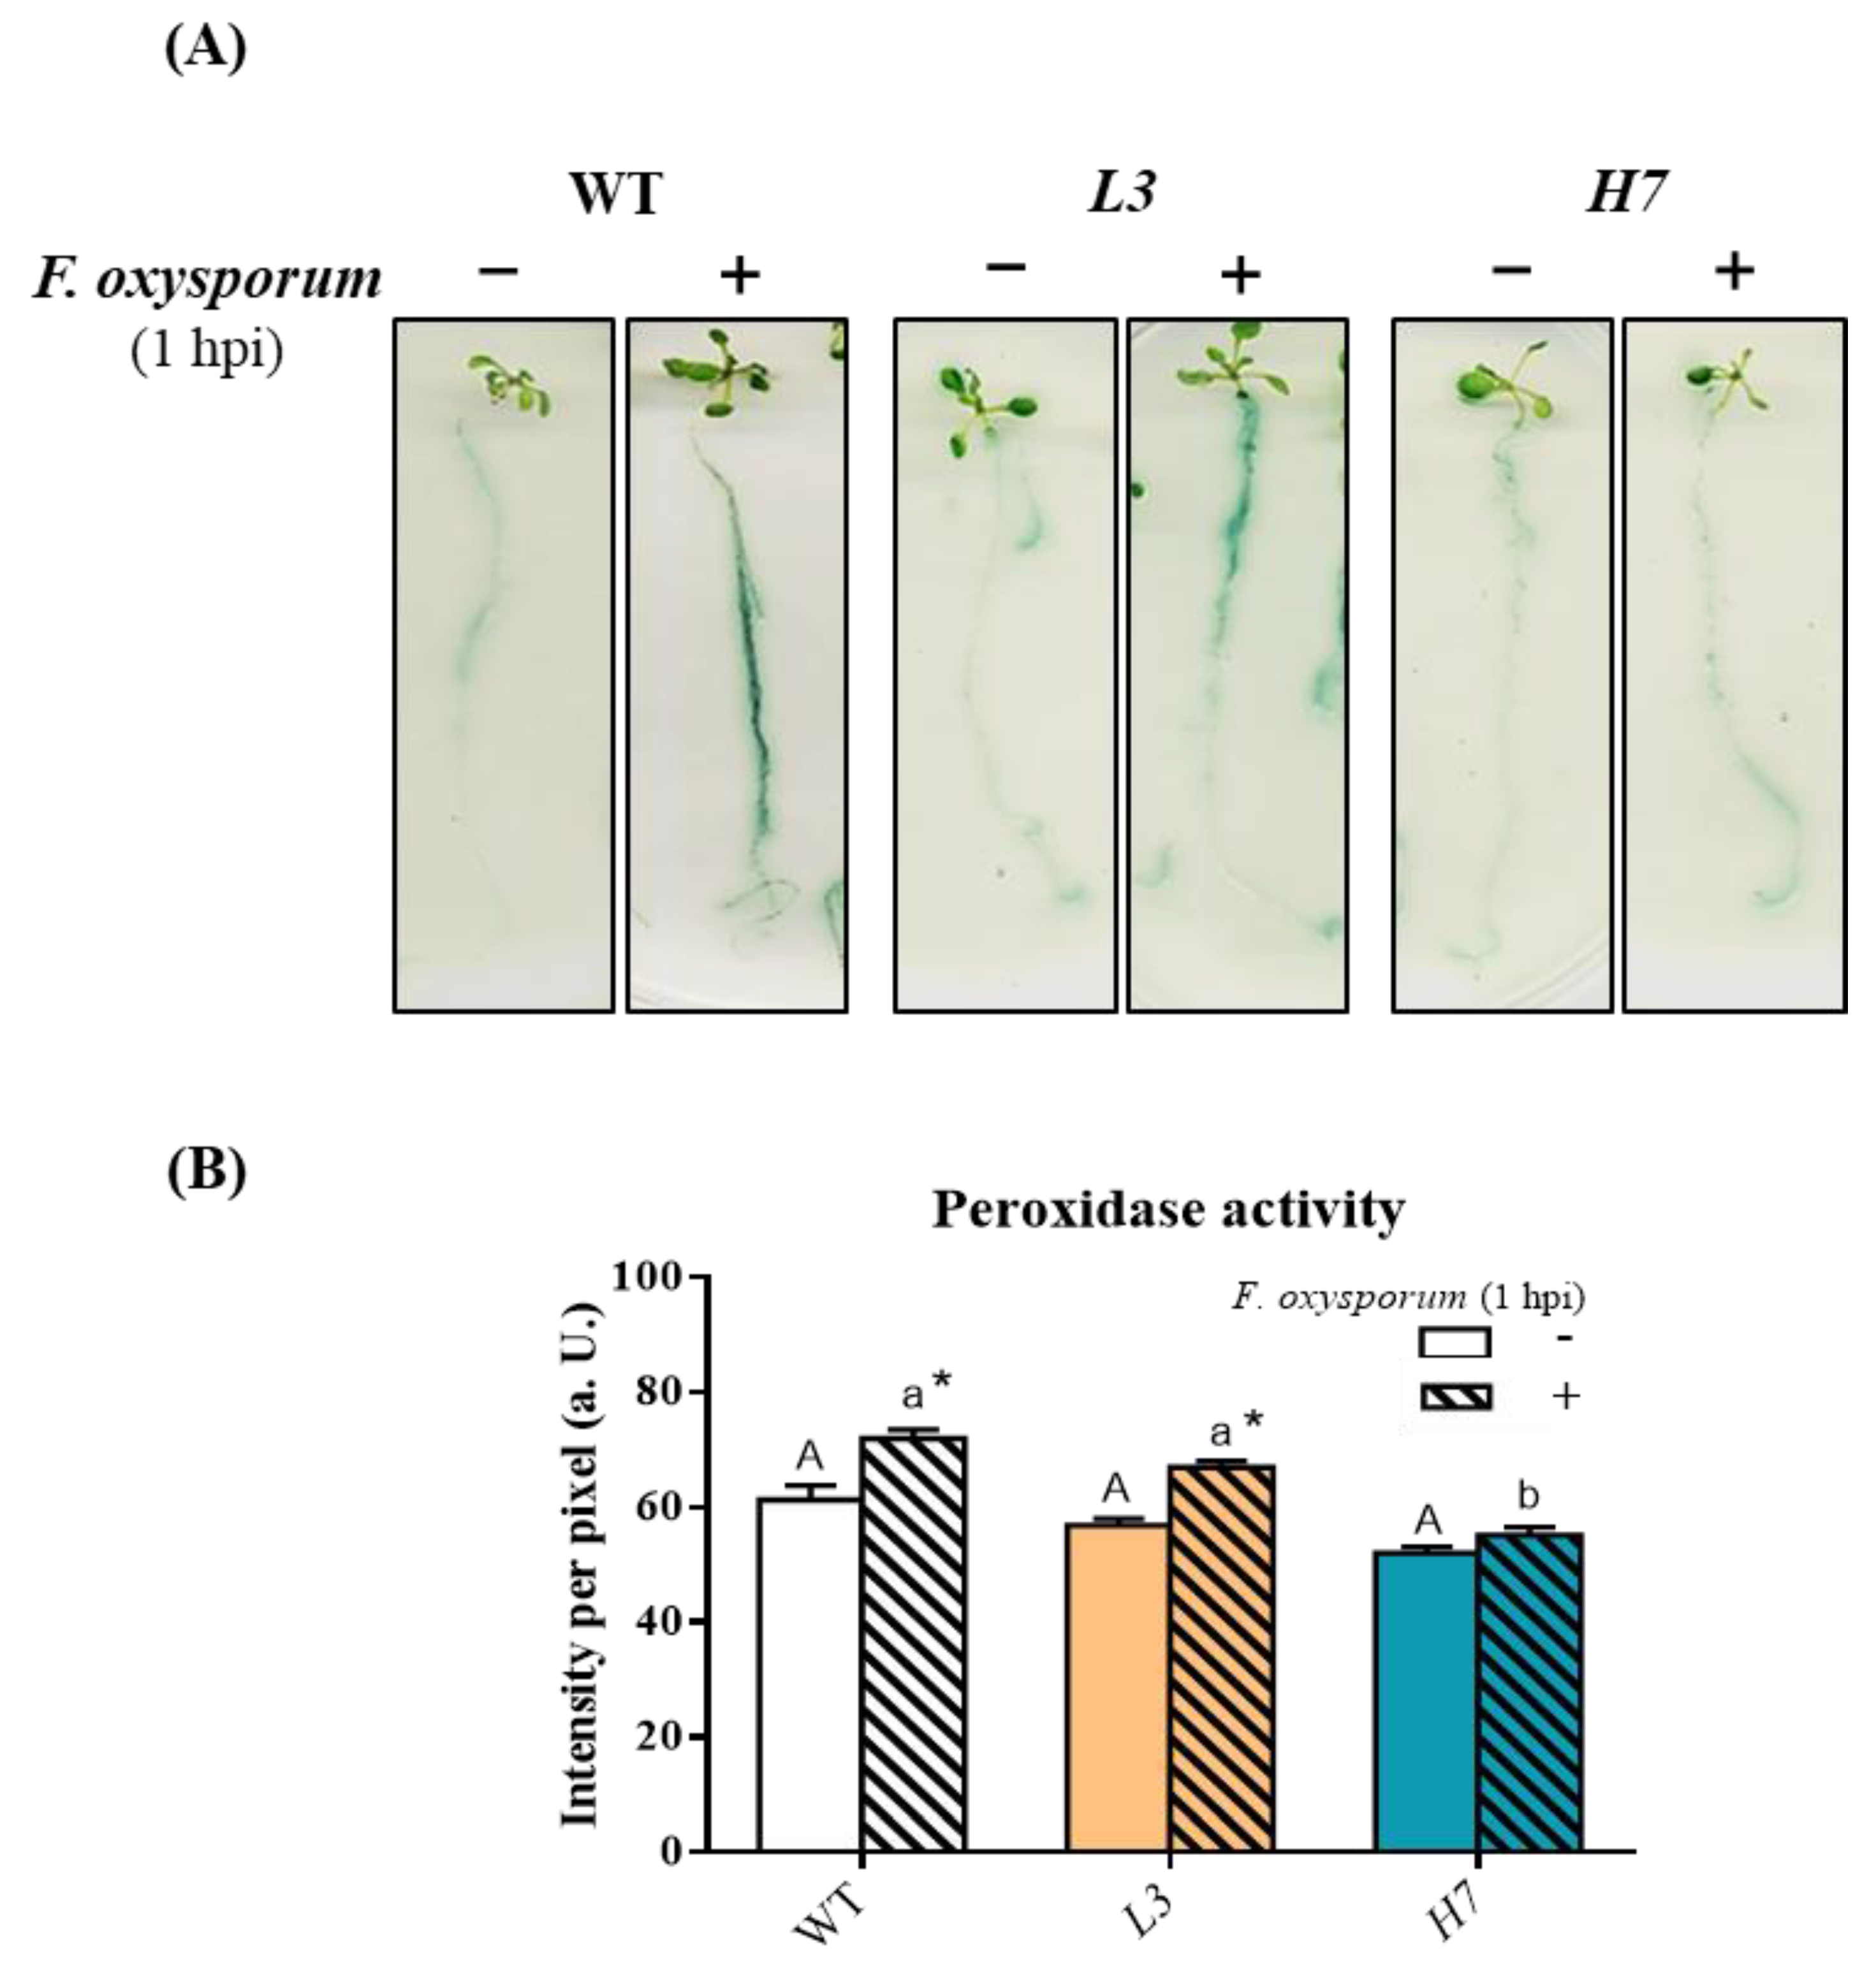
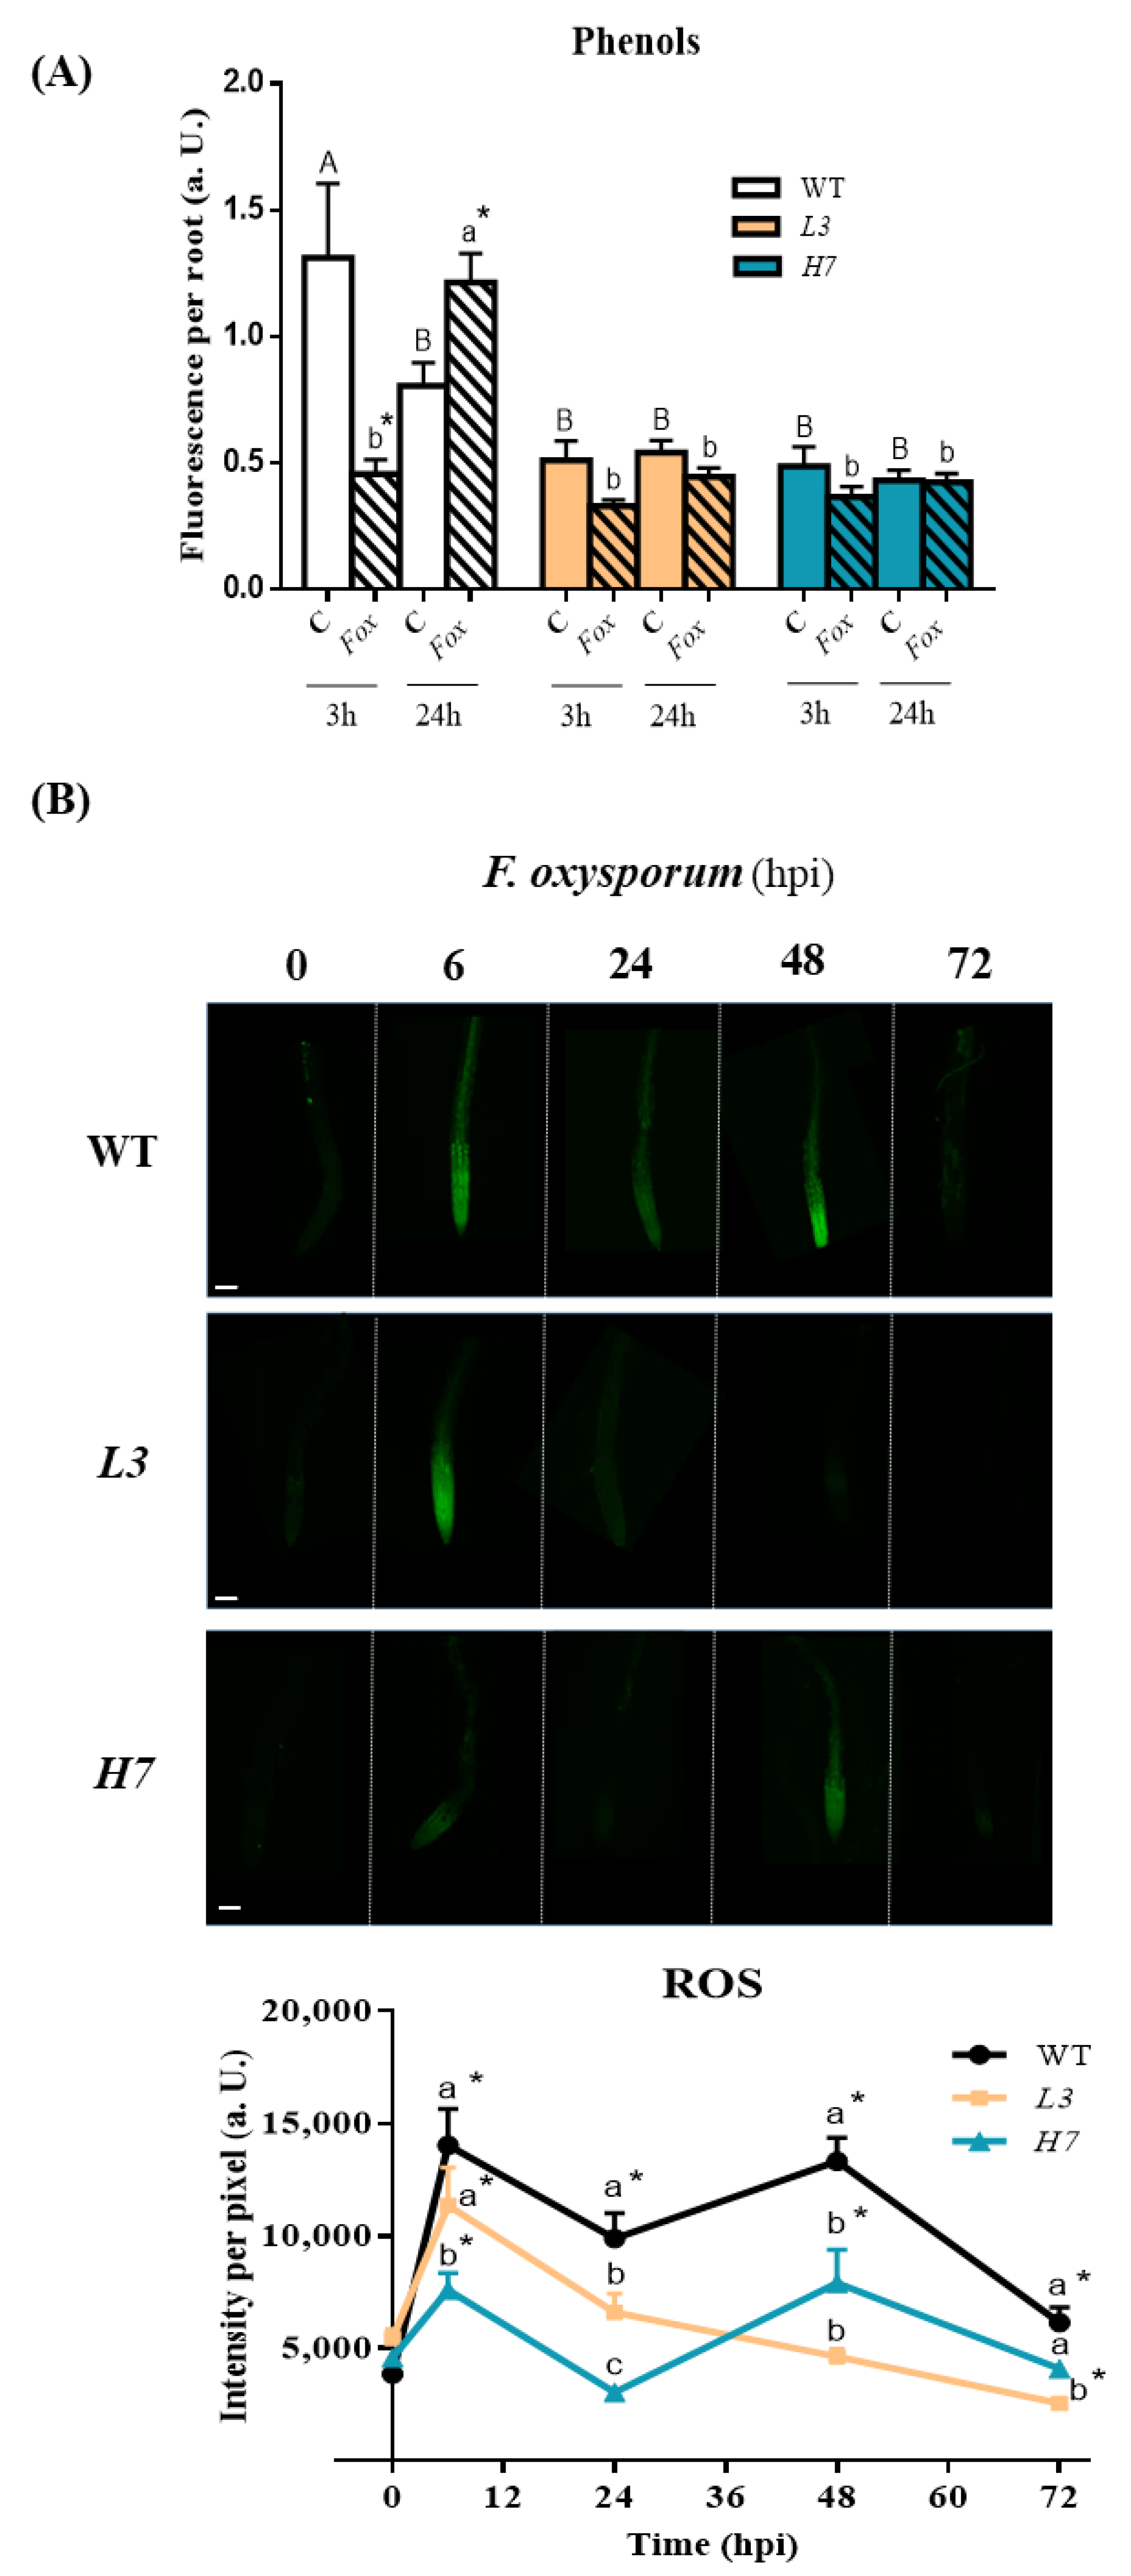
3.4. Response of Phenols and Reactive Oxygen Species in Arabidopsis to F. oxysporum
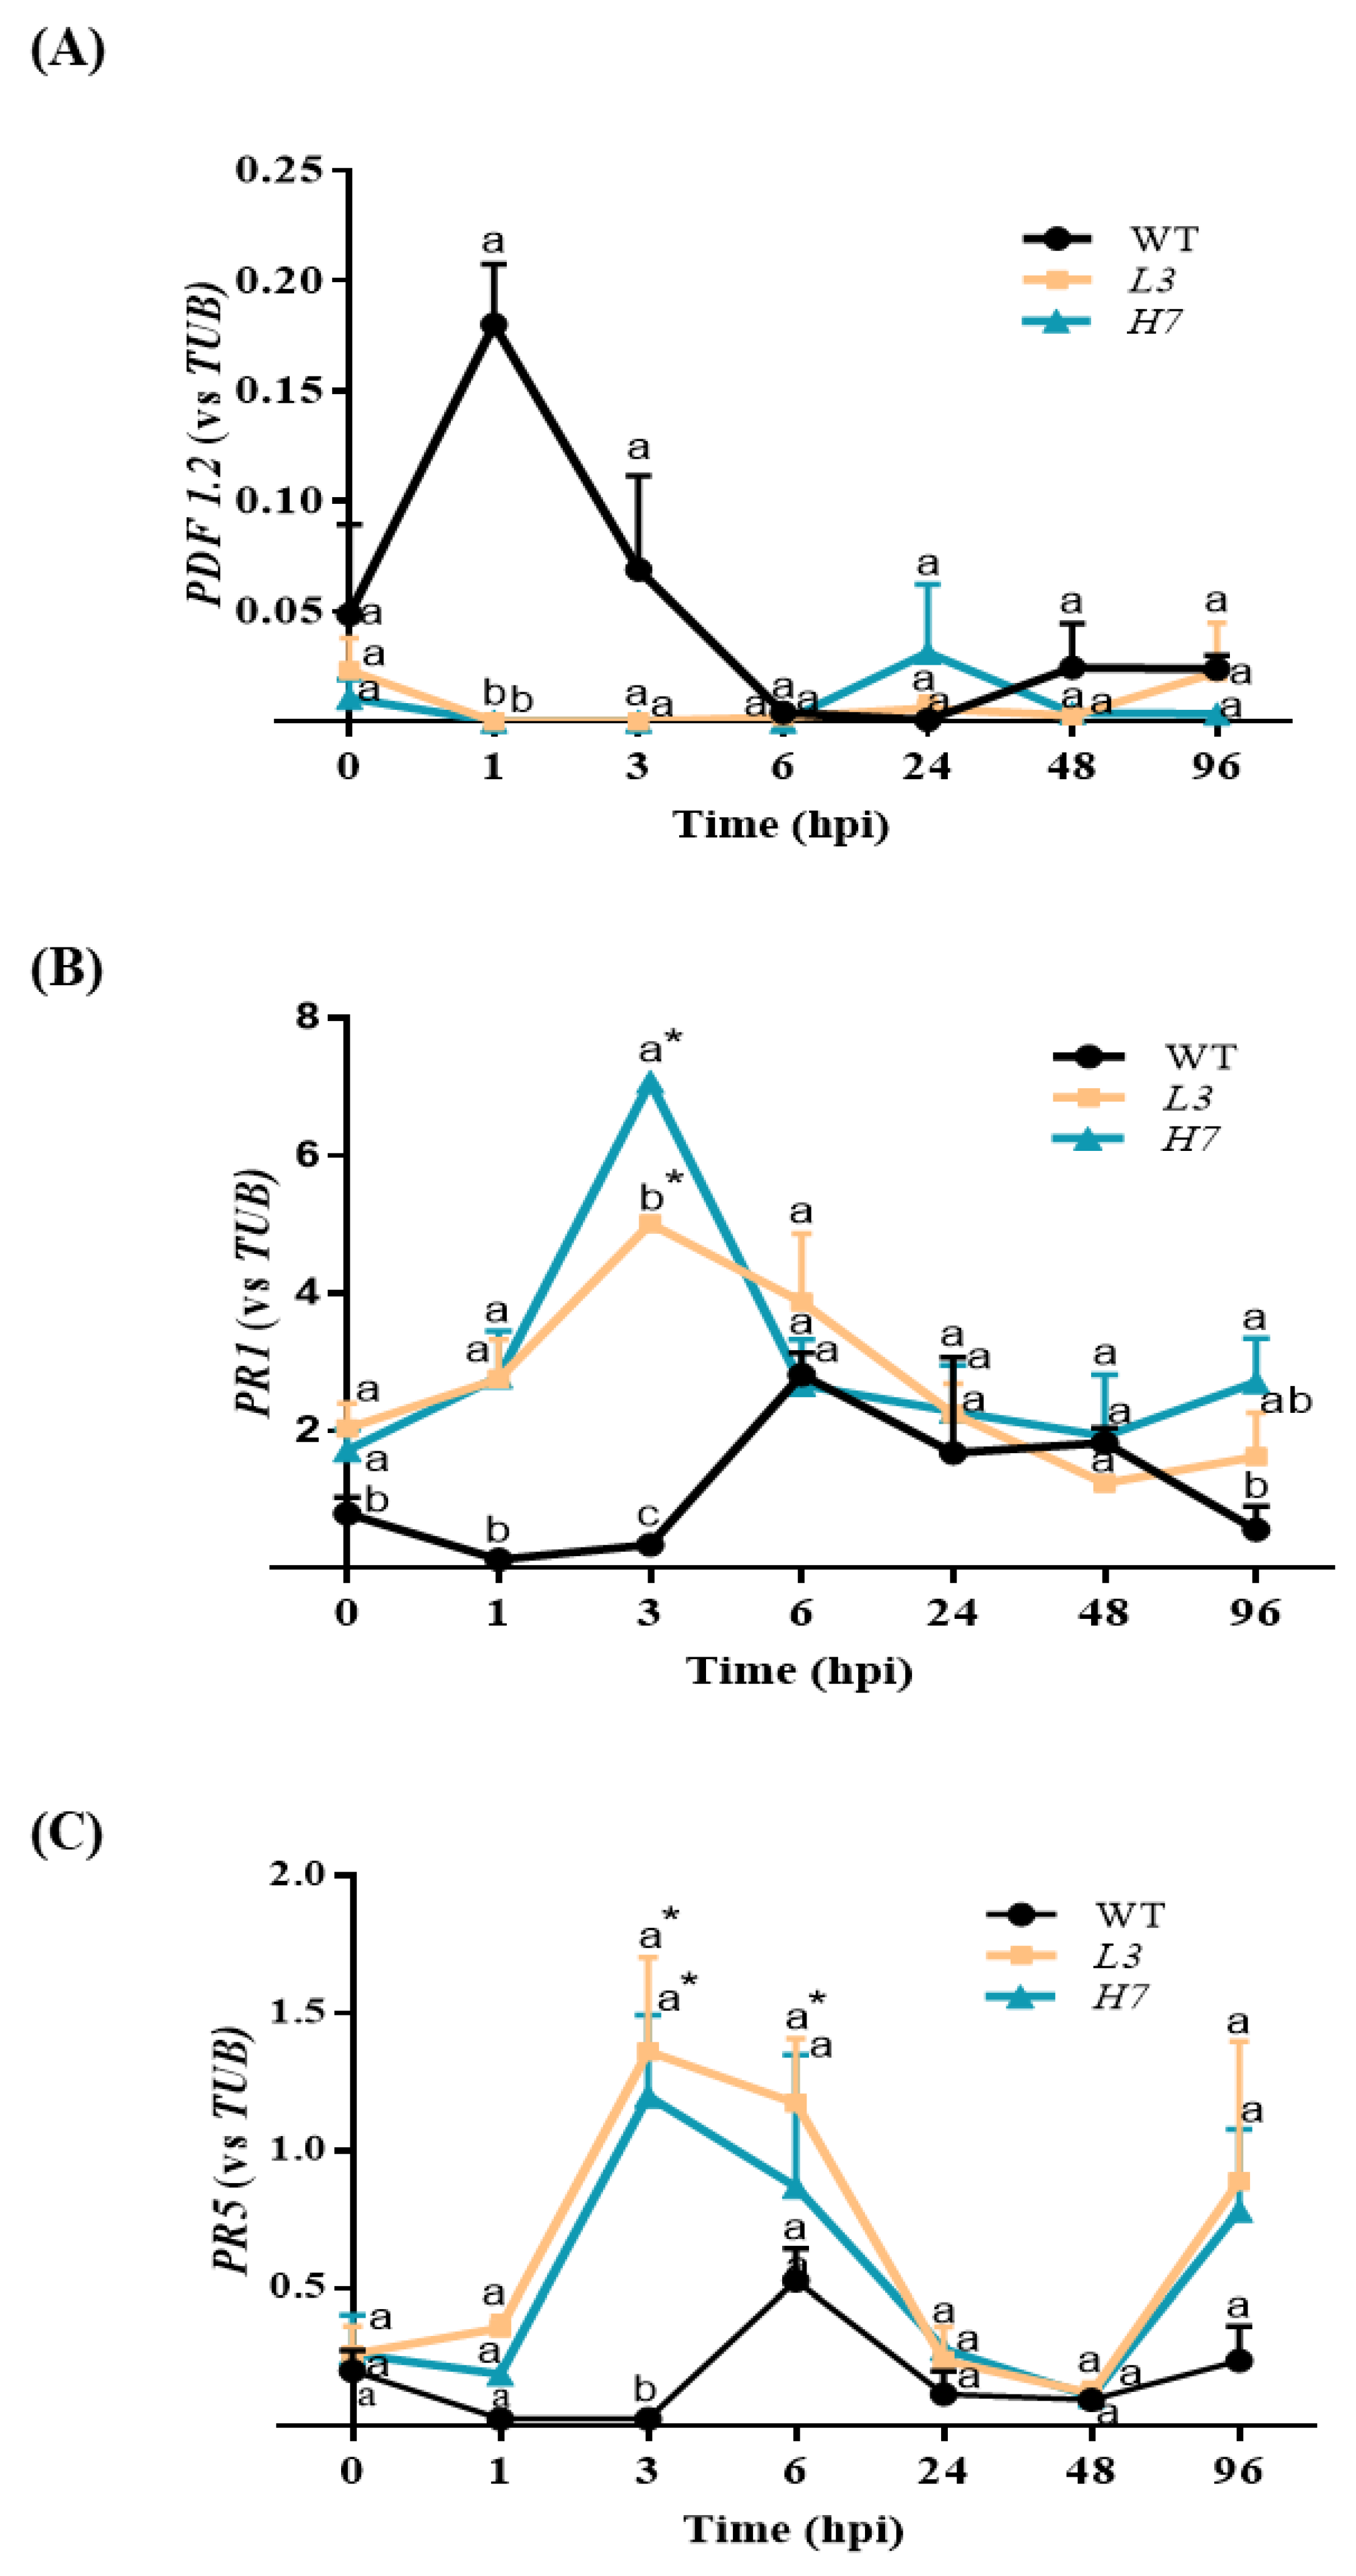
3.5. Arabidopsis Defense Response to F. oxysporum
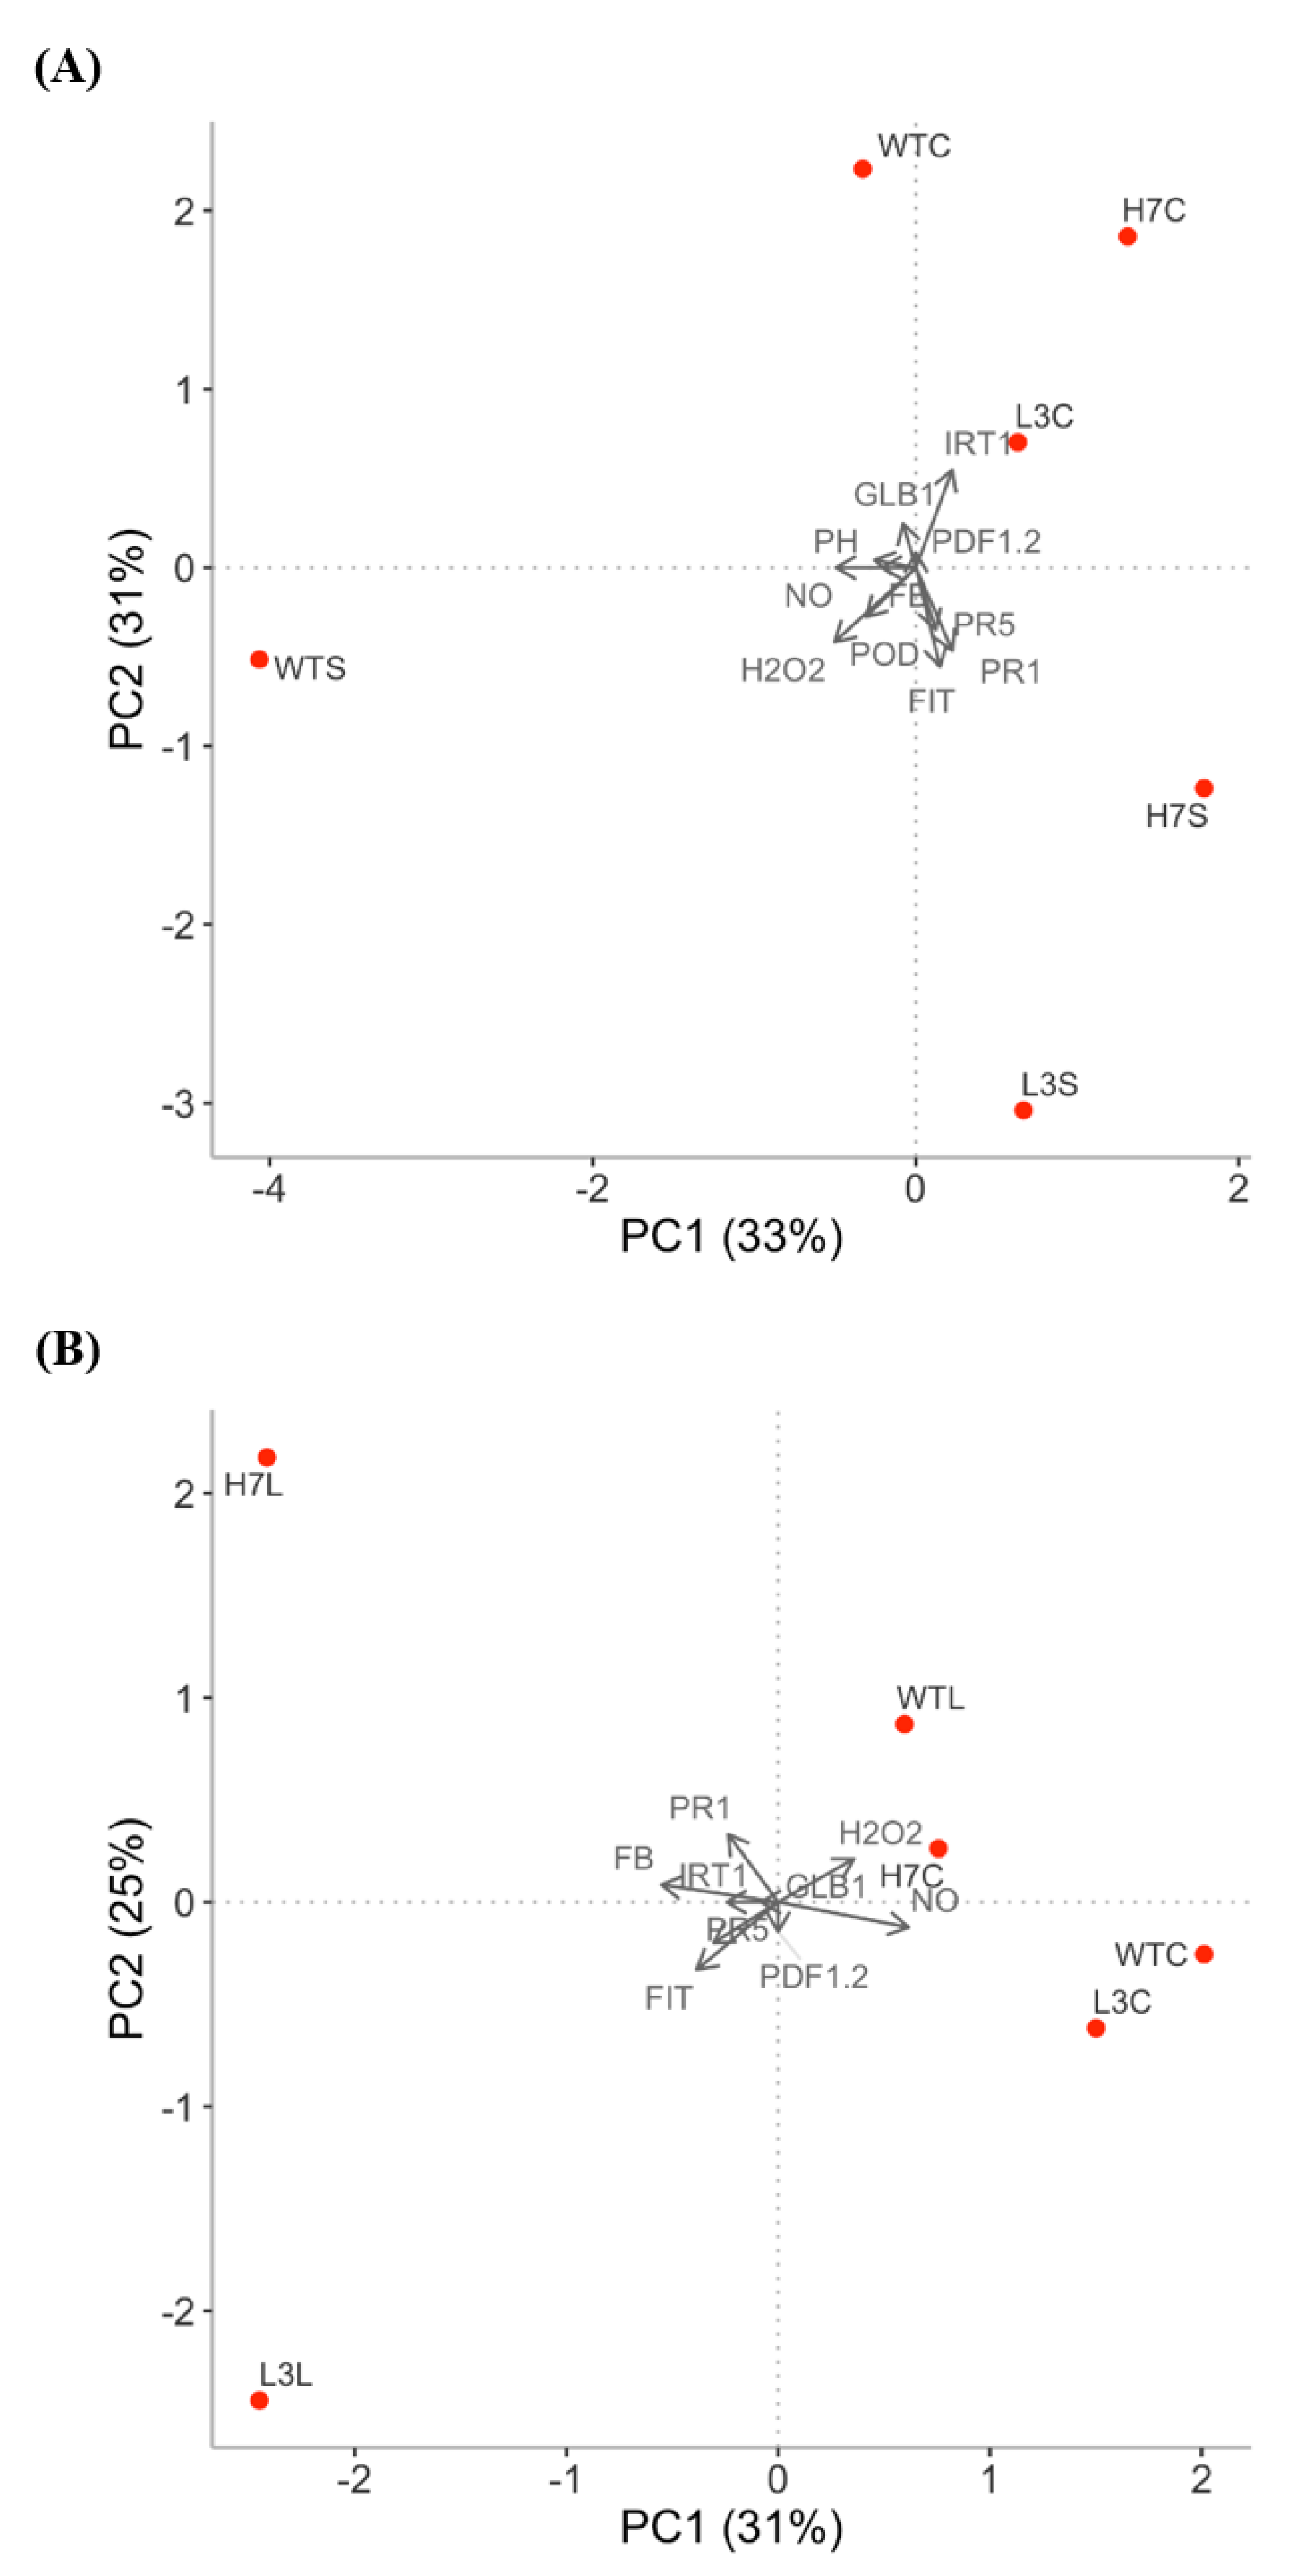
3.6. Principal Component Analysis
4. Conclusions
Supplementary Materials
Author Contributions
Funding
Institutional Review Board Statement
Informed Consent Statement
Data Availability Statement
Acknowledgments
Conflicts of Interest
References
- Masachis, S.; Segorbe, D.; Turrà, D.; Leon-Ruiz, M.; Fürst, U.; El Ghalid, M.; Leonard, G.; López-Berges, M.S.; Richards, T.A.; Felix, G.; et al. A fungal pathogen secretes plant alkalinizing peptides to increase infection. Nat. Microbiol. 2016, 1, 16043. [Google Scholar] [CrossRef] [PubMed]
- Martínez-Medina, A.; Pescador, L.; Terrón-Camero, L.C.; Pozo, M.J.; Romero-Puertas, M.C. Nitric oxide in plant-fungal interactions. J. Exp. Bot. 2019, 70, 4489–4503. [Google Scholar] [CrossRef] [PubMed]
- Dean, R.; Van Kan, J.A.L.; Pretorius, Z.A.; Hammond-Kosack, K.E.; Di Pietro, A.; Spanu, P.D.; Rudd, J.J.; Dickman, M.; Kahmann, R.; Ellis, J.; et al. The Top 10 fungal pathogens in molecular plant pathology. Mol. Plant Pathol. 2012, 13, 414–430. [Google Scholar] [CrossRef] [PubMed] [Green Version]
- Berrocal-Lobo, M.; Molina, A. Arabidopsis defense response against Fusarium oxysporum. Trends Plant Sci. 2008, 13, 145–150. [Google Scholar] [CrossRef] [PubMed]
- Turrà, D.; El Ghalid, M.; Rossi, F.; Di Pietro, A. Fungal pathogen uses sex pheromone receptor for chemotropic sensing of host plant signals. Nature 2015, 527, 521–524. [Google Scholar] [CrossRef]
- Gupta, K.J.; Mur, L.A.J.; Brotman, Y. Trichoderma asperelloides suppresses nitric oxide generation elicited by Fusarium Oxysporum in Arabidopsis roots. Mol. Plant Microbe Interact. 2014, 27, 307–314. [Google Scholar] [CrossRef] [Green Version]
- Martínez-Medina, A.; Pescador, L.; voández, I.; Rodríguez-Serrano, M.; García, J.M.; Romero-Puertas, M.C.; Pozo, M.J. Nitric oxide and phytoglobin PHYTOGB1 are regulatory elements in the Solanum lycopersicum—Rhizophagus Irregularis Mycorrhizal Symbiosis. New Phytol. 2019, 223, 1560–1574. [Google Scholar] [CrossRef]
- Brouquisse, R. Multifaceted roles of nitric oxide in plants. J. Exp. Bot. 2019, 70, 4319–4322. [Google Scholar] [CrossRef]
- Delledonne, M.; Xia, Y.; Dixon, R.A.; Lamb, C. Nitric oxide functions as a signal in plant disease resistance. Nature 1998, 394, 585–588. [Google Scholar] [CrossRef]
- Durner, J.; Wendehenne, D.; Klessig, D.F. Defense gene induction in tobacco by nitric oxide, cyclic GMP, and cyclic ADP-ribose. Proc. Natl. Acad. Sci. USA 1998, 95, 10328–10333. [Google Scholar] [CrossRef] [Green Version]
- Bellin, D.; Asai, S.; Delledonne, M.; Yoshioka, H. Nitric oxide as a mediator for defense responses. Mol. Plant Microbe Interact. 2013, 26, 271–277. [Google Scholar] [CrossRef] [Green Version]
- Yu, M.; Lamattina, L.; Spoel, S.H.; Loake, G.J. Nitric oxide function in plant biology: A redox cue in deconvolution. New Phytol. 2014, 202, 1142–1156. [Google Scholar] [CrossRef]
- Wendehenne, D.; Gao, Q.-M.; Kachroo, A.; Kachroo, P. Free radical-mediated systemic immunity in plants. Curr. Opin. Plant Biol. 2014, 20, 127–134. [Google Scholar] [CrossRef]
- Molina-Moya, E.; Terrón-Camero, L.C.; Pescador Azofra, L.; Sandalio, L.M.; Romero-Puertas, M.C. Reactive oxygen species and nitric oxide production, regulation and function during defense response. In Reactive Oxygen, Nitrogen and Sulfur Species in Plants: Production, Metabolism, Signaling and Defense Mechanisms; John Wiley & Sons Ltd.: Hoboken, NJ, USA, 2019. [Google Scholar] [CrossRef]
- Trapet, P.; Kulik, A.; Lamotte, O.; Jeandroz, S.; Bourque, S.; Nicolas-Francès, V.; Rosnoblet, C.; Besson-Bard, A.; Wendehenne, D. NO signaling in plant immunity: A tale of messengers. Phytochemistry 2015, 112, 72–79. [Google Scholar] [CrossRef]
- Shelef, O.; Hahn, P.G.; Getman-Pickering, Z.; Martinez Medina, A. Coming to common ground: The challenges of applying ecological theory developed aboveground to rhizosphere interactions. Front. Ecol. Evol. 2019, 7, 58. [Google Scholar] [CrossRef] [Green Version]
- VAN Baarlen, P.; Staats, M.; VAN Kan, J.A.L. Induction of programmed cell death in lily by the fungal pathogen Botrytis elliptica. Mol. Plant Pathol. 2004, 5, 559–574. [Google Scholar] [CrossRef]
- Sarkar, T.S.; Biswas, P.; Ghosh, S.K.; Ghosh, S. Nitric oxide production by necrotrophic pathogen macrophomina phaseolina and the host plant in charcoal rot disease of jute: Complexity of the interplay between necrotroph-host plant interactions. PLoS ONE 2014, 9, e107348. [Google Scholar] [CrossRef] [Green Version]
- Floryszak-Wieczorek, J.; Arasimowicz-Jelonek, M. Contrasting regulation of NO and ROS in potato defense-associated metabolism in response to pathogens of different lifestyles. PLoS ONE 2016, 11, e0163546. [Google Scholar] [CrossRef] [Green Version]
- Conrath, U.; Amoroso, G.; Köhle, H.; Sültemeyer, D.F. Non-invasive online detection of nitric oxide from plants and some other organisms by mass spectrometry. Plant J. 2004, 38, 1015–1022. [Google Scholar] [CrossRef]
- Wang, J.; Higgins, V.J. Nitric oxide has a regulatory effect in the germination of conidia of Colletotrichum coccodes. Fungal Genet. Biol. 2005, 42, 284–292. [Google Scholar] [CrossRef]
- Arasimowicz, M.; Floryszak-Wieczorek, J. Nitric oxide as a bioactive signalling molecule in plant stress responses. Plant Sci. 2007, 172, 876–887. [Google Scholar] [CrossRef]
- Turrion-Gomez, J.L.; Benito, E.P. Flux of nitric oxide between the necrotrophic pathogen Botrytis cinerea and the host plant. Mol. Plant Pathol. 2011, 12, 606–616. [Google Scholar] [CrossRef] [Green Version]
- Noorbakhsh, Z.; Taheri, P. Nitric oxide: A signaling molecule which activates cell wall-associated defense of tomato against Rhizoctonia solani. Eur. J. Plant Pathol. 2016, 144, 551–568. [Google Scholar] [CrossRef]
- Berger, A.; Guinand, S.; Boscari, A.; Puppo, A.; Brouquisse, R. Medicago Truncatula phytoglobin 1.1 controls symbiotic nodulation and nitrogen fixation via the regulation of nitric oxide concentration. New Phytol. 2020, 227, 84–98. [Google Scholar] [CrossRef] [PubMed] [Green Version]
- Becana, M.; Yruela, I.; Sarath, G.; Catalán, P.; Hargrove, M.S. Plant hemoglobins: A journey from unicellular green algae to vascular plants. New Phytol. 2020, 227, 1618–1635. [Google Scholar] [CrossRef] [Green Version]
- Perazzolli, M.; Romero-Puertas, M.C.; Delledonne, M. Modulation of nitric oxide bioactivity by plant haemoglobins. J. Exp. Bot. 2006, 57, 479–488. [Google Scholar] [CrossRef] [Green Version]
- Hill, R.D. Non-symbiotic haemoglobins-What’s happening beyond nitric oxide scavenging? AoB Plants 2012, 2012, pls004. [Google Scholar] [CrossRef] [Green Version]
- Hunt, P.W.; Klok, E.J.; Trevaskis, B.; Watts, R.A.; Ellis, M.H.; Peacock, W.J.; Dennis, E.S. Increased level of hemoglobin 1 enhances survival of hypoxic stress and promotes early growth in Arabidopsis thaliana. Proc. Natl. Acad. Sci. USA 2002, 99, 17197–17202. [Google Scholar] [CrossRef] [Green Version]
- Narsai, R.; Castleden, I.; Whelan, J. Common and Distinct Organ and Stress Responsive Transcriptomic patterns in Oryza sativa and Arabidopsis thaliana. BMC Plant Biol. 2010, 10, 262. [Google Scholar] [CrossRef] [Green Version]
- Mira, M.M.; Hill, R.D.; Stasolla, C. Phytoglobins improve hypoxic root growth by alleviating apical meristem cell death. Plant Physiol. 2016, 172, 2044–2056. [Google Scholar] [CrossRef] [Green Version]
- Qu, Z.-L.; Zhong, N.-Q.; Wang, H.-Y.; Chen, A.-P.; Jian, G.-L.; Xia, G.-X. Ectopic expression of the cotton non-symbiotic hemoglobin gene GhHbd1 triggers defense responses and increases disease tolerance in Arabidopsis. Plant Cell Physiol. 2006, 47, 1058–1068. [Google Scholar] [CrossRef]
- Maassen, A.; Hennig, J. Effect of Medicago sativa Mhb1gene expression on defense response of Arabidopsis thaliana plants. Acta Biochim. Pol. 2011, 58, 427–432. [Google Scholar] [CrossRef] [Green Version]
- Mur, L.A.J.; Sivakumaran, A.; Mandon, J.; Cristescu, S.M.; Harren, F.J.M.; Hebelstrup, K.H. Haemoglobin modulates salicylate and jasmonate/ethylene-mediated resistance mechanisms against pathogens. J. Exp. Bot. 2012, 63, 4375–4387. [Google Scholar] [CrossRef] [Green Version]
- Igamberdiev, A.U.; Stasolla, C.; Hill, R.D. Low oxygen stress, nonsymbiotic hemoglobins, NO, and programmed cell death. In Low-Oxygen Stress in Plants: Oxygen Sensing and Adaptive Responses to Hypoxia; van Dongen, J.T., Licausi, F., Eds.; Plant Cell Monographs; Springer: Vienna, Austria, 2014; pp. 41–58. ISBN 978-3-7091-1254-0. [Google Scholar]
- Mira, M.; Hill, R.D.; Stasolla, C. Regulation of programmed cell death by phytoglobins. J. Exp. Bot. 2016, 67, 5901–5908. [Google Scholar] [CrossRef] [Green Version]
- Perazzolli, M.; Dominici, P.; Romero-Puertas, M.C.; Zago, E.; Zeier, J.; Sonoda, M.; Lamb, C.; Delledonne, M. Arabidopsis nonsymbiotic hemoglobin AHb1 modulates nitric oxide bioactivity. Plant Cell 2004, 16, 2785–2794. [Google Scholar] [CrossRef]
- Bustos-Sanmamed, P.; Tovar-Méndez, A.; Crespi, M.; Sato, S.; Tabata, S.; Becana, M. Regulation of Nonsymbiotic and truncated hemoglobin genes of Lotus japonicus in plant organs and in response to nitric oxide and hormones. New Phytol. 2011, 189, 765–776. [Google Scholar] [CrossRef] [Green Version]
- Bai, X.; Long, J.; He, X.; Yan, J.; Chen, X.; Tan, Y.; Li, K.; Chen, L.; Xu, H. Overexpression of spinach non-symbiotic hemoglobin in Arabidopsis resulted in decreased no content and lowered nitrate and other abiotic stresses tolerance. Sci. Rep. 2016, 6, 26400. [Google Scholar] [CrossRef] [Green Version]
- Shimoda, Y.; Shimoda-Sasakura, F.; Kucho, K.; Kanamori, N.; Nagata, M.; Suzuki, A.; Abe, M.; Higashi, S.; Uchiumi, T. Overexpression of Class 1 plant hemoglobin genes enhances symbiotic nitrogen fixation activity between Mesorhizobium loti and Lotus japonicus. Plant J. 2009, 57, 254–263. [Google Scholar] [CrossRef]
- Fukudome, M.; Calvo-Begueria, L.; Kado, T.; Osuki, K.-I.; Rubio, M.C.; Murakami, E.-I.; Nagata, M.; Kucho, K.-I.; Sandal, N.; Stougaard, J.; et al. Hemoglobin LjGlb1-1 Is Involved in Nodulation and Regulates the Level of Nitric Oxide in the Lotus Japonicus-Mesorhizobium Loti Symbiosis. J. Exp. Bot. 2016, 67, 5275–5283. [Google Scholar] [CrossRef] [Green Version]
- Hou, S.; Wang, X.; Chen, D.; Yang, X.; Wang, M.; Turrà, D.; Di Pietro, A.; Zhang, W. The secreted peptide PIP1 amplifies immunity through receptor-like kinase 7. PLoS Pathog. 2014, 10, e1004331. [Google Scholar] [CrossRef] [Green Version]
- Di Pietro, A.; García-Maceira, F.I.; Méglecz, E.; Roncero, M.I.G. A MAP kinase of the vascular wilt fungus Fusarium oxysporum is essential for root penetration and pathogenesis. Mol. Microbiol. 2004, 39, 1140–1152. [Google Scholar] [CrossRef]
- Turrà, D.; Nordzieke, D.; Vitale, S.; El Ghalid, M.; Di Pietro, A. Hyphal chemotropism in fungal pathogenicity. Semin. Cell Dev. Biol. 2016, 57, 69–75. [Google Scholar] [CrossRef] [PubMed]
- Hoagland, D.R.; Arnon, D.I. The water-culture method for growing plants without soil. Circular. Calif. Agric. Exp. Stn. 1950, 347, 32. [Google Scholar]
- Gámez-Arjona, F.M.; Vitale, S.; Voxeur, A.; Dora, S.; Müller, S.; Sancho-Andrés, G.; Montesinos, J.C.; Di Pietro, A.; Sánchez-Rodríguez, C. Impairment of the cellulose degradation machinery enhances Fusarium oxysporum virulence but limits its reproductive fitness. Sci. Adv. 2022, 8, eabl9734. [Google Scholar] [CrossRef] [PubMed]
- Rodríguez-Serrano, M.; Romero-Puertas, M.C.; Sanz-Fernández, M.; Hu, J.; Sandalio, L.M. Peroxisomes extend peroxules in a fast response to stress via a reactive oxygen species-mediated induction of the peroxin PEX11a. Plant Physiol. 2016, 171, 1665–1674. [Google Scholar] [CrossRef] [Green Version]
- Bustin, S.A.; Benes, V.; Garson, J.A.; Hellemans, J.; Huggett, J.; Kubista, M.; Mueller, R.; Nolan, T.; Pfaffl, M.W.; Shipley, G.L.; et al. The MIQE guidelines: Minimum information for publication of quantitative real-time PCR Experiments. Clin. Chem. 2009, 55, 611–622. [Google Scholar] [CrossRef] [Green Version]
- Pfaffl, M.W. A new mathematical model for relative quantification in real-time RT-PCR. Nucleic Acids Res. 2001, 29, e45. [Google Scholar] [CrossRef]
- Raeder, U.; Broda, P. Rapid preparation of DNA from filamentous fungi. Lett. Appl. Microbiol. 1985, 1, 17–20. [Google Scholar] [CrossRef]
- Terrón-Camero, L.C.; Molina-Moya, E.; Sanz-Fernández, M.; Sandalio, L.M.; Romero-Puertas, M.C. Detection of reactive oxygen and nitrogen species (ROS/RNS) during hypersensitive cell Death. Methods Mol. Biol. 2018, 1743, 97–105. [Google Scholar] [CrossRef]
- Terrón-Camero, L.C.; Del Val, C.; Sandalio, L.M.; Romero-Puertas, M.C. Low endogenous NO levels in roots and antioxidant systems are determinants for the resistance of Arabidopsis seedlings grown in Cd. Environ. Pollut. 2020, 256, 113411. [Google Scholar] [CrossRef]
- Schmidt, W.; Tittel, J.; Schikora, A. Role of hormones in the induction of iron deficiency responses in Arabidopsis roots. Plant Physiol. 2000, 122, 1109–1118. [Google Scholar] [CrossRef] [Green Version]
- Martínez-Medina, A.; Van Wees, S.C.M.; Pieterse, C.M.J. Airborne signals from trichoderma fungi stimulate iron uptake responses in roots resulting in priming of jasmonic acid-dependent defences in shoots of Arabidopsis thaliana and Solanum lycopersicum. Plant Cell Environ. 2017, 40, 2691–2705. [Google Scholar] [CrossRef] [Green Version]
- Berendsen, R.L.; Pieterse, C.M.J.; Bakker, P.A.H.M. The rhizosphere microbiome and plant health. Trends Plant Sci. 2012, 17, 478–486. [Google Scholar] [CrossRef]
- Stringlis, I.A.; Yu, K.; Feussner, K.; de Jonge, R.; Van Bentum, S.; Van Verk, M.C.; Berendsen, R.L.; Bakker, P.A.H.M.; Feussner, I.; Pieterse, C.M.J. MYB72-dependent coumarin exudation shapes root microbiome assembly to promote plant health. Proc. Natl. Acad. Sci. USA 2018, 115, E5213–E5222. [Google Scholar] [CrossRef] [Green Version]
- Espinosa, F.; Garrido, I.; Ortega, A.; Casimiro, I.; Álvarez-Tinaut, M.C. Redox activities and ROS, NO and phenylpropanoids production by axenically cultured intact olive seedling roots after interaction with a mycorrhizal or a pathogenic fungus. PLoS ONE 2014, 9, e100132. [Google Scholar] [CrossRef] [Green Version]
- Wang, J.W.; Wu, J.Y. Involvement of nitric oxide in elicitor-induced defense responses and secondary metabolism of Taxus chinensis Cells. Nitric Oxide 2004, 11, 298–306. [Google Scholar] [CrossRef]
- Srivastava, N.; Gonugunta, V.K.; Puli, M.R.; Raghavendra, A.S. Nitric oxide production occurs downstream of reactive oxygen species in guard cells during stomatal closure induced by chitosan in abaxial epidermis of Pisum sativum. Planta 2009, 229, 757–765. [Google Scholar] [CrossRef]
- Seregélyes, C.; Barna, B.; Hennig, J.; Konopka, D.; Pasternak, T.P.; Lukács, N.; Fehér, A.; Horváth, G.V.; Dudits, D. Phytoglobins can interfere with nitric oxide functions during plant growth and pathogenic responses: A transgenic approach. Plant Sci. 2003, 165, 541–550. [Google Scholar] [CrossRef]
- Hebelstrup, K.H.; Shah, J.K.; Simpson, C.; Schjoerring, J.K.; Mandon, J.; Cristescu, S.M.; Harren, F.J.M.; Christiansen, M.W.; Mur, L.A.J.; Igamberdiev, A.U. An assessment of the biotechnological use of hemoglobin modulation in cereals. Physiol. Plant 2014, 150, 593–603. [Google Scholar] [CrossRef]
- Basso, M.F.; Lourenço-Tessutti, I.T.; Moreira-Pinto, C.E.; Mendes, R.A.G.; Paes-de-Melo, B.; das Neves, M.R.; Macedo, A.F.; Figueiredo, V.; Grandis, A.; Macedo, L.L.P.; et al. Overexpression of a Soybean globin (GmGlb1-1) gene reduces plant susceptibility to Meloidogyne incognita. Planta 2022, 256, 83. [Google Scholar] [CrossRef]
- Verbon, E.H.; Trapet, P.L.; Stringlis, I.A.; Kruijs, S.; Bakker, P.A.H.M.; Pieterse, C.M.J. Iron and immunity. Annu. Rev. Phytopathol. 2017, 55, 355–375. [Google Scholar] [CrossRef] [PubMed]
- Yi, Y.; Guerinot, M.L. Genetic evidence that induction of root fe(iii) chelate reductase activity is necessary for iron uptake under iron deficiency. Plant J. 1996, 10, 835–844. [Google Scholar] [CrossRef] [PubMed]
- Zhang, J.; Buegger, F.; Albert, A.; Ghirardo, A.; Winkler, B.; Schnitzler, J.-P.; Hebelstrup, K.H.; Durner, J.; Lindermayr, C. Phytoglobin overexpression promotes barley growth in the presence of enhanced level of atmospheric nitric oxide. J. Exp. Bot. 2019, 70, 4521–4537. [Google Scholar] [CrossRef] [PubMed] [Green Version]
- Colangelo, E.P.; Guerinot, M.L. The essential basic helix-loop-helix protein FIT1 is required for the iron deficiency response. Plant Cell 2004, 16, 3400–3412. [Google Scholar] [CrossRef] [Green Version]
- Meiser, J.; Lingam, S.; Bauer, P. Posttranslational regulation of the iron deficiency basic helix-loop-helix transcription factor FIT is affected by iron and nitric oxide. Plant Physiol. 2011, 157, 2154–2166. [Google Scholar] [CrossRef] [Green Version]
- García, M.J.; Lucena, C.; Romera, F.J.; Alcántara, E.; Pérez-Vicente, R. Ethylene and nitric oxide involvement in the up-regulation of key genes related to iron acquisition and homeostasis in Arabidopsis. J. Exp. Bot. 2010, 61, 3885–3899. [Google Scholar] [CrossRef]
- Shen, C.; Yang, Y.; Liu, K.; Zhang, L.; Guo, H.; Sun, T.; Wang, H. Involvement of endogenous salicylic acid in iron-deficiency responses in Arabidopsis. J. Exp. Bot. 2016, 67, 4179–4193. [Google Scholar] [CrossRef] [Green Version]
- Cui, Y.; Chen, C.-L.; Cui, M.; Zhou, W.-J.; Wu, H.-L.; Ling, H.-Q. Four IVa BHLH Transcription factors are novel interactors of FIT and mediate ja inhibition of iron uptake in Arabidopsis. Mol. Plant 2018, 11, 1166–1183. [Google Scholar] [CrossRef] [Green Version]
- Lanoue, A.; Burlat, V.; Henkes, G.J.; Koch, I.; Schurr, U.; Röse, U.S.R. De novo biosynthesis of defense root exudates in response to Fusarium attack in barley. New Phytol. 2010, 185, 577–588. [Google Scholar] [CrossRef]
- Heller, J.; Tudzynski, P. Reactive oxygen species in phytopathogenic fungi: Signaling, development, and disease. Annu. Rev. Phytopathol. 2011, 49, 369–390. [Google Scholar] [CrossRef]
- Igamberdiev, A.U.; Bykova, N.V.; Hill, R.D. Nitric oxide scavenging by barley hemoglobin is facilitated by a monodehydroascorbate reductase-mediated ascorbate reduction of methemoglobin. Planta 2006, 223, 1033–1040. [Google Scholar] [CrossRef]
- Fukudome, M.; Watanabe, E.; Osuki, K.; Uchi, N.; Uchiumi, T. Ectopic or over-expression of Class 1 phytoglobin genes confers flooding tolerance to the root nodules of Lotus Japonicus by scavenging nitric oxide. Antioxidants 2019, 8, 206. [Google Scholar] [CrossRef] [Green Version]
- Bahmani, R.; Kim, D.; Na, J.; Hwang, S. Expression of the tobacco non-symbiotic Class 1 hemoglobin gene Hb1 reduces cadmium levels by modulating Cd transporter expression through decreasing nitric oxide and ROS level in Arabidopsis. Front. Plant Sci. 2019, 10, 201. [Google Scholar] [CrossRef] [Green Version]
- Chen, Y.C.; Kidd, B.N.; Carvalhais, L.C.; Schenk, P.M. Molecular defense responses in roots and the rhizosphere against Fusarium oxysporum. Plant Signal. Behav. 2014, 9, e977710. [Google Scholar] [CrossRef] [Green Version]
- Thatcher, L.F.; Cevik, V.; Grant, M.; Zhai, B.; Jones, J.D.G.; Manners, J.M.; Kazan, K. Characterization of a JAZ7 activation-tagged Arabidopsis mutant with increased susceptibility to the fungal pathogen Fusarium oxysporum. J. Exp. Bot. 2016, 67, 2367–2386. [Google Scholar] [CrossRef] [Green Version]
- Andrzejczak, O.A.; Havelund, J.F.; Wang, W.-Q.; Kovalchuk, S.; Hagensen, C.E.; Hasler-Sheetal, H.; Jensen, O.N.; Rogowska-Wrzesinska, A.; Møller, I.M.; Hebelstrup, K.H. The hypoxic proteome and metabolome of barley (Hordeum vulgare L.) with and without phytoglobin priming. Int. J. Mol. Sci. 2020, 21, 1546. [Google Scholar] [CrossRef] [Green Version]
- Hartman, S.; Liu, Z.; van Veen, H.; Vicente, J.; Reinen, E.; Martopawiro, S.; Zhang, H.; van Dongen, N.; Bosman, F.; Bassel, G.W.; et al. Ethylene-mediated nitric oxide depletion pre-adapts plants to hypoxia stress. Nat. Commun. 2019, 10, 4020. [Google Scholar] [CrossRef] [Green Version]


Disclaimer/Publisher’s Note: The statements, opinions and data contained in all publications are solely those of the individual author(s) and contributor(s) and not of MDPI and/or the editor(s). MDPI and/or the editor(s) disclaim responsibility for any injury to people or property resulting from any ideas, methods, instructions or products referred to in the content. |
© 2023 by the authors. Licensee MDPI, Basel, Switzerland. This article is an open access article distributed under the terms and conditions of the Creative Commons Attribution (CC BY) license (https://creativecommons.org/licenses/by/4.0/).
Share and Cite
Terrón-Camero, L.C.; Molina-Moya, E.; Peláez-Vico, M.Á.; Sandalio, L.M.; Romero-Puertas, M.C. Nitric Oxide and Globin Glb1 Regulate Fusarium oxysporum Infection of Arabidopsis thaliana. Antioxidants 2023, 12, 1321. https://doi.org/10.3390/antiox12071321
Terrón-Camero LC, Molina-Moya E, Peláez-Vico MÁ, Sandalio LM, Romero-Puertas MC. Nitric Oxide and Globin Glb1 Regulate Fusarium oxysporum Infection of Arabidopsis thaliana. Antioxidants. 2023; 12(7):1321. https://doi.org/10.3390/antiox12071321
Chicago/Turabian StyleTerrón-Camero, Laura C., Eliana Molina-Moya, M Ángeles Peláez-Vico, Luisa M. Sandalio, and María C. Romero-Puertas. 2023. "Nitric Oxide and Globin Glb1 Regulate Fusarium oxysporum Infection of Arabidopsis thaliana" Antioxidants 12, no. 7: 1321. https://doi.org/10.3390/antiox12071321