
Manipulation of HSP70-SOD1 Expression Modulates SH-SY5Y Differentiation and Susceptibility to Oxidative Stress-Dependent Cell Damage: Involvement in Oxotremorine-M-Mediated Neuroprotective Effects
 , ,
, ,  , and
, and 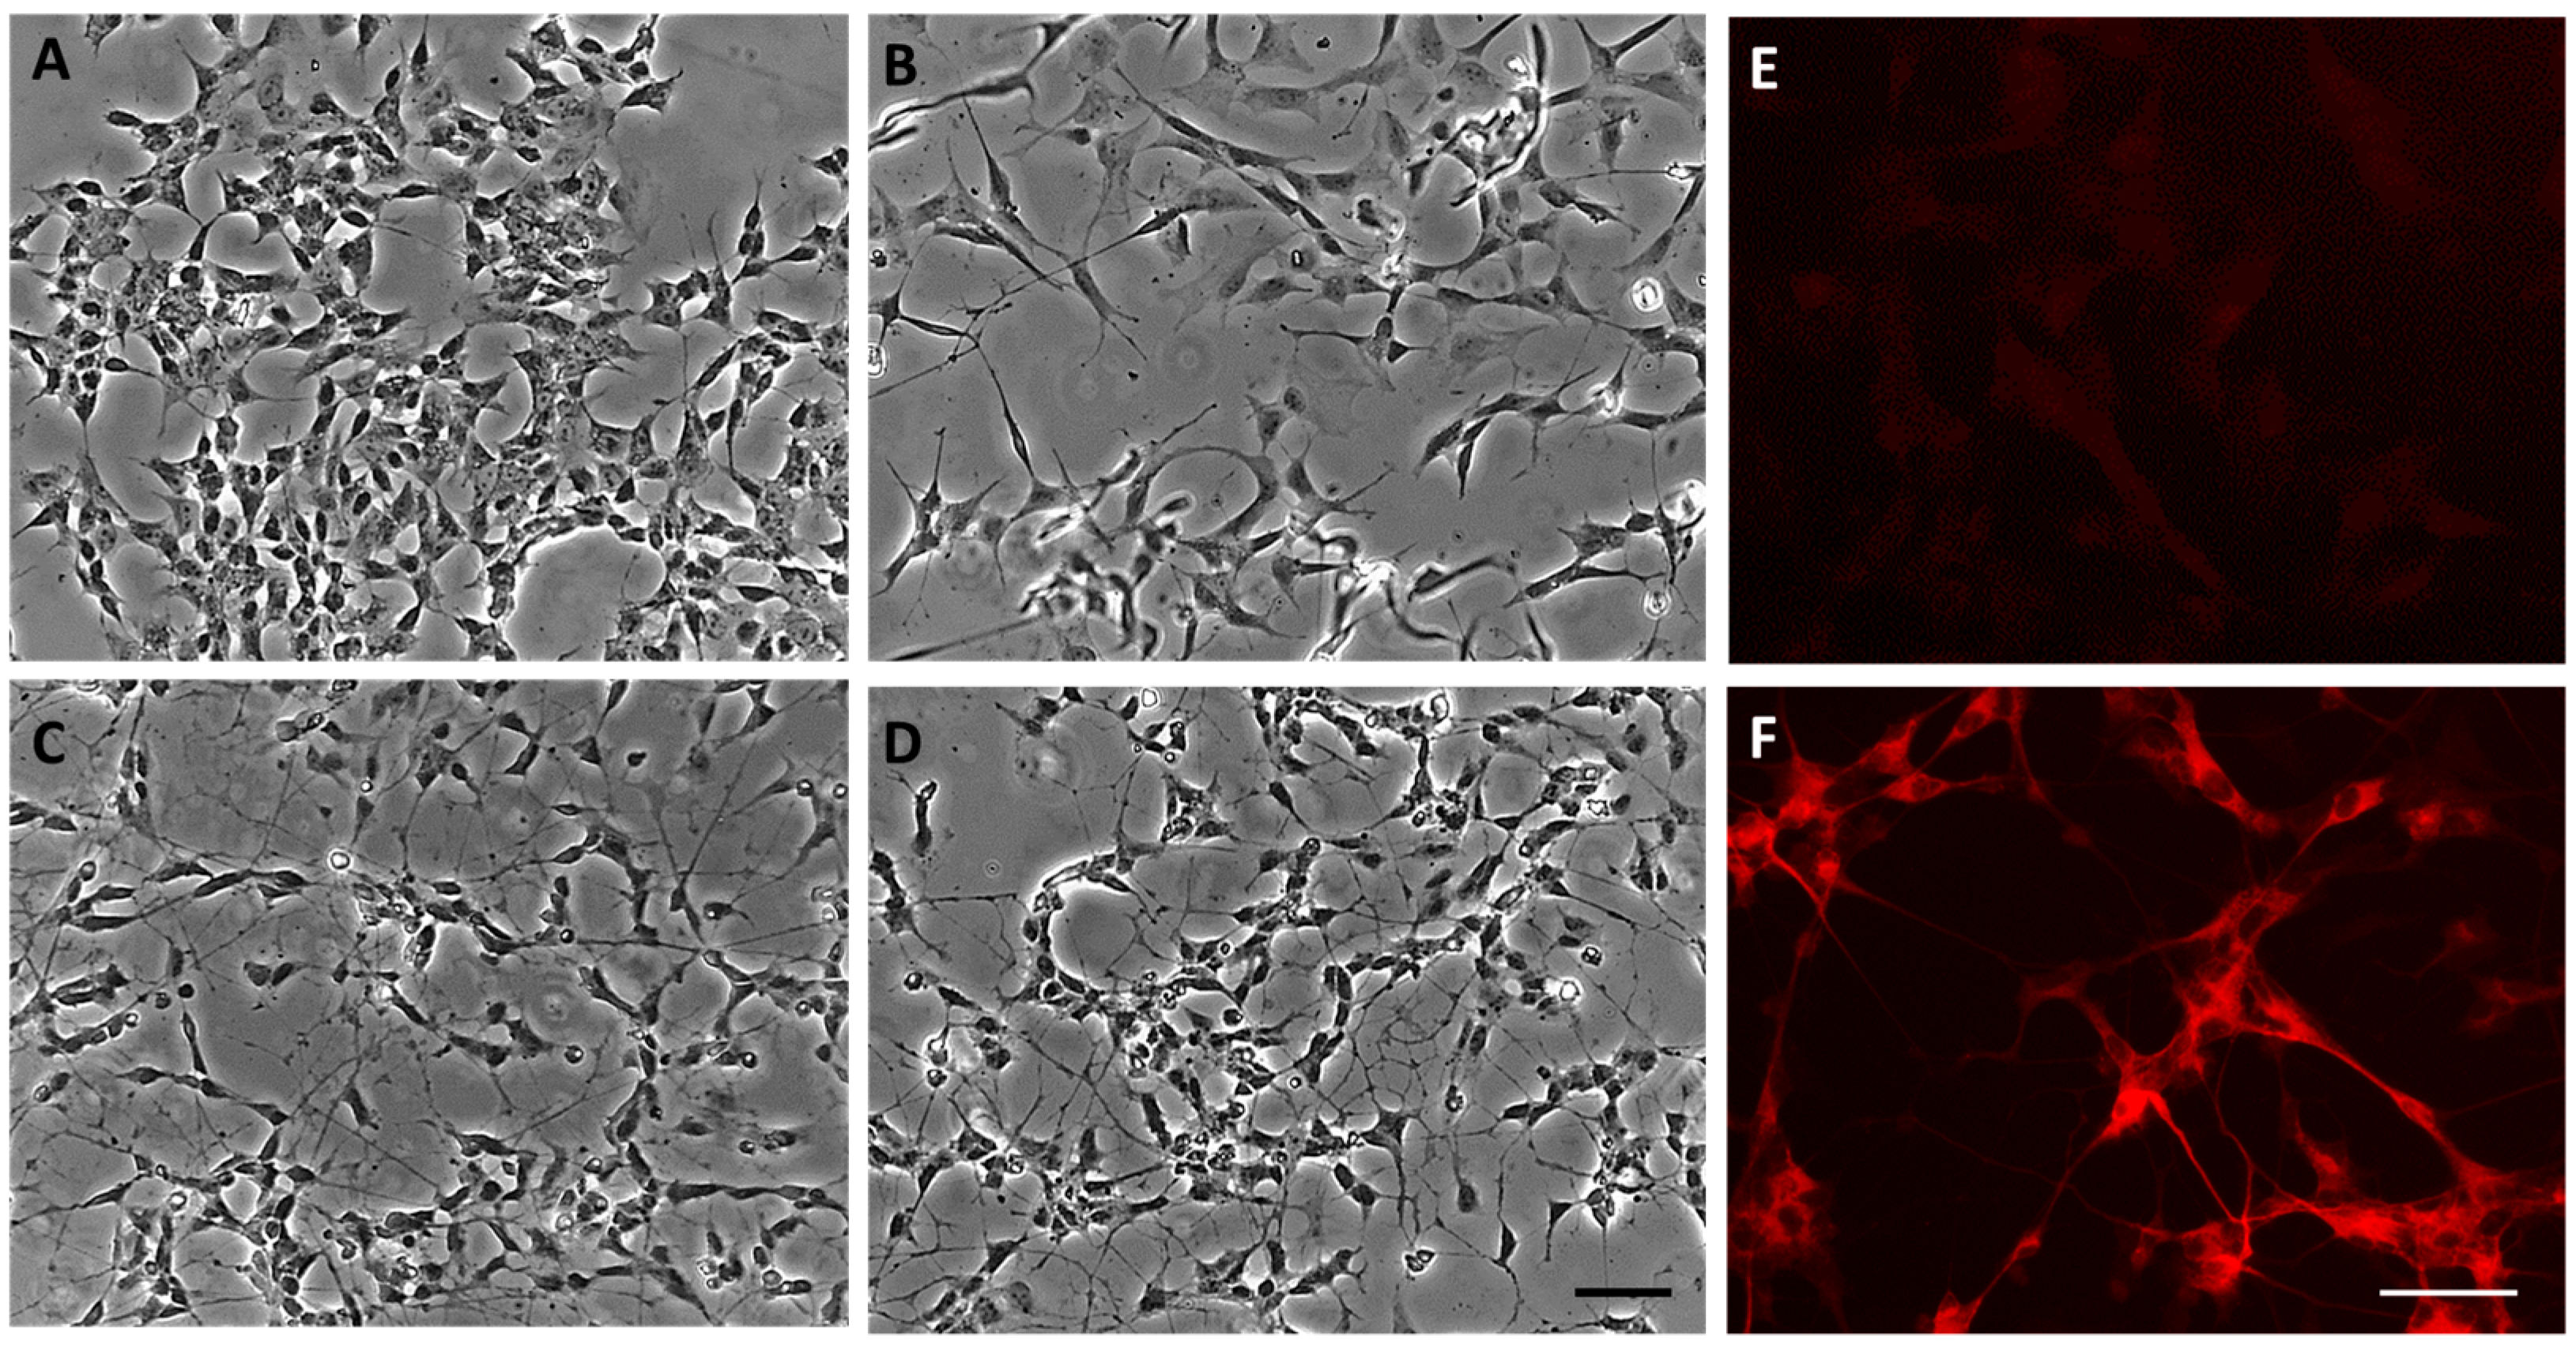
Abstract
:1. Introduction
2. Materials and Methods
2.1. SH-SY5Y Culture and Differentiation
2.2. Cell Treatments
2.3. Morphological Analysis
2.4. Immunocytochemistry
2.5. Cell Viability by MTT Test
2.6. Viable Cell Count by Trypan Blue Exclusion Method
2.7. Western Blotting
2.8. ROS Quantification
2.9. Statistical Analysis
3. Results
3.1. SH-SY5Y Differentiation
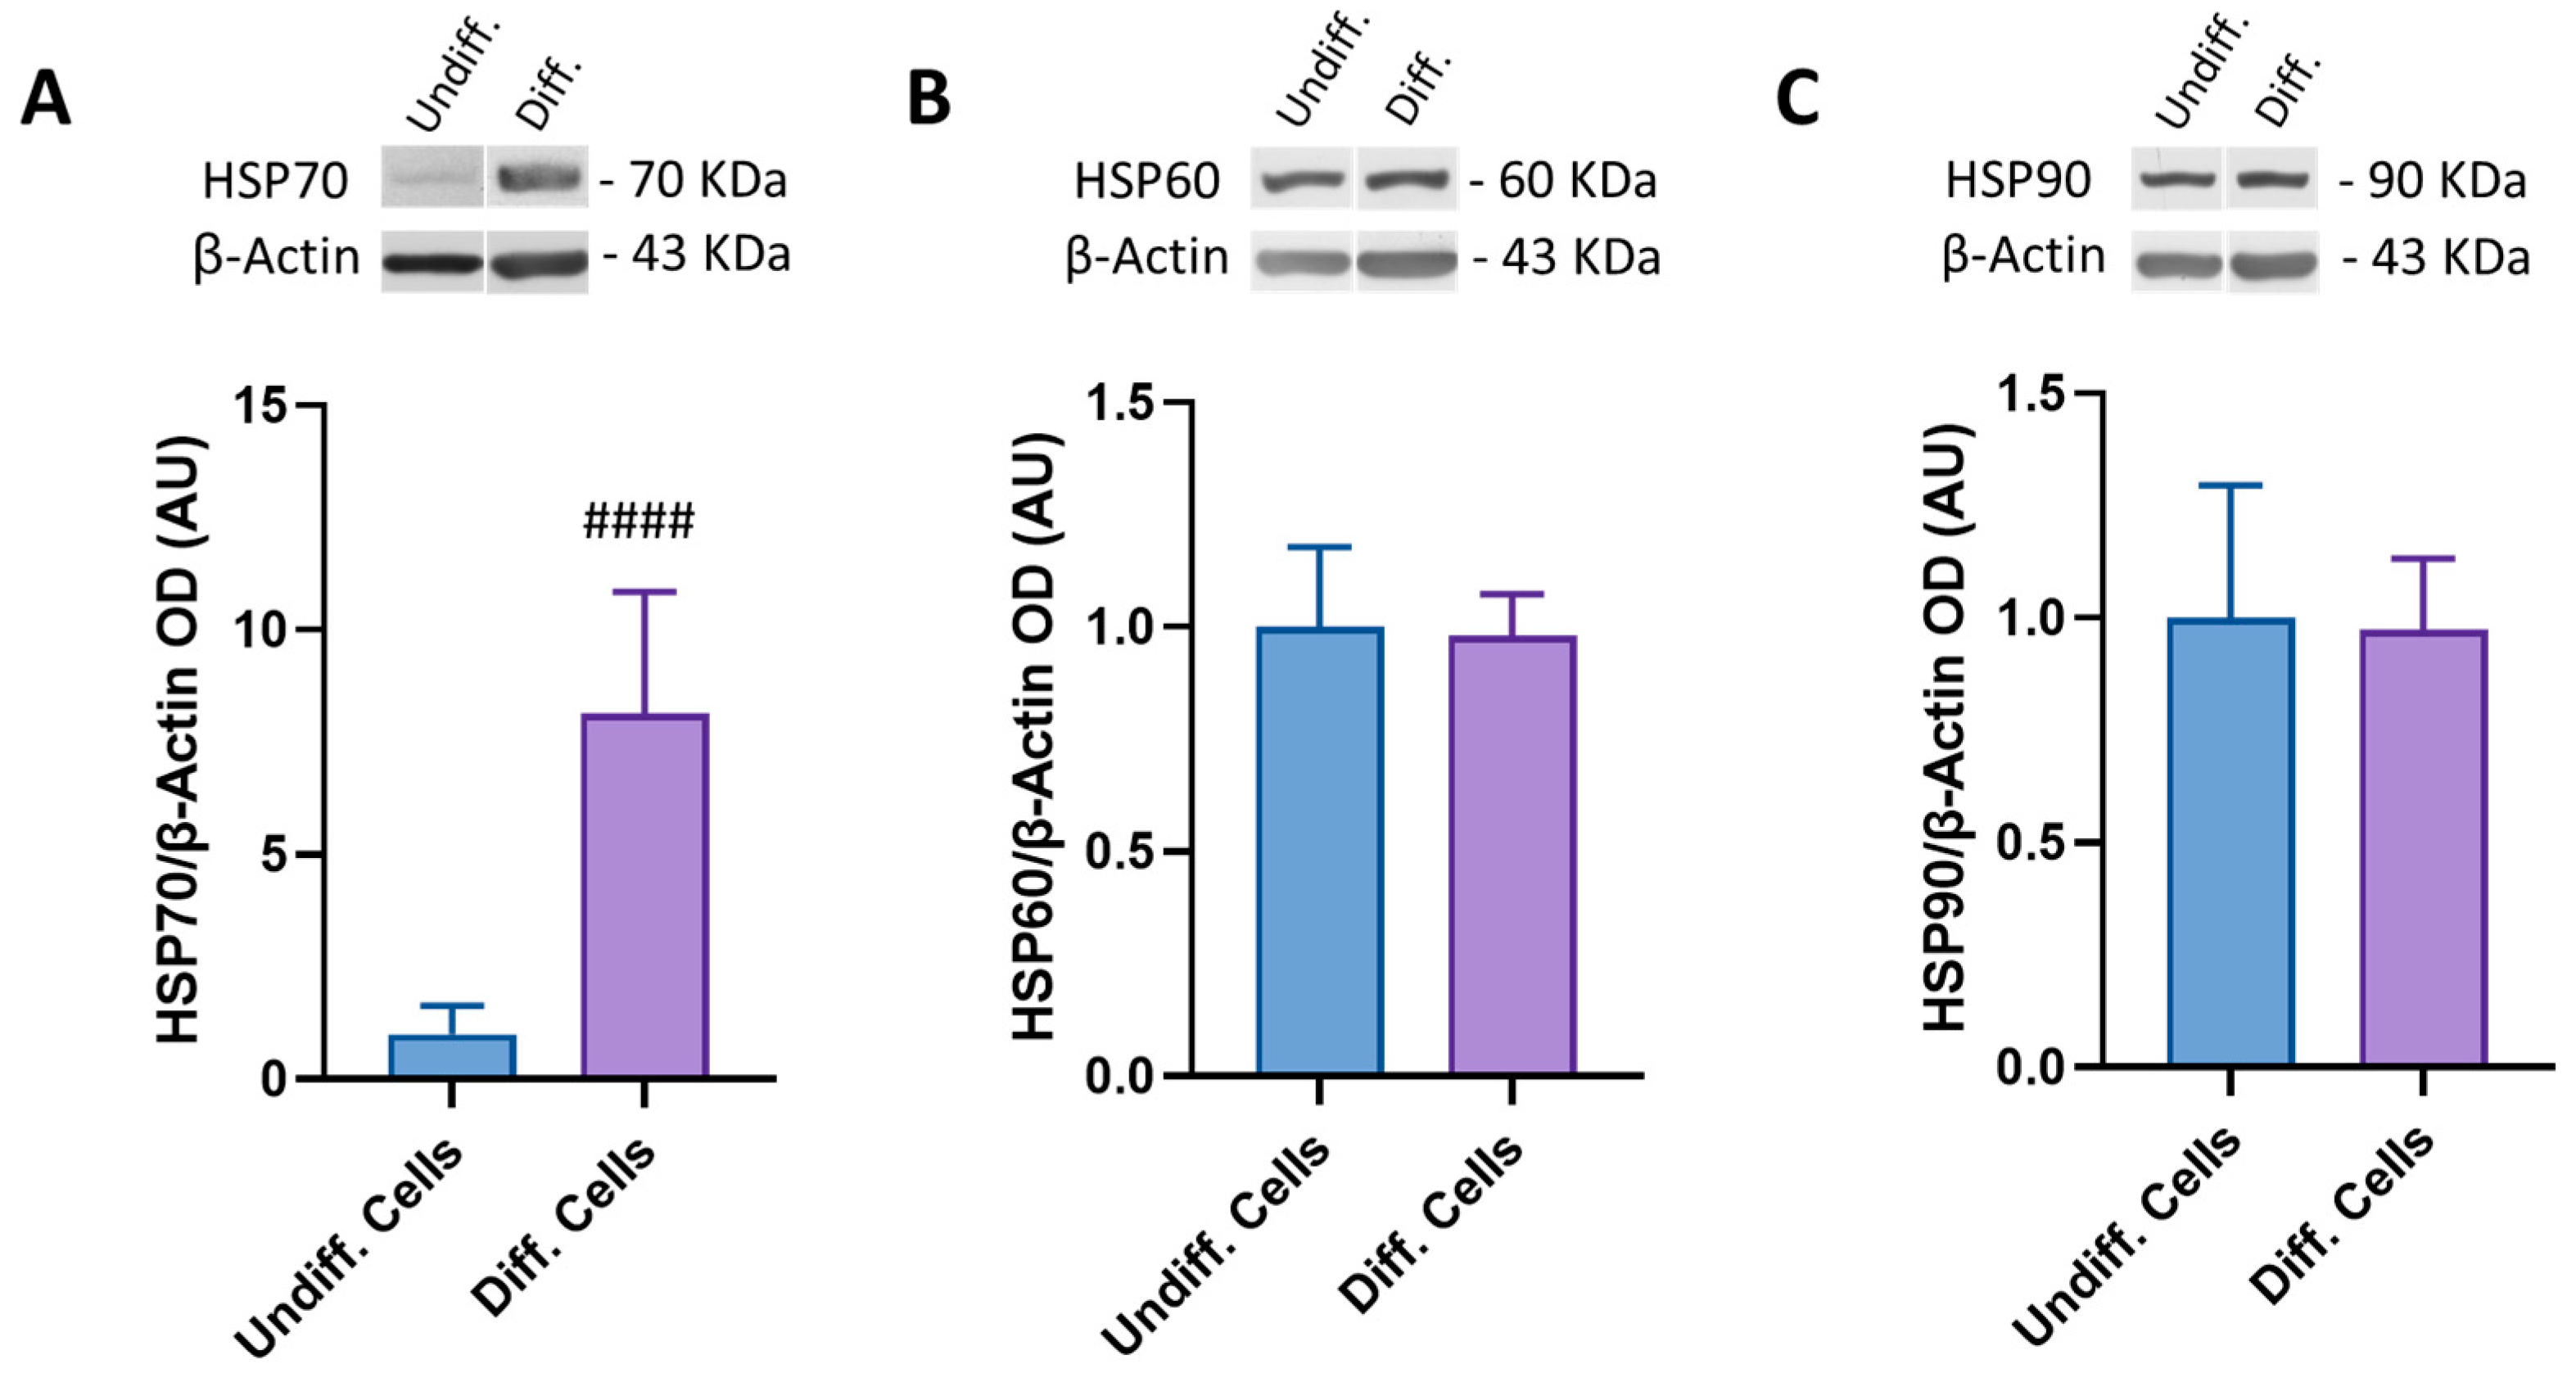
3.2. Modulation of HSP Expression during SH-SY5Y Differentiation
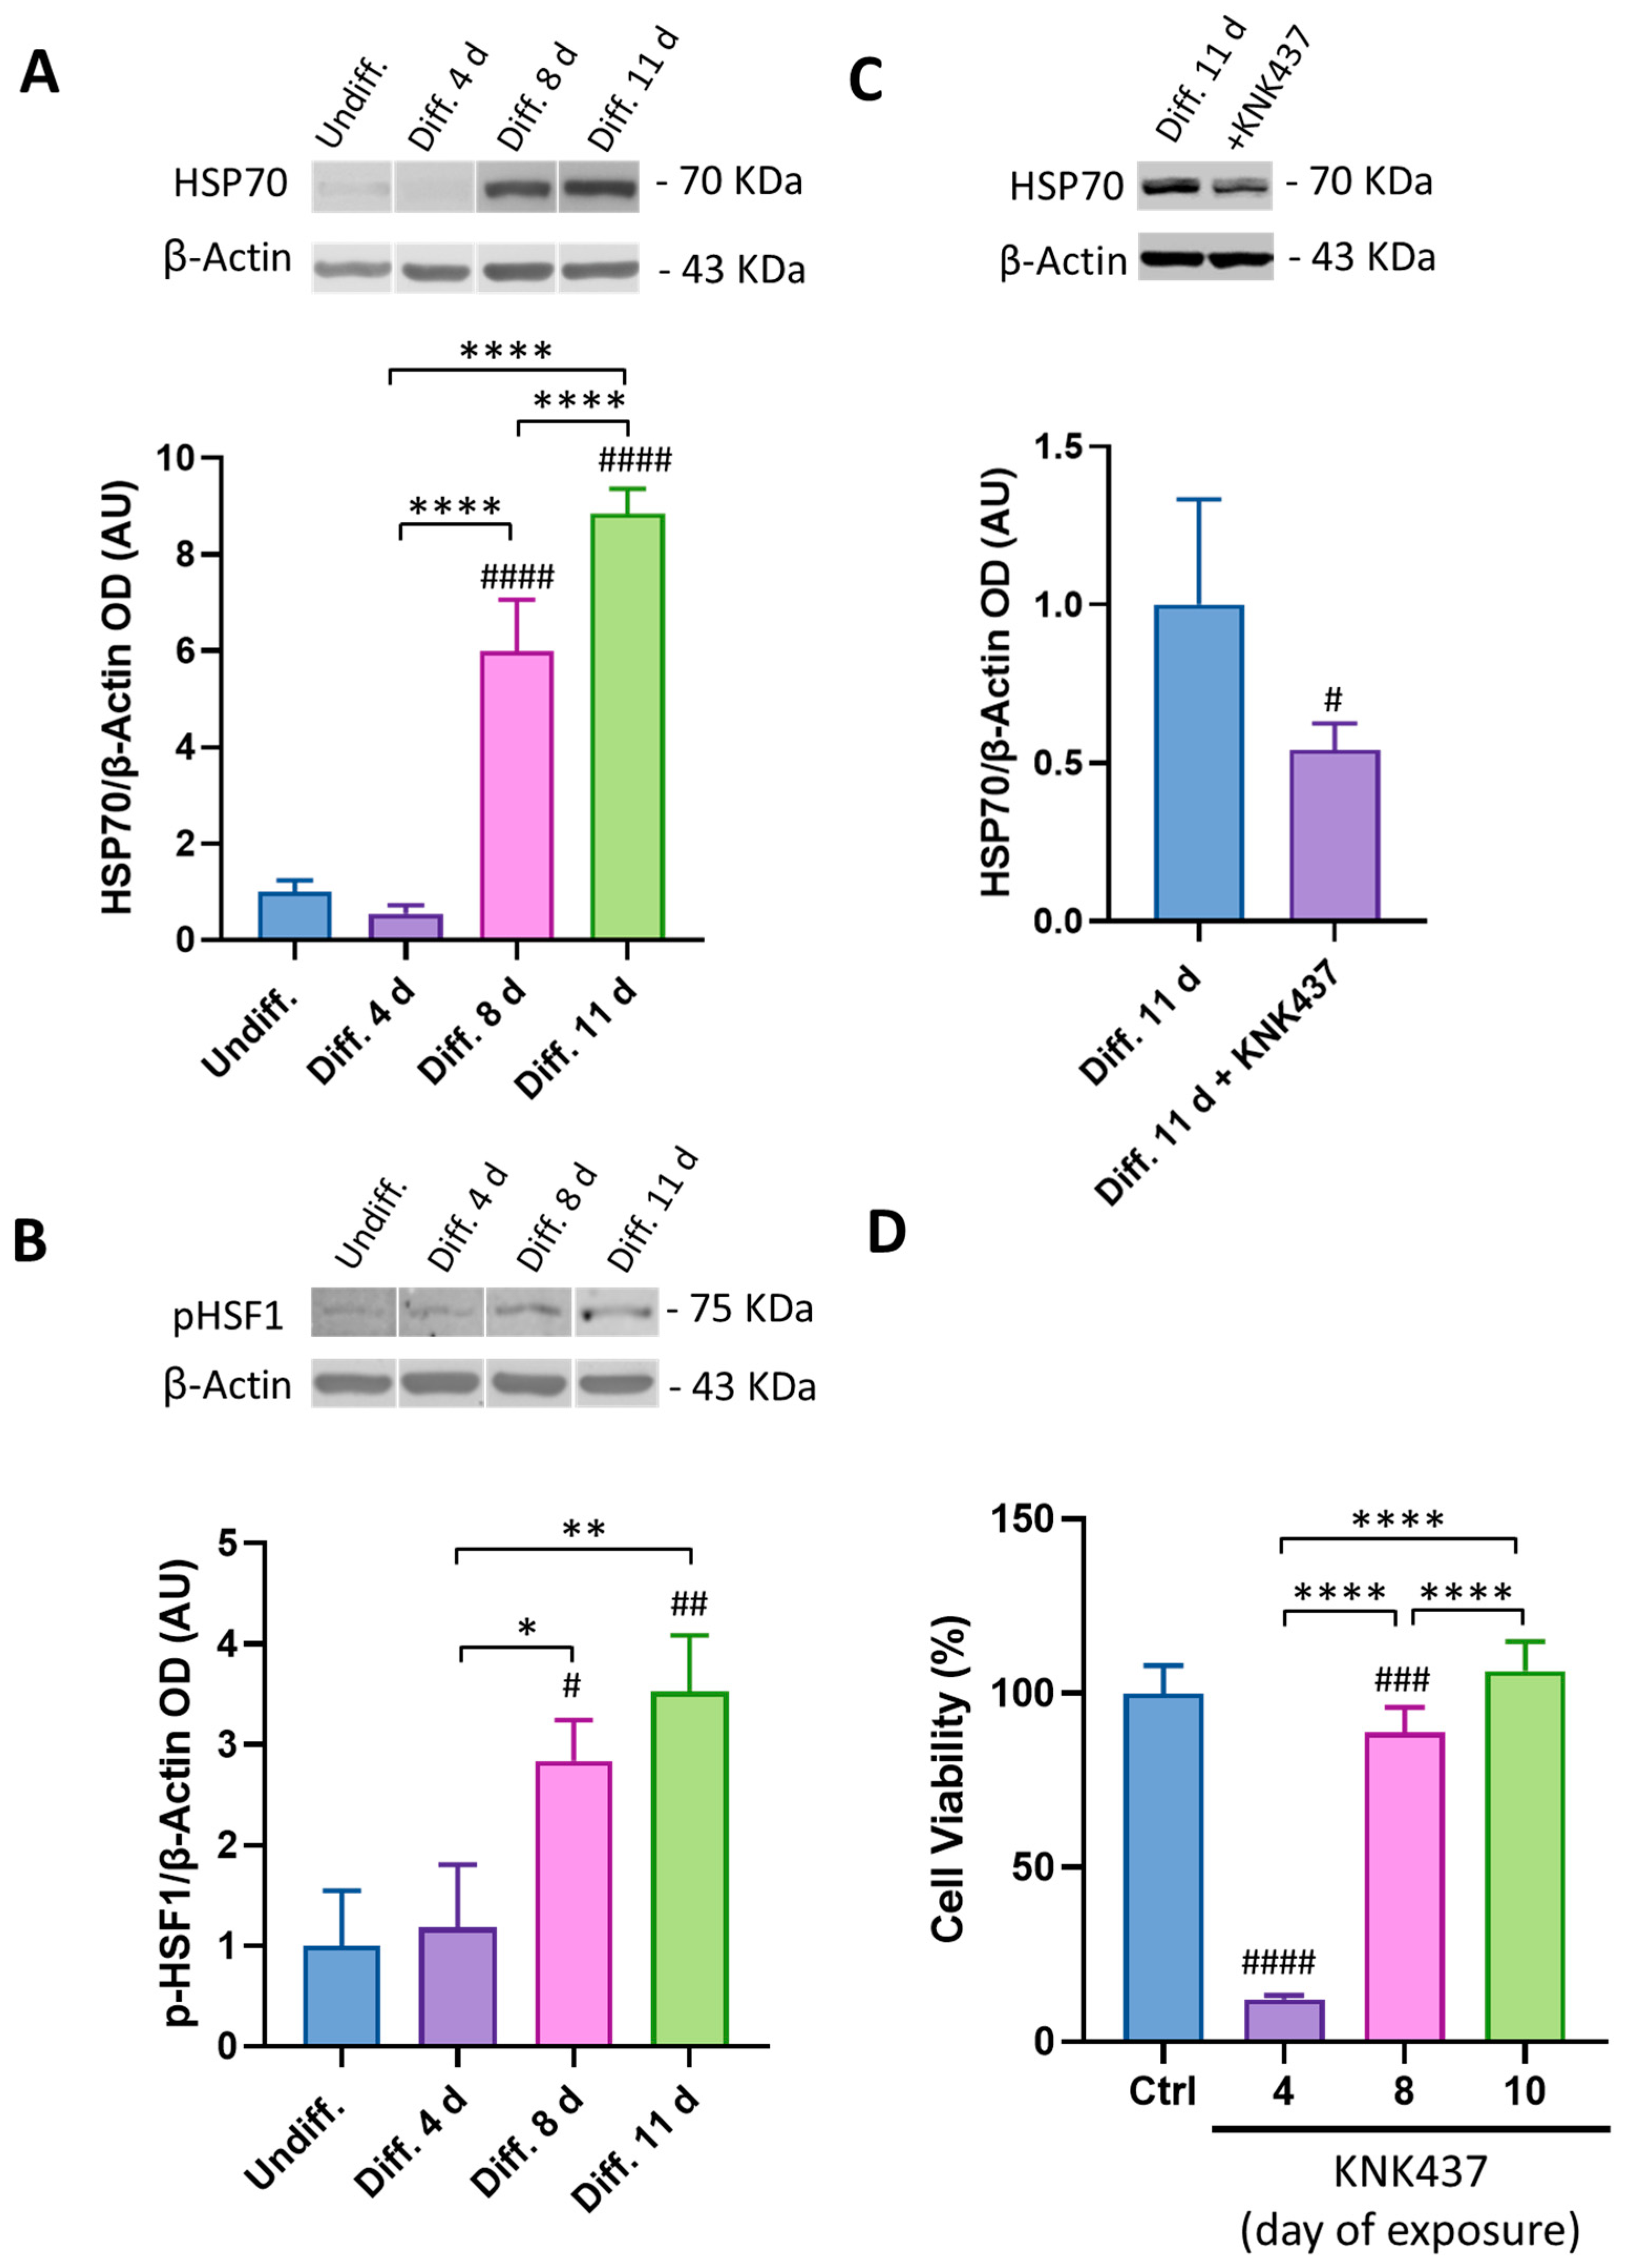
3.3. HSP70 Is Involved in SH-SY5Y Cell Survival during the Differentiation Process
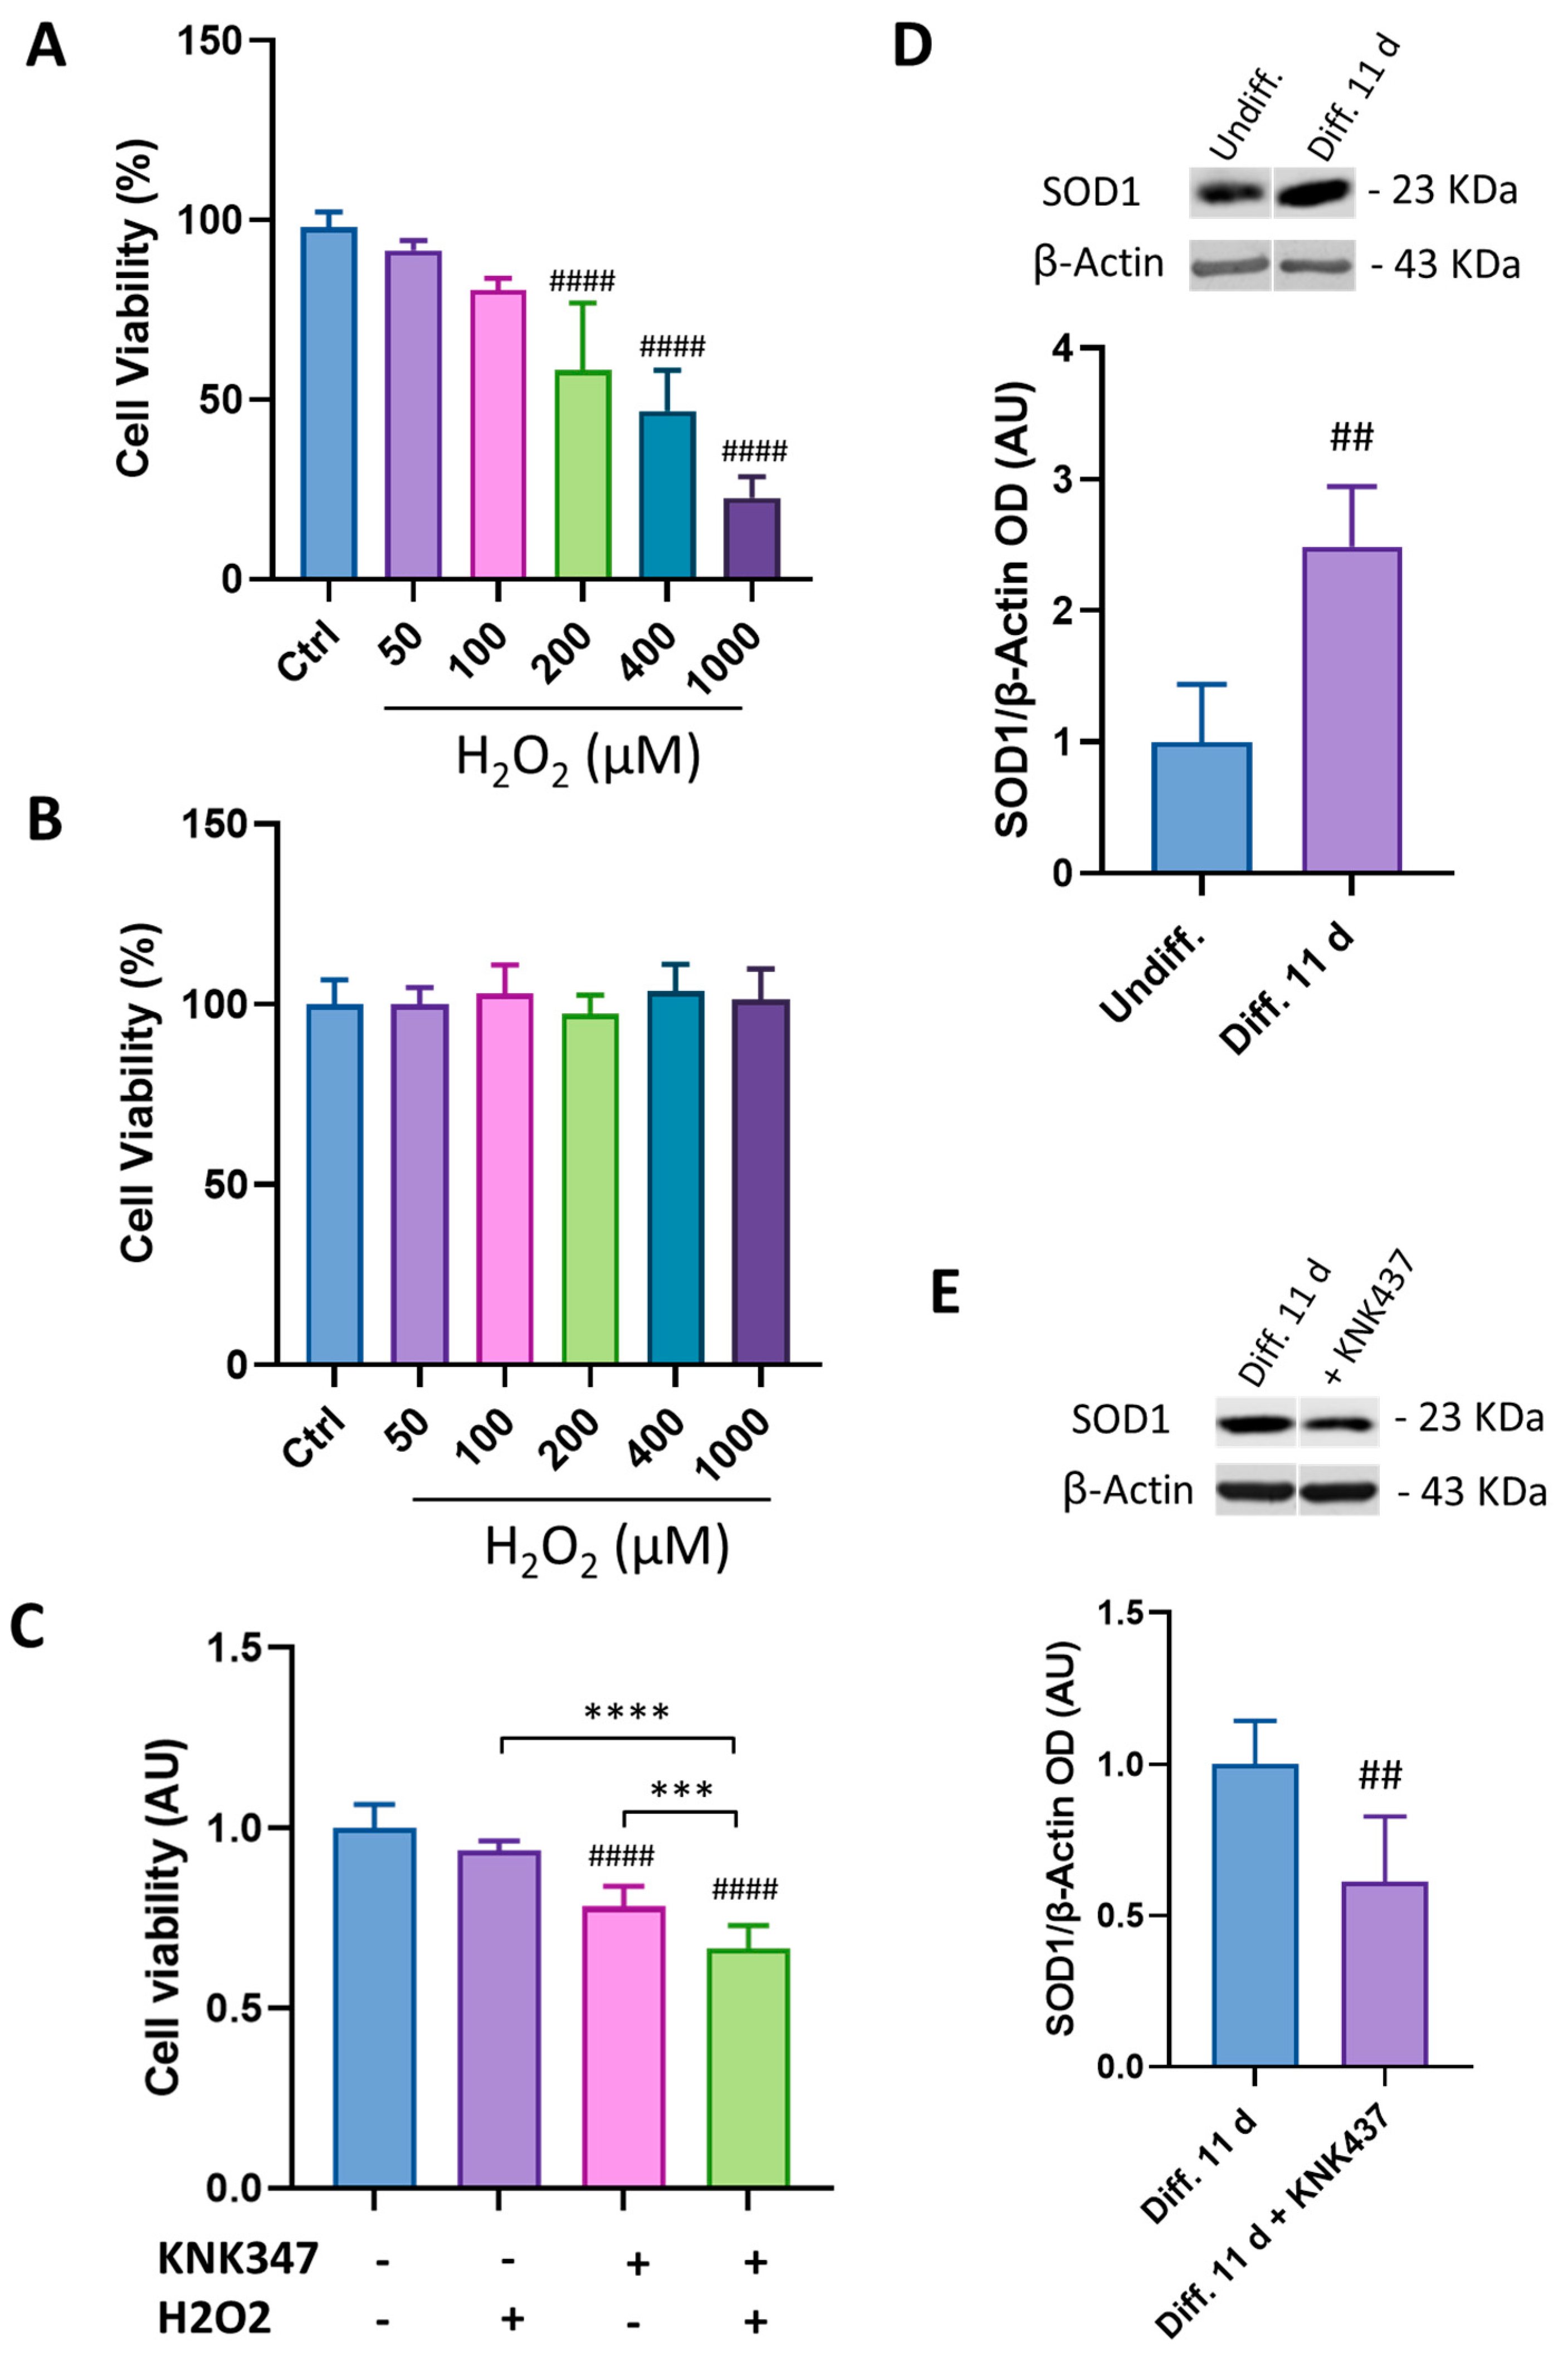
3.4. HSP70 Is Involved in SH-SY5Y Cell Susceptibility to H2O2-Induced Cell Death
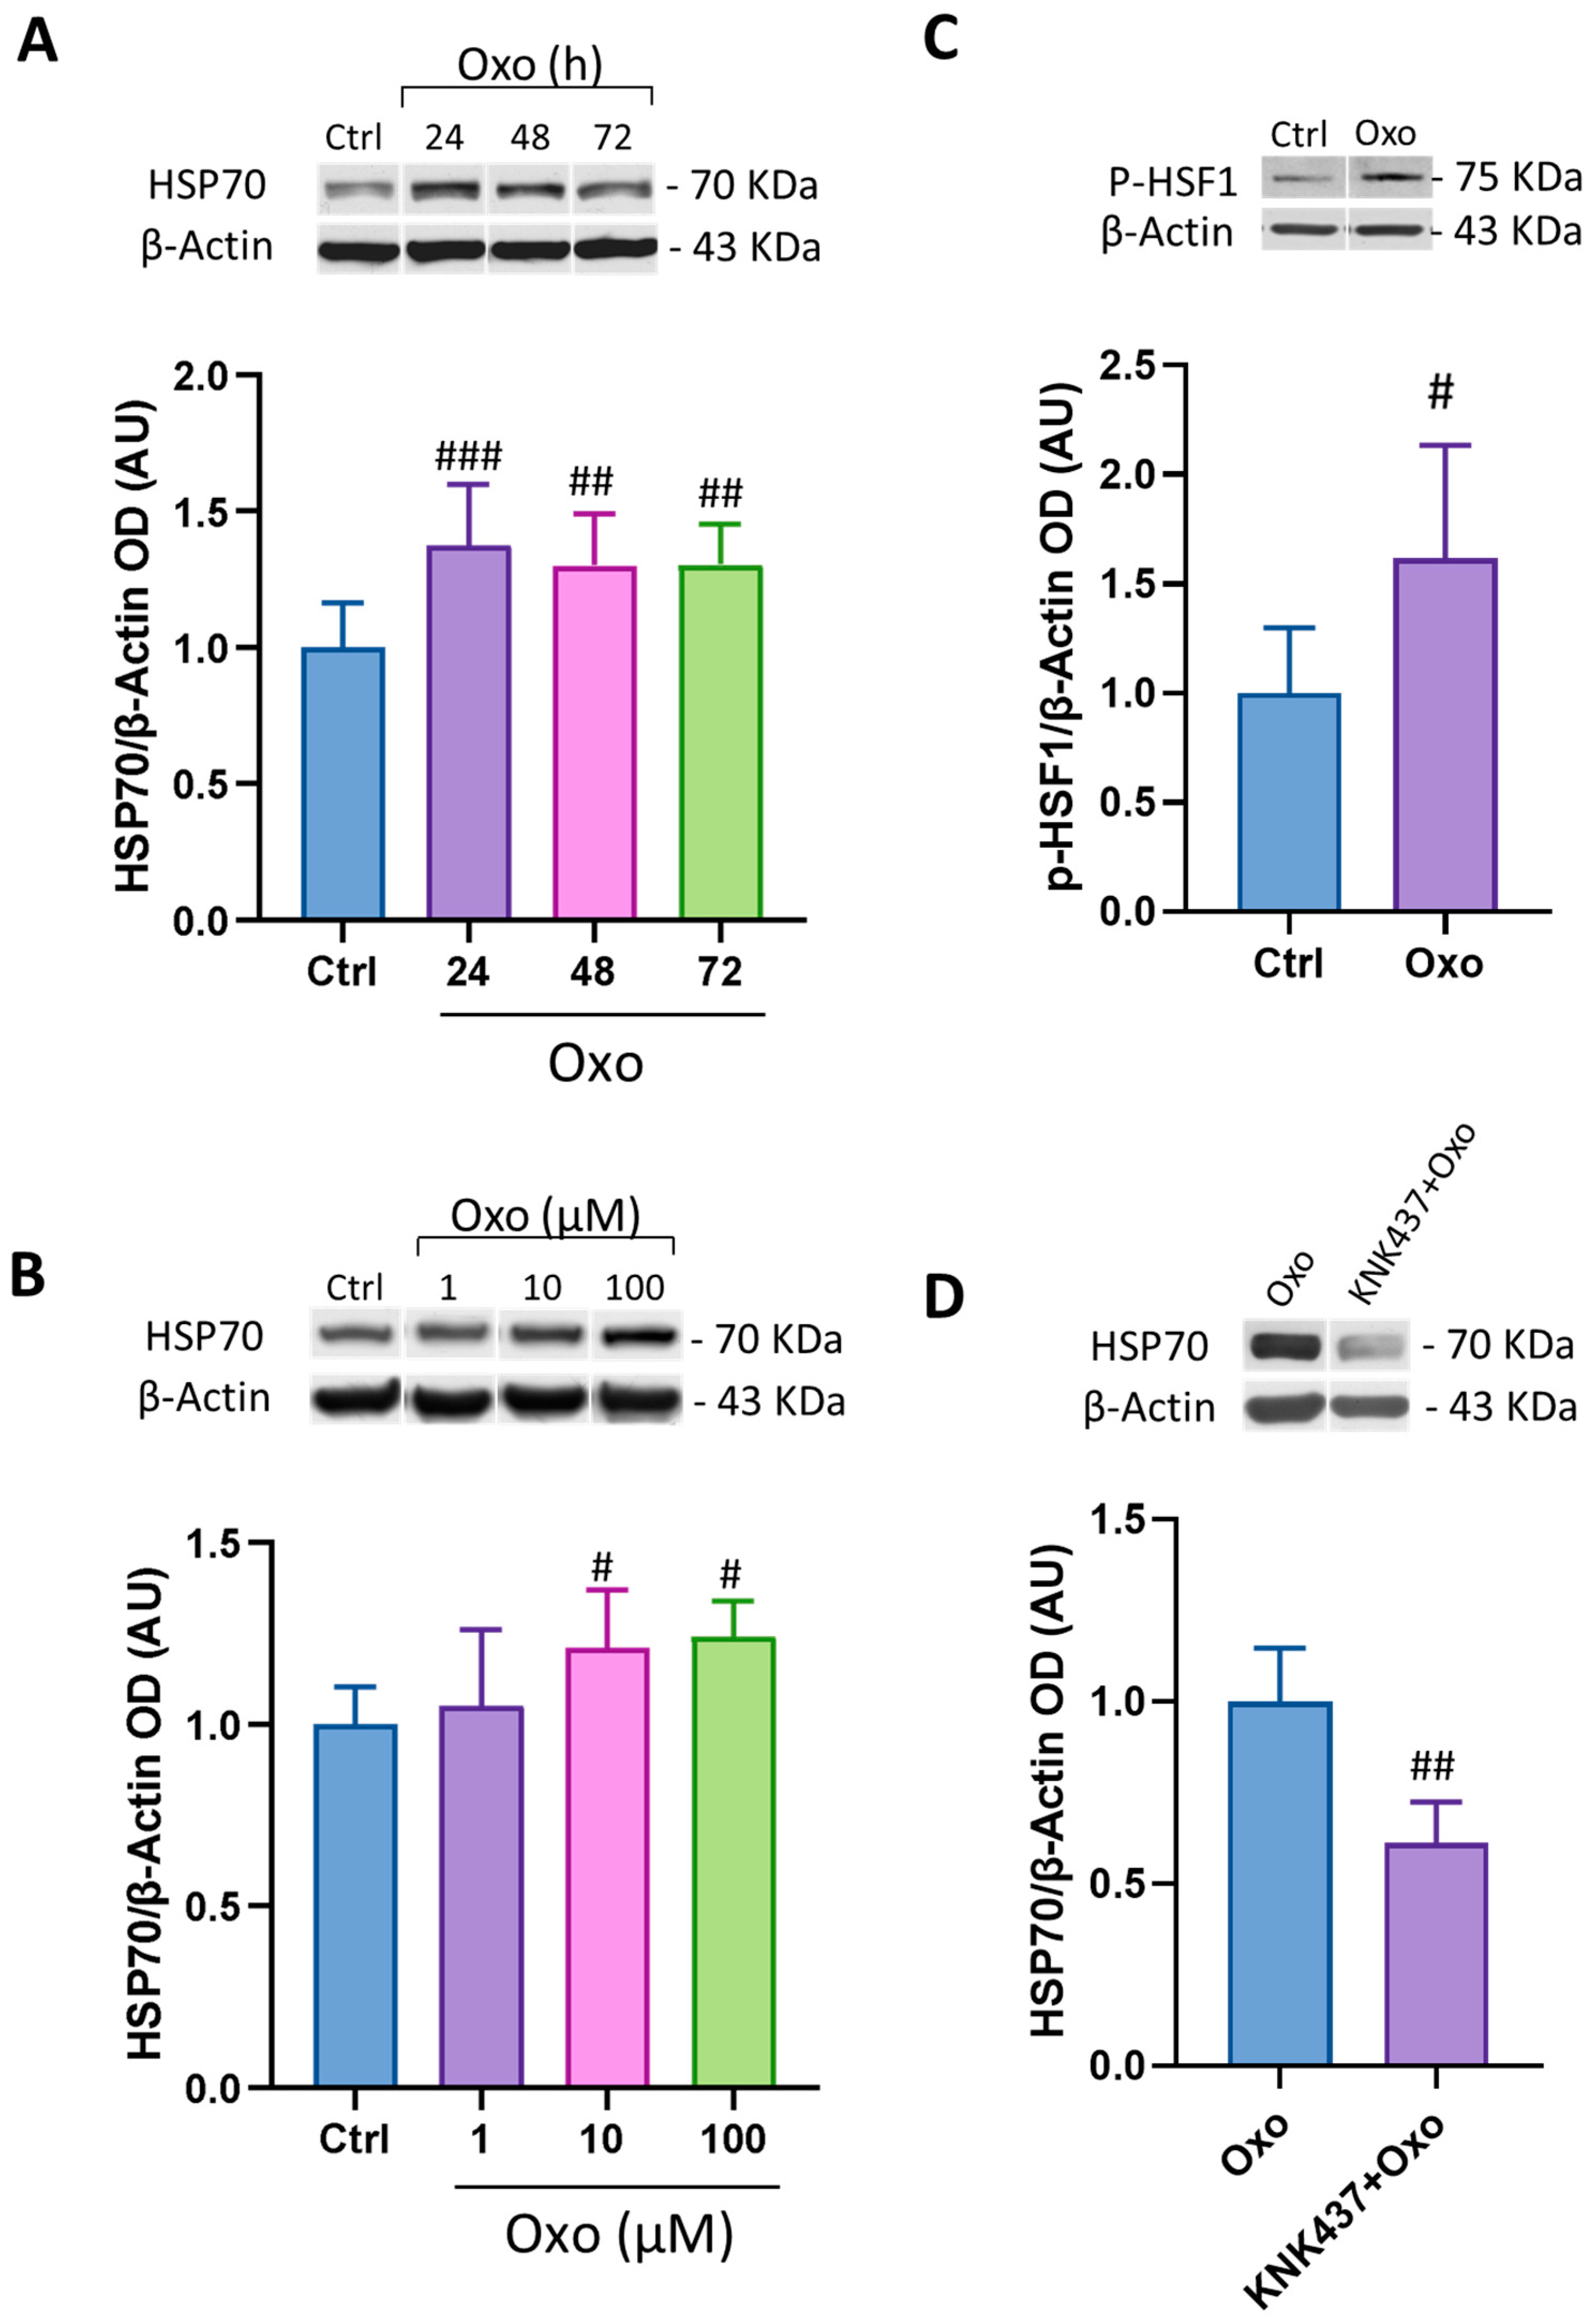
3.5. Oxo Induces HSP70 and pHSF1 Expression in SH-SY5Y Differentiated Cells
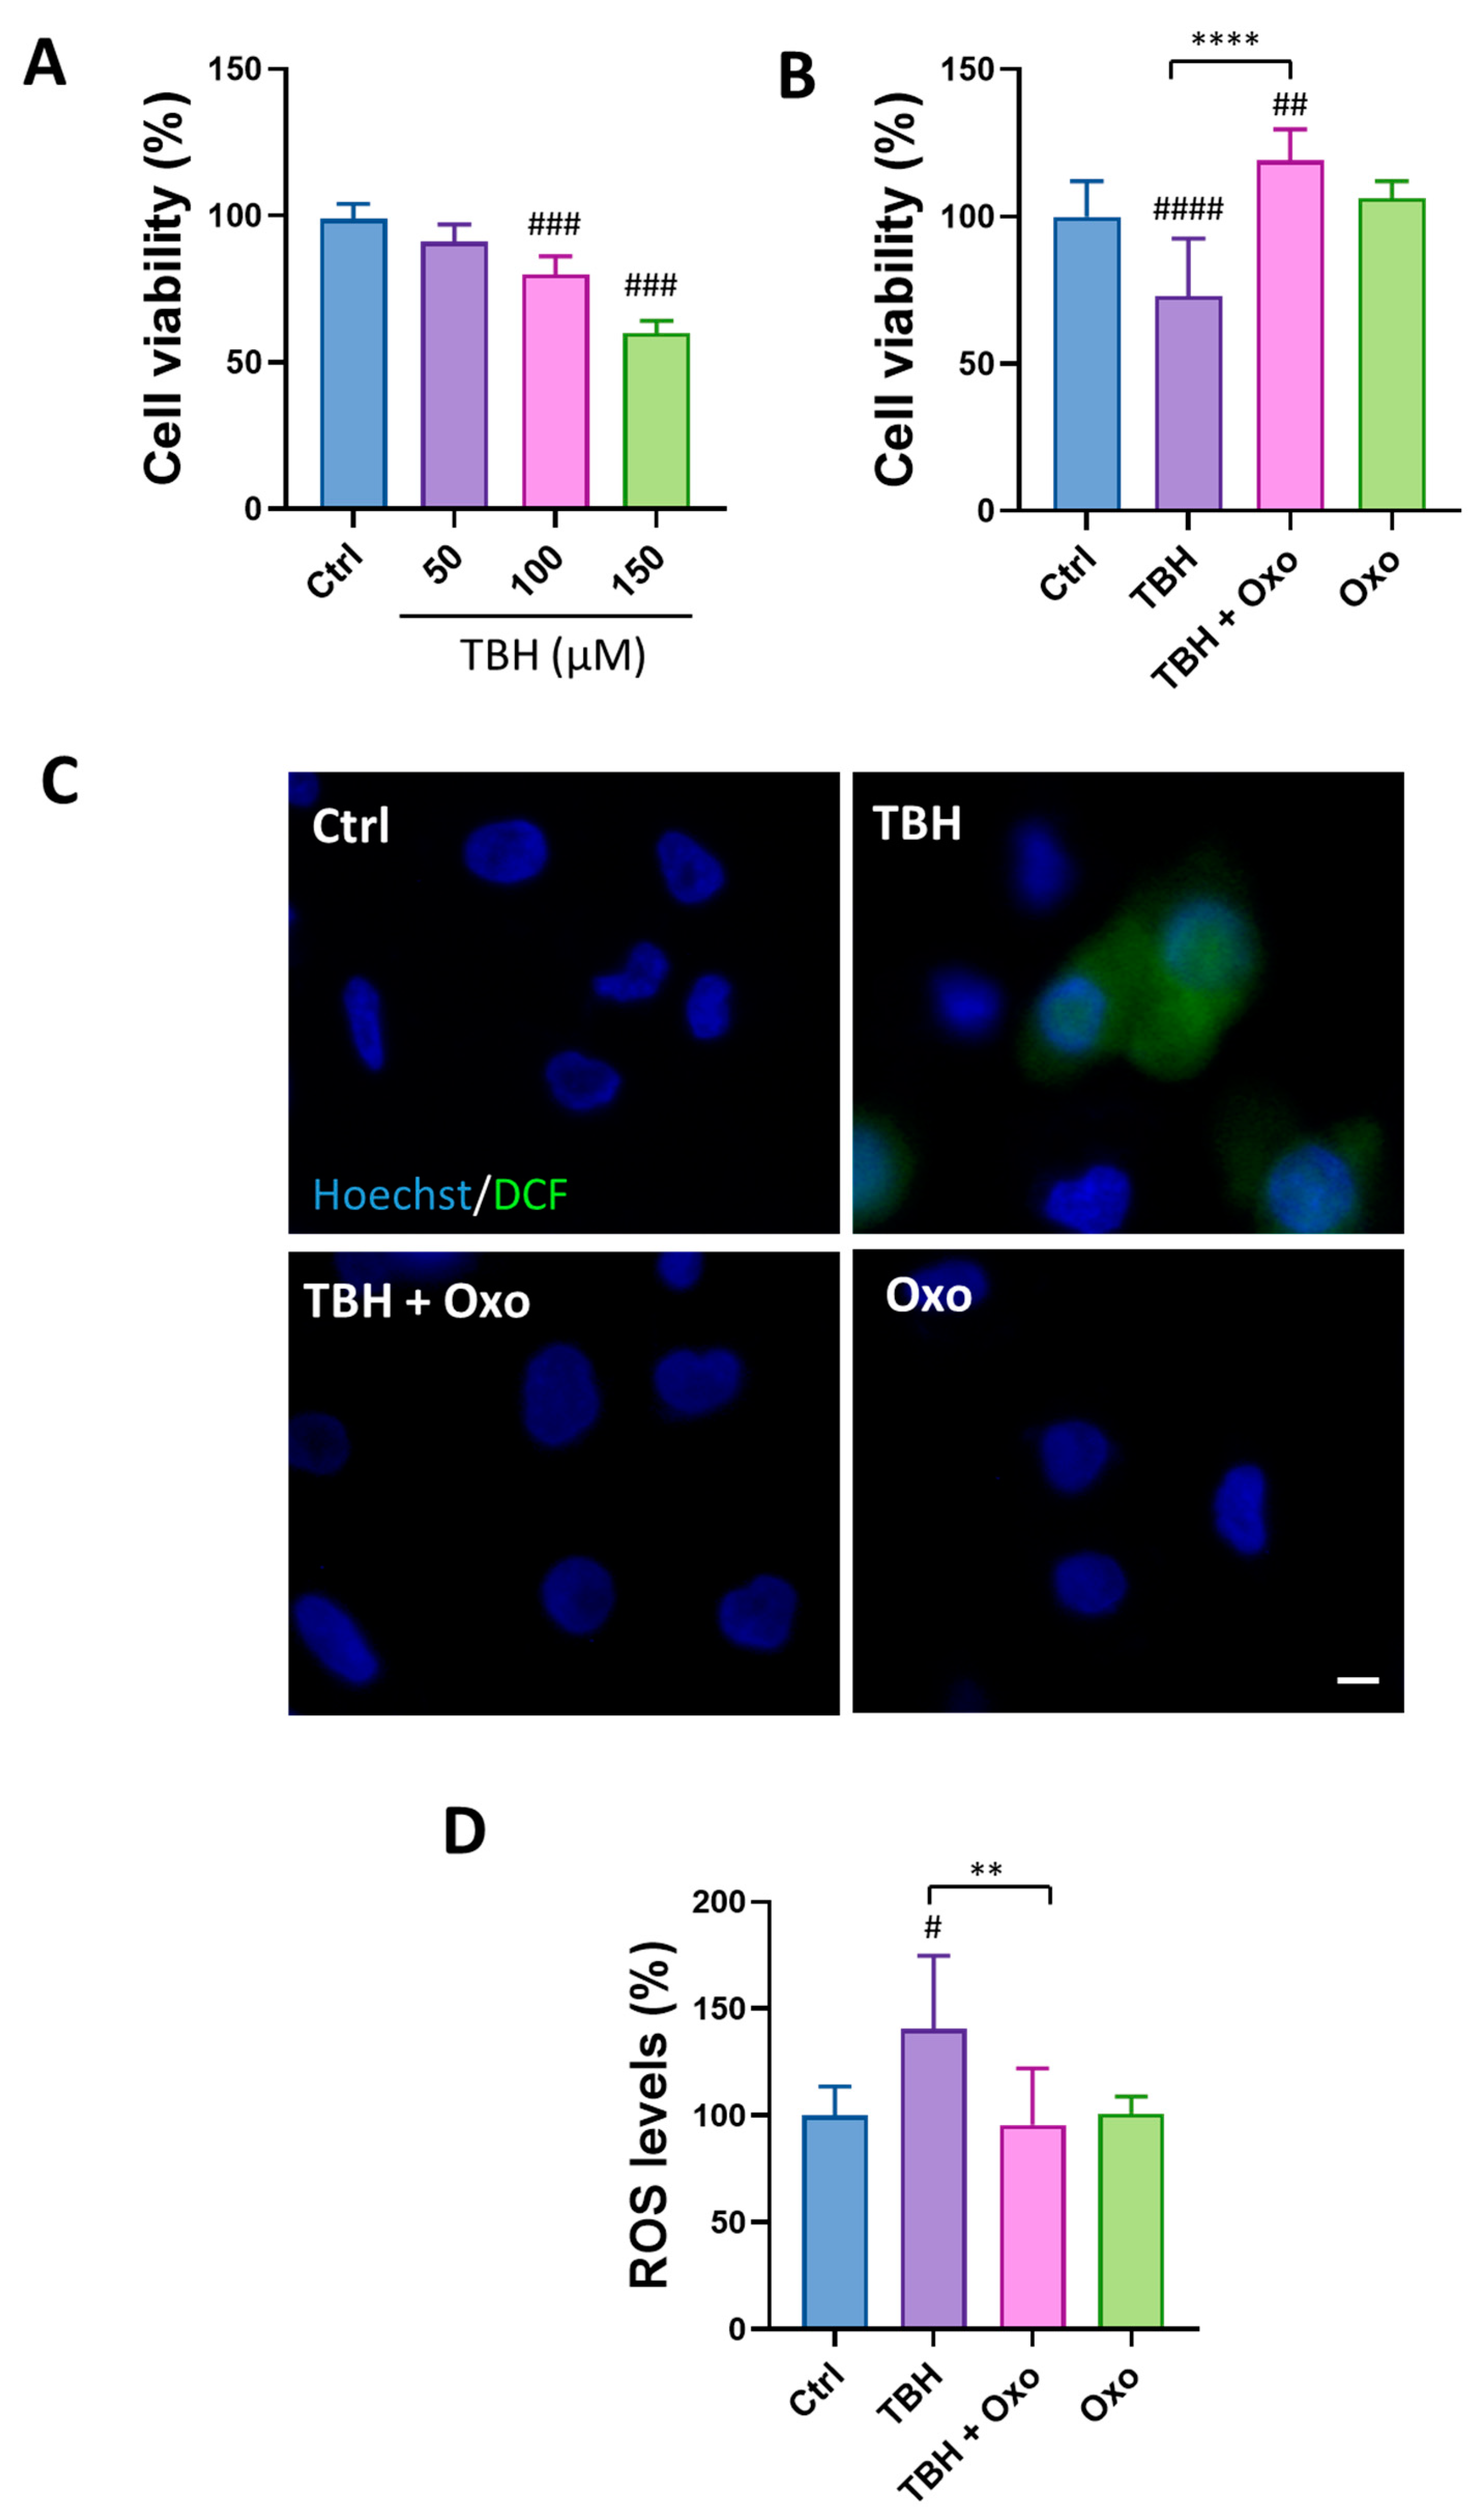
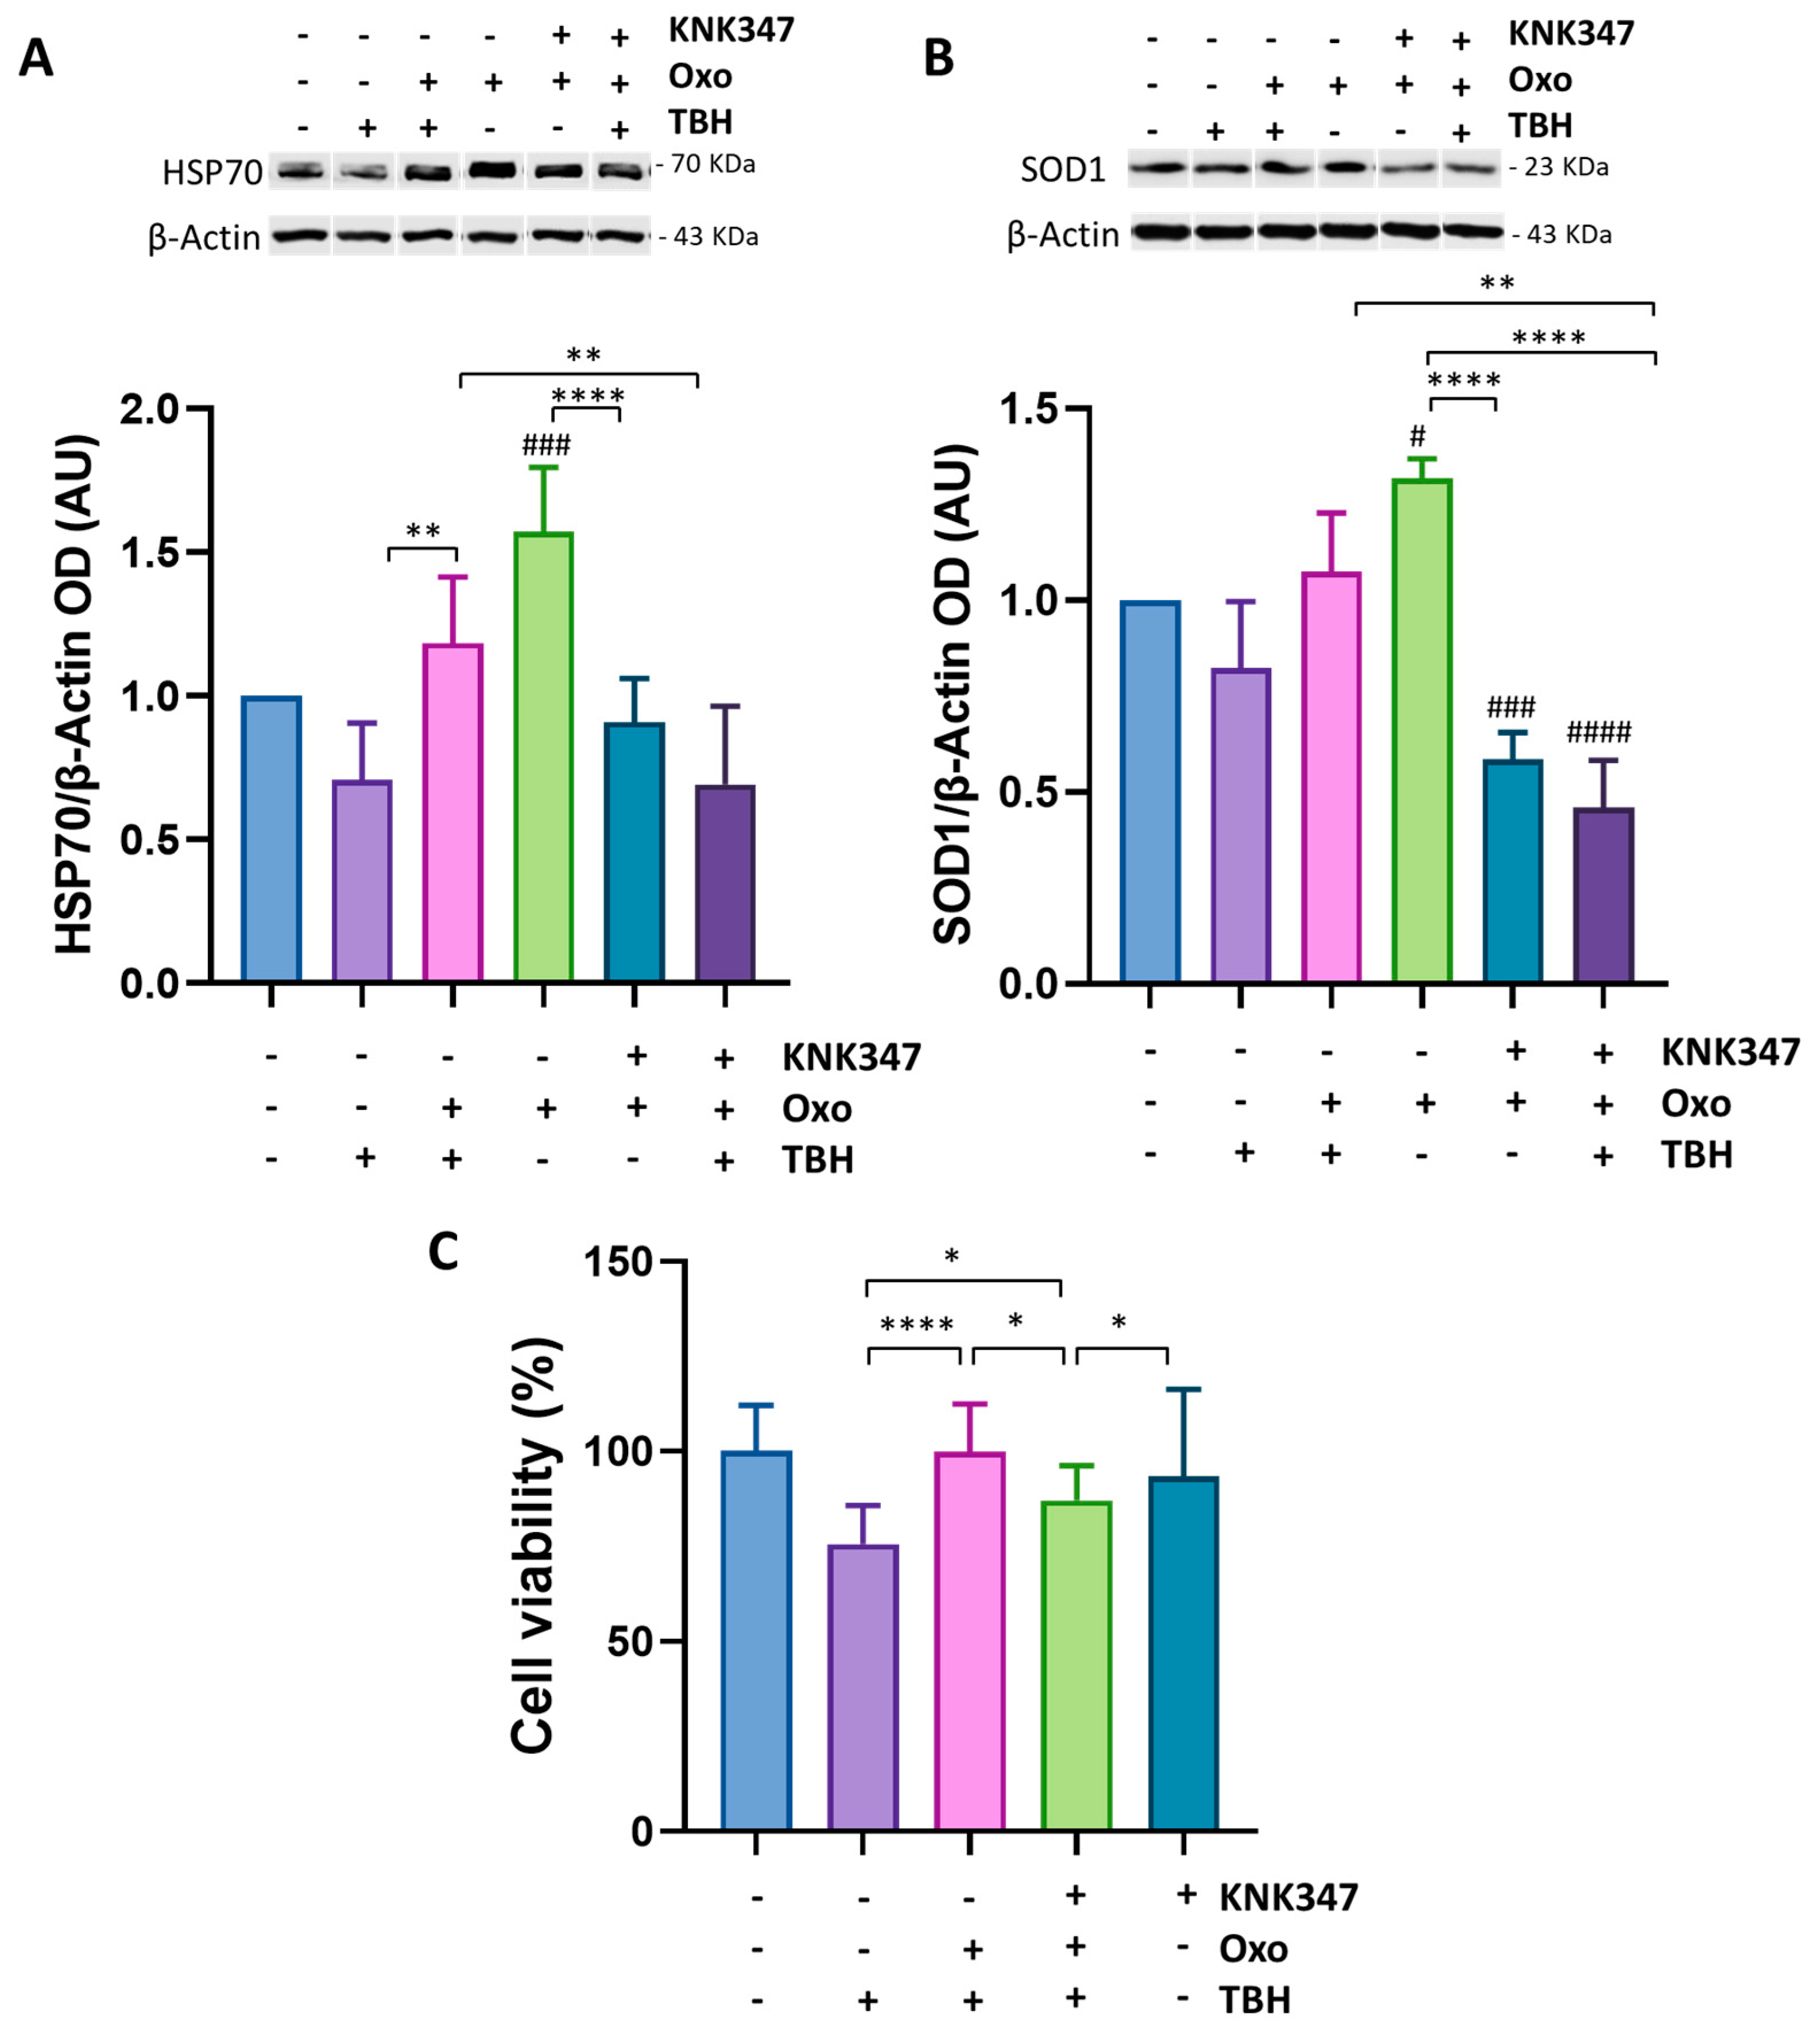
3.6. Oxo Treatment Rescues Cell Viability and Oxidative Stress Induced by Cell Exposure to TBH by Enhancing HSP70 and SOD1 Expression
4. Discussion
Supplementary Materials
Author Contributions
Funding
Data Availability Statement
Conflicts of Interest
References
- Burke, E.E.; Chenoweth, J.G.; Shin, J.H.; Collado-Torres, L.; Kim, S.-K.; Micali, N.; Wang, Y.; Colantuoni, C.; Straub, R.E.; Hoeppner, D.J.; et al. Dissecting transcriptomic signatures of neuronal differentiation and maturation using iPSCs. Nat. Commun. 2020, 11, 462. [Google Scholar] [CrossRef] [PubMed] [Green Version]
- Kovalevich, J.; Langford, D. Considerations for the use of SH-SY5Y neuroblastoma cells in neurobiology. Methods Mol. Biol. 2013, 1078, 9–21. [Google Scholar]
- Xicoy, H.; Wieringa, B.; Martens, G.J.M. The SH-SY5Y cell line in Parkinson’s disease research: A systematic review. Mol. Neurodegener. 2017, 12, 10. [Google Scholar] [CrossRef] [PubMed] [Green Version]
- Shipley, M.M.; Mangold, C.A.; Szpara, M.L. Differentiation of the SH-SY5Y Human Neuroblastoma Cell Line. J. Vis. Exp. 2016, 123, 53193. [Google Scholar]
- Påhlman, S.; Ruusala, A.-I.; Abrahamsson, L.; Mattsson, M.E.; Esscher, T. Retinoic acid-induced differentiation of cultured human neuroblastoma cells: A comparison with phorbolester-induced differentiation. Cell Differ. 1984, 14, 135–144. [Google Scholar] [CrossRef]
- Påhlman, S.; Hoehner, J.; Nånberg, E.; Hedborg, F.; Fagerström, S.; Gestblom, C.; Johansson, I.; Larsson, U.; Lavenius, E.; Örtoft, E.; et al. Differentiation and survival influences of growth factors in human neuroblastoma. Eur. J. Cancer 1995, 31, 453–458. [Google Scholar] [CrossRef]
- Giménez-Cassina, A.; Lim, F.; Diaz-Nido, J. Differentiation of a human neuroblastoma into neuron-like cells increases their susceptibility to transduction by herpesviral vectors. J. Neurosci. Res. 2006, 84, 755–767. [Google Scholar] [CrossRef]
- Xie, H.R.; Hu, L.S.; Li, G.Y. SH-SY5Y human neuroblastoma cell line: In vitro cell model of dopaminergic neurons in Parkinson’s disease. Chin. Med. J. 2010, 123, 1086–1092. [Google Scholar]
- Agholme, L.; Lindström, T.; Kågedal, K.; Marcusson, J.; Hallbeck, M. An In Vitro Model for Neuroscience: Differentiation of SH-SY5Y Cells into Cells with Morphological and Biochemical Characteristics of Mature Neurons. J. Alzheimer’s Dis. 2010, 20, 1069–1082. [Google Scholar] [CrossRef] [Green Version]
- Cheung, Y.-T.; Lau, W.K.-W.; Yu, M.-S.; Lai, C.S.-W.; Yeung, S.-C.; So, K.-F.; Chang, R.C.-C. Effects of all-trans-retinoic acid on human SH-SY5Y neuroblastoma as in vitro model in neurotoxicity research. NeuroToxicology 2009, 30, 127–135. [Google Scholar] [CrossRef]
- Santillo, S. Changes in Biophysical Properties of Undifferentiated SH-SY5Y Cells During Long-term Cultures. Neuroscience 2022, 482, 143–158. [Google Scholar] [CrossRef] [PubMed]
- Cheng, L.; Smith, D.J.; Anderson, R.L.; Nagley, P. Human neuroblastoma SH-SY5Y cells show increased resistance to hyperthermic stress after differentiation, associated with elevated levels of Hsp72. Int. J. Hyperth. 2011, 27, 415–426. [Google Scholar] [CrossRef]
- Swindell, W.R.; Huebner, M.; Weber, A.P. Transcriptional profiling of Arabidopsis heat shock proteins and transcription factors reveals extensive overlap between heat and non-heat stress response pathways. BMC Genom. 2007, 8, 125. [Google Scholar] [CrossRef] [PubMed] [Green Version]
- Turturici, G.; Sconzo, G.; Geraci, F. Hsp70 and Its Molecular Role in Nervous System Diseases. Biochem. Res. Int. 2011, 2011, 618127. [Google Scholar] [CrossRef] [PubMed] [Green Version]
- Zatsepina, O.; Evgen’Ev, M.; Garbuz, D. Role of a Heat Shock Transcription Factor and the Major Heat Shock Protein Hsp70 in Memory Formation and Neuroprotection. Cells 2021, 10, 1638. [Google Scholar] [CrossRef] [PubMed]
- A Kurashova, N.; Madaeva, I.M.; Kolesnikova, L. Expression of heat shock proteins HSP70 under oxidative stress. Adv. Gerontol. 2019, 32, 502–508. [Google Scholar] [CrossRef]
- Choi, S.-M.; Park, K.A.; Lee, H.J.; Park, M.S.; Lee, J.H.; Park, K.C.; Kim, M.-H.; Lee, S.-H.; Seo, J.-S.; Yoon, B.-W. Expression of Cu/Zn SOD Protein Is Suppressed in hsp 70.1 Knockout Mice. J. Biochem. Mol. Biol. 2005, 38, 111–114. [Google Scholar] [CrossRef] [Green Version]
- Afolayan, A.J.; Teng, R.-J.; Eis, A.; Rana, U.; Broniowska, K.A.; Corbett, J.A.; Pritchard, K.; Konduri, G.G. Inducible HSP70 regulates superoxide dismutase-2 and mitochondrial oxidative stress in the endothelial cells from developing lungs. Am. J. Physiol. Cell Mol. Physiol. 2014, 306, L351–L360. [Google Scholar] [CrossRef] [Green Version]
- Frinchi, M.; Morici, G.; Mudó, G.; Bonsignore, M.; Di Liberto, V. Beneficial Role of Exercise in the Modulation of mdx Muscle Plastic Remodeling and Oxidative Stress. Antioxidants 2021, 10, 558. [Google Scholar] [CrossRef]
- Kim, J.Y.; Barua, S.; Huang, M.Y.; Park, J.; Yenari, M.A.; Lee, J.E. Heat Shock Protein 70 (HSP70) Induction: Chaperonotherapy for Neuroprotection after Brain Injury. Cells 2020, 9, 2020. [Google Scholar] [CrossRef]
- Frinchi, M.; Scaduto, P.; Cappello, F.; Belluardo, N.; Mudò, G. Heat shock protein (Hsp) regulation by muscarinic acetylcholine receptor (mAChR) activation in the rat hippocampus. J. Cell Physiol. 2018, 233, 6107–6116. [Google Scholar] [CrossRef] [PubMed]
- Nuzzo, D.; Picone, P.; Giardina, C.; Scordino, M.; Mudò, G.; Pagliaro, M.; Scurria, A.; Meneguzzo, F.; Ilharco, L.; Fidalgo, A.; et al. New Neuroprotective Effect of Lemon IntegroPectin on Neuronal Cellular Model. Antioxidants 2021, 10, 669. [Google Scholar] [CrossRef] [PubMed]
- Lowry, O.H.; Rosebrough, N.J.; Farr, A.L.; Randall, R.J. Protein measurement with the Folin phenol reagent. J. Biol. Chem. 1951, 193, 265–275. [Google Scholar] [CrossRef] [PubMed]
- Frinchi, M.; Di Liberto, V.; Olivieri, M.; Fuxe, K.; Belluardo, N.; Mudo, G. FGF-2/FGFR1 neurotrophic system expression level and its basal activation do not account for the age-dependent decline of precursor cell proliferation in the subventricular zone of rat brain. Brain Res. 2010, 1358, 39–45. [Google Scholar] [CrossRef] [PubMed] [Green Version]
- Masser, A.E.; Ciccarelli, M.; Andréasson, C. Hsf1 on a leash—Controlling the heat shock response by chaperone titration. Exp. Cell Res. 2020, 396, 112246. [Google Scholar] [CrossRef]
- Kucera, O.; Endlicher, R.; Rousar, T.; Lotkova, H.; Garnol, T.; Drahota, Z.; Cervinkova, Z. The effect of tert-butyl hydroperoxide-induced oxidative stress on lean and steatotic rat hepatocytes in vitro. Oxidative Med. Cell. Longev. 2014, 2014, 752506. [Google Scholar] [CrossRef] [Green Version]
- López-Carballo, G.; Moreno, L.; Masiá, S.; Pérez, P.; Barettino, D. Activation of the Phosphatidylinositol 3-Kinase/Akt Signaling Pathway by Retinoic Acid Is Required for Neural Differentiation of SH-SY5Y Human Neuroblastoma Cells. J. Biol. Chem. 2002, 277, 25297–25304. [Google Scholar] [CrossRef] [Green Version]
- Paillaud, E.; Costa, S.; Fages, C.; Plassat, J.; Rochette-Egly, C.; Monville, C.; Tardy, M. Retinoic acid increases proliferation rate of GL-15 glioma cells, involving activation of STAT-3 transcription factor. J. Neurosci. Res. 2002, 67, 670–679. [Google Scholar] [CrossRef]
- Lee, L.T.-O.; Tan-Un, K.-C.; Lin, M.C.-M.; Chow, B.K.-C. Retinoic acid activates human secretin gene expression by Sp proteins and Nuclear Factor I in neuronal SH-SY5Y cells. J. Neurochem. 2005, 93, 339–350. [Google Scholar] [CrossRef]
- de Medeiros, L.M.; De Bastiani, M.A.; Rico, E.P.; Schonhofen, P.; Pfaffenseller, B.; Wollenhaupt-Aguiar, B.; Grun, L.; Barbé-Tuana, F.; Zimmer, E.R.; Castro, M.A.A.; et al. Cholinergic Differentiation of Human Neuroblastoma SH-SY5Y Cell Line and Its Potential Use as an In vitro Model for Alzheimer’s Disease Studies. Mol. Neurobiol. 2019, 56, 7355–7367. [Google Scholar] [CrossRef]
- Presgraves, S.P.; Ahmed, T.; Borwege, S.; Joyce, J.N. Terminally differentiated SH-SY5Y cells provide a model system for studying neuroprotective effects of dopamine agonists. Neurotox. Res. 2004, 5, 579–598. [Google Scholar] [CrossRef] [PubMed]
- Lopes, F.M.; Schröder, R.; da Frota, M.L.C., Jr.; Zanotto-Filho, A.; Müller, C.B.; Pires, A.S.; Meurer, R.T.; Colpo, G.D.; Gelain, D.P.; Kapczinski, F.; et al. Comparison between proliferative and neuron-like SH-SY5Y cells as an in vitro model for Parkinson disease studies. Brain Res. 2010, 1337, 85–94. [Google Scholar] [CrossRef] [PubMed]
- Fulda, S.; Gorman, A.M.; Hori, O.; Samali, A. Cellular Stress Responses: Cell Survival and Cell Death. Int. J. Cell Biol. 2010, 2010, 214074. [Google Scholar] [CrossRef] [Green Version]
- Ikwegbue, P.C.; Masamba, P.; Oyinloye, B.E.; Kappo, A.P. Roles of Heat Shock Proteins in Apoptosis, Oxidative Stress, Human Inflammatory Diseases, and Cancer. Pharmaceuticals 2017, 11, 2. [Google Scholar] [CrossRef] [Green Version]
- Cheng, L.; Smith, D.J.; Anderson, R.L.; Nagley, P. Modulation of Cellular Hsp72 Levels in Undifferentiated and Neuron-Like SH-SY5Y Cells Determines Resistance to Staurosporine-Induced Apoptosis. PLoS ONE 2011, 6, e24473. [Google Scholar] [CrossRef] [Green Version]
- Xiong, J.; Jiang, X.-M.; Mao, S.-S.; Yu, X.-N.; Huang, X.-X. Heat shock protein 70 downregulation inhibits proliferation, migration and tumorigenicity in hepatocellular carcinoma cells. Oncol. Lett. 2017, 14, 2703–2708. [Google Scholar] [CrossRef] [PubMed] [Green Version]
- Guo, D.; Zhang, A.; Huang, J.; Suo, M.; Zhong, Y.; Liang, Y. Suppression of HSP70 inhibits the development of acute lymphoblastic leukemia via TAK1/Egr-1. Biomed. Pharmacother. 2019, 119, 109399. [Google Scholar] [CrossRef]
- Ambrose, A.J.; Chapman, E. Function, Therapeutic Potential, and Inhibition of Hsp70 Chaperones. J. Med. Chem. 2021, 64, 7060–7082. [Google Scholar] [CrossRef]
- Miller, D.J.; Fort, P.E. Heat Shock Proteins Regulatory Role in Neurodevelopment. Front. Neurosci. 2018, 12, 821. [Google Scholar] [CrossRef] [Green Version]
- Kwon, H.J.; Kim, W.; Jung, H.Y.; Kang, M.S.; Kim, J.W.; Hahn, K.R.; Yoo, D.Y.; Yoon, Y.S.; Hwang, I.K.; Kim, D.W. Heat shock protein 70 increases cell proliferation, neuroblast differentiation, and the phosphorylation of CREB in the hippocampus. Lab. Anim. Res. 2019, 35, 21. [Google Scholar] [CrossRef]
- Zheng, X.; Krakowiak, J.; Patel, N.; Beyzavi, A.; Ezike, J.; Khalil, A.S.; Pincus, D. Dynamic control of Hsf1 during heat shock by a chaperone switch and phosphorylation. Elife 2016, 5, e18638. [Google Scholar] [CrossRef] [PubMed] [Green Version]
- Zhang, H.; Gong, W.; Wu, S.; Perrett, S. Hsp70 in Redox Homeostasis. Cells 2022, 11, 829. [Google Scholar] [CrossRef] [PubMed]
- Sies, H.; Berndt, C.; Jones, D.P. Oxidative Stress. Annu. Rev. Biochem. 2017, 86, 715–748. [Google Scholar] [CrossRef] [PubMed]
- Floyd, R.A. Antioxidants, Oxidative Stress, and Degenerative Neurological Disorders. Proc. Soc. Exp. Boil. Med. 1999, 222, 236–245. [Google Scholar] [CrossRef]
- Barnham, K.J.; Masters, C.L.; Bush, A.I. Neurodegenerative diseases and oxidative stress. Nat. Rev. Drug Discov. 2004, 3, 205–214. [Google Scholar] [CrossRef]
- Watanabe, S.; Ageta-Ishihara, N.; Nagatsu, S.; Takao, K.; Komine, O.; Endo, F.; Miyakawa, T.; Misawa, H.; Takahashi, R.; Kinoshita, M.; et al. SIRT1 overexpression ameliorates a mouse model of SOD1-linked amyotrophic lateral sclerosis via HSF1/HSP70i chaperone system. Mol. Brain 2014, 7, 62. [Google Scholar] [CrossRef] [Green Version]
- Schneider, L.; Giordano, S.; Zelickson, B.R.; Johnson, M.S.; Benavides, G.A.; Ouyang, X.; Fineberg, N.; Darley-Usmar, V.M.; Zhang, J. Differentiation of SH-SY5Y cells to a neuronal phenotype changes cellular bioenergetics and the response to oxidative stress. Free. Radic. Biol. Med. 2011, 51, 2007–2017. [Google Scholar] [CrossRef] [Green Version]
- Piras, S.; Furfaro, A.L.; Brondolo, L.; Passalacqua, M.; Marinari, U.M.; Pronzato, M.A.; Nitti, M. Differentiation impairs Bach1 dependent HO-1 activation and increases sensitivity to oxidative stress in SH-SY5Y neuroblastoma cells. Sci. Rep. 2017, 7, 7568. [Google Scholar] [CrossRef] [Green Version]
- Forster, J.I.; Köglsberger, S.; Trefois, C.; Boyd, O.; Baumuratov, A.S.; Buck, L.; Balling, R.; Antony, P.M.A. Characterization of Differentiated SH-SY5Y as Neuronal Screening Model Reveals Increased Oxidative Vulnerability. J. Biomol. Screen. 2016, 21, 496–509. [Google Scholar] [CrossRef] [Green Version]
- Deguil, J.; Perault-Pochat, M.-C.; Chavant, F.; Lafay-Chebassier, C.; Fauconneau, B.; Pain, S. Activation of the protein p7OS6K via ERK phosphorylation by cholinergic muscarinic receptors stimulation in human neuroblastoma cells and in mice brain. Toxicol. Lett. 2008, 182, 91–96. [Google Scholar] [CrossRef]
- Di Liberto, V.; Mudò, G.; Belluardo, N. Crosstalk between receptor tyrosine kinases (RTKs) and G protein-coupled receptors (GPCR) in the brain: Focus on heteroreceptor complexes and related functional neurotrophic effects. Neuropharmacology 2019, 152, 67–77. [Google Scholar] [CrossRef] [PubMed]
- Di Liberto, V.; Borroto-Escuela, D.; Frinchi, M.; Verdi, V.; Fuxe, K.; Belluardo, N.; Mudò, G. Existence of muscarinic acetylcholine receptor (mAChR) and fibroblast growth factor receptor (FGFR) heteroreceptor complexes and their enhancement of neurite outgrowth in neural hippocampal cultures. Biochim. et Biophys. Acta (BBA)—Gen. Subj. 2017, 1861, 235–245. [Google Scholar] [CrossRef] [PubMed]
- Liberto, V.; Mudo, G.; Fuxe, K.; Belluardo, N. Interactions Between Cholinergic and Fibroblast Growth Factor Receptors in Brain Trophism and Plasticity. Curr. Protein Pept. Sci. 2014, 15, 691–702. [Google Scholar] [CrossRef] [PubMed]
- Di Liberto, V.; Frinchi, M.; Verdi, V.; Vitale, A.; Plescia, F.; Cannizzaro, C.; Massenti, M.F.; Belluardo, N.; Mudò, G. Anxiolytic effects of muscarinic acetylcholine receptors agonist oxotremorine in chronically stressed rats and related changes in BDNF and FGF2 levels in the hippocampus and prefrontal cortex. Psychopharmacology 2017, 234, 559–573. [Google Scholar] [CrossRef]
- Frinchi, M.; Nuzzo, D.; Picone, P.D.; Scaduto, P.; Di Carlo, M.; Massenti, M.F.; Belluardo, N.; Mudò, G. Anti-inflammatory and antioxidant effects of muscarinic acetylcholine receptor (mAChR) activation in the rat hippocampus. Sci. Rep. 2019, 9, 14233. [Google Scholar] [CrossRef] [Green Version]
- Nuzzo, D.; Frinchi, M.; Giardina, C.; Scordino, M.; Zuccarini, M.; De Simone, C.; Di Carlo, M.; Belluardo, N.; Mudò, G.; Di Liberto, V. Neuroprotective and Antioxidant Role of Oxotremorine-M, a Non-selective Muscarinic Acetylcholine Receptors Agonist, in a Cellular Model of Alzheimer Disease. Cell Mol. Neurobiol. 2022, 42, 1–16. [Google Scholar] [CrossRef]
- Balaban, H.; Nazıroğlu, M.; Demirci, K.; Övey, I.S. The Protective Role of Selenium on Scopolamine-Induced Memory Impairment, Oxidative Stress, and Apoptosis in Aged Rats: The Involvement of TRPM2 and TRPV1 Channels. Mol. Neurobiol. 2017, 54, 2852–2868. [Google Scholar] [CrossRef]
- Wong-Guerra, M.; Jiménez-Martin, J.; Pardo-Andreu, G.L.; Fonseca-Fonseca, L.A.; Souza, D.O.; De Assis, A.M.; Ramirez-Sanchez, J.; Del Valle, R.M.-S.; Nuñez-Figueredo, Y. Mitochondrial involvement in memory impairment induced by scopolamine in rats. Neurol. Res. 2017, 39, 649–659. [Google Scholar] [CrossRef]
- Laspas, P.; Zhutdieva, M.B.; Brochhausen, C.; Musayeva, A.; Zadeh, J.K.; Pfeiffer, N.; Xia, N.; Li, H.; Wess, J.; Gericke, A. The M1 muscarinic acetylcholine receptor subtype is important for retinal neuron survival in aging mice. Sci. Rep. 2019, 9, 5222. [Google Scholar] [CrossRef] [Green Version]
- Xin, R.; Chen, Z.; Fu, J.; Shen, F.; Zhu, Q.; Huang, F. Xanomeline Protects Cortical Cells from Oxygen-Glucose Deprivation via Inhibiting Oxidative Stress and Apoptosis. Front. Physiol. 2020, 11, 656. [Google Scholar] [CrossRef]


Disclaimer/Publisher’s Note: The statements, opinions and data contained in all publications are solely those of the individual author(s) and contributor(s) and not of MDPI and/or the editor(s). MDPI and/or the editor(s) disclaim responsibility for any injury to people or property resulting from any ideas, methods, instructions or products referred to in the content. |
© 2023 by the authors. Licensee MDPI, Basel, Switzerland. This article is an open access article distributed under the terms and conditions of the Creative Commons Attribution (CC BY) license (https://creativecommons.org/licenses/by/4.0/).
Share and Cite
Scordino, M.; Frinchi, M.; Urone, G.; Nuzzo, D.; Mudò, G.; Di Liberto, V. Manipulation of HSP70-SOD1 Expression Modulates SH-SY5Y Differentiation and Susceptibility to Oxidative Stress-Dependent Cell Damage: Involvement in Oxotremorine-M-Mediated Neuroprotective Effects. Antioxidants 2023, 12, 687. https://doi.org/10.3390/antiox12030687
Scordino M, Frinchi M, Urone G, Nuzzo D, Mudò G, Di Liberto V. Manipulation of HSP70-SOD1 Expression Modulates SH-SY5Y Differentiation and Susceptibility to Oxidative Stress-Dependent Cell Damage: Involvement in Oxotremorine-M-Mediated Neuroprotective Effects. Antioxidants. 2023; 12(3):687. https://doi.org/10.3390/antiox12030687
Chicago/Turabian StyleScordino, Miriana, Monica Frinchi, Giulia Urone, Domenico Nuzzo, Giuseppa Mudò, and Valentina Di Liberto. 2023. "Manipulation of HSP70-SOD1 Expression Modulates SH-SY5Y Differentiation and Susceptibility to Oxidative Stress-Dependent Cell Damage: Involvement in Oxotremorine-M-Mediated Neuroprotective Effects" Antioxidants 12, no. 3: 687. https://doi.org/10.3390/antiox12030687