Article

Bacterial Volatiles (mVOC) Emitted by the Phytopathogen Erwinia amylovora Promote Arabidopsis thaliana Growth and Oxidative Stress

by
Ambra S. Parmagnani
1,†,
Chidananda Nagamangala Kanchiswamy
2,†,‡,
Ivan A. Paponov
3,
Simone Bossi
1,
Mickael Malnoy
2 and
Massimo E. Maffei
1,*
1
Department of Life Sciences and Systems Biology, University of Turin, Via Quarello 15/a, 10135 Turin, Italy
2
Research and Innovation Centre, Edmund Mach Foundation, Via Edmund Mach 1, 38098 San Michele all’Adige, Italy
3
Department of Food Science, Aarhus University, 8200 Aarhus, Denmark
*
Author to whom correspondence should be addressed.
These authors contributed equally to this work.
Current address: Unit 3D, North Point House, North Business Park, North Mallow Road, T23 AT2P Cork, Ireland.
Antioxidants 2023, 12(3), 600; https://doi.org/10.3390/antiox12030600
Submission received: 6 February 2023 / Revised: 21 February 2023 / Accepted: 25 February 2023 / Published: 28 February 2023
(This article belongs to the Special Issue Antioxidant Mechanisms in Plants)

Abstract

:
Phytopathogens are well known for their devastating activity that causes worldwide significant crop losses. However, their exploitation for crop welfare is relatively unknown. Here, we show that the microbial volatile organic compound (mVOC) profile of the bacterial phytopathogen, Erwinia amylovora, enhances Arabidopsis thaliana shoot and root growth. GC-MS head-space analyses revealed the presence of typical microbial volatiles, including 1-nonanol and 1-dodecanol. E. amylovora mVOCs triggered early signaling events including plasma transmembrane potential Vm depolarization, cytosolic Ca2+ fluctuation, K+-gated channel activity, and reactive oxygen species (ROS) and nitric oxide (NO) burst from few minutes to 16 h upon exposure. These early events were followed by the modulation of the expression of genes involved in plant growth and defense responses and responsive to phytohormones, including abscisic acid, gibberellin, and auxin (including the efflux carriers PIN1 and PIN3). When tested, synthetic 1-nonanol and 1-dodecanol induced root growth and modulated genes coding for ROS. Our results show that E. amylovora mVOCs affect A. thaliana growth through a cascade of early and late signaling events that involve phytohormones and ROS.

1. Introduction

The economic importance of the Gram-negative bacterium Erwinia amylovora (fire blight, Enterobacteriaceae) is increasing with the outbreak of old disease bacterial speck of apple and pear and other commercial and ornamental Rosaceae host plants [1]. E. amylovora secretes effectors and proteins that are involved in the hypersensitive response and pathogenicity [2]. Plants are sessile, multicellular organisms that rely on developmental and metabolic changes for growth. Extensive communication occurs between plants and microorganisms during different stages of plant development, in which signaling molecules from the two partners play an important role [3,4]. Fungal and bacterial species are able to detect the plant host and initiate their colonization strategies in the rhizosphere by producing canonical plant growth-regulating substances such as auxins or cytokinins [5]. On the other hand, plants are able to recognize microbe-derived compounds and adjust their defense and growth responses according to the type of microorganism encountered [6]. This molecular dialogue will determine the final outcome of the relationship, ranging from pathogenesis to symbiosis, usually through highly coordinated cellular processes [7]. Bacterial and fungal phytopathogens are not restricted to infecting shoot or root tissues exclusively, and as such, communication between the shoot and root can confer a survival advantage to the plant and potentially limit or prevent diseases. For instance, beneficial bacteria and fungi can confer immunity against a wide range of foliar diseases by activating plant defenses, thereby reducing a plant’s susceptibility to pathogen attack [3,8]. For many years this phenomenon was considered the basis by which beneficial microorganisms could increase plant growth when inoculated in crops; however, it is quite evident that novel microbial signals play important roles in plant morphogenesis [3].
Plants activate various barriers and defensive strategies to protect against the attack of pathogens [9]. The first line of defense is triggered by the recognition of invariant microbial epitopes known as pathogen-associated molecular patterns (PAMPs) for the recognition of potential pathogens in the innate immune system of both plants and animals that are so-called elicitors [10]. Both animals and plants can recognize invariant PAMPs [11] that are characteristic of pathogenic microorganisms by pattern recognition receptors (PRRs) in the plasma membrane [9]. In leaves and roots, PAMPs recognition triggers nitric oxide (NO) and reactive oxygen species (ROS) production, as well as a complex cascade of MAP kinases that lead to the activation of transcription factors and defense response genes [12].
Recent discoveries reveal that microbial volatile organic compounds (mVOCs) influence plant growth and defense modulation [13,14,15,16], which has been confirmed by several studies using different bacterial strains and plant models; however, the signaling molecules responsible for the observed effects, as well as the molecular mechanisms underneath this phenomenon are poorly understood [17,18,19]. There have been relatively few studies to detect and understand how plants recognize the presence of bacterial volatiles, how they prime themselves to "get ready" for phytopathogens, and how they promote symbiont association. Therefore, it is important to understand these mechanisms in order to develop sustainable strategies to combat pathogen attacks on food/feed crop plants.
In this study, we aim to understand the mechanisms underpinning Arabidopsis thaliana’s early and late responses to Erwinia amylovora volatiles. Thereby, we characterized E. amylovora mVOCs and investigated the effects of bacterial volatiles on plasma membrane depolarization, cytosol fluctuations of Ca2+ concentration, K+ efflux, and levels of ROS and NO in shoots and roots of A. thaliana plants. Furthermore, we carried out gene expression analysis, identifying the most differentially expressed genes (DEGs) regulated by E. amylovora volatiles. Finally, we used two synthetic mVOCs to assess their effect on A. thaliana growth and ROS gene expression.

2. Materials and Methods

2.1. Plant and Bacterial Co-Cultivation

Arabidopsis thaliana Col0 seeds were surface sterilized (2 min 70% ethanol, 5 min 5% calcium hypochlorite, rinsed four times with autoclaved water) and placed on bipartite squared Petri dish containing in the upper part half-strength Murashige–Skoog medium (MS medium) and in the lower part a nutrient agar II (NA II; peptone from casein 3.5 gL−1, peptone from meat 2.5 gL−1, peptone from gelatin 2.5 gL−1, yeast extract 1.5 gL−1, NaCl 5 gL−1, and agar–agar 15 gL−1, pH 7.2). The seeds were vernalized for 3 days at 4 °C in the absence of light, then placed in a growth chamber (16 h light/8 h darkness/light with a fluorescent light of about 70 μmol photons m−2 s−1). Erwinia amylovora strain E273 was obtained from the bacterial collection of Dr. Malnoy Lab and was added to the co-culture at given times (from 30 min to 16 h). In order to standardize the experiments, the same number of seeds and the same amount of E. amylovora CFU were always used. Samples of roots and shoots of A. thaliana seedlings were collected at different times of E. amylovora mVOCs exposure and immediately frozen in liquid nitrogen and stored at −80 °C.

2.2. Head Space Analysis of E. amylovora mVOCs

Extraction of E. amylovora (strain E273) mVOC was performed by stir bar sorptive extraction (SBSE) by following the same protocol used to extract truffle volatiles in a previous study [20]. Briefly, a stir bar (SB) was attached to the cover lid of the Petri dish by using an external magnet. After 16 h exposure, the SB was desorbed with a Gerstel (GmbH & Co.KG, Mülheim an der Ruhr, Germany) twister desorption unit (TDU), which was connected to a cooled injection system (CIS) that cryoinjected the desorpted molecules into a gas-chromatograph mass spectrometry system as previously described [20]. mVOCs identification was performed by comparison with spectra in mass spectra databases (NIST®), comparison of Kovàts retention indices to the literature data and in-house database, and in some cases, direct GC-MS comparison with authentic standards.

2.3. Membrane Potential Determination

A. thaliana root and leaf transmembrane potential variations (Vm) were obtained as previously reported [21]. Vm variations were recorded both on a pen recorder and through a digital port of a PC using a data logger. The results of Vm are shown as the average number of at least 50 Vm measurements.

2.4. Evaluation of Intracellular Calcium Variations by Confocal Laser Scanning Microscopy Usign Calcium Orange

Confocal laser scanning microscopy (CLSM) was used to localize the intracellular calcium efflux by using the calcium orange dye (stock solution in DMSO, Molecular Probes, Leiden, The Netherlands). Roots and shoots of A. thaliana exposed to E. amylovora mVOC were sampled from 30 min to 3 h of exposure and, after incubation with 5 µM calcium orange, were observed directly on a Nikon Eclipse C1 spectral CLSM. The microscope operates with a Krypton/Argon laser at 488 nm with a BP of 500–540 nm and an LP of 650 nm. Digital images were analyzed using the NIH image software as described earlier [22]. Controls were represented by the application of 5 µM calcium orange solution to unexposed tissues.

2.5. Localization of Voltage-Gated K+ Channels (VGKC) and Ligand-Gated or Resting Inward Rectifier K+ Channels (LG/RIRKC) Using FluxORTM

VGKC and LG/RIRKC were assayed from 30 min to 3 h by using the FluxORTM Potassium Ion Channel Kit from Invitrogen (Molecular Probes, Leiden, The Netherlands). mVOC-exposed and unexposed A. thaliana seedlings were incubated in the dark for 1 h with 100 µL of loading buffer (deionized water, FluxORTM assay buffer, and probenecid) by following the manufacturer’s instructions. Just before observation, 50 µL of stimulus buffer (deionized water, FluxORTM chloride-free buffer, K2SO4, and Tl2SO4) was added by following the manufacturer’s instructions. CLSM fluorescence was assayed by Nikon Eclipse C1 spectral CLSM, as previously described [23].

2.6. Localization of H2O2 by CLSM Using Amplex Red

A. thaliana seedlings exposed to E. amylovora mVOCs and unexposed control seedlings were assayed from 3 h to 16 h after incubation with the dye 10-acetyl-3,7-dihydroxyphenoxazine (Amplex Red) as described earlier [21,24]. Tissues were observed with a Nikon Eclipse C1 spectral CLSM, and scans were recorded using a Laser Ar (458 nm/5 mW; 476 nm/5 mW; 488 nm/20 mW; 514 nm/20 mW), a Laser HeNe 543 nm/1.20 mW, and a Laser HeNe 633 nm/10 mW.

2.7. Determination of Nitric Oxide with 4,5-diaminofluorescein Diacetate (DAF-FM DA) Using CLSM

mVOC-exposed and unexposed A. thaliana seedlings were assayed from 3 h to 16 h to analyze NO accumulation by CLSM using 50 μL of loading buffer (10 μM DAF-FM DA (Molecular Probes)). The Nikon Eclipse C1 spectral CLSM operated with an argon laser with an excitation wavelength of 488 nm. Emissions were recorded using a 508 to 525 nm band pass filter. Carboxy-2-phenyl-4,4,5,5-tetra-methylimidazolinone-3-oxide-1-oxyl (cPTIO) (Sigma, Milan, Italy), an NO scavenger, was dissolved in DMSO and used at a final concentration of 1 mM. The treated tissues were perfused with cPTIO as described above before being stained with DAF-FM DA.

2.8. RNA Extraction from Arabidopsis Shoots and Roots upon Exposure to E. amylovora mVOCs

One hundred milligrams of frozen A. thaliana roots and shoots exposed for 16 h to E. amylovora mVOCs was ground in liquid nitrogen, and total RNA was isolated and its quality and quantity checked as previously described [25]. Quantification of RNA was also confirmed spectrophotometrically by using a NanoDrop ND-1000 (Thermo Fisher Scientific, Waltham, MA, USA).

2.9. cDNA Synthesis and Gene Microarray Analyses (Including MIAME)

Five hundred nanograms of total RNA of four biological replicates was reverse-transcribed into double-stranded cDNA, which was then transcribed into antisense cRNA and labeled with either Cy3-CTP or Cy5-CTP fluorescent dyes for 2 h at 40 °C as reported before [25]. Cyanine-labeled cRNAs were purified using the RNeasy Minikit (Qiagen, Hilden, Germany). Purity and dye incorporation were assessed as previously described [25]. Then, 825 ng of unexposed control Cy3-RNAs and 825 ng of mVOC exposed treated Cy5-RNAs were pooled together and hybridized using the Gene Expression Hybridization Kit (Agilent Technologies, Santa Clara, CA, USA) onto 4 × 44 K A. thaliana (v3) Oligo Microarray (Agilent Technologies). The microarray experiment followed a direct 2 × 2 factorial two-color design. This resulted in two-color arrays, satisfying the Minimum Information About a Microarray Experiment (MIAME) requirements [26]. Microarrays were scanned as reported before [25]. The microarray data have been deposited in NCBI’s Gene Expression Omnibus [27] (GSM6994948 to GSM6994951) and are accessible through GEO Series accession number GSE223760 (https://www.ncbi.nlm.nih.gov/geo/query/acc.cgi?acc=GSE223760 (accessed on 26 January 2023)).

2.10. Validation of Microarray Data by Real-Time PCR

Validation of microarray data was performed by qPCR, which was performed on a QuantStudio 3 Real-Time PCR System (Applied Biosystems, Foster City, CA, USA) using the same cDNA products obtained as previously described (Section 2.9). The amplification was carried out with the primers listed in Supplementary Table S1, while the reaction was performed using the Maxima SYBR Green/ROX qPCR Master Mix Kit (Thermo Fisher Scientific, Waltham, MA, USA) in 25 µL of total volume. The thermocycling was performed using a two-step cycling protocol: 50 °C for 2 min, 95 °C for 10 min, 95 °C for 15 s and 60 °C for 60 s. The last two steps were repeated for 40 cycles. All primers were designed using Primer 3 software. Two different reference genes actin1 (ACT1, At2g37620) and the elongation factor 1B alpha-subunit 2 (eEF1Balpha2, At5g19510) were used to normalize the results of qPCR; the most stable gene was ACT1. All amplification plots were analyzed with the QuantStudio Design and Analysis software (Applied Biosystem, Foster City, CA, USA) to obtain Ct values. Relative RNA levels were calibrated and normalized with the level of ACT1 mRNA.

2.11. Expression Analysis of PIN1 and PIN3

Seeds of A. thaliana PIN1::GUS, PIN3::GUS, DR5::GUS, PIN1:GFP, and PIN3:GFP were obtained from the Institut für Biologie II, Freiburg, Germany, in 2006 and multiplied in our labs. Histochemical staining for GUS activity was performed using a modified indigogenic method with 5-bromo-4-chloro-3-indoxyl β-D glucuronide (X-Gluc, Sigma) as substrate according to [28]. For all comparisons between mVOC-exposed samples and controls, identical staining conditions were used. GFP was visualized in 5% glycerol without fixation. Microscopy was done with the same microscopy described above.
Time-course gene expression of PIN1 (AT1G73590) and PIN3 (AT1G70940) was assayed from 3 h to 16 h by qRT-PCR as described in Section 2.10.

2.12. Exposure of A. thaliana to Synthetic 1-nonanol or 1-dodecanol

Eight-day-old seedlings of A. thaliana cultivated as described in Section 2.1 were grown for 72 h in the presence of 20, 50, and 100 µg of either 1-nonanol or 1-dodecanol (pure standards from Fisher Scientific, Rodano (MI), Italy) dissolved in DMSO. Control plates were treated with DMSO. Agar was carved with a sterilized comb, and sterilized filter paper was placed inside the hole (see Supplementary Figure S1). 1-Nonanol or 1-dodecanol was dissolved in DMSO to obtain a 100 mM solution, from which aliquots were taken and deposited on the filter paper to obtain the desired quantity. Plates were scanned just after the insertion of the volatiles and after 72 h. Then roots and shoots of the seedlings were separately collected and immediately frozen in liquid nitrogen for further analyses. Root and shoot morphology were analyzed with NIH ImageJ software (https://imagej.net/ij/, accessed on 3 January 2023).

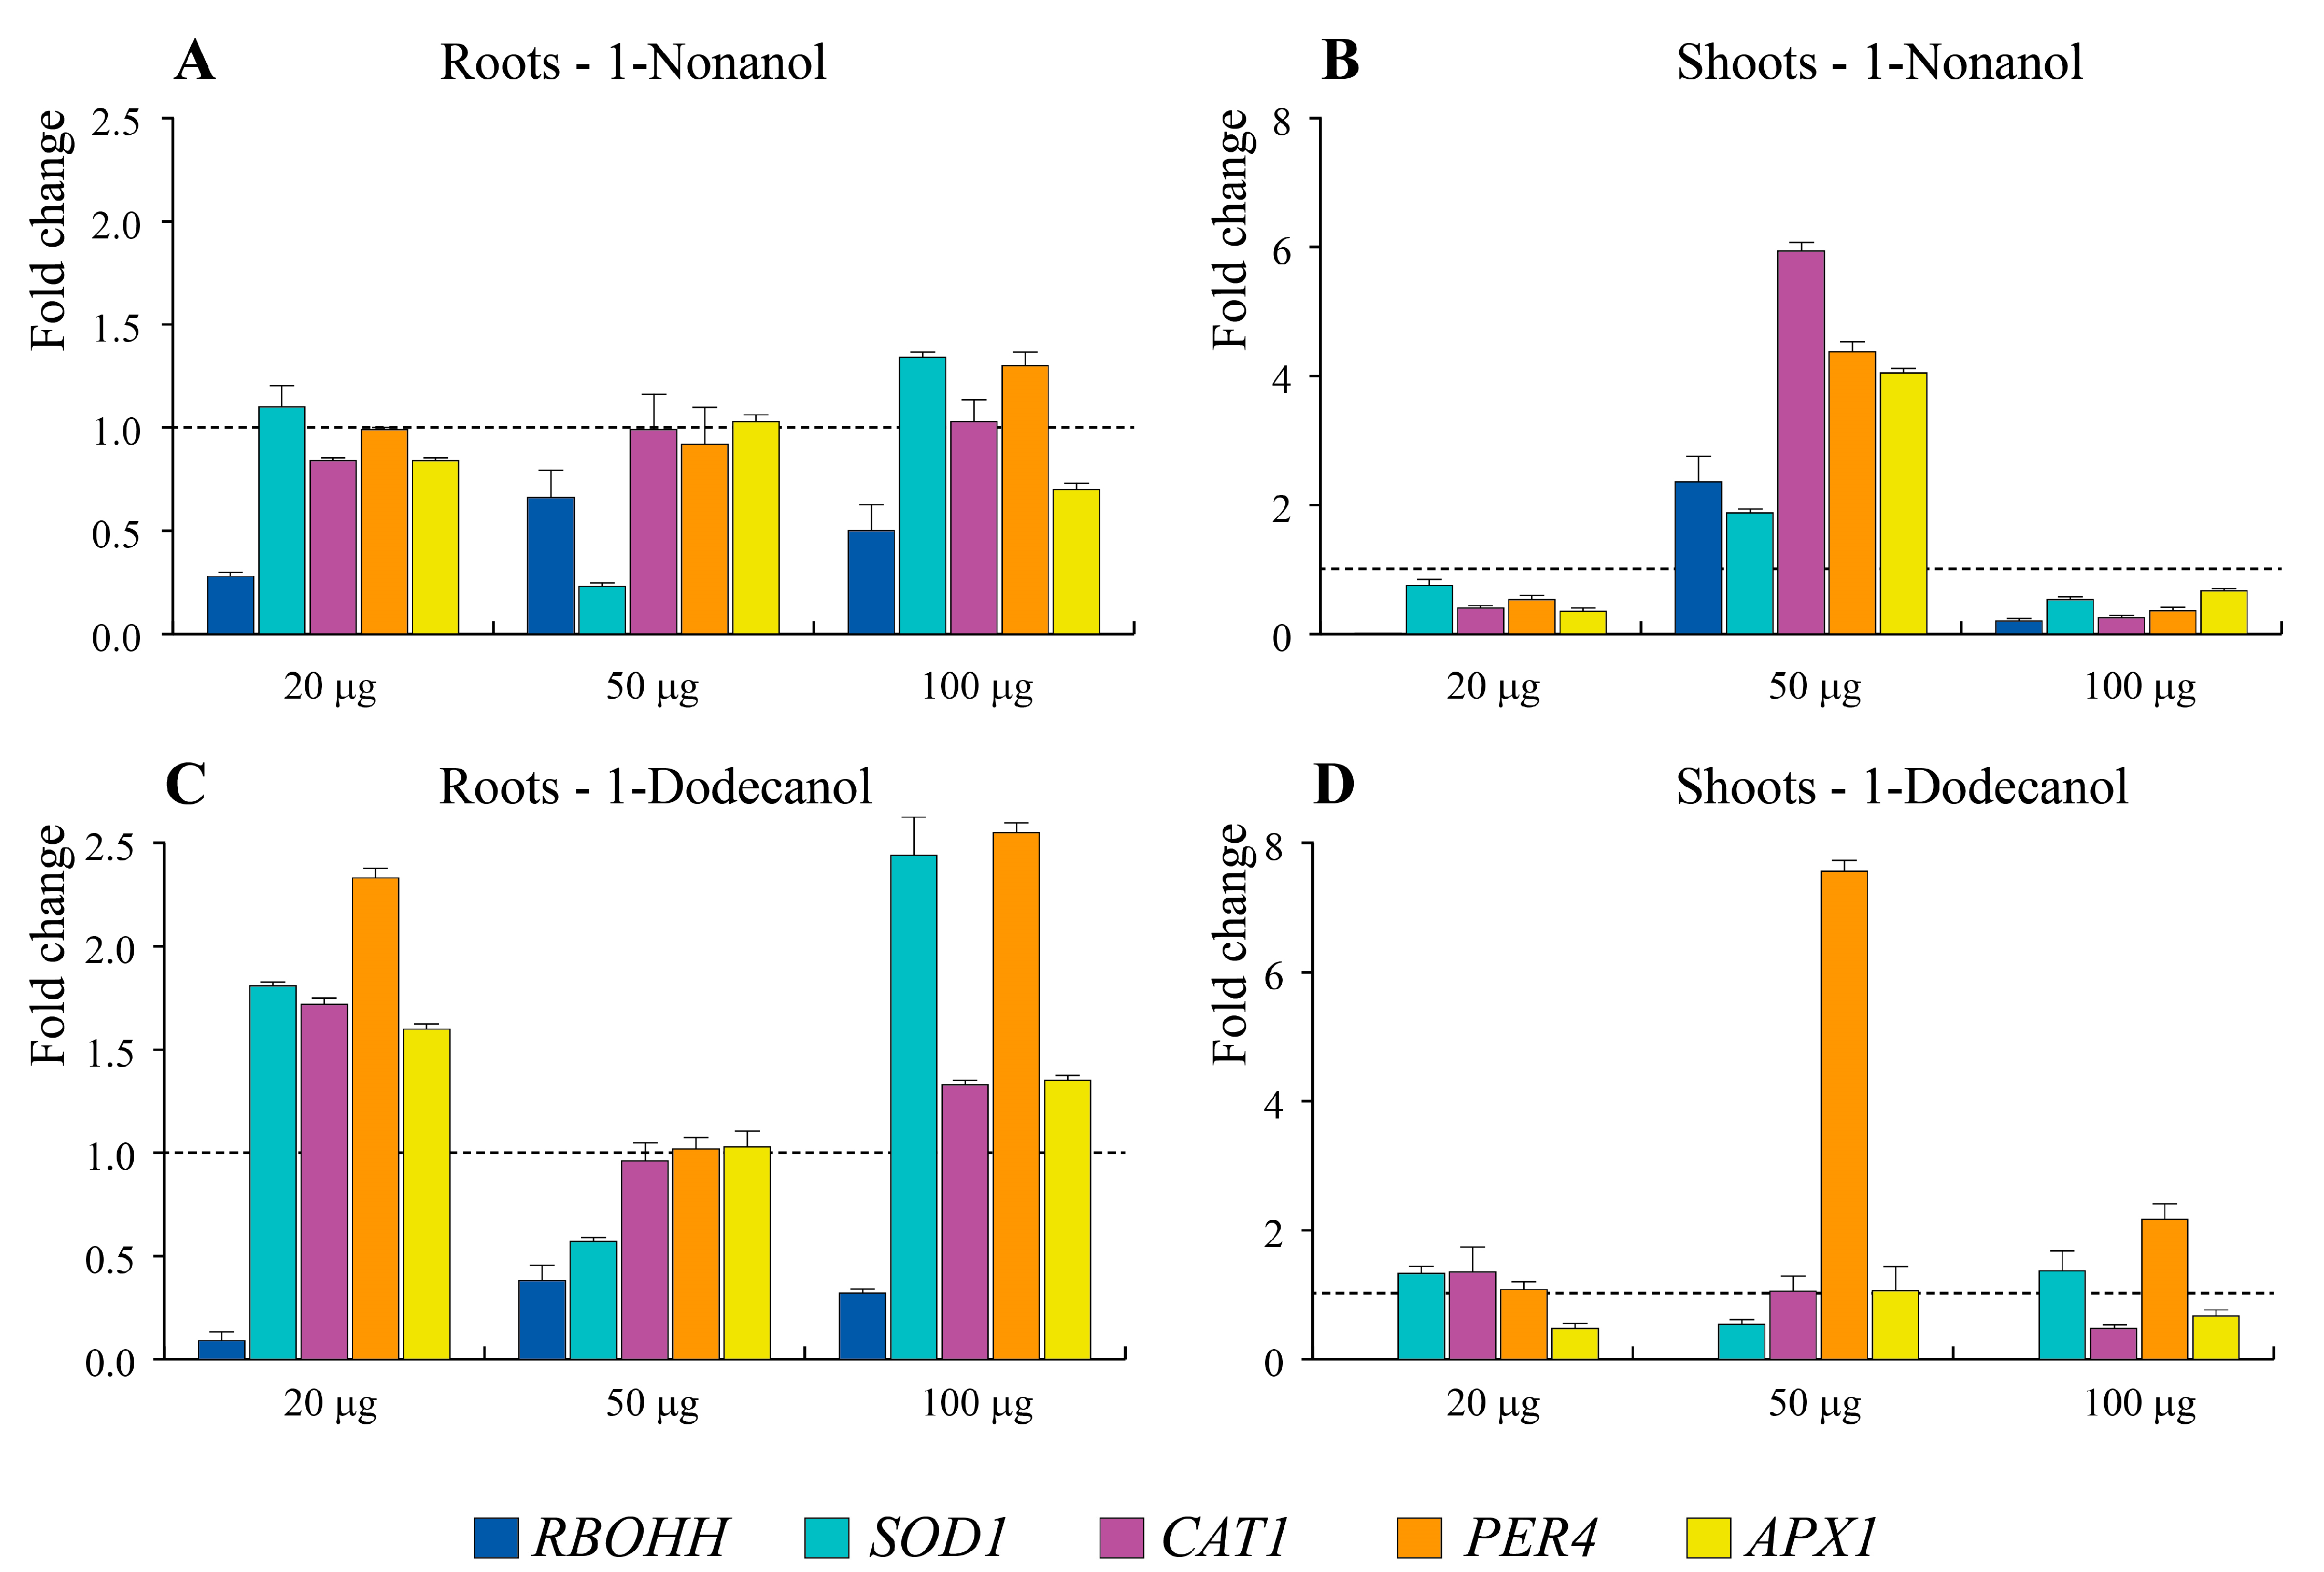
2.13. Gene Expression of RBOHH, SOD1, CAT1, PER4 and APX1 of A. thaliana Exposed to Synthetic mVOCs

One hundred milligrams of frozen A. thaliana roots and shoots exposed for 72 h to different concentrations of 1-nonanol or 1-dodecanol was ground in liquid nitrogen and total RNA was isolated and quantified as described in Section 2.8. Five hundred nanograms of total RNA of three biological replicates was reverse-transcribed into double-stranded cDNA which was transcribed into antisense cRNA and labeled as described in Section 2.9. The amplification was carried out with the primers listed in Supplementary Table S1, and the reaction was performed as described in Section 2.9. The reference genes actin1 (ACT1, At2g37620) and the elongation factor 1B alpha-subunit 2 (eEF1Balpha2, At5g19510) were used as described in Section 2.9, and the relative RNA levels were calibrated and normalized with the level of ACT1 mRNA.

2.14. Statistical Analysis

At least three biological replicates were performed for the CLSM, qRT-PCR, and GC-MS analyses. The mean value was calculated along with the SD. A stem-and-leaf function of Systat 10 was used to treat Vm data to extract the lower and upper hinges from the Gaussian distribution. After filtering the data, the mean value was calculated along with the SD. Processing and statistical analysis of the microarray data were performed in GeneSpring software and with R using the Bioconductor package limma [29]. The raw microarray data are subjected to background subtraction and lowess normalization. Agilent control probes were filtered out. The GeneSpring software was used for finding differentially expressed genes (DEGs). GO enrichment information for the differently expressed probe sets was obtained from The A. thaliana Information Resource (https://www.arabidopsis.org/index.jsp (accessed on 3 January 2023)). The protein–protein association and interaction of the DEGs identified in this work were obtained using STRING [30] and by considering known, predicted, and other types of interactions.

3. Results and Discussion

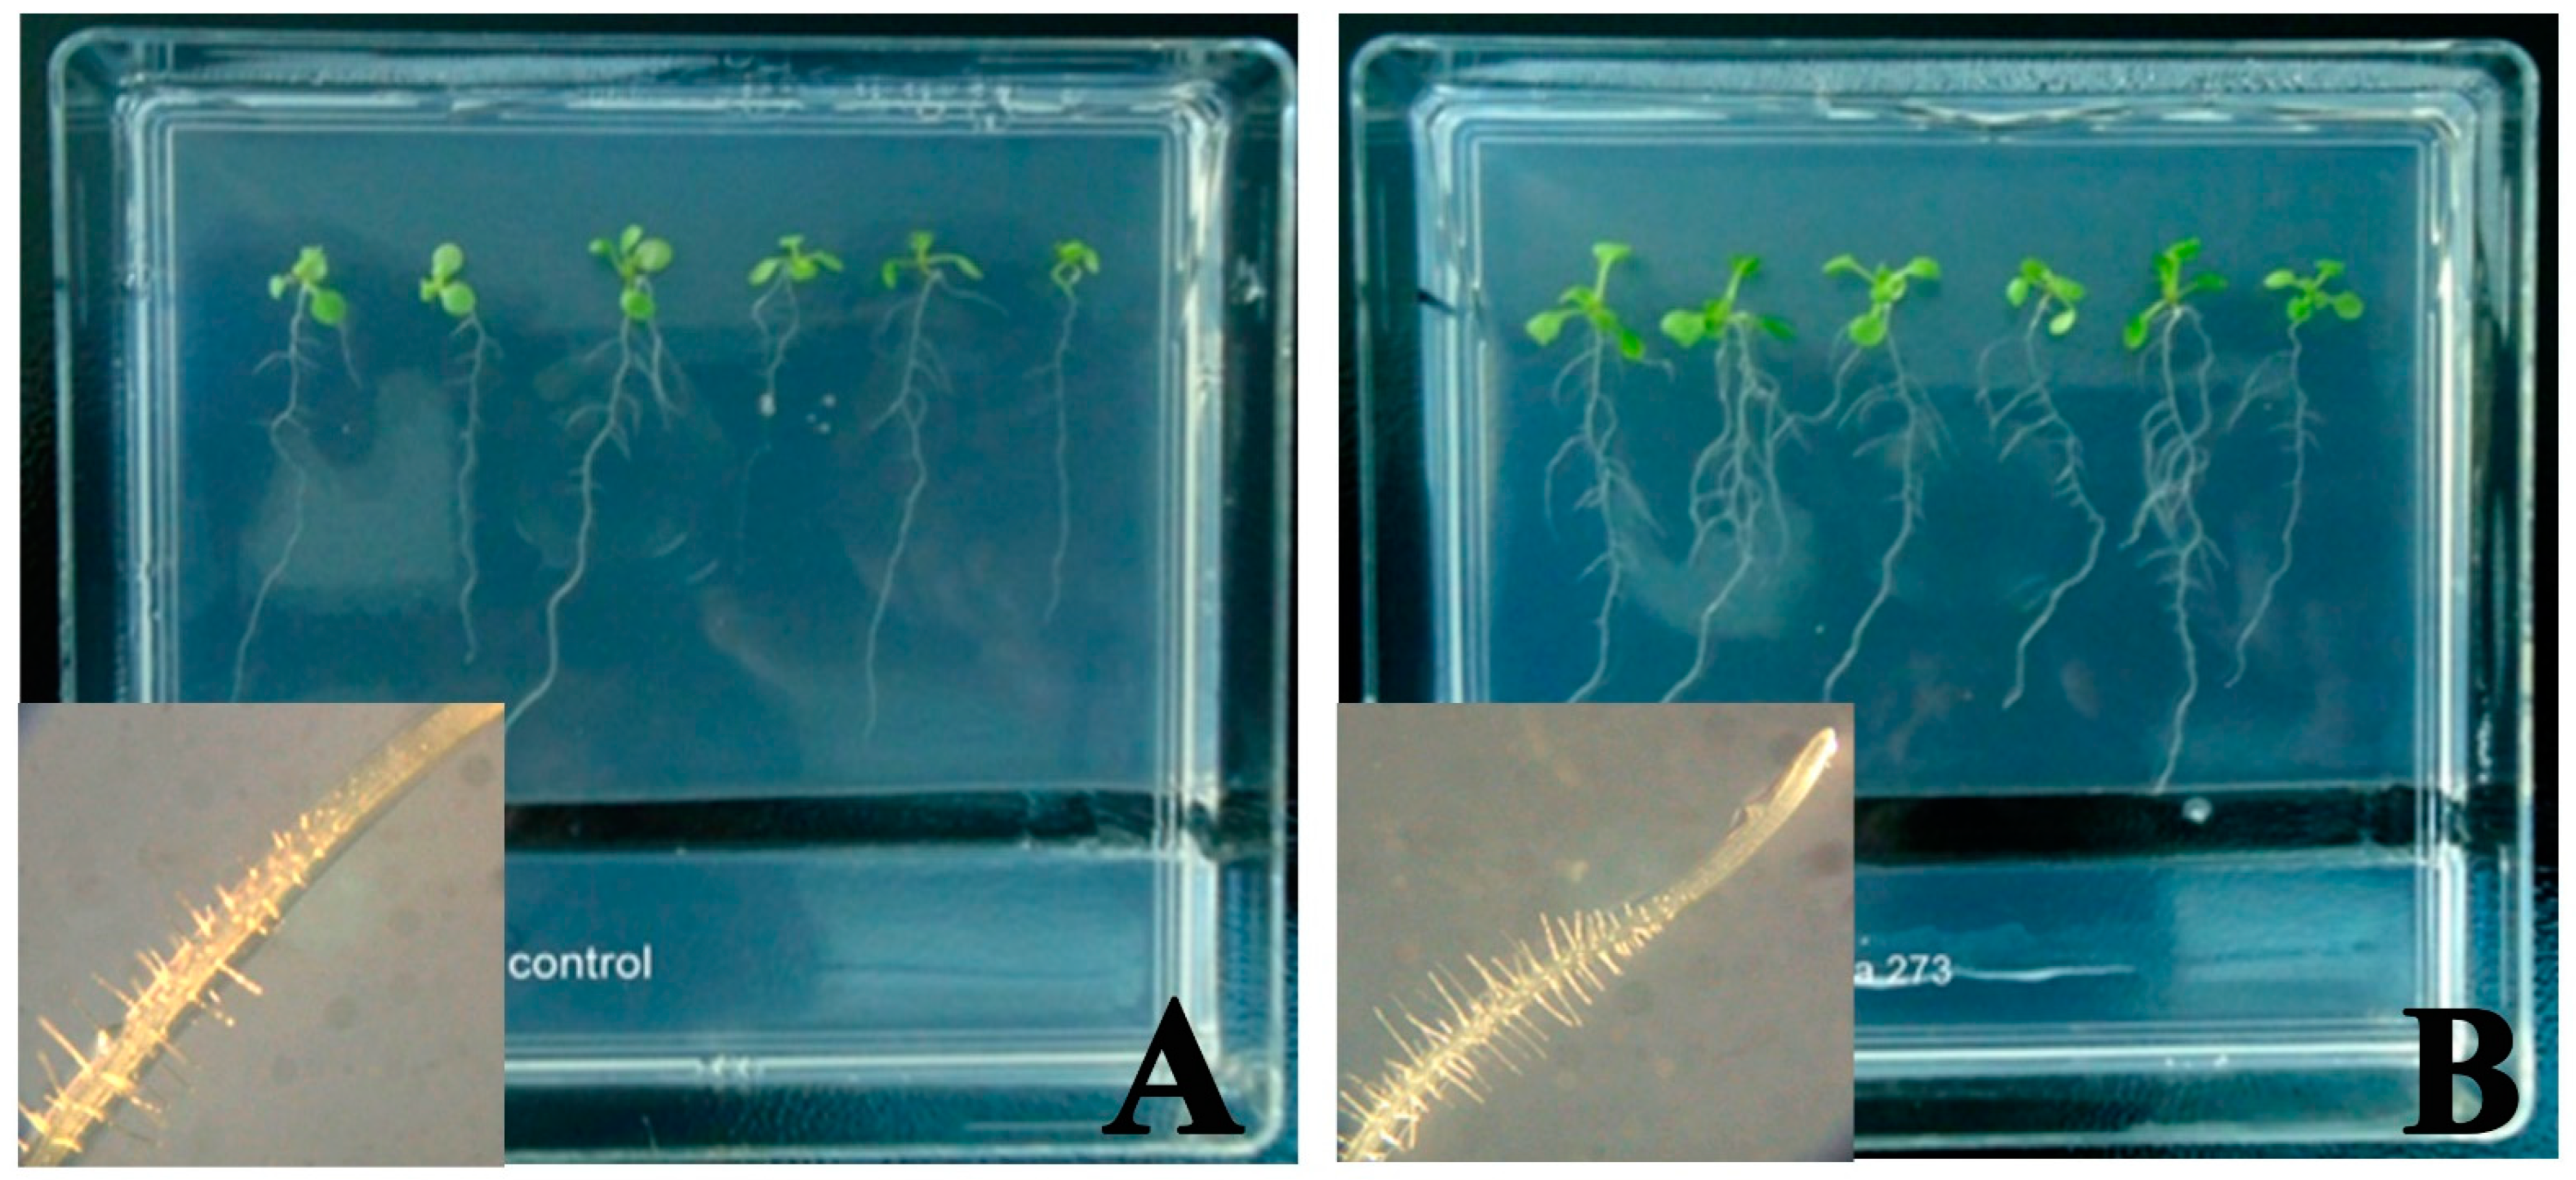
3.1. Erwnia Amylovora mVOCs Promote Arabidopsis Shoot and Root Growth

To investigate the effect of mVOC on A. thaliana growth, we cultivated A. thaliana seedlings in the presence of E. amylovora mVOCs on the same square Petri dishes with no physical contact between them. This method, hereafter referred to as headspace co-cultivation (HSCC), allows the cultivation of plants and microorganisms in the same environment by using specific culture media. To overcome any effect on plant health and development induced by carbon dioxide accumulation from bacterial culture in HSCC [19], a porous paper tape, which allows circulation of air from outer space and avoids accumulation of mVOCs and CO2, was used to seal the Petri dishes.
In response to E. amylovora mVOCs and after continuous HSCC for 8 days, A. thaliana shoot and root biomass increased with enhanced lateral roots and root hair production (Figure 1), with respect to controls. In particular, a significant difference was found between shoot area expressed as mm2 (mean difference =−16.82, 95.00% CI = −18.62 to −15.03, SD difference = 2.33, t = −21.64, p < 0.001), primary root length expressed as mm (mean difference = −6.15, 95.00% CI = −7.46 to −4.84, SD difference = 1.95, t = −10.47, p < 0.001) and the number of secondary roots (mean difference = −6.89, 95.00% CI = −7.70 to −6.08, SD difference = 1.05, t = −19.61, p < 0.001) between controls and A. thaliana seedlings exposed to E. amylovora mVOCs. This phenology suggests that seedlings perceive mVOCs emitted by E. amylovora and the observed morphological response implies the involvement of transcriptional, metabolomic, and physiological modulation. Similar effects have been observed in A. thaliana seedlings exposed to mVOCs emitted by plant growth-promoting rhizobacteria from avocado trees [31], after exposure to mVOCs of Trichoderma asperelloides PSU-P1 [32] and Bacillus subtilis GB03 [33].

3.2. E. amylovora Emits a Complex Blend of mVOCs

To analyze the mVOC composition of E. amylovora, we cultivated the bacteria in the same Petri dishes without the presence of A. thaliana seedlings and used polydimethyl siloxane (PDMS) stir bar sorptive extraction (SBSE) to collect bacterial volatiles.
After 16 h exposure, the chemical composition of E. amylovora mVOCs is characterized by the presence of volatile hydrocarbons (pentadecane and heptadecane), which along with ketones (6,10,14-trimethyl-2-pentadecanone and 6,10-dimethyl-2-undecanone) represent the highest percentage of mVOCs emitted (about 26% and 25%, respectively). Alcohols (particularly 1-dodecanol, 1-undecanol, and 1-nonanol) represent 23% of total mVOCs and are followed by aldehydes (above all 1-pentadecanal, tridecanal, tetradecanal, and undecanal), which account for 22% of total mVOCs. Two alkenes (1-tetradecene and 1-hexadecene) and a monoterpene alcohol (1,8-cineole) were also present but at concentrations below 1% of total mVOCs (Table 1).
The occurrence of pentadecane in mVOC is widespread both in bacteria [34] and in fungi [35] and stimulates plant growth [36], whereas heptadecane emission was found mainly in bacteria [37]. The mVOC 6,10,14-trimethyl-2-pentadecanone (also known as hexahydrofarnesylacetone) is emitted by different microorganisms, including Pseudomonas syringae and Stigmatella aurantiaca [37,38] and stimulates root production [39]. 1-Dodecanol is emitted by several bacteria [40], whereas 1-undecanol was found in the mVOCs of proteolytic strains of Serratia proteamaculans and Pseudomonas fragi [41]. Emission of the mVOC 1-nonanol was found to be associated with the A. thaliana lateral root formation [31]. Tridecanal and Tetradecanal are also emitted by Carnobacterium divergens [41] and by the fungus Tuber borchii [42], and induce root formation [39], whereas undecanal is typically emitted by several bacteria [36]. The mVOC 1-tetradecene has been found in C. divergens and in Pseudomonas putida emissions [41,43], whereas 1-hexadecene was detected in the mVOCs of C. divergens, P. fragi, and several other bacteria [41]. The monoterpene 1,8-cineole is typically emitted by fungi [44]; however, a bacterial sesquiterpene cyclase similar to a plant homolog from Streptomyces clavuligerus was found to act as a monoterpene cyclase, being able to catalyze the conversion of the sesquiterpene precursor geranylgeranyl diphosphate into 1,8-cineole [45].

3.3. E. amlylovora mVOCs Induce Early Signaling Events in Arabidopsis thaliana

To evaluate the early responses of A. thaliana to E. amylovora mVOCs, we set up experiments aimed at evaluating short-time exposures of seedlings to bacterial mVOCs. In both roots and shoots, after evaluating the electrophysiological changes in the membrane potential, we used confocal laser scanning microscopy (CLSM) with the use of specific fluorescent indicators to assess the content of calcium, the activity of different potassium (K+) channels, and the presence of reactive oxygen species (ROS) and nitric oxide (NO).

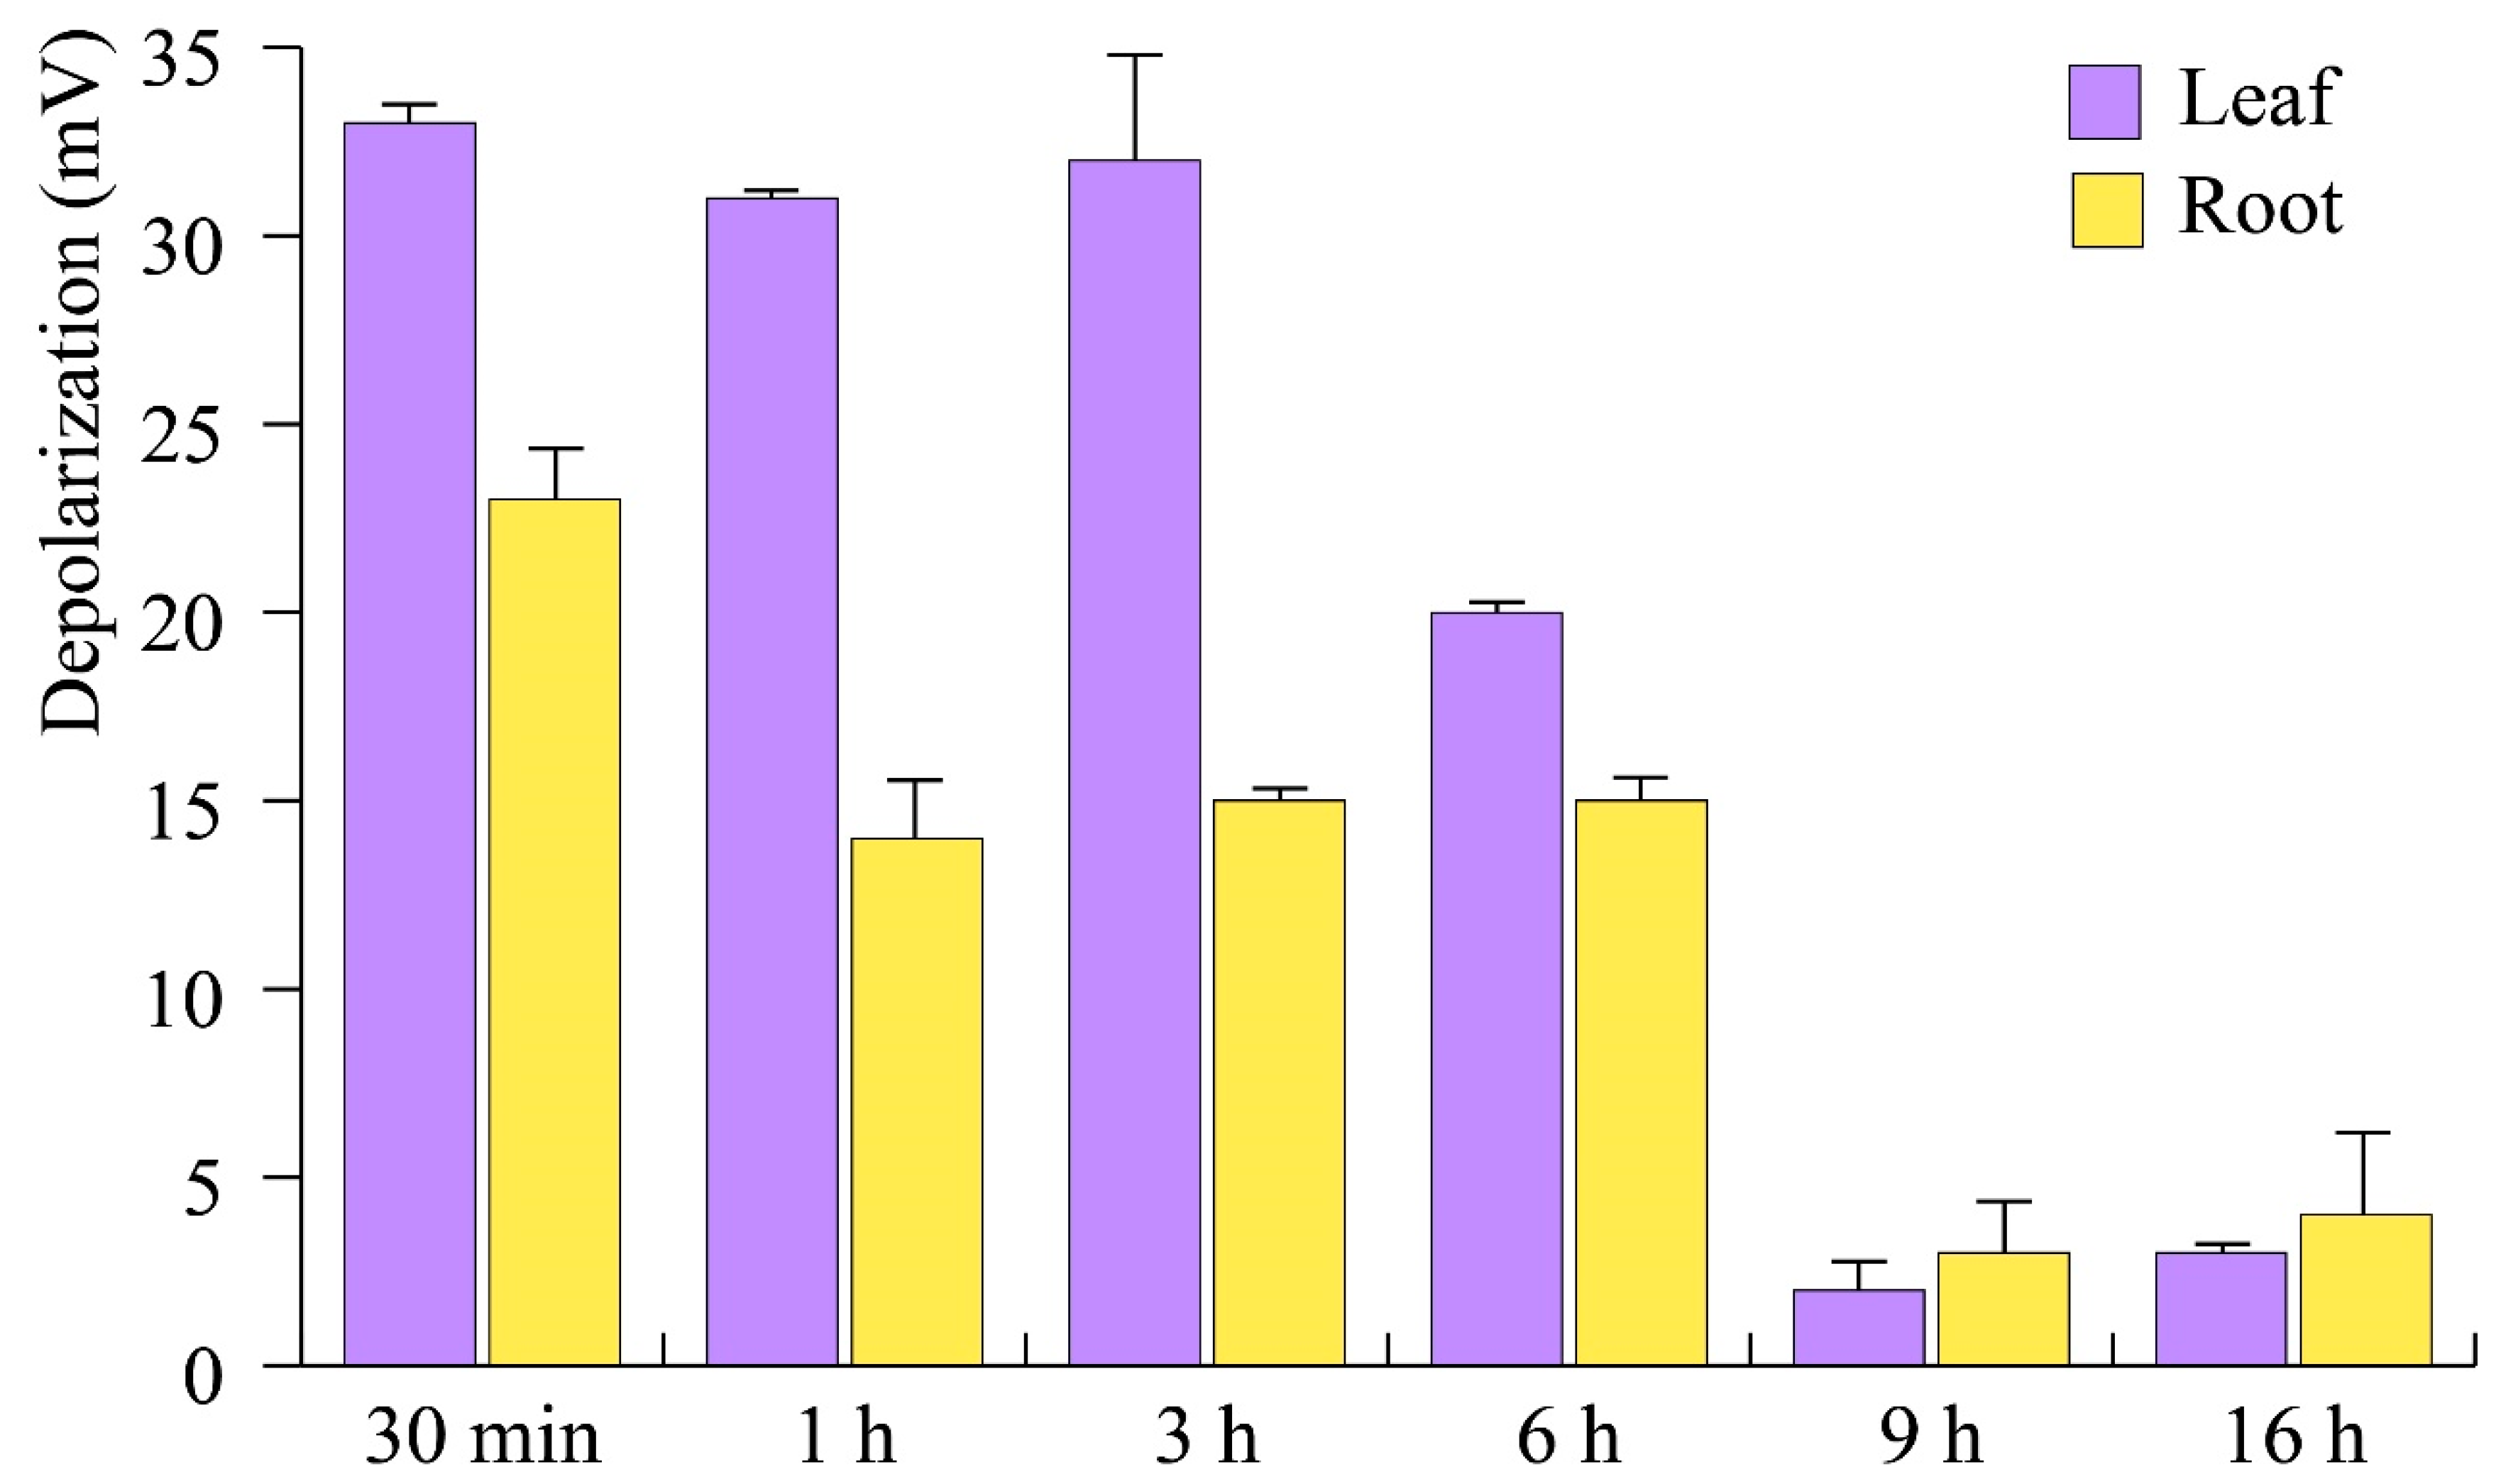
3.3.1. E. amylovora mVOCs Depolarize A. thaliana Plasma Membrane Potential (Vm)

Early events upon pathogen infection include alteration of the plasma transmembrane potential (Vm), due to unbalanced ion fluxes across the plasma membrane, influx of Ca2+ into the cytosol from the cell wall and internal stores, K+-gated channel activity, and ROS and NO burst [46]. Time-course experiments were performed in order to assess the effect of E. amylovora mVOCs on A. thaliana leaf and root Vm. A strong Vm depolarization was found between 30 min and 6 h of mVOCs exposure in A. thaliana leaves (Figure 2). A similar trend was observed for A. thaliana root Vm depolarization, although with a significantly (p < 0.05) reduced response from 30 min to 6 h exposure. Longer mVOC exposure times induced a significant but reduced Vm depolarization in both leaves and roots (Figure 2).
Leaf and root cells have developed specific chemosensorial mechanisms to recognize chemical signals at very low concentrations that are present in the surrounding environment [36,47]. In response to phytopathogenic bacteria, plant cells modulate different ionic signaling pathways [48] that eventually alter their plasma membrane potential [49,50,51]. Plant VOCs may induce membrane depolarization [52] and bacterial mVOC can travel far from the point of production through the atmosphere, porous soils, and liquid, making them ideal info-chemicals for mediating both short- and long-distance intercellular and organismal interactions [53].

3.3.2. E. amylovora mVOCs Induce Calcium Efflux and Modulate K+ Channels of A. thaliana

In both plant–pathogen and plant–herbivore interactions, Vm depolarization has been associated with the Ca+-dependent opening of K+ channels [50,54]. Having assessed that the highest Vm depolarization occurs in early exposure time to E. amlylovora mVOCs, we measured by CLSM the cytosolic Ca2+ influx [Ca2+]cyt with the fluorescent dye Calcium Orange® and the activity of both voltage-gated K+ channels (VGKC) and ligand-gated or resting inward rectifier K+ channels (LG/RIRKC) with the fluorescent dye FluxOR®, with respect to control plants not exposed to E. amlylovora mVOCs.
To visualize the effect of E. amylovora mVOCs on [Ca2+]cyt, we calculated the ratio between the dye fluorescence of treatments and controls by expressing the fold change increase. Root caps showed the highest ratio after 30 min, whereas leaves and stems had the highest fold change after 1 h of mVOC exposure (Figure 3). The root elongation [Ca2+]cyt was almost constant during the time-course experiment, whereas a decreasing trend was observed for leaves from 1 to 3 h (Figure 3). At 3 h of mVOC exposure, an increasing trend of [Ca2+]cyt fold change was observed between roots and shoots (Figure 3).
Upon perception of bacterial and fungal elicitors, plant plasma membranes activate Ca2+ channels [50]. This event has been demonstrated for different kinds of elicitors, including oligopeptides, oligogalacturonides, beta-glucans, and symbiotic Nod factors [49,54]. Here we showed that E. amylovora mVOCs are able to induce a significant increase in [Ca2+]cyt levels in both roots and shoots of the receiver A. thaliana seedlings.
A different timing of K+ channel activity was found for VGKC between A. thaliana roots and shoots. The root cap and root elongation zone reached their highest fold change after 30 min, whereas leaves and stems showed the highest fold change after 2 h of exposure to E. amylovora mVOCs (Figure 4A). LG/RIRKC activity peaked after 1 h and 3 h in leaves, whereas in roots the activity remained constant up to 2 h and then declined at 3 h (Figure 4B). K+ efflux, which accompanies the observed Vm depolarization, is thought to occur via root and guard cell depolarization-activated K+ channels [55] and is known to react to microbial elicitors [56]. Elicitors from E. amylovora have been found to cause K+ efflux and cause Vm depolarization in A. thaliana [57]. Here we showed that also E. amylovora mVOCs are able to trigger the same cascade of events found in the plant–microbial [50,58], plant–plant [59] and plant–insect [60] interactions, with a cation influx (Ca2+ and K+) that causes Vm depolarization.

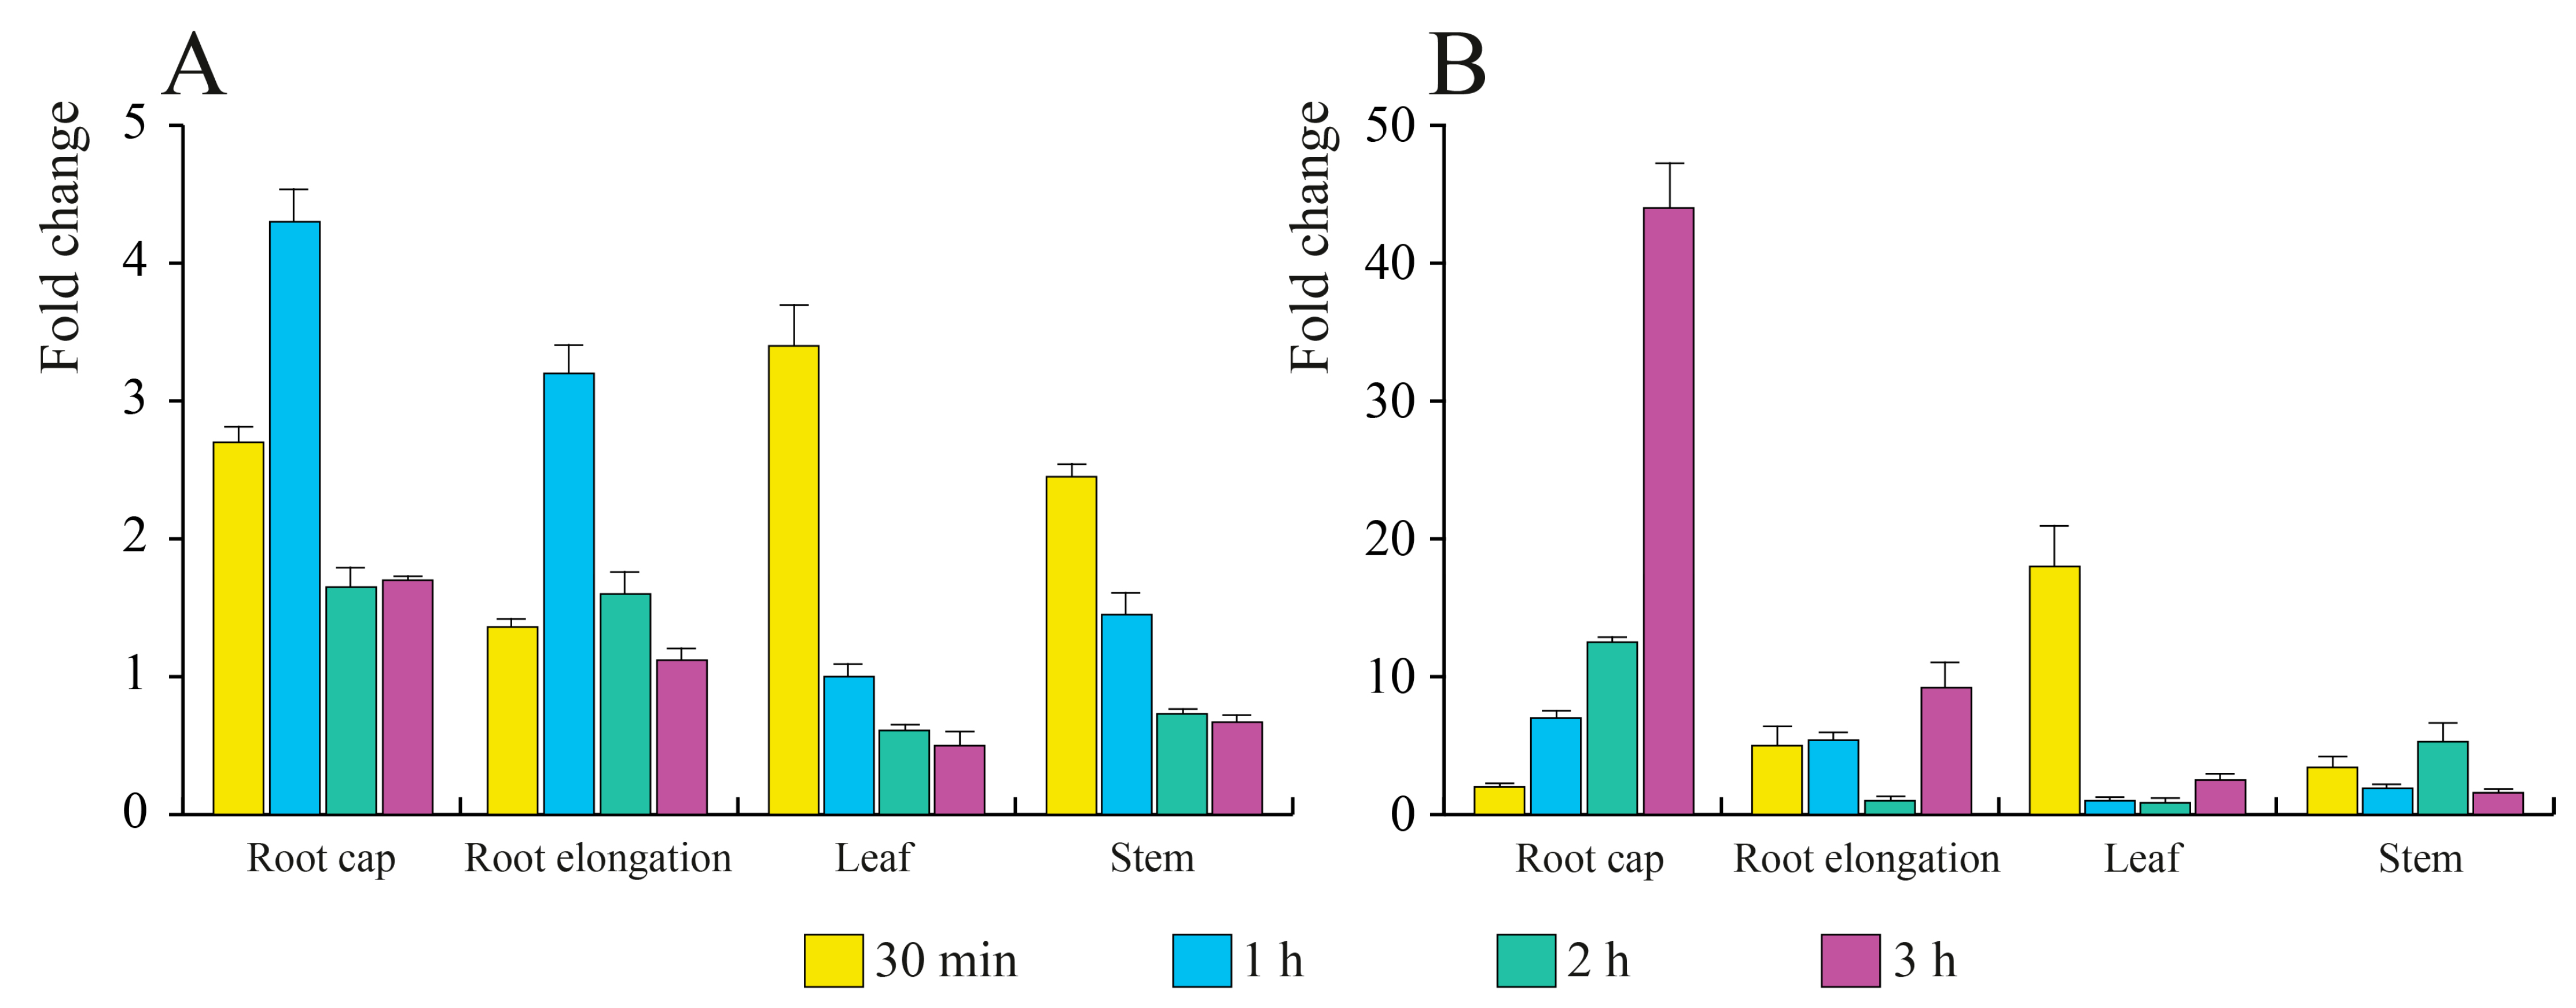
3.3.3. E. amylovora mVOCs Induce a Strong Burst of ROS and NO in A. thaliana Seedlings

During the interaction of bacterial pathogens with plants, the generation of ROS and the oxidative burst play important roles in both disease progress and hypersensitive response (HR) development [61,62]. Because H2O2 and NO play a central role in disease resistance, we extended our analysis up to 16 h of exposure to E. amylovora mVOCs by evaluating the production of both ROS and NO. As for calcium and potassium channels, we expressed ROS and NO values as fold changes in the fluorescence of mVOC-exposed seedlings with respect to controls. The highest ROS fold change was found in root caps after 6 h exposure, whereas a decreasing trend was observed for both leaves and stems from 3 h to 16 h (Figure 5A). With regards to NO, leaves showed the highest fold change after 3 h (as for ROS), whereas the root caps showed an increasing trend of NO production, which peaked at 16 h (Figure 5B). Figure 6 summarizes the ROS and NO production in the roots and leaves of A. thaliana upon exposure to E. amylovora mVOCs. Stems and roots show the highest fluorescence between 3 and 6 h of mVOC exposure, with tissue localization in vascular tissues in the elongation zone and in the stems (Figure 6B) and in the root apex of secondary roots (Figure 6C). Almost the same localization was observed for NO both in roots (Figure 6E) and in shoots (Figure 6G).
In plant–pathogen interactions, two phases of ROS production are found: phase I is a nonspecifically stimulated transient ROS production by compatible (leading to disease), incompatible (leading to HR), and even saprophytic bacteria; whereas phase II is a delayed and prolonged ROS production that is specifically stimulated by incompatible HR-causing bacteria and is characteristic of the HR [63]. E. amylovora is known to induce both phases by inducing the production of ROS for several hours in both compatible and incompatible situations [64] and being able to multiply transiently in the non-host plant A. thaliana, where the production of intracellular ROS occurs during this interaction [65]. Our results show that E. amylovora mVOCs are able to induce both phases of ROS production, being able to trigger both early and late production of H2O2. Moreover, NO accumulated when A. thaliana was challenged by E. amylovora mVOCs, and NO is known to crosstalk with other signaling pathways by modulating HR and triggering defense responses [62] and is induced by microbial elicitors [66].

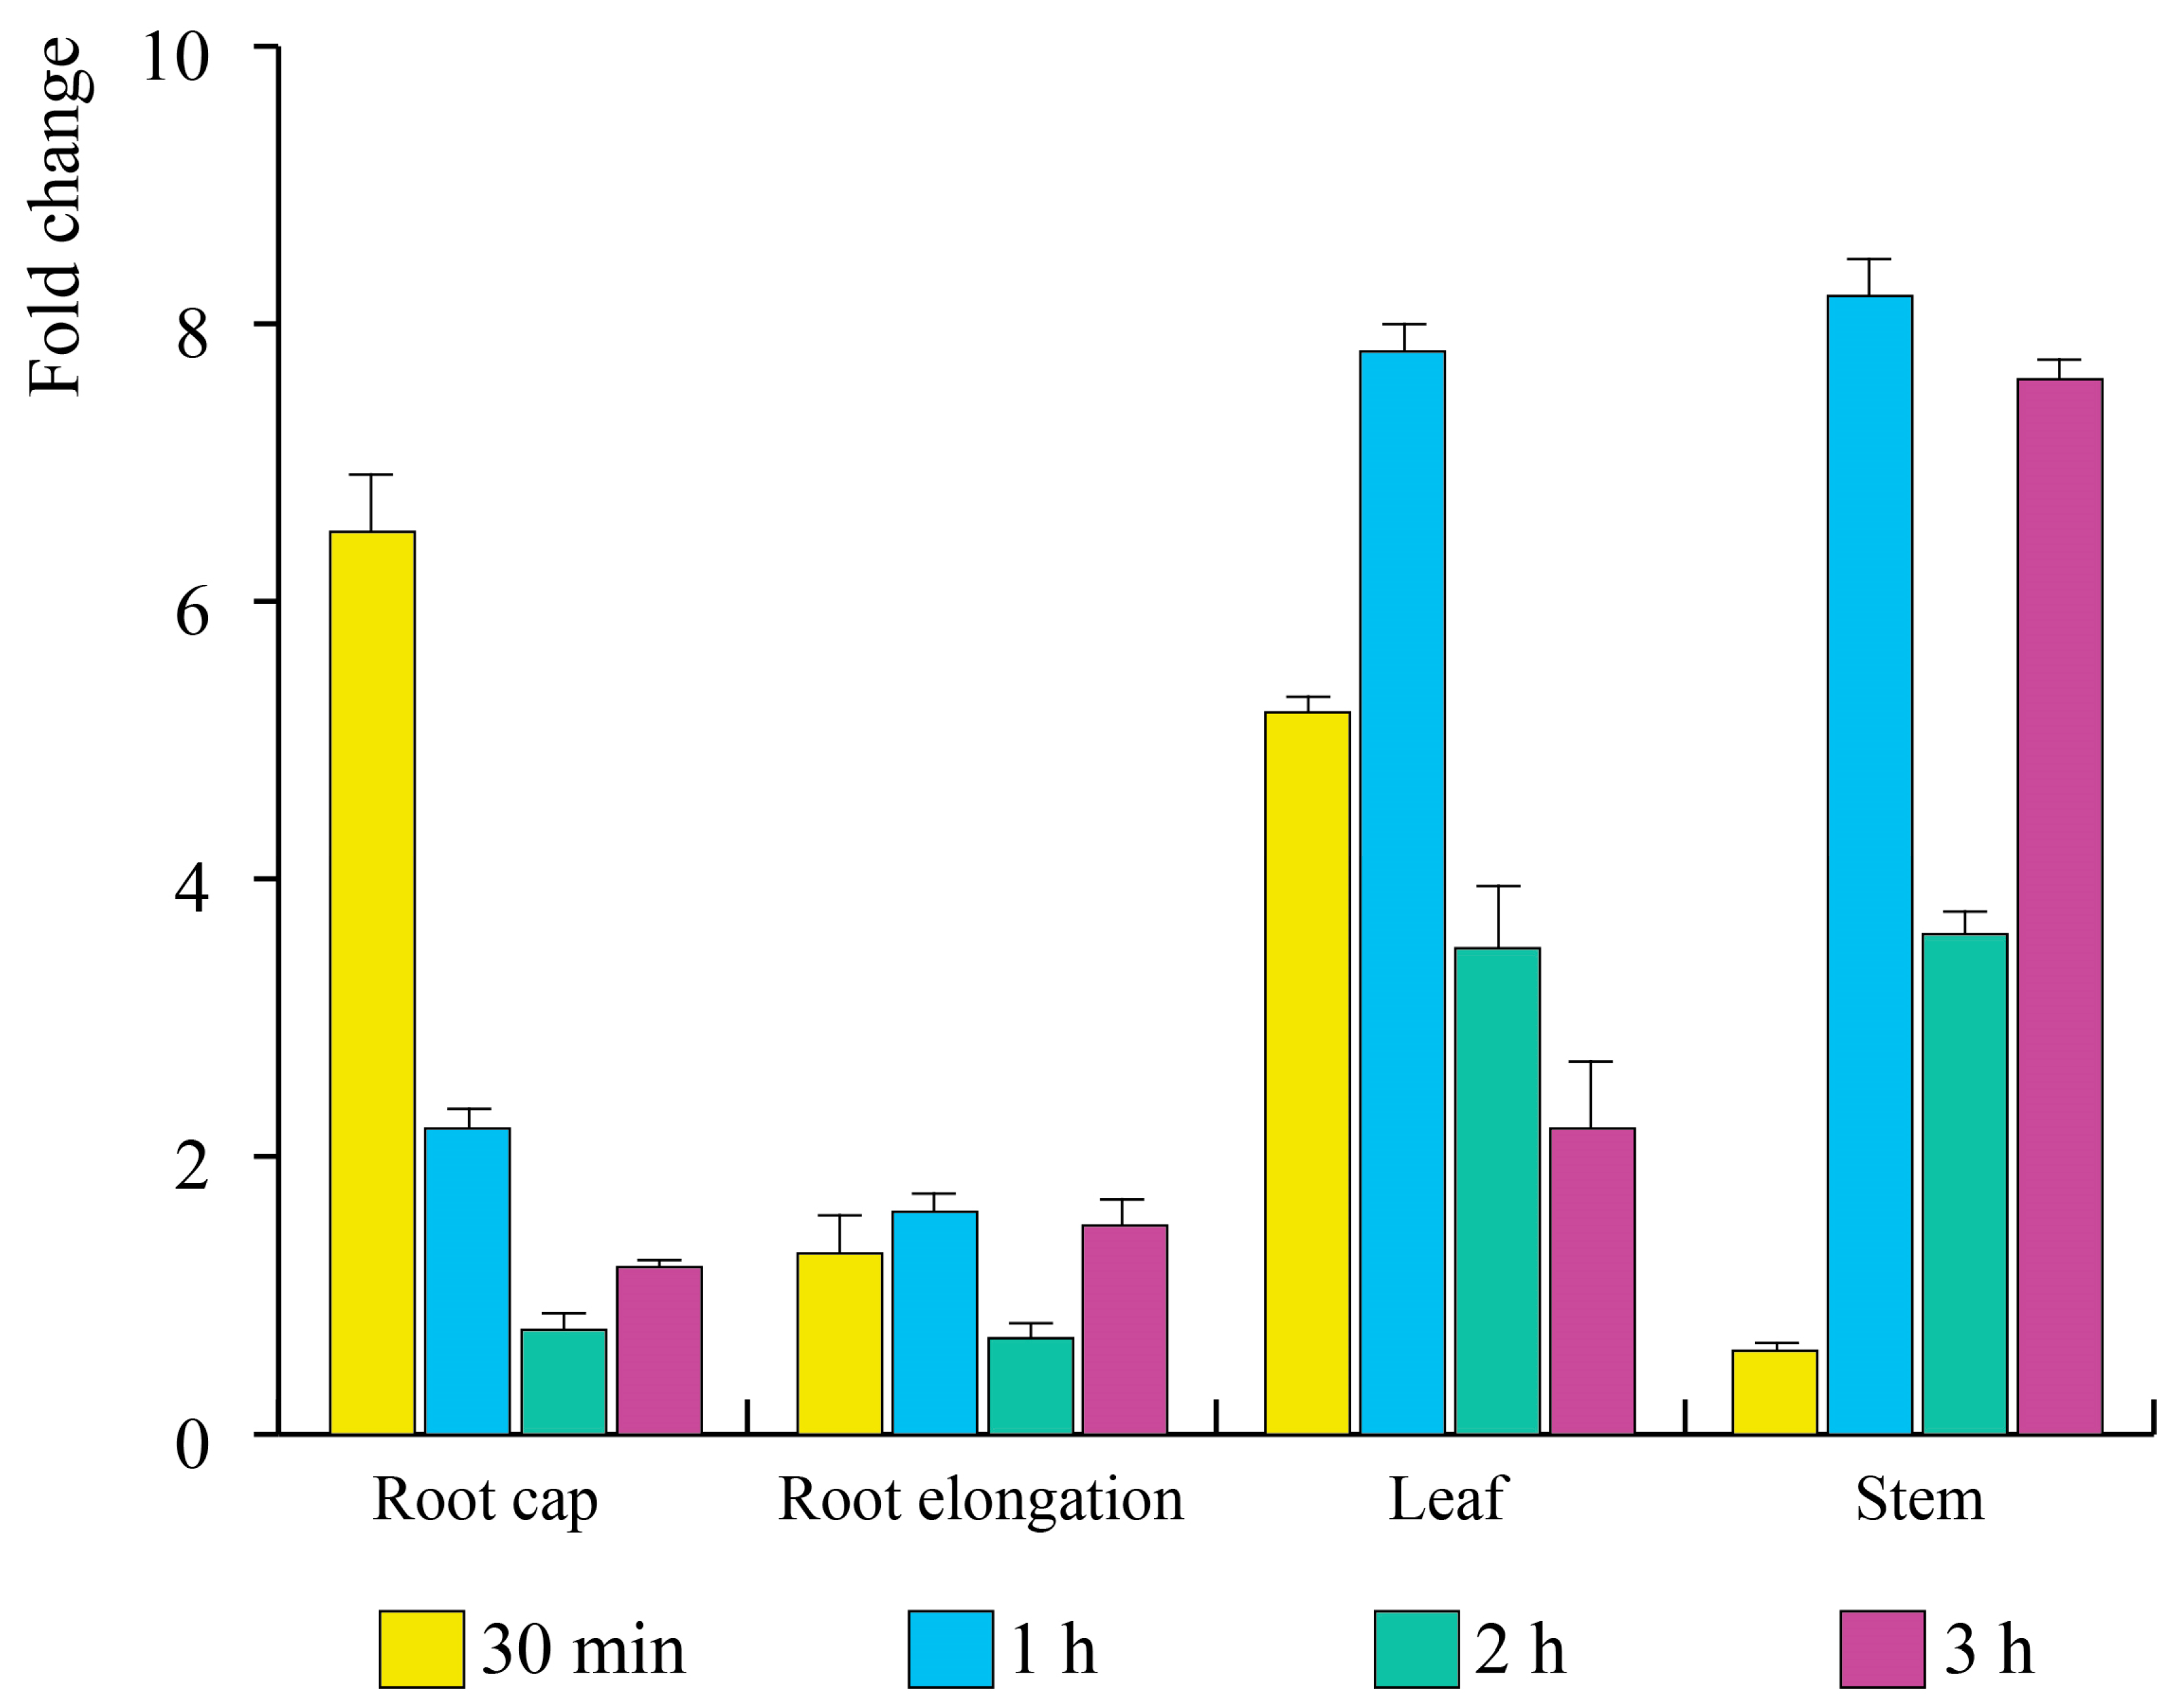
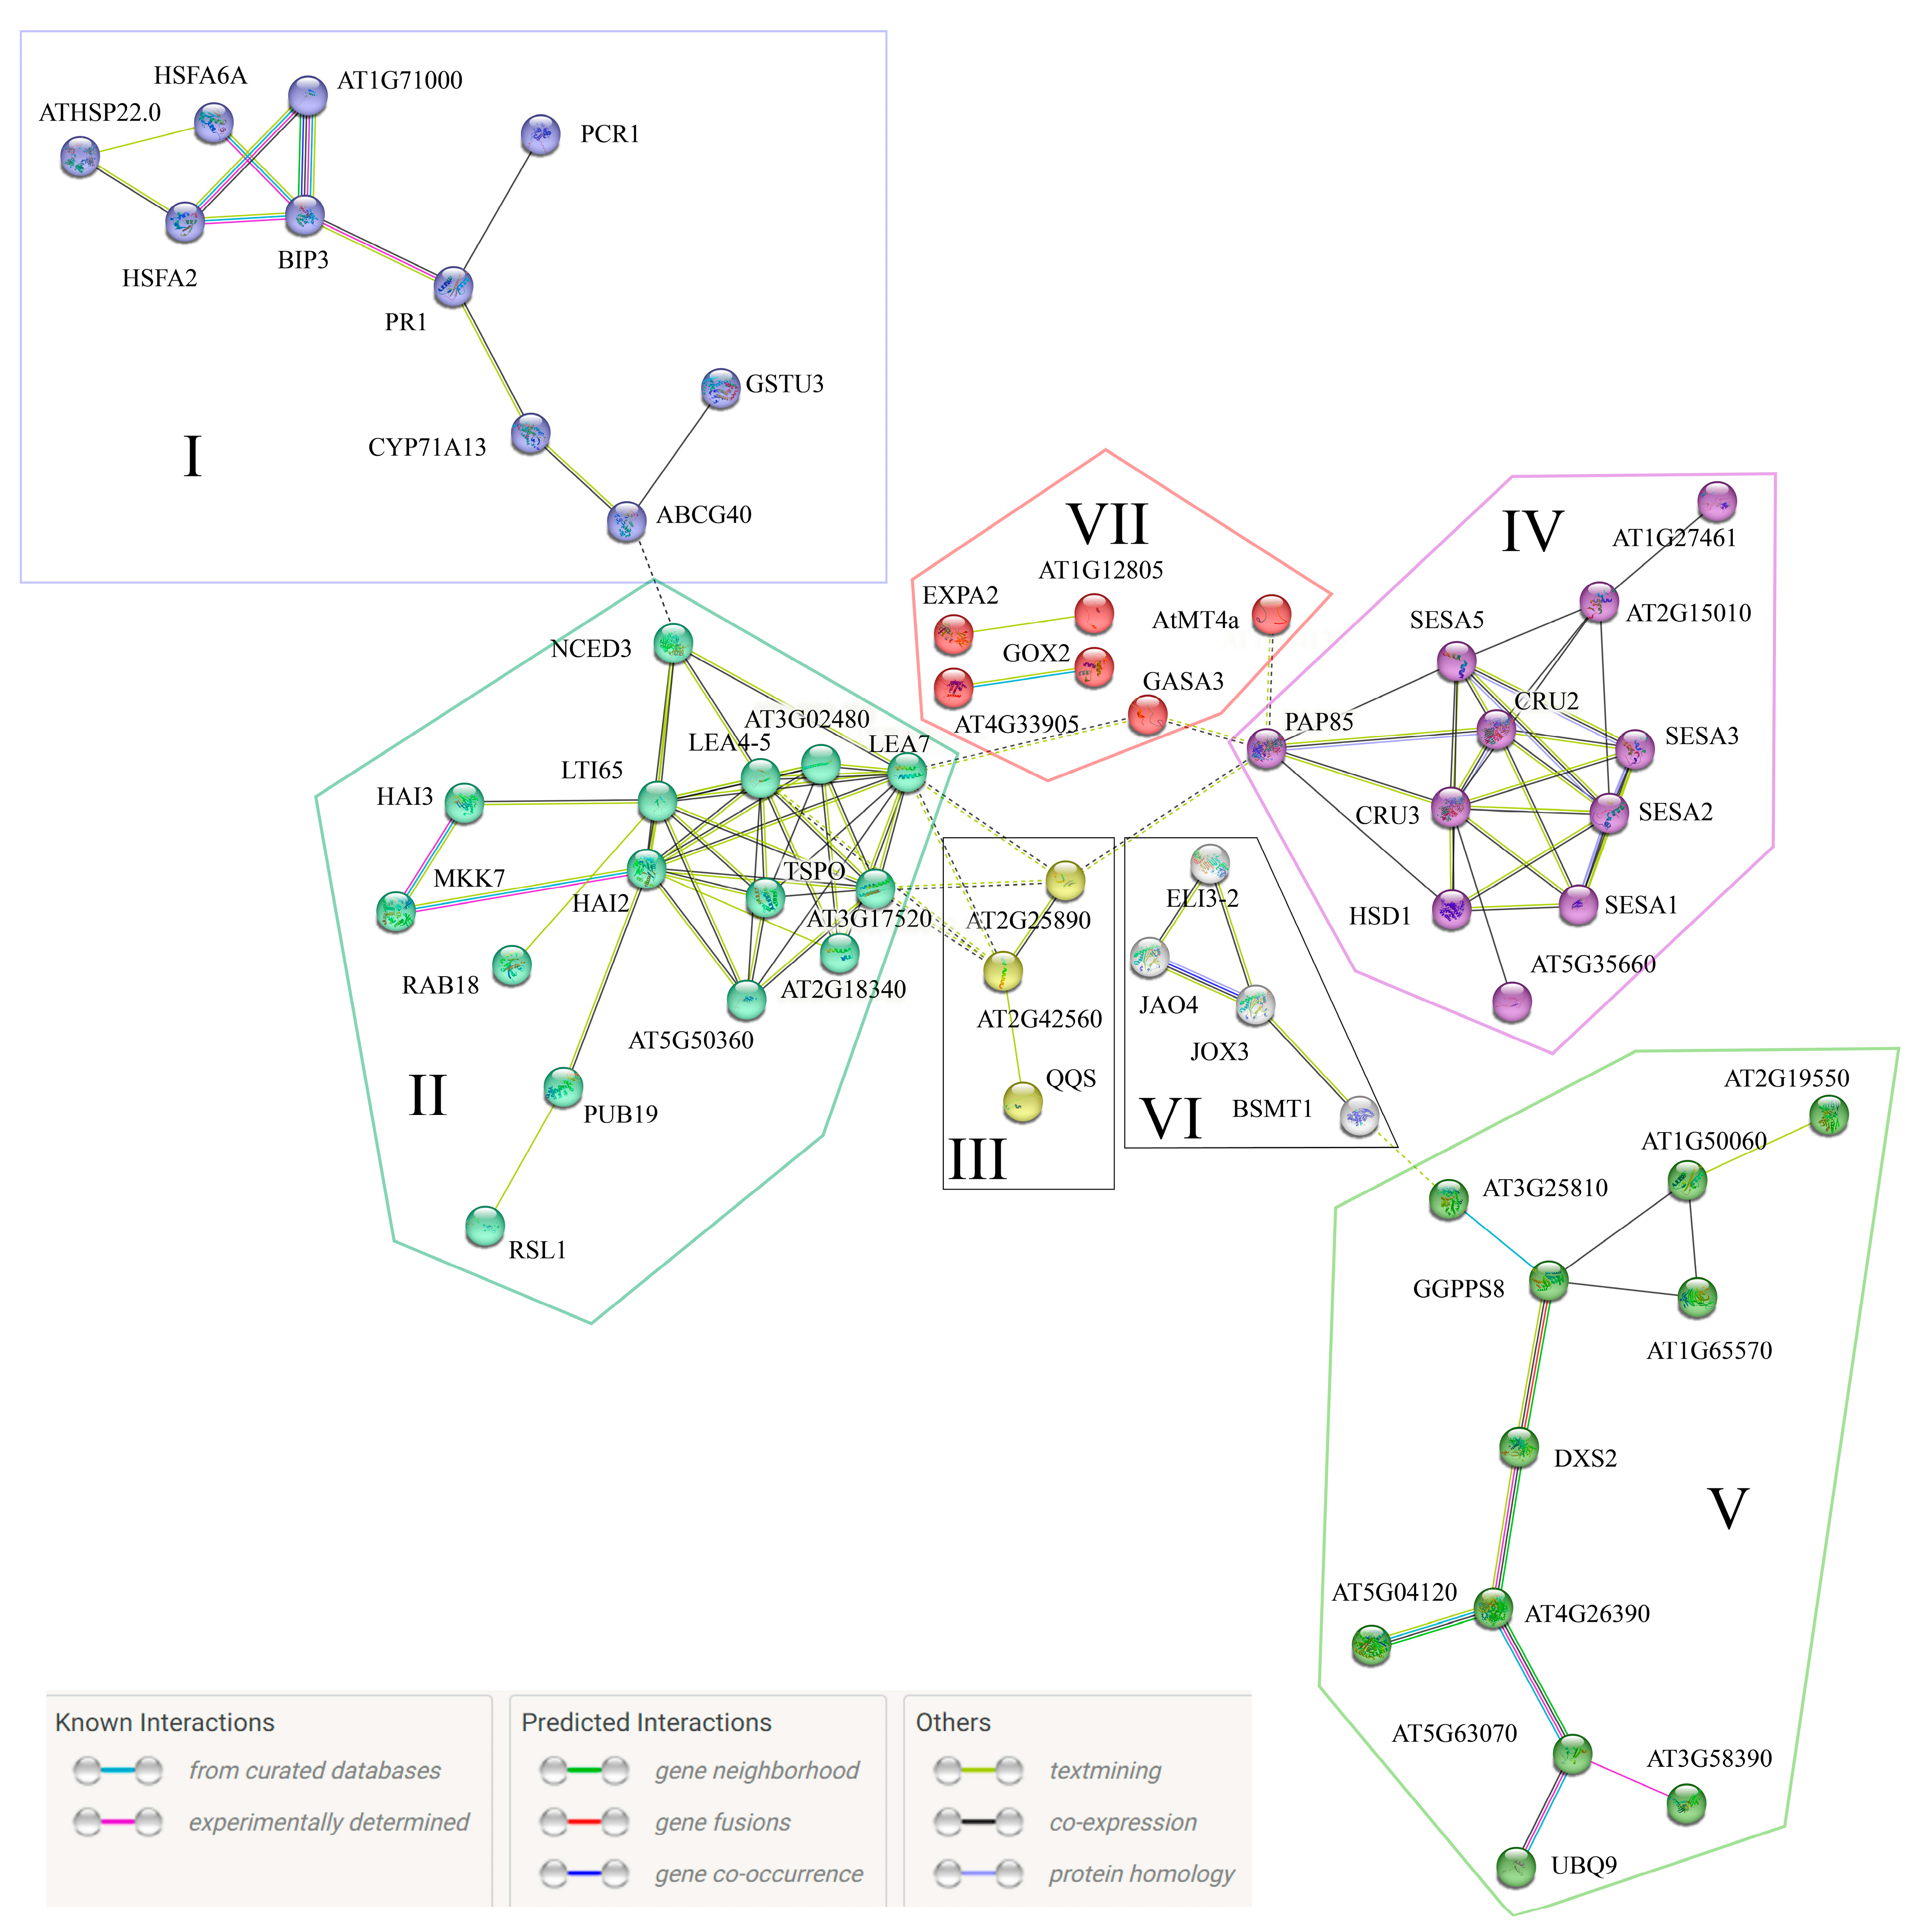
3.4. E. amylovora mVOCs Regulate the Gene Expression of A. thaliana Seedlings

Having assessed the significant modulation in plant growth, early signaling, and production of ROS and NO, we performed a full genome transcriptomic analysis of A. thaliana responses to E. amylovora mVOCs. Seven-day-old A. thaliana seedlings grown in HSCC were used for gene microarray analysis in the presence (for 16 h) or absence of E. amylovora.
Analysis was performed in the full seedlings using an A. thaliana gene expression microarray 4 × 44 K (G2519, Agilent Technologies). Out of 43,663 analyzed genes, 8934 had a p < 0.05, and 155 of those showed a fold change difference relative to the control ≥2 or ≤0.5 (see Supplementary Dataset S1) and were used for further analyses. The list of DEGs satisfying the selection criteria along with the gene ontology functional categorization is reported in Supplementary Table S2 (see also Supplementary Figure S3).
We then analyzed the protein–protein association and interaction of the DEGs in Table S2 using STRING [30], considering known, predicted, and other types of interactions. A functional association was evidenced by k-means clustering that allowed to identify groups of proteins that contribute jointly to a specific biological function. Seven clusters were obtained by analyzing all the genes listed in Table S2.
The first cluster is composed in general of defense genes and is made of a group of downregulated heat shock proteins and transcription factors and other upregulated proteins involved in pathogen response and detoxification (Figure 7I). Heat shock proteins and transcription factors are expressed in plants due to pathogenic interactions [67], and their expression has been reported to be induced through the accumulation of ROS [68]. Heat shock proteins 70 s have been shown to be involved in plant pathogen-associated molecular pattern-triggered immunity and effector-triggered immunity [69]. BIP3 (HSP70-13) is classified as a marker gene of the A. thaliana unfolded protein response [70], and BiP3 overexpression compromised immunity against Xanthomonas oryzae [71]. Small heat shock proteins such as ATHSP22.0, which was downregulated by E. amylovora mVOCs, are involved in priming defense against necrotrophic fungi [72].
The second cluster is characterized by genes that are mostly downregulated. These include a group of late embryogenesis abundant proteins (AT2G18340, AT3G02480, AT3G17520, LEA4-5, and LEA7) (Figure 7II). Late embryogenesis abundant (LEA) proteins accumulate to high levels during the late stage of seed maturation and in response to both abiotic and biotic stress, and they play a role in protecting plants from damage by protecting protein structure and binding metals under osmotic and oxidative stresses [73]. Some LEA proteins are involved in mitochondrial ROS signaling, impacting root development and pathogen responses [74]. The LEA5 group is also expressed in non-seed organs and was found to be induced by ABA treatment [75]. Downregulation of LEAs was associated with the downregulation of ABA-responsive genes, including two ABA-induced interacting protein phosphatases (HAI2 and HAI3), a tryptophan-rich sensory protein-like protein (TSPO), a protein involved in ABA biosynthesis (NCED3), and a CAP160 protein (LTI65). HAI2 regulates seed dormancy by inhibiting ABA signaling [76] and has a functional role in ABA signaling and sugar tolerance in A. thaliana [77], whereas HAI3 plays a major role as a negative regulator of ABA signaling during early growth [78]. AtTSPO is targeted to the secretory pathway in plants, and expression of this gene may enhance ABA sensitivity [79]. TSPO was also associated with the induction of oxidative stress with a role in controlling redox homeostasis [80]. Finally, NCED3 and LTI65 were found to respond to isoprene, demonstrating that this VOC impacts ABA signaling at different tissue-specific, spatial, and temporal scales [81].
MKK7, a MAP kinase kinase, and RAB18 are also present in this cluster. MKK7 has previously been shown to negatively regulate A. thaliana polar auxin transport and positively regulate plant basal and systemic acquired resistance (SAR) [82]; moreover, the increased expression of this gene was responsible for polar auxin transport deficiency leading to plant architectural abnormality [83]. RAB proteins belong to the small GTP-binding proteins. In A. thaliana, they are active in their GTP-bound form, which is membrane-associated following post-translational lipid modifications, i.e., prenylation [84]. A. thaliana RAB18 is a stress-inducible gene that is significantly activated by ABA [85]. The only upregulated gene in this cluster is RSL1, which encodes a functional E3 ubiquitin ligase and whose overexpression alters hormonal responses in seed and vegetative tissues [86]. Overexpression of RSL1 was found to reduce ABA sensitivity [87] (Figure 7, central left light green cluster).
The above-described cluster is linked to a small cluster including a downregulated late embryogenesis abundant gene (AT2G42560) and two upregulated genes (an oleosin-like protein, AT2G25890, and a negative regulator of starch metabolic process, QQS) (Figure 7III).
A strong downregulation was found for several seed storage albumins (SESA1, SESA2, SESA3, and SESA5) (Figure 7IV) that were clustered along with cruciferins (CRU2 and CRU3). A. thaliana contains two predominant classes of seed storage proteins: napin-type albumins referred to as 2S albumin or arabin [88], including SESA1, SESA2, SESA3, and SESA5, and legumin-type globulins referred to as 12S globulin or cruciferin [89], including CRU2 and CRU3. In general, ABA plays a critical role in the regulation of seed maturation [90] and seed storage genes [91]. SESA5, the most downregulated gene in our analysis, is upregulated by ABA [92]. A cupin family protein (PAP85), which encodes a vicilin-like seed storage protein, is under the control of ABA [93] and was also downregulated, as were a hydroxysteroid dehydrogenase that responds to ABA (HSD1) [94] and a glycine-rich protein (AT5G35660) and a plant thionin (AT2G15010), which are involved in plant defense [95]. The only upregulated gene in this cluster codes for an uncharacterized protein (AT1G27461) that functions in DNA binding and is involved in seed dormancy [96].
Another cluster (Figure 7V) gathers proteins that are coded by both up and downregulated genes. Downregulation occurred for genes coding for terpene synthases: AT3G25810, that catalyzes the formation of eight monoterpenes from geranylpyrophosphate [97]; and AT3G20160, which encodes an active geranylgeranyl pyrophosphate synthase and is expressed in roots [98]. Downregulation occurred also for AT3G58390, a eukaryotic release factor protein that suppresses non-stop decay (NSD) and no-go decay (NGD) translation-coupled RNA quality control systems [99], and for AT5G04120, a phosphoserine phosphatase that forms serine from L-O-phosphoserine [100]. Upregulated genes coded for 1-deoxy-D-xylulose 5-phosphate synthase (DXPS1), a protein that either does not have DXS activity or whose activity is not enough to support full-rate isoprenoid biosynthesis [101]. Upregulation was also found for proteins involved in galactose oxidase (AT1G60570), pyruvate kinase (AT4G26390), alpha/beta-hydrolases (AT2G19550), a cysteine-rich secretory protein (AT1G50060), a ribosomal protein (AT5G63070), and a ubiquitin (UBQ9).
This latter cluster was linked to a small cluster (Figure 7VI) characterized by transcripts of downregulated genes including BSMT1, which is involved in methyl salicylate biosynthesis [102] and is necessary for SAR signaling [103]; and ELI3-2, an aromatic alcohol:NADP+ oxidoreductase (benzyl alcohol dehydrogenase) involved in response to stress and lignin biosynthesis [104,105]; and two upregulated genes: JAO4, a jasmonic acid-coregulated 2-oxoglutarate dependent oxidase that is involved in response to biotic stress [106]; and JOX3, which has the ability to lower the jasmonate metabolism in vivo [107].
Finally, the last cluster (Figure 7VII) was composed of upregulated genes coding for nucleotide-binding protein (AT1G12805) and EXPA2, the latter is an α-expansin that plays a key role in controlling seed germination through gibberellic acid signaling [108]. Upregulation was also found for GOX2, which was found to be highly induced by programmed cell death and plays a role in the interplay between soluble sugars and ROS [109]. Downregulation occurred for AT4G33905, which codes for a stress- and ABA-regulated peroxisomal membrane protein [110]; and for GASA3, which codes for a GAST1 protein homolog 3 that responds to gibberellins [111]. The latter is linked through LEA7 and PAP85 to two other clusters. Finally, a type 4 metallothionein (AtMT4a) that is involved in regulating Zn ion accumulation in the late embryo and in controlling early seedling growth [112] is linked through PAP85 to the seed storage cluster (green cluster).
With regards to the other DEGs of Table S2 that were not clustered in the String analysis, a strong upregulation was found for DAU2, which is involved in gamete interaction that leads to correct double fertilization [113], and several genes expressed in the extracellular region involved in: response to oxidative stress and regulated by JA (THI2.1) [114], defense response to the bacterium (LCR6) and to ABA (AT5G24080). Among the downregulated DEGs, some were involved in response to ABA and a few in defense response. With regards to DEGs responding to ABA, AT5G05220 is also a hydrogen peroxide-inducible protein [115], whereas AT5G45630 responds to ABA and salicylic acid and is modulated by bacterial infection [116]. Among defense genes, DIP2 is involved in viral resistance [117], whereas AT4G03480 is an ankyrin repeat-containing protein that mediates protein–protein interactions [118]. Validation of microarray data was done by selecting three of the most downregulated genes (SESA1, SESA2, and SESA3), which were evaluated in a time-course experiment. A hormetic trend was found for all genes, with peaks of expression at 9 and 12 h (Supplementary Figure S4).

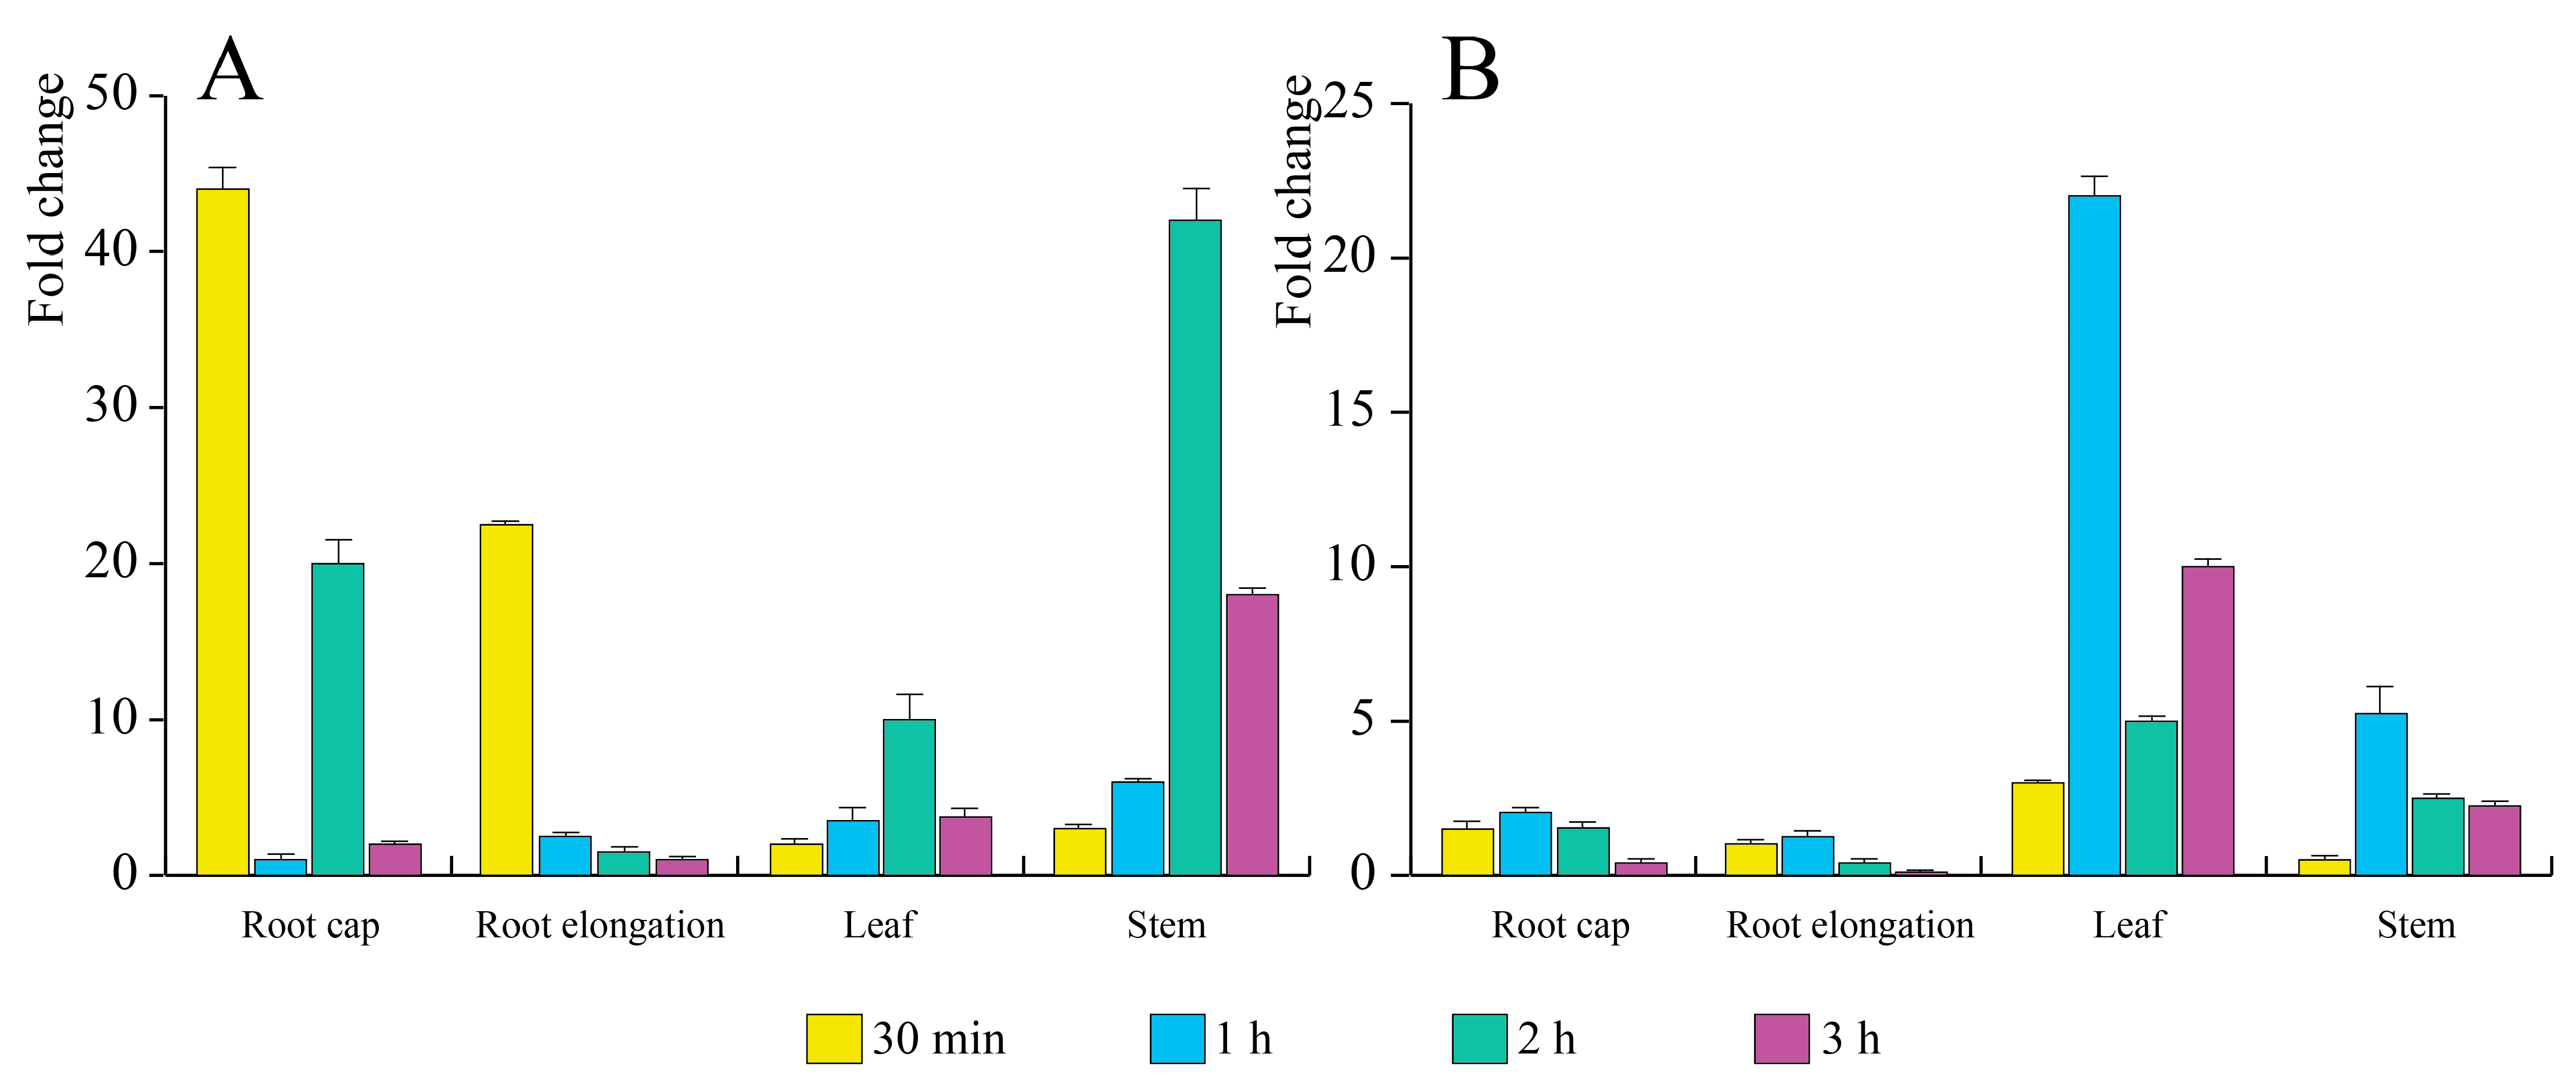
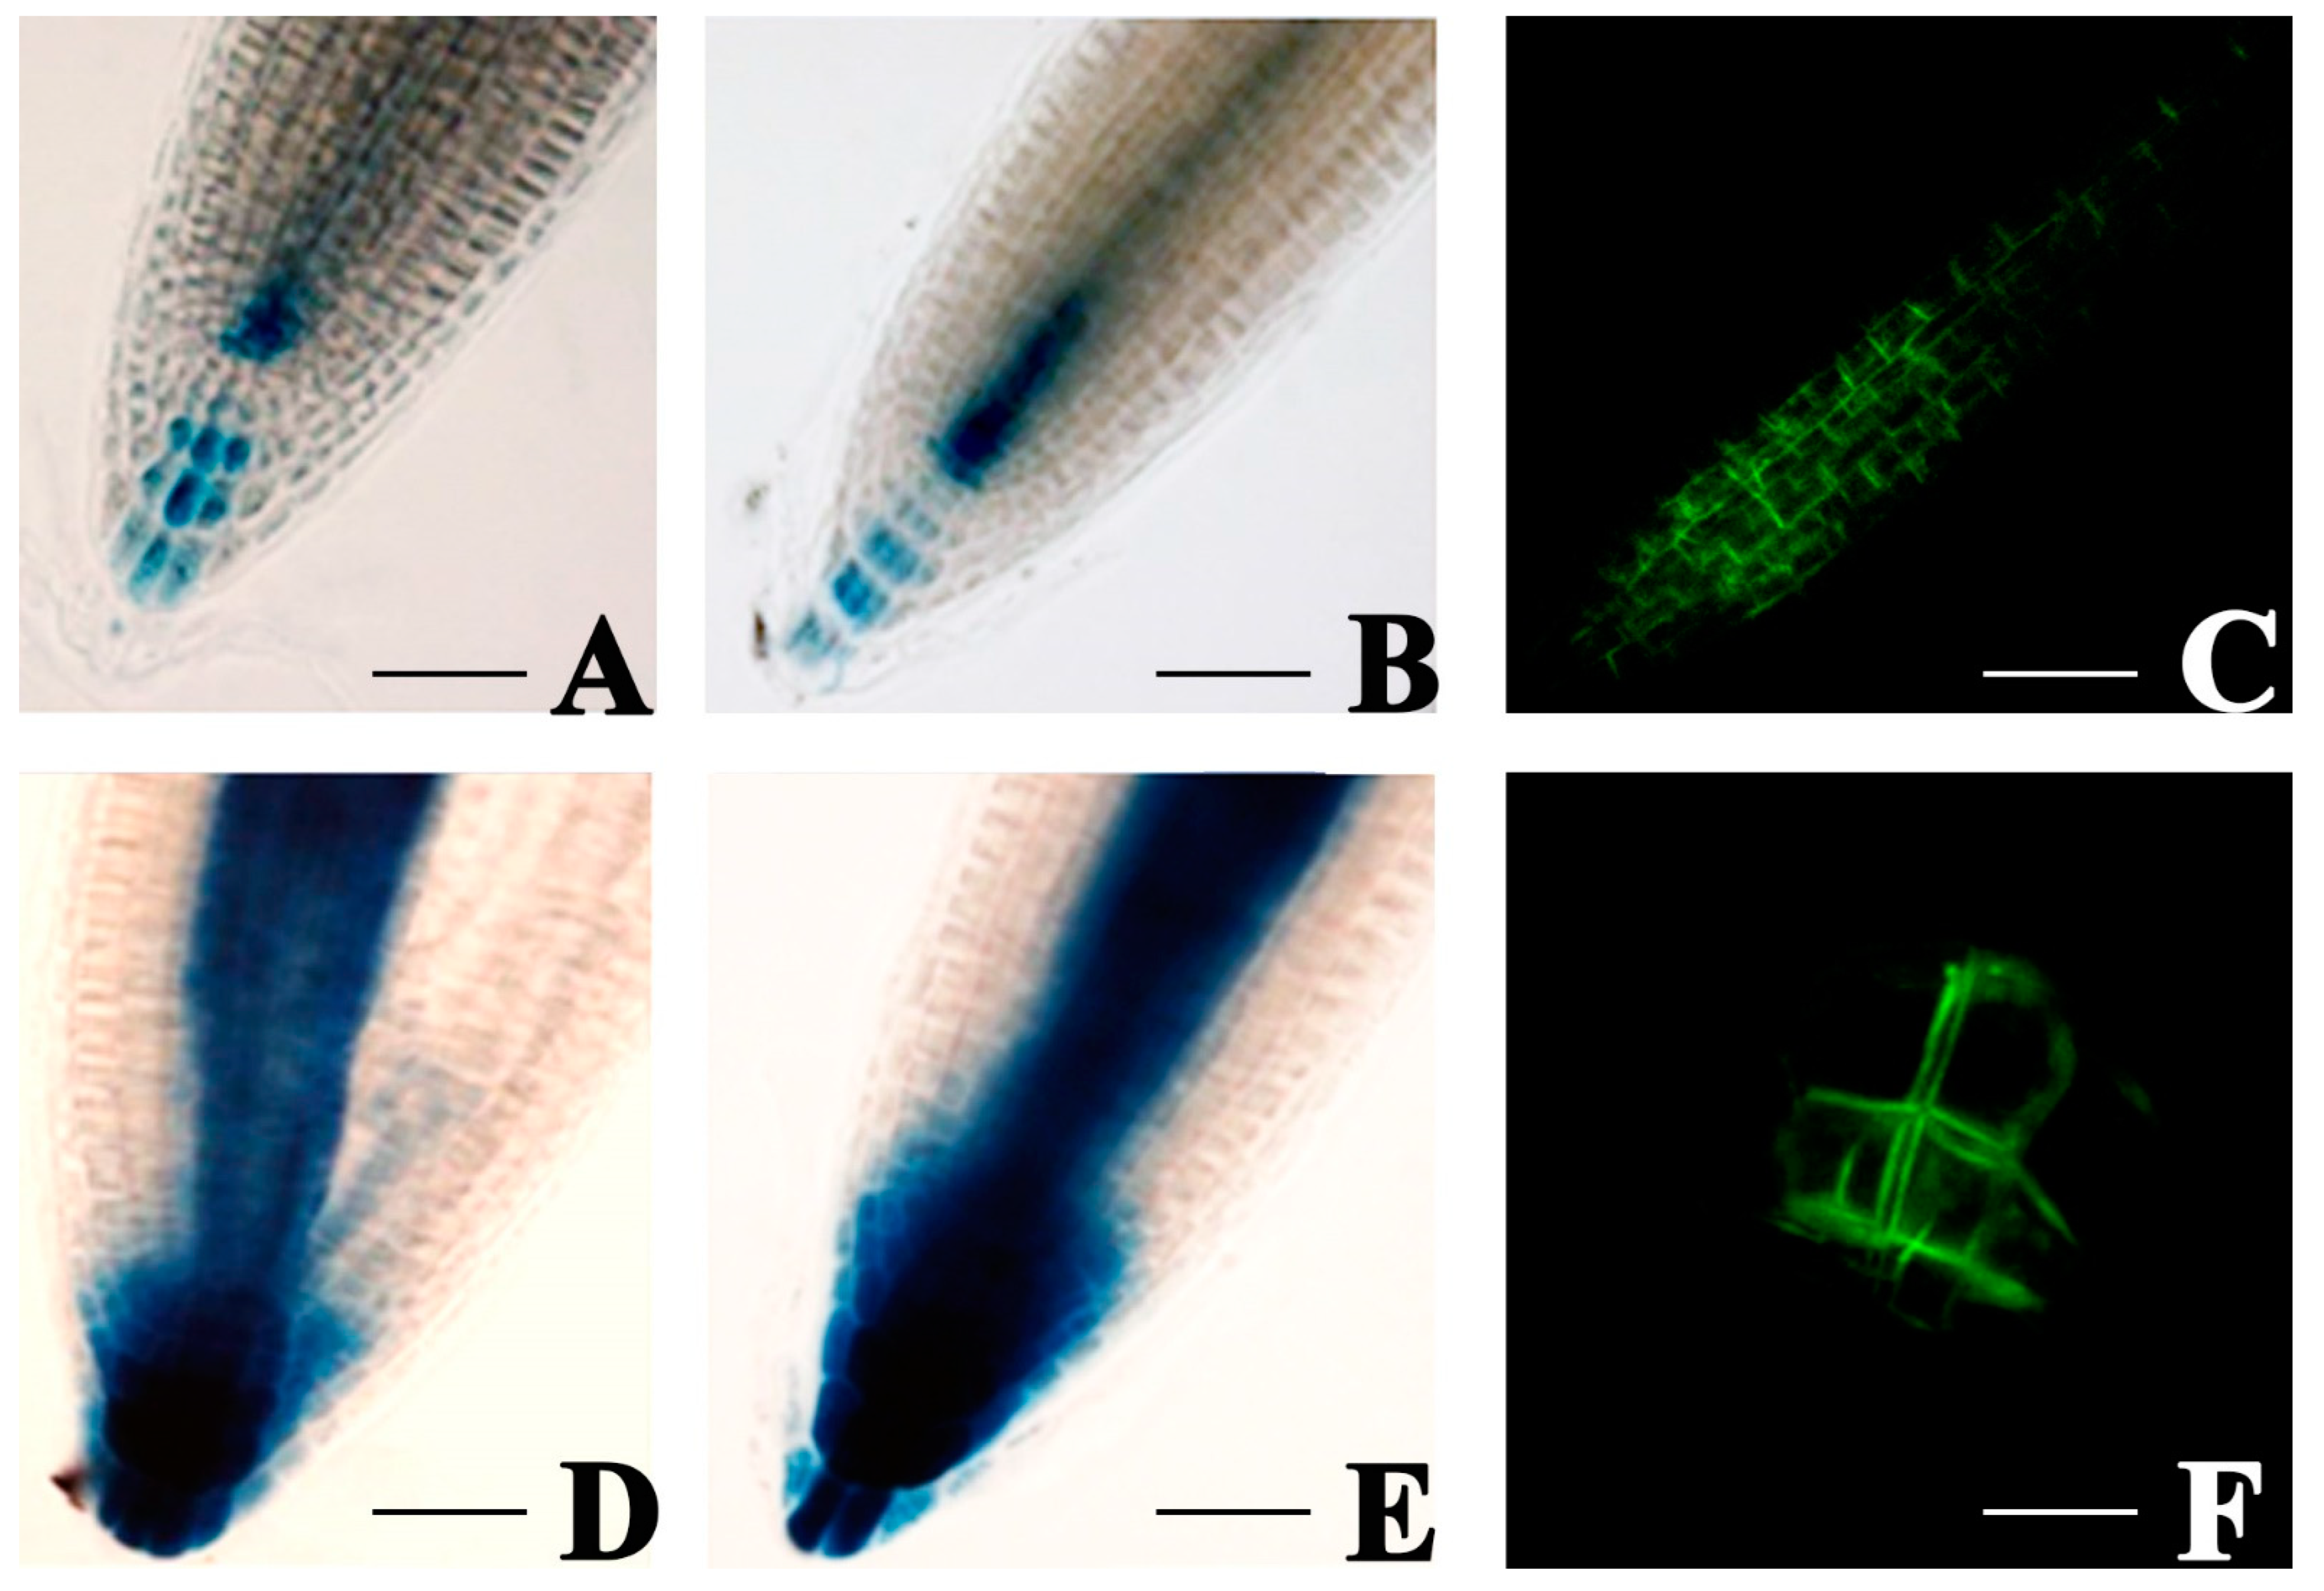
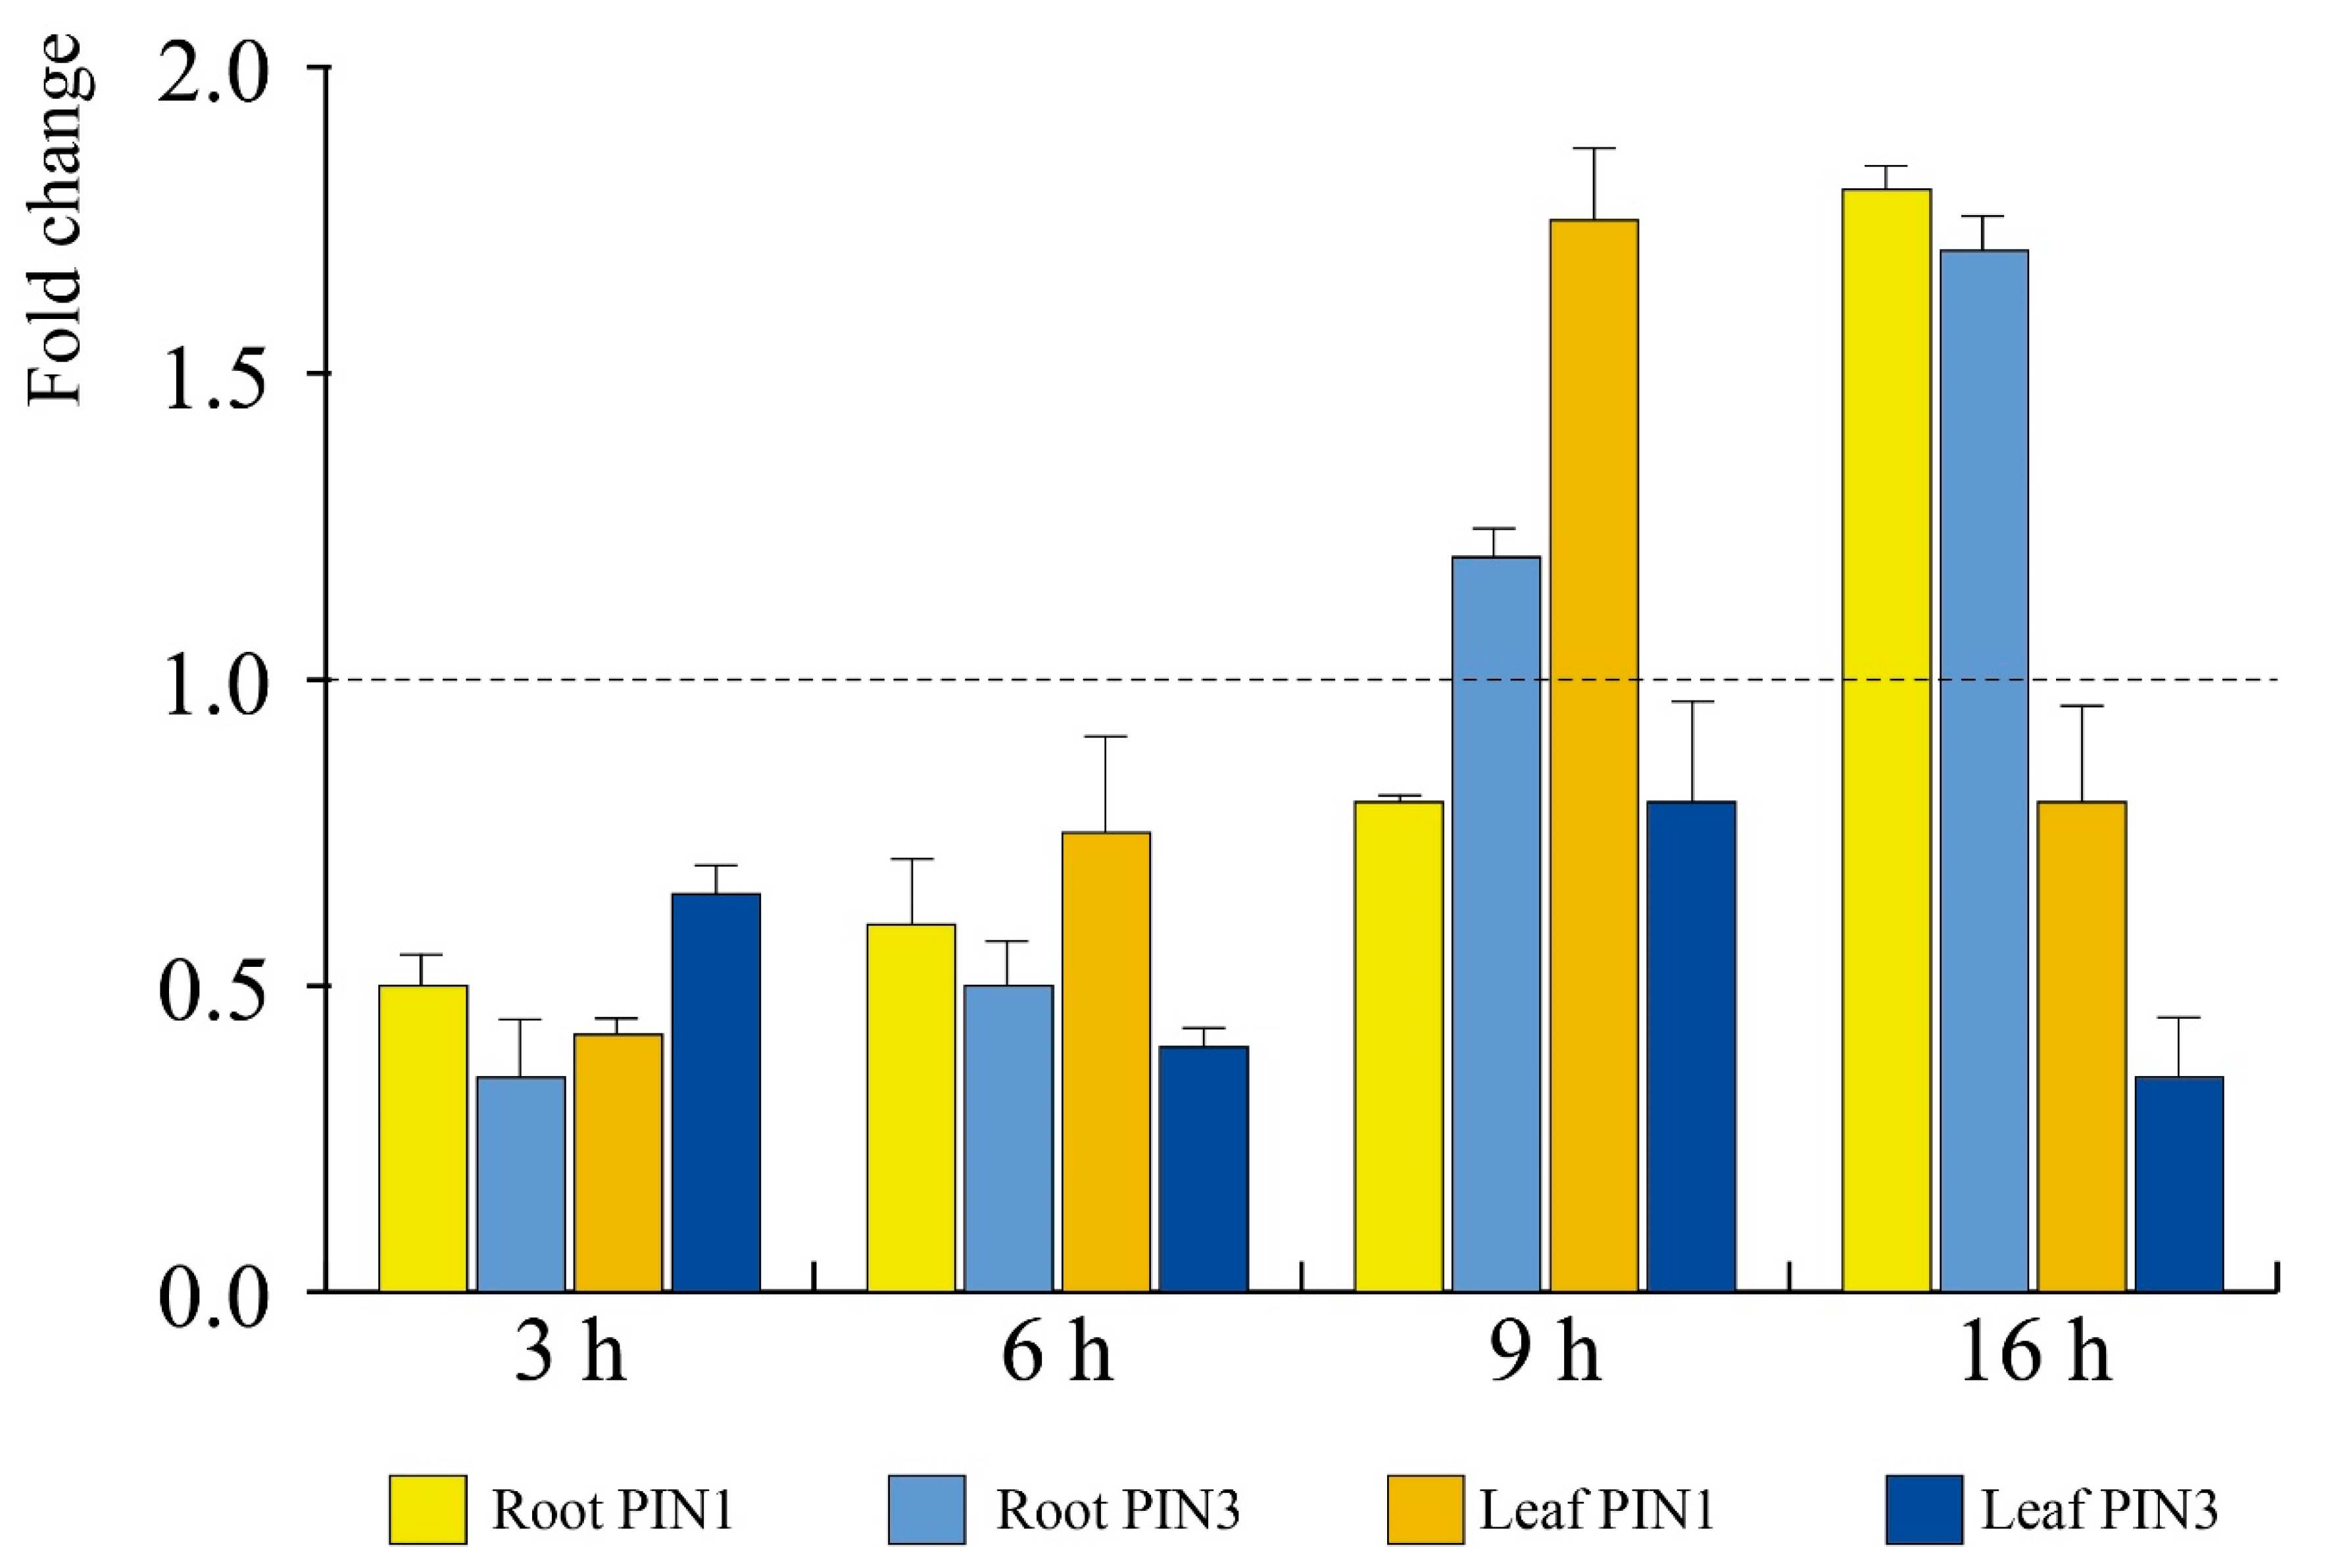
3.5. E. amylovora mVOCs Modulate Auxin Efflux Carriers PIN1 and PIN3 of A. thaliana Roots

E. amylovora mVOCs were found to enhance plant productivity and modulate root morphology of exposed A. thaliana seedlings. Therefore, because auxin plays a key regulatory role in plant growth and root morphology [119], we assayed the gene expression and localization of components of the auxin efflux machinery mediating polar auxin transport, PIN1 and PIN3 [120]. PIN1 mainly resides at the basal end of the vascular cells and regulates root hair initiation areas in the root epidermal cells [121] (see Figure 8C), while PIN3 is localized without polarity in the columella cells, predominantly basally in vascular cells, and laterally in pericycle cells of the elongation zone [122] (see Figure 8E). GUS staining of transgenic plants carrying the PIN1::GUS construct in the root meristem region of plants exposed to E. amylovora mVOCs for 16 h (Figure 8B) shows a higher staining in the vascular cells above the quiescence center with respect to control unexposed roots (Figure 8A). In PIN3::GUS mutants, we found a stronger expression in the lateral root cap in mVOCs-treated plants (Figure 8E) with respect to controls (Figure 8D).
We then evaluated the gene expression of PIN1 (AT1G73590) and PIN3 (AT1G70940) in the roots and shoots of control and mVOC-exposed A. thaliana seedlings in time-course experiments. Although the upregulation of PIN1 and PIN3 was not above two-fold with respect to controls, at early times of exposure root and leaf PIN1 and root PIN3 were significantly downregulated. The expression of root PIN1 increased with time of exposure to mVOCs with respect to controls (Figure 9), whereas in leaves the highest fold change was found after 9 h. The same trend was observed for root PIN3 gene expression, but leaves did not show significant upregulation (Figure 9).
Intercellular transport of auxin is essential for root morphogenesis, and here we showed that expression of A. thaliana PIN1 and PIN3 auxin transporters is enhanced by exposure to E. amylovora mVOCs. Biotic stress has been shown to alter PIN expression [123], and root-interacting beneficial and pathogenic microorganisms utilize auxin and its target genes to manipulate the performance of their hosts for their own needs [124,125]. Increased auxin levels caused by plant–bacterial interactions have been shown to alter root morphology and increase plant resistance to abiotic stress [126]. Although the upregulation of PIN1 and PIN2 was not so evident (fold-change below 2), a clear increasing trend in their gene expression was observed with time upon exposure to mVOCs.
Very recently, a link between ROS and both auxin distribution and the response has been observed in A. thaliana roots, with ROS production being necessary for orchestrating cell division and auxin flux during root development [127]. Therefore, our results confirm that ROS signaling is involved in auxin efflux during A. thaliana’s perception of E. amylovora mVOCs.

3.6. E. amylovora Synthetic mVOCs 1-nonanol and 1-dodecanol Alter Morphology and Induce Oxidative Stress in A. thaliana Seedlings

Although we are aware that evaluating identified mVOCs individually using their synthetic versions may miss VOC combinations that work synergistically [19], we tested two molecules identified in E. amylovora mVOCs and listed in Table 1: 1-nonanol and 1-dodecanol, and evaluated their role in plant morphology and ROS gene expression.
Eight-day-old A. thaliana seedlings were exposed to either 1-nonanol or 1-dodecanol at 20 µg, 50 µg, and 100 µg for 72 h, and the root length was measured before and after exposure to the synthetic mVOCs. These concentrations were considered by referring to literature data [13,14]. DMSO was used as a solvent. No significant difference was found among controls treated with DMSO. After 72 h exposure to either 1-nonanol or 1-dodecanol, we observed an induction of root growth (p < 0.05) when the synthetic molecules were used at 20 µg and 50 µg, whereas no significant differences were found for either of them at 100 µg (Figure 10).
As reported above, 1-nonanol was found to be associated with A. thaliana lateral root formation, suggesting a participation via jasmonic acid (JA) signaling [31], and our results confirm its promoting action on A. thaliana roots. We also measured the density of secondary root production, and we noticed a significant increase in secondary root emission (see Supplementary Figures S6 and S7).
Because we showed that auxin is involved in root mVOC response and considering that ROS are involved in cell division and auxin flux during primary and secondary root development [125], we assessed the expression of some key genes coding for enzymes involved in ROS production. We quantified the expression of the respiratory burst oxidase homolog RBOHH, which codes for a plasma membrane-located NADPH oxidase that produces the superoxide anion (O2•−), and of Cu/Zn-superoxide dismutase 1 (SOD1), which codes for a protein that reduces O2•− to H2O2 [128]. The latter molecule is detoxified to water by a number of scavenging enzymes, including catalase (CAT1), ascorbate peroxidases (APX1), and anionic peroxidase (PER4) [129,130].
In roots exposed to 1-nonanol (Figure 11A), RBOHH was downregulated at all 1-nonanol concentrations, whereas the other genes did not show a regulation higher than 2 folds, with the exception of SOD1, which was downregulated by exposing roots to 50 µg 1-nonanol. Shoots exposed to both 20 µg and 100 µg 1-nonanol always showed a strong gene downregulation, particularly for RBOHH (Figure 11B). Interestingly, exposure to 50 µg 1-nonanol strongly upregulated the tested genes, with CAT1 being the most upregulated (Figure 11B). Exposure to 1-dodecanol always downregulated RBOHH and showed for the other genes an upregulation at 20 µg and 100 µg and the same response as controls at 50 µg (Figure 11B). Finally, shoots exposed to 1-dodecanol showed a strong downregulation for RBOHH at all concentrations and no significant variations with respect to controls for almost all genes, with the exception of PER4, which was upregulated by 50 µg and 100 µg 1-dodecanol.
A direct comparison of the effects of the two synthetic mVOCs indicates a common downregulation of RBOHH at all tested concentrations. This gene is regulated by cytosolic calcium and protein phosphorylation, and its H2O2 production was found to dampen growth rate oscillations [131]; furthermore, some RBOHs have been found to activate ROS signaling [132]. Another common response is the lower regulation in roots with respect to shoots (see the different scales of Figure 11A,C vs. Figure 11B,D), with shoots appearing more sensitive to the presence of the synthetic mVOCs. A stronger root response was found for SOD1 in roots exposed to 1-dodecanol (Figure 12C) with respect to 1-nonanol (Figure 12A). SOD1 is cytosolic [133], and the overexpression of SOD1 increases the tolerance to pathogens in many plant species, including A. thaliana [134,135]. Shoots of seedlings exposed to both synthetic mVOCs show a strong upregulation of PER4, and the same occurred in roots exposed to 1-dodecanol. NO production activates the transcription of the defense-related gene PER4, which is putatively located in the endomembrane system and involved in the mechanisms underlying A. thaliana basal resistance to the phytopathogen Botrytis cinerea [136]. CAT1 was strongly upregulated in shoots exposed to 1-nonanol, and in A. thaliana mutants with increased levels of ROS, CAT1 activity was found to partially rescue growth [137]. Although APX1, an important defense enzyme, protects plant cells from disease agents via systemic acquired resistance [138], its regulation was almost always similar in controls and plants exposed to the synthetic mVOCs.

4. Conclusions

By using the model system HSCC, we showed that the phytopathogen E. amylovora emits mVOCs that are able to enhance A. thaliana growth and trigger cascades of both early and late events. The complex blend of mVOCs included volatile hydrocarbons, alkenes, alkanols, and alkanals, including 1-nonanol and 1-dodecanol that we tested as synthetic molecules. The results of this work show that the interactions between E. amylovora mVOCs and A. thaliana result in morphological and molecular changes. Perception of mVOC by A. thaliana was found both in roots and shoots, with the activation of early signaling events including cation channels (Ca2+ and K+) activity and plasma membrane (Vm) depolarization. These signaling pathways triggered a strong oxidative burst that was caused by the increased levels of both H2O2 and NO. Transcriptomic analyses allowed to identify hundreds of DEGs that were further processed by protein–protein association and interaction revealing the presence of genes responding to phytohormones, with particular reference to ABA, gibberellic acid, and auxins, the latter being associated with the modulated root morphology and growth. The increased plant growth was related to the strong downregulation of seed storage proteins and late embryogenic abundant proteins, suggesting that the bacterium mVOCs might play a role in the mobilization of plant reserves. We hypothesize that this could be a strategy by the microorganism to obtain a higher availability of resources. Finally, we tested two among the various mVOCs produced by E. amylovora (1-nonanol and 1-dodecanol), and we confirmed that they are effective in root promotion and in ROS production and scavenging. The differential modulation by the two molecules confirms the hypothesis that mVOCs act in a synergistic way and further studies are needed to assess the specific role of each individual mVOC composing the microbially emitted blend. However, it has to be considered that not all mVOC molecules, which have bioactive properties, may influence A. thaliana growth through the same mechanism and that a specific receptor might exist. In fact, some mVOCs could be transported into the cytoplasm through the plasma membrane, especially if they are present in the extracellular space in gaseous form.
The scheme of Figure 12 summarizes the early and late events occurring in A. thaliana seedlings upon perception of E. amylovora mVOCs.

Supplementary Materials

The following supporting information can be downloaded at: https://www.mdpi.com/article/10.3390/antiox12030600/s1, Dataset S1: gene analysis by GeneSpring, gene expression and gene ontology; Figure S1: Seedlings of A. thaliana cultivated in the presence of synthetic mVOCs; Figure S2: GC-MS Spectra data; Figure S3: Functional characterization of DEGs; Figure S4: Validation of microarray data; Figure S5: DR5::GUS staining and control GFP localization of PIN1 and PIN3; Figure S6: Root length and production of secondary roots in representative portions of Petri dishes containing different concentrations of the two synthetic mVOCs; Figure S7: Density plots of secondary root production in controls and in A. thaliana seedlings exposed to the two synthetic mVOCs; Table S1: List of primers used in this work; Table S2: Differentially expressed genes in seedlings of A. thaliana exposed to E. amylovora mVOCs.

Author Contributions

Conceptualization, C.N.K., M.M. and M.E.M.; methodology, A.S.P., C.N.K., I.A.P., S.B., M.M. and M.E.M.; validation, A.S.P., C.N.K., I.A.P., S.B., M.M. and M.E.M.; formal analysis, A.S.P., C.N.K., I.A.P., S.B., M.M. and M.E.M.; investigation, A.S.P., C.N.K., I.A.P., S.B., M.M. and M.E.M.; resources, M.M. and M.E.M.; data curation, M.E.M.; writing—original draft preparation, M.E.M.; writing—review and editing, A.S.P., C.N.K., I.A.P., S.B., M.M. and M.E.M.; supervision, M.M. and M.E.M.; project administration, M.E.M.; funding acquisition, M.M. and M.E.M. All authors have read and agreed to the published version of the manuscript.

Funding

This research was funded by the University of Turin, Italy, grant RILO_2021 and by Edmund Mach Foundation grant Appleera transvol funded by Autonomous Province of Trento.

Data Availability Statement

Data are provided in Supplementary Materials and are available on request.

Acknowledgments

The authors are grateful to C.M. Bertea, F. Verrillo, and A. Occhipinti for technical assistance during early experiments.

Conflicts of Interest

The authors declare no conflict of interest.

References

  1. Malnoy, M.; Martens, S.; Norelli, J.L.; Barny, M.A.; Sundin, G.W.; Smits, T.H.; Duffy, B. Fire blight: Applied genomic insights of the pathogen and host. Annu. Rev. Phytopathol. 2012, 50, 475–494. [Google Scholar] [CrossRef] [PubMed] [Green Version]
  2. Yuan, X.; Hulin, M.T.; Sundin, G.W. Effectors, chaperones, and harpins of the Type III secretion system in the fire blight pathogen Erwinia amylovora: A review. J. Plant Pathol. 2021, 103, 25–39. [Google Scholar] [CrossRef]
  3. Pineda, A.; Soler, R.; Weldegergis, B.T.; Shimwela, M.M.; JJ, V.A.N.L.; Dicke, M. Non-pathogenic rhizobacteria interfere with the attraction of parasitoids to aphid-induced plant volatiles via jasmonic acid signalling. Plant Cell Environ. 2013, 36, 393–404. [Google Scholar] [CrossRef]
  4. Park, H.B.; Lee, B.; Kloepper, J.W.; Ryu, C.M. One shot-two pathogens blocked: Exposure of Arabidopsis to hexadecane, a long chain volatile organic compound, confers induced resistance against both Pectobacterium carotovorum and Pseudomonas syringae. Plant Signal. Behav. 2013, 8, e24619. [Google Scholar] [CrossRef] [PubMed] [Green Version]
  5. Bailly, A.; Weisskopf, L. The modulating effect of bacterial volatiles on plant growth: Current knowledge and future challenges. Plant Signal. Behav. 2012, 7, 79–85. [Google Scholar] [CrossRef] [Green Version]
  6. Al-Ani, L.K.T.; Franzino, T.; Aguilar-Marcelino, L.; Haichar, F.E.Z.; Furtado, E.L.; Raza, W.; Jatoi, G.H.; Raza, M. Chapter 14—The role of microbial signals in plant growth and development: Current status and future prospects. In New and Future Developments in Microbial Biotechnology and Bioengineering; Rastegari, A.A., Yadav, A.N., Yadav, N., Eds.; Elsevier: Amsterdam, The Netherlands, 2020; pp. 225–242. [Google Scholar]
  7. Bais, H.P.; Park, S.-W.; Weir, T.L.; Callaway, R.M.; Vivanco, J.M. How plants communicate using the underground information superhighway. Trends Plant Sci. 2004, 9, 26–32. [Google Scholar] [CrossRef] [PubMed]
  8. Van Loon, L.C.; Bakker, P.A.; Pieterse, C.M. Systemic resistance induced by rhizosphere bacteria. Annu. Rev. Phytopathol. 1998, 36, 453–483. [Google Scholar] [CrossRef] [PubMed] [Green Version]
  9. Jones, J.D.G.; Dangl, J.L. The plant immune system. Nature 2006, 444, 323–329. [Google Scholar] [CrossRef] [PubMed] [Green Version]
  10. Maffei, M.E.; Arimura, G.I.; Mithofer, A. Natural elicitors, effectors and modulators of plant responses. Nat. Prod. Rep. 2012, 29, 1288–1303. [Google Scholar] [CrossRef]
  11. Gallucci, S.; Maffei, M.E. DNA Sensing across the Tree of Life. Trends Immunol. 2017, 38, 719–732. [Google Scholar] [CrossRef]
  12. Millet, Y.A.; Danna, C.H.; Clay, N.K.; Songnuan, W.; Simon, M.D.; Werck-Reichhart, D.; Ausubel, F.M. Innate Immune Responses Activated in Arabidopsis Roots by Microbe-Associated Molecular Patterns. Plant Cell 2010, 22, 973–990. [Google Scholar] [CrossRef] [PubMed] [Green Version]
  13. Kanchiswamy, C.N.; Mainoy, M.; Maffei, M.E. Chemical diversity of microbial volatiles and their potential for plant growth and productivity. Front. Plant Sci. 2015, 6, 23. [Google Scholar] [CrossRef] [PubMed] [Green Version]
  14. Kanchiswamy, C.N.; Malnoy, M.; Maffei, M.E. Bioprospecting bacterial and fungal volatiles for sustainable agriculture. Trends Plant Sci. 2015, 20, 206–211. [Google Scholar] [CrossRef] [PubMed]
  15. Chandrasekaran, M.; Paramasivan, M.; Sahayarayan, J.J. Microbial Volatile Organic Compounds: An Alternative for Chemical Fertilizers in Sustainable Agriculture Development. Microorganisms 2022, 11, 42. [Google Scholar] [CrossRef]
  16. Ravelo-Ortega, G.; Raya-González, J.; López-Bucio, J. Compounds from rhizosphere microbes that promote plant growth. Curr. Opin. Plant Biol. 2023, 73, 102336. [Google Scholar] [CrossRef]
  17. Álvarez-García, S.; Manga-Robles, A.; Encina, A.; Gutiérrez, S.; Casquero, P.A. Novel culture chamber to evaluate in vitro plant-microbe volatile interactions: Effects of Trichoderma harzianum volatiles on wheat plantlets. Plant Sci. Int. J. Exp. Plant Biol. 2022, 320, 111286. [Google Scholar] [CrossRef]
  18. Girón-Calva, P.S.; Molina-Torres, J.; Heil, M. Volatile dose and exposure time impact perception in neighboring plants. J. Chem. Ecol. 2012, 38, 226–228. [Google Scholar] [CrossRef] [PubMed]
  19. Bitas, V.; Kim, H.S.; Bennett, J.W.; Kang, S. Sniffing on microbes: Diverse roles of microbial volatile organic compounds in plant health. Mol. Plant-Microbe Interact. MPMI 2013, 26, 835–843. [Google Scholar] [CrossRef] [PubMed] [Green Version]
  20. Splivallo, R.; Bossi, S.; Maffei, M.; Bonfante, P. Discrimination of truffle fruiting body versus mycelial aromas by stir bar sorptive extraction. Phytochemistry 2007, 68, 2584–2598. [Google Scholar] [CrossRef] [PubMed]
  21. Barbero, F.; Guglielmotto, M.; Islam, M.; Maffei, M.E. Extracellular Fragmented Self-DNA Is Involved in Plant Responses to Biotic Stress. Front. Plant Sci. 2021, 12, 17. [Google Scholar] [CrossRef]
  22. Mithöfer, A.; Mazars, C.; Maffei, M.E. Probing Spatio-temporal Intracellular Calcium Variations in Plants. Methods Mol. Biol. (Clifton N.J.) 2009, 479, 79–92. [Google Scholar]
  23. Bricchi, I.; Occhipinti, A.; Bertea, C.M.; Zebelo, S.A.; Brillada, C.; Verrillo, F.; De Castro, C.; Molinaro, A.; Faulkner, C.; Maule, A.J.; et al. Separation of early and late responses to herbivory in Arabidopsis by changing plasmodesmal function. Plant J. 2013, 73, 14–25. [Google Scholar] [CrossRef] [PubMed] [Green Version]
  24. Zebelo, S.A.; Maffei, M.E. The ventral eversible gland (VEG) of Spodoptera littoralis triggers early responses to herbivory in Arabidopsis thaliana. Arthropod-Plant Interact. 2012, 6, 543–551. [Google Scholar] [CrossRef]
  25. Paponov, I.A.; Fliegmann, J.; Narayana, R.; Maffei, M.E. Differential root and shoot magnetoresponses in Arabidopsis thaliana. Sci. Rep. 2021, 11, 14. [Google Scholar] [CrossRef]
  26. Brazma, A.; Hingamp, P.; Quackenbush, J.; Sherlock, G.; Spellman, P.; Stoeckert, C.; Aach, J.; Ansorge, W.; Ball, C.A.; Causton, H.C.; et al. Minimum information about a microarray experiment (MIAME)—Toward standards for microarray data. Nat. Genet. 2001, 29, 365–371. [Google Scholar] [CrossRef]
  27. Edgar, R.; Domrachev, M.; Lash, A.E. Gene Expression Omnibus: NCBI gene expression and hybridization array data repository. Nucleic Acids Res. 2002, 30, 207–210. [Google Scholar] [CrossRef] [Green Version]
  28. Bawa, G.; Liu, Z.; Wu, R.; Zhou, Y.; Liu, H.; Sun, S.; Liu, Y.; Qin, A.; Yu, X.; Zhao, Z.; et al. PIN1 regulates epidermal cells development under drought and salt stress using single-cell analysis. Front. Plant Sci. 2022, 13, 1043204. [Google Scholar] [CrossRef]
  29. Gentleman, R.; Carey, V.J.; Huber, W.; Irizarry, R.A.; Dudoit, S. Bioinformatics and Computational Biology Solutions Using R and Bioconductor; Springer: New York, NY, USA, 2006. [Google Scholar]
  30. Szklarczyk, D.; Gable, A.L.; Lyon, D.; Junge, A.; Wyder, S.; Huerta-Cepas, J.; Simonovic, M.; Doncheva, N.T.; Morris, J.H.; Bork, P.; et al. STRING v11: Protein-protein association networks with increased coverage, supporting functional discovery in genome-wide experimental datasets. Nucleic Acids Res. 2019, 47, D607–D613. [Google Scholar] [CrossRef] [Green Version]
  31. Gamboa-Becerra, R.; Desgarennes, D.; Molina-Torres, J.; Ramírez-Chávez, E.; Kiel-Martínez, A.L.; Carrión, G.; Ortiz-Castro, R. Plant growth-promoting and non-promoting rhizobacteria from avocado trees differentially emit volatiles that influence growth of Arabidopsis thaliana. Protoplasma 2022, 259, 835–854. [Google Scholar] [CrossRef] [PubMed]
  32. Phoka, N.; Suwannarach, N.; Lumyong, S.; Ito, S.I.; Matsui, K.; Arikit, S.; Sunpapao, A. Role of Volatiles from the Endophytic Fungus Trichoderma asperelloides PSU-P1 in Biocontrol Potential and in Promoting the Plant Growth of Arabidopsis thaliana. J. Fungi (Basel Switz.) 2020, 6, 341. [Google Scholar] [CrossRef] [PubMed]
  33. Ryu, C.M.; Farag, M.A.; Hu, C.H.; Reddy, M.S.; Wei, H.X.; Paré, P.W.; Kloepper, J.W. Bacterial volatiles promote growth in Arabidopsis. Proc. Natl. Acad. Sci. USA 2003, 100, 4927–4932. [Google Scholar] [CrossRef] [Green Version]
  34. Amavizca, E.; Bashan, Y.; Ryu, C.-M.; Farag, M.A.; Bebout, B.M.; de-Bashan, L.E. Enhanced performance of the microalga Chlorella sorokiniana remotely induced by the plant growth-promoting bacteria Azospirillum brasilense and Bacillus pumilus. Sci. Rep. 2017, 7, 41310. [Google Scholar] [CrossRef]
  35. Buśko, M.; Kulik, T.; Ostrowska, A.; Góral, T.; Perkowski, J. Quantitative volatile compound profiles in fungal cultures of three different Fusarium graminearum chemotypes. FEMS Microbiol. Lett. 2014, 359, 85–93. [Google Scholar] [CrossRef] [Green Version]
  36. Blom, D.; Fabbri, C.; Connor, E.C.; Schiestl, F.P.; Klauser, D.R.; Boller, T.; Eberl, L.; Weisskopf, L. Production of plant growth modulating volatiles is widespread among rhizosphere bacteria and strongly depends on culture conditions. Environ. Microbiol. 2011, 13, 3047–3058. [Google Scholar] [CrossRef]
  37. Schulz, S.; Dickschat, J.S. Bacterial volatiles: The smell of small organisms. Nat. Prod. Rep. 2007, 24, 814–842. [Google Scholar] [CrossRef] [PubMed]
  38. Hunziker, L.; Bönisch, D.; Groenhagen, U.; Bailly, A.; Schulz, S.; Weisskopf, L. Pseudomonas Strains Naturally Associated with Potato Plants Produce Volatiles with High Potential for Inhibition of Phytophthora infestans. Appl. Environ. Microbiol. 2015, 81, 821–830. [Google Scholar] [CrossRef] [Green Version]
  39. Gutiérrez-Luna, F.M.; López-Bucio, J.; Altamirano-Hernández, J.; Valencia-Cantero, E.; de la Cruz, H.R.; Macías-Rodríguez, L. Plant growth-promoting rhizobacteria modulate root-system architecture in Arabidopsis thaliana through volatile organic compound emission. Symbiosis 2010, 51, 75–83. [Google Scholar] [CrossRef]
  40. Tait, E.; Perry, J.D.; Stanforth, S.P.; Dean, J.R. Identification of volatile organic compounds produced by bacteria using HS-SPME-GC-MS. J. Chromatogr. Sci. 2014, 52, 363–373. [Google Scholar] [CrossRef] [PubMed] [Green Version]
  41. Ercolini, D.; Russo, F.; Nasi, A.; Ferranti, P.; Villani, F. Mesophilic and psychrotrophic bacteria from meat and their spoilage potential in vitro and in beef. Appl Env. Microbiol 2009, 75, 1990–2001. [Google Scholar] [CrossRef] [Green Version]
  42. Mauriello, G.; Marino, R.; D’Auria, M.; Cerone, G.; Rana, G.L. Determination of Volatile Organic Compounds from Truffles via SPME-GC-MS. J. Chromatogr. Sci. 2004, 42, 299–305. [Google Scholar] [CrossRef] [PubMed]
  43. Sheoran, N.; Valiya Nadakkakath, A.; Munjal, V.; Kundu, A.; Subaharan, K.; Venugopal, V.; Rajamma, S.; Eapen, S.J.; Kumar, A. Genetic analysis of plant endophytic Pseudomonas putida BP25 and chemo-profiling of its antimicrobial volatile organic compounds. Microbiol. Res. 2015, 173, 66–78. [Google Scholar] [CrossRef]
  44. Brock, N.L.; Tudzynski, B.; Dickschat, J.S. Biosynthesis of sesqui- and diterpenes by the gibberellin producer Fusarium fujikuroi. Chembiochem A Eur. J. Chem. Biol. 2011, 12, 2667–2676. [Google Scholar] [CrossRef] [PubMed]
  45. Nakano, C.; Kim, H.-K.; Ohnishi, Y. Identification of the First Bacterial Monoterpene Cyclase, a 1,8-Cineole Synthase, that Catalyzes the Direct Conversion of Geranyl Diphosphate. Chembiochem A Eur. J. Chem. Biol. 2011, 12, 1988–1991. [Google Scholar] [CrossRef]
  46. Piechulla, B.; Schnitzler, J.P. Circumvent CO2 Effects in Volatile-Based Microbe-Plant Interactions. Trends Plant Sci. 2016, 21, 541–543. [Google Scholar] [CrossRef]
  47. Boller, T. Chemoperception of Microbial Signals in Plant Cells. Annu. Rev. Plant Physiol. Plant Mol. Biol. 1995, 46, 189–214. [Google Scholar] [CrossRef]
  48. Baker, B.; Zambryski, P.; Staskawicz, B.; Dinesh-Kumar, S.P. Signaling in plant-microbe interactions. Science 1997, 276, 726–733. [Google Scholar] [CrossRef]
  49. Felle, H.H.; Kondorosi, É.; Kondorosi, Á.; Schultze, M. How Alfalfa Root Hairs Discriminate between Nod Factors and Oligochitin Elicitors. Plant Physiol. 2000, 124, 1373–1380. [Google Scholar] [CrossRef] [PubMed] [Green Version]
  50. Mithöfer, A.; Ebel, J.; Felle, H.H. Cation Fluxes Cause Plasma Membrane Depolarization Involved in β-Glucan Elicitor-Signaling in Soybean Roots. Mol. Plant-Microbe Interact. 2005, 18, 983–990. [Google Scholar] [CrossRef] [Green Version]
  51. THAIN, J.F.; GUBB, I.R.; WILDON, D.C. Depolarization of tomato leaf cells by oligogalacturonide elicitors. Plant Cell Environ. 1995, 18, 211–214. [Google Scholar] [CrossRef]
  52. Maffei, M.; Camusso, W.; Sacco, S. Effect of Mentha x piperita essential oil and monoterpenes on cucumber root membrane potential. Phytochemistry 2001, 58, 703–707. [Google Scholar] [CrossRef]
  53. Maffei, M.E.; Gertsch, J.; Appendino, G. Plant volatiles: Production, function and pharmacology. Nat. Prod. Rep. 2011, 28, 1359–1380. [Google Scholar] [CrossRef] [PubMed]
  54. Lecourieux, D.; Ranjeva, R.; Pugin, A. Calcium in plant defence-signalling pathways. New Phytol. 2006, 171, 249–269. [Google Scholar] [CrossRef] [PubMed]
  55. Zimmermann, S.; Sentenac, H. Plant ion channels: From molecular structures to physiological functions. Curr. Opin. Plant Biol. 1999, 2, 477–482. [Google Scholar] [CrossRef]
  56. Ivashikina, N.; Becker, D.; Ache, P.; Meyerhoff, O.; Felle, H.H.; Hedrich, R. K(+) channel profile and electrical properties of Arabidopsis root hairs. FEBS Lett. 2001, 508, 463–469. [Google Scholar] [CrossRef] [Green Version]
  57. El-Maarouf, H.; Barny, M.A.; Rona, J.P.; Bouteau, F. Harpin, a hypersensitive response elicitor from Erwinia amylovora, regulates ion channel activities in Arabidopsis thaliana suspension cells. FEBS Lett. 2001, 497, 82–84. [Google Scholar] [CrossRef] [PubMed] [Green Version]
  58. Vadassery, J.; Ranf, S.; Drzewiecki, C.; Mithofer, A.; Mazars, C.; Scheel, D.; Lee, J.; Oelmuller, R. A cell wall extract from the endophytic fungus Piriformospora indica promotes growth of Arabidopsis seedlings and induces intracellular calcium elevation in roots. Plant J. 2009, 59, 193–206. [Google Scholar] [CrossRef]
  59. Zebelo, S.A.; Matsui, K.; Ozawa, R.; Maffei, M.E. Plasma membrane potential depolarization and cytosolic calcium flux are early events involved in tomato (Solanum lycopersicon) plant-to-plant communication. Plant Sci. 2012, 196, 93–100. [Google Scholar] [CrossRef]
  60. Zebelo, S.A.; Maffei, M.E. Role of early signalling events in plant-insect interactions. J. Exp. Bot. 2015, 66, 435–448. [Google Scholar] [CrossRef] [Green Version]
  61. Lamb, C.; Dixon, R.A. The oxidative burst in plant disease resistance. Annu. Rev. Plant Physiol. Plant Mol. Biol. 1997, 48, 251–275. [Google Scholar] [CrossRef]
  62. Vandelle, E.; Ling, T.F.; Imanifard, Z.; Liu, R.T.; Delledonne, M.; Bellin, D. Nitric Oxide Signaling during the Hypersensitive Disease Resistance Response. In Nitric Oxide and Signaling in Plants; Wendehenne, D., Ed.; Academic Press Ltd.-Elsevier Science Ltd.: London, UK, 2016; Volume 77, pp. 219–243. [Google Scholar]
  63. Glazener, J.A.; Orlandi, E.W.; Baker, C.J. The Active Oxygen Response of Cell Suspensions to Incompatible Bacteria Is Not Sufficient to Cause Hypersensitive Cell Death. Plant Physiol 1996, 110, 759–763. [Google Scholar] [CrossRef] [Green Version]
  64. Venisse, J.-S.p.; Gullner, G.; Brisset, M.-N.l. Evidence for the Involvement of an Oxidative Stress in the Initiation of Infection of Pear by Erwinia amylovora 1. Plant Physiol. 2001, 125, 2164–2172. [Google Scholar] [CrossRef] [Green Version]
  65. Launay, A.; Patrit, O.; Wénès, E.; Fagard, M. DspA/E Contributes to Apoplastic Accumulation of ROS in Non-host A. thaliana. Front. Plant Sci. 2016, 7, 545. [Google Scholar] [CrossRef] [Green Version]
  66. Bellin, D.; Asai, S.; Delledonne, M.; Yoshioka, H. Nitric Oxide as a Mediator for Defense Responses. Mol. Plant-Microbe Interact. 2013, 26, 271–277. [Google Scholar] [CrossRef] [Green Version]
  67. Wei, Y.; Liu, G.; Chang, Y.; He, C.; Shi, H. Heat shock transcription factor 3 regulates plant immune response through modulation of salicylic acid accumulation and signalling in cassava. Mol. Plant Pathol. 2018, 19, 2209–2220. [Google Scholar] [CrossRef] [PubMed]
  68. Miller, G.; Mittler, R. Could heat shock transcription factors function as hydrogen peroxide sensors in plants? Ann. Bot. 2006, 98, 279–288. [Google Scholar] [CrossRef] [Green Version]
  69. Berka, M.; Kopecka, R.; Berkova, V.; Brzobohaty, B.; Cerny, M. Regulation of heat shock proteins 70 and their role in plant immunity. J. Exp. Bot. 2022, 73, 1894–1909. [Google Scholar] [CrossRef] [PubMed]
  70. Strasser, R. Protein Quality Control in the Endoplasmic Reticulum of Plants. Annu. Rev. Plant Biol. 2018, 69, 147–172. [Google Scholar] [CrossRef]
  71. Park, C.J.; Song, M.Y.; Kim, C.Y.; Jeon, J.S.; Ronald, P.C. Rice BiP3 regulates immunity mediated by the PRRs XA3 and XA21 but not immunity mediated by the NB-LRR protein, Pi5. Biochem. Biophys. Res. Commun. 2014, 448, 70–75. [Google Scholar] [CrossRef]
  72. Li, C.H.; Cao, S.F.; Wang, K.T.; Lei, C.Y.; Ji, N.N.; Xu, F.; Jiang, Y.B.; Qiu, L.L.; Zheng, Y.H. Heat Shock Protein HSP24 Is Involved in the BABA-Induced Resistance to Fungal Pathogen in Postharvest Grapes Underlying an NPR1-Dependent Manner. Front. Plant Sci. 2021, 12, 17. [Google Scholar] [CrossRef] [PubMed]
  73. Liu, Y.; Wang, L.; Xing, X.; Sun, L.P.; Pan, J.W.; Kong, X.P.; Zhang, M.Y.; Li, D.Q. ZmLEA3, a Multifunctional Group 3 LEA Protein from Maize (Zea mays L.), is Involved in Biotic and Abiotic Stresses. Plant Cell Physiol. 2013, 54, 944–959. [Google Scholar] [CrossRef] [Green Version]
  74. Salleh, F.M.; Evans, K.; Goodall, B.; Machin, H.; Mowla, S.B.; Mur, L.A.J.; Runions, J.; Theodoulou, F.L.; Foyer, C.H.; Rogers, H.J. A novel function for a redox-related LEA protein (SAG21/AtLEA5) in root development and biotic stress responses. Plant Cell Environ. 2012, 35, 418–429. [Google Scholar] [CrossRef] [PubMed] [Green Version]
  75. Hundertmark, M.; Hincha, D.K. LEA (Late Embryogenesis Abundant) proteins and their encoding genes in Arabidopsis thaliana. BMC Genom. 2008, 9, 118. [Google Scholar] [CrossRef] [Green Version]
  76. Kim, W.; Lee, Y.; Park, J.; Lee, N.; Choi, G. HONSU, a Protein Phosphatase 2C, Regulates Seed Dormancy by Inhibiting ABA Signaling in Arabidopsis. Plant Cell Physiol. 2013, 54, 555–572. [Google Scholar] [CrossRef] [Green Version]
  77. Lim, C.W.; Kim, J.-H.; Baek, W.; Kim, B.S.; Lee, S.C. Functional roles of the protein phosphatase 2C, AtAIP1, in abscisic acid signaling and sugar tolerance in Arabidopsis. Plant Sci. 2012, 187, 83–88. [Google Scholar] [CrossRef]
  78. Yoshida, T.; Nishimura, N.; Kitahata, N.; Kuromori, T.; Ito, T.; Asami, T.; Shinozaki, K.; Hirayama, T. ABA-Hypersensitive Germination3 Encodes a Protein Phosphatase 2C (AtPP2CA) That Strongly Regulates Abscisic Acid Signaling during Germination among Arabidopsis Protein Phosphatase 2Cs. Plant Physiol. 2005, 140, 115–126. [Google Scholar] [CrossRef] [Green Version]
  79. Guillaumot, D.; Guillon, S.; Déplanque, T.; Vanhee, C.; Gumy, C.; Masquelier, D.; Morsomme, P.; Batoko, H. The Arabidopsis TSPO-related protein is a stress and abscisic acid-regulated, endoplasmic reticulum–Golgi-localized membrane protein. Plant J. 2009, 60, 242–256. [Google Scholar] [CrossRef] [PubMed]
  80. Lehtonen, M.T.; Akita, M.; Frank, W.; Reski, R.; Valkonen, J.P.T. Involvement of a Class III Peroxidase and the Mitochondrial Protein TSPO in Oxidative Burst Upon Treatment of Moss Plants with a Fungal Elicitor. Mol. Plant-Microbe Interact. 2012, 25, 363–371. [Google Scholar] [CrossRef] [Green Version]
  81. Xu, J.; Trainotti, L.; Li, M.; Varotto, C. Overexpression of Isoprene Synthase Affects ABA- and Drought-Related Gene Expression and Enhances Tolerance to Abiotic Stress. Int. J. Mol. Sci. 2020, 21, 4276. [Google Scholar] [CrossRef]
  82. Zhang, X.; Dai, Y.; Xiong, Y.; DeFraia, C.; Li, J.; Dong, X.; Mou, Z. Overexpression of Arabidopsis MAP kinase kinase 7 leads to activation of plant basal and systemic acquired resistance. Plant J. Cell Mol. Biol. 2007, 52, 1066–1079. [Google Scholar] [CrossRef]
  83. Dai, Y.; Wang, H.; Li, B.; Huang, J.; Liu, X.; Zhou, Y.; Mou, Z.; Li, J. Increased expression of MAP KINASE KINASE7 causes deficiency in polar auxin transport and leads to plant architectural abnormality in Arabidopsis. Plant Cell 2006, 18, 308–320. [Google Scholar] [CrossRef] [Green Version]
  84. Marmagne, A.; Ferro, M.; Meinnel, T.; Bruley, C.; Kuhn, L.; Garin, J.; Barbier-Brygoo, H.; Ephritikhine, G. A High Content in Lipid-modified Peripheral Proteins and Integral Receptor Kinases Features in the <em>Arabidopsis</em> Plasma Membrane Proteome *. Mol. Cell. Proteom. 2007, 6, 1980–1996. [Google Scholar]
  85. Pei, L.; Peng, L.; Wan, X.; Xiong, J.; Liu, Z.; Li, X.; Yang, Y.; Wang, J. Expression Pattern and Function Analysis of AtPPRT1, a Novel Negative Regulator in ABA and Drought Stress Responses in Arabidopsis. Int. J. Mol. Sci. 2019, 20, 394. [Google Scholar] [CrossRef] [Green Version]
  86. Bueso, E.; Ibañez, C.; Sayas, E.; Muñoz-Bertomeu, J.; Gonzalez-Guzmán, M.; Rodriguez, P.L.; Serrano, R. A forward genetic approach in Arabidopsis thaliana identifies a RING-type ubiquitin ligase as a novel determinant of seed longevity. Plant Sci. 2014, 215-216, 110–116. [Google Scholar] [CrossRef] [PubMed]
  87. Bueso, E.; Rodriguez, L.; Lorenzo-Orts, L.; Gonzalez-Guzman, M.; Sayas, E.; Muñoz-Bertomeu, J.; Ibañez, C.; Serrano, R.; Rodriguez, P.L. The single-subunit RING-type E3 ubiquitin ligase RSL1 targets PYL4 and PYR1 ABA receptors in plasma membrane to modulate abscisic acid signaling. Plant J. Cell Mol. Biol. 2014, 80, 1057–1071. [Google Scholar] [CrossRef]
  88. Krebbers, E.; Herdies, L.; De Clercq, A.; Seurinck, J.; Leemans, J.; Van Damme, J.; Segura, M.; Gheysen, G.; Van Montagu, M.; Vandekerckhove, J. Determination of the Processing Sites of an Arabidopsis 2S Albumin and Characterization of the Complete Gene Family. Plant Physiol 1988, 87, 859–866. [Google Scholar] [CrossRef] [Green Version]
  89. Li, Q.; Wang, B.C.; Xu, Y.; Zhu, Y.X. Systematic studies of 12S seed storage protein accumulation and degradation patterns during Arabidopsis seed maturation and early seedling germination stages. J. Biochem. Mol. Biol. 2007, 40, 373–381. [Google Scholar] [CrossRef]
  90. McCarty, D.R. Genetic Control and Integration of Maturation and Germination Pathways in Seed Development. Annu. Rev. Plant Physiol. Plant Mol. Biol. 1995, 46, 71–93. [Google Scholar] [CrossRef]
  91. Kagaya, Y.; Okuda, R.; Ban, A.; Toyoshima, R.; Tsutsumida, K.; Usui, H.; Yamamoto, A.; Hattori, T. Indirect ABA-dependent regulation of seed storage protein genes by FUSCA3 transcription factor in Arabidopsis. Plant Cell Physiol. 2005, 46, 300–311. [Google Scholar] [CrossRef] [PubMed]
  92. Nakashima, K.; Fujita, Y.; Katsura, K.; Maruyama, K.; Narusaka, Y.; Seki, M.; Shinozaki, K.; Yamaguchi-Shinozaki, K. Transcriptional Regulation of ABI3- and ABA-responsive Genes Including RD29B and RD29A in Seeds, Germinating Embryos, and Seedlings of Arabidopsis. Plant Mol. Biol. 2006, 60, 51–68. [Google Scholar] [CrossRef]
  93. Parcy, F.; Valon, C.; Raynal, M.; Gaubier-Comella, P.; Delseny, M.; Giraudat, J. Regulation of gene expression programs during Arabidopsis seed development: Roles of the ABI3 locus and of endogenous abscisic acid. Plant Cell 1994, 6, 1567–1582. [Google Scholar] [PubMed] [Green Version]
  94. Furihata, T.; Maruyama, K.; Fujita, Y.; Umezawa, T.; Yoshida, R.; Shinozaki, K.; Yamaguchi-Shinozaki, K. Abscisic acid-dependent multisite phosphorylation regulates the activity of a transcription activator AREB1. Proc. Natl. Acad. Sci. USA 2006, 103, 1988–1993. [Google Scholar] [CrossRef] [PubMed] [Green Version]
  95. Sels, J.; Mathys, J.; De Coninck, B.M.; Cammue, B.P.; De Bolle, M.F. Plant pathogenesis-related (PR) proteins: A focus on PR peptides. Plant Physiol. Biochem. PPB 2008, 46, 941–950. [Google Scholar] [CrossRef] [PubMed]
  96. Zheng, L.; Otani, M.; Kanno, Y.; Seo, M.; Yoshitake, Y.; Yoshimoto, K.; Sugimoto, K.; Kawakami, N. Seed dormancy 4 like1 of Arabidopsis is a key regulator of phase transition from embryo to vegetative development. Plant J. Cell Mol. Biol. 2022, 112, 460–475. [Google Scholar] [CrossRef] [PubMed]
  97. Chen, F.; Tholl, D.; D’Auria, J.C.; Farooq, A.; Pichersky, E.; Gershenzon, J. Biosynthesis and emission of terpenoid volatiles from Arabidopsis flowers. Plant Cell 2003, 15, 481–494. [Google Scholar] [CrossRef] [Green Version]
  98. Beck, G.; Coman, D.; Herren, E.; Ruiz-Sola, M.A.; Rodríguez-Concepción, M.; Gruissem, W.; Vranová, E. Characterization of the GGPP synthase gene family in Arabidopsis thaliana. Plant Mol. Biol. 2013, 82, 393–416. [Google Scholar] [CrossRef] [Green Version]
  99. Szádeczky-Kardoss, I.; Gál, L.; Auber, A.; Taller, J.; Silhavy, D. The No-go decay system degrades plant mRNAs that contain a long A-stretch in the coding region. Plant Sci. Int. J. Exp. Plant Biol. 2018, 275, 19–27. [Google Scholar] [CrossRef]
  100. Chiba, Y.; Oshima, K.; Arai, H.; Ishii, M.; Igarashi, Y. Discovery and Analysis of Cofactor-dependent Phosphoglycerate Mutase Homologs as Novel Phosphoserine Phosphatases in <em>Hydrogenobacter thermophilus</em>*. J. Biol. Chem. 2012, 287, 11934–11941. [Google Scholar]
  101. Carretero-Paulet, L.; Cairó, A.; Talavera, D.; Saura, A.; Imperial, S.; Rodríguez-Concepción, M.; Campos, N.; Boronat, A. Functional and evolutionary analysis of DXL1, a non-essential gene encoding a 1-deoxy-D-xylulose 5-phosphate synthase like protein in Arabidopsis thaliana. Gene 2013, 524, 40–53. [Google Scholar] [CrossRef] [Green Version]
  102. Chen, F.; D’Auria, J.C.; Tholl, D.; Ross, J.R.; Gershenzon, J.; Noel, J.P.; Pichersky, E. An Arabidopsis thaliana gene for methylsalicylate biosynthesis, identified by a biochemical genomics approach, has a role in defense. Plant J. Cell Mol. Biol. 2003, 36, 577–588. [Google Scholar] [CrossRef] [Green Version]
  103. Liu, P.P.; Yang, Y.; Pichersky, E.; Klessig, D.F. Altering expression of benzoic acid/salicylic acid carboxyl methyltransferase 1 compromises systemic acquired resistance and PAMP-triggered immunity in arabidopsis. Mol. Plant-Microbe Interact. MPMI 2010, 23, 82–90. [Google Scholar] [CrossRef] [Green Version]
  104. Kim, S.J.; Kim, K.W.; Cho, M.H.; Franceschi, V.R.; Davin, L.B.; Lewis, N.G. Expression of cinnamyl alcohol dehydrogenases and their putative homologues during Arabidopsis thaliana growth and development: Lessons for database annotations? Phytochemistry 2007, 68, 1957–1974. [Google Scholar] [CrossRef] [PubMed]
  105. Somssich, I.E.; Wernert, P.; Kiedrowski, S.; Hahlbrock, K. Arabidopsis thaliana defense-related protein ELI3 is an aromatic alcohol:NADP+ oxidoreductase. Proc. Natl. Acad. Sci. United States Am. 1996, 93, 14199–14203. [Google Scholar] [CrossRef] [PubMed] [Green Version]
  106. Smirnova, E.; Marquis, V.; Poirier, L.; Aubert, Y.; Zumsteg, J.; Ménard, R.; Miesch, L.; Heitz, T. Jasmonic Acid Oxidase 2 Hydroxylates Jasmonic Acid and Represses Basal Defense and Resistance Responses against <em>Botrytis cinerea</em> Infection. Mol. Plant 2017, 10, 1159–1173. [Google Scholar] [PubMed] [Green Version]
  107. Caarls, L.; Elberse, J.; Awwanah, M.; Ludwig, N.R.; de Vries, M.; Zeilmaker, T.; Van Wees, S.C.M.; Schuurink, R.C.; Van den Ackerveken, G. Arabidopsis JASMONATE-INDUCED OXYGENASES down-regulate plant immunity by hydroxylation and inactivation of the hormone jasmonic acid. Proc. Natl. Acad. Sci. USA 2017, 114, 6388–6393. [Google Scholar] [CrossRef] [PubMed] [Green Version]
  108. Yan, A.; Wu, M.; Yan, L.; Hu, R.; Ali, I.; Gan, Y. AtEXP2 is involved in seed germination and abiotic stress response in Arabidopsis. PLoS ONE 2014, 9, e85208. [Google Scholar] [CrossRef]
  109. Couée, I.; Sulmon, C.; Gouesbet, G.; El Amrani, A. Involvement of soluble sugars in reactive oxygen species balance and responses to oxidative stress in plants. J. Exp. Bot. 2006, 57, 449–459. [Google Scholar] [CrossRef] [Green Version]
  110. Ma, S.; Bohnert, H.J. Integration of Arabidopsis thaliana stress-related transcript profiles, promoter structures, and cell-specific expression. Genome Biol. 2007, 8, R49. [Google Scholar] [CrossRef] [Green Version]
  111. Herzog, M.; Dorne, A.M.; Grellet, F. GASA, a gibberellin-regulated gene family from Arabidopsis thaliana related to the tomato GAST1 gene. Plant Mol. Biol. 1995, 27, 743–752. [Google Scholar] [CrossRef]
  112. Ren, Y.; Liu, Y.; Chen, H.; Li, G.; Zhang, X.; Zhao, J. Type 4 metallothionein genes are involved in regulating Zn ion accumulation in late embryo and in controlling early seedling growth in Arabidopsis. Plant Cell Environ. 2012, 35, 770–789. [Google Scholar] [CrossRef]
  113. Takahashi, T.; Mori, T.; Ueda, K.; Yamada, L.; Nagahara, S.; Higashiyama, T.; Sawada, H.; Igawa, T. The male gamete membrane protein DMP9/DAU2 is required for double fertilization in flowering plants. Dev. (Camb. Engl.) 2018, 145, dev170076. [Google Scholar] [CrossRef] [Green Version]
  114. Mur, L.A.; Kenton, P.; Atzorn, R.; Miersch, O.; Wasternack, C. The outcomes of concentration-specific interactions between salicylate and jasmonate signaling include synergy, antagonism, and oxidative stress leading to cell death. Plant Physiol. 2006, 140, 249–262. [Google Scholar] [CrossRef] [PubMed] [Green Version]
  115. Inzé, A.; Vanderauwera, S.; Hoeberichts, F.A.; Vandorpe, M.; Van Gaever, T.; Van Breusegem, F. A subcellular localization compendium of hydrogen peroxide-induced proteins. Plant Cell Environ. 2012, 35, 308–320. [Google Scholar] [CrossRef]
  116. Fischer-Kilbienski, I.; Miao, Y.; Roitsch, T.; Zschiesche, W.; Humbeck, K.; Krupinska, K. Nuclear targeted AtS40 modulates senescence associated gene expression in Arabidopsis thaliana during natural development and in darkness. Plant Mol. Biol. 2010, 73, 379–390. [Google Scholar] [CrossRef] [PubMed]
  117. Castelló, M.J.; Carrasco, J.L.; Navarrete-Gómez, M.; Daniel, J.; Granot, D.; Vera, P. A plant small polypeptide is a novel component of DNA-binding protein phosphatase 1-mediated resistance to plum pox virus in Arabidopsis. Plant Physiol. 2011, 157, 2206–2215. [Google Scholar] [CrossRef] [PubMed] [Green Version]
  118. Becerra, C.; Jahrmann, T.; Puigdomenech, P.; Vicient, C.M. Ankyrin repeat-containing proteins in Arabidopsis: Characterization of a novel and abundant group of genes coding ankyrin-transmembrane proteins. Gene 2004, 340, 111–121. [Google Scholar] [CrossRef] [PubMed]
  119. Santos, F.; Teale, W.; Fleck, C.; Volpers, M.; Ruperti, B.; Palme, K. Modelling polar auxin transport in developmental patterning. Plant Biol. 2010, 12, 3–14. [Google Scholar] [CrossRef] [PubMed]
  120. Blilou, I.; Xu, J.; Wildwater, M.; Willemsen, V.; Paponov, I.; Friml, J.; Heidstra, R.; Aida, M.; Palme, K.; Scheres, B. The PIN auxin efflux facilitator network controls growth and patterning in Arabidopsis roots. Nature 2005, 433, 39–44. [Google Scholar] [CrossRef] [Green Version]
  121. Friml, J.; Benkova, E.; Blilou, I.; Wisniewska, J.; Hamann, T.; Ljung, K.; Woody, S.; Sandberg, G.; Scheres, B.; Jurgens, G.; et al. AtPIN4 mediates sink-driven auxin gradients and root patterning in Arabidopsis. Cell 2002, 108, 661–673. [Google Scholar] [CrossRef] [Green Version]
  122. Friml, J.; Wiśniewska, J.; Benková, E.; Mendgen, K.; Palme, K. Lateral relocation of auxin efflux regulator PIN3 mediates tropism in Arabidopsis. Nature 2002, 415, 806–809. [Google Scholar] [CrossRef] [Green Version]
  123. Grunewald, W.; Cannoot, B.; Friml, J.; Gheysen, G. Parasitic Nematodes Modulate PIN-Mediated Auxin Transport to Facilitate Infection. PLoS Pathog. 2009, 5, e1000266. [Google Scholar] [CrossRef] [Green Version]
  124. Kidd, B.N.; Kadoo, N.Y.; Dombrecht, B.; Tekeoglu, M.; Gardiner, D.M.; Thatcher, L.F.; Aitken, E.A.B.; Schenk, P.M.; Manners, J.M.; Kazan, K. Auxin Signaling and Transport Promote Susceptibility to the Root-Infecting Fungal Pathogen Fusarium oxysporum in Arabidopsis. Mol. Plant-Microbe Interact. 2011, 24, 733–748. [Google Scholar] [CrossRef] [PubMed] [Green Version]
  125. Meents, A.K.; Furch, A.C.U.; Almeida-Trapp, M.; Ozyurek, S.; Scholz, S.S.; Kirbis, A.; Lenser, T.; Theissen, G.; Grabe, V.; Hansson, B.; et al. Beneficial and Pathogenic Arabidopsis Root-Interacting Fungi Differently Affect Auxin Levels and Responsive Genes During Early Infection. Front. Microbiol. 2019, 10, 14. [Google Scholar] [CrossRef]
  126. Hwang, H.-H.; Chien, P.-R.; Huang, F.-C.; Yeh, P.-H.; Hung, S.-H.W.; Deng, W.-L.; Huang, C.-C. A Plant Endophytic Bacterium Priestia megaterium StrainBP-R2 Isolated from the Halophyte Bolboschoenus planiculmis Enhances Plant Growth under Salt and Drought Stresses. Microorganisms 2022, 10, 2047. [Google Scholar] [CrossRef]
  127. Pasternak, T.; Palme, K.; Pérez-Pérez, J.M. Role of reactive oxygen species in the modulation of auxin flux and root development in Arabidopsis thaliana. Plant J. 2023. [Google Scholar] [CrossRef] [PubMed]
  128. Chapman, J.M.; Muhlemann, J.K.; Gayornba, S.R.; Muday, G.K. RBOH-Dependent ROS Synthesis and ROS Scavenging by Plant Specialized Metabolites To Modulate Plant Development and Stress Responses. Chem. Res. Toxicol. 2019, 32, 370–396. [Google Scholar] [CrossRef]
  129. Valério, L.; De Meyer, M.; Penel, C.; Dunand, C. Expression analysis of the Arabidopsis peroxidase multigenic family. Phytochemistry 2004, 65, 1331–1342. [Google Scholar] [CrossRef]
  130. Rhee, S.G. H2O2, a Necessary Evil for Cell Signaling. Science 2006, 312, 1882–1883. [Google Scholar] [CrossRef]
  131. Kaya, H.; Nakajima, R.; Iwano, M.; Kanaoka, M.M.; Kimura, S.; Takeda, S.; Kawarazaki, T.; Senzaki, E.; Hamamura, Y.; Higashiyama, T.; et al. Ca2+-Activated Reactive Oxygen Species Production by Arabidopsis RbohH and RbohJ Is Essential for Proper Pollen Tube Tip Growth. Plant Cell 2014, 26, 1069–1080. [Google Scholar] [CrossRef] [Green Version]
  132. Sun, H.L.; Cao, X.Y.; Wang, X.Y.; Zhang, W.; Li, W.X.; Wang, X.Q.; Liu, S.Q.; Lyu, D.G. RBOH-dependent hydrogen peroxide signaling mediates melatonin-induced anthocyanin biosynthesis in red pear fruit. Plant Sci. 2021, 313, 11. [Google Scholar] [CrossRef]
  133. Araki, R.; Mermod, M.; Yamasaki, H.; Kamiya, T.; Fujiwara, T.; Shikanai, T. SPL7 locally regulates copper-homeostasis-related genes in Arabidopsis. J. Plant Physiol. 2018, 224-225, 137–143. [Google Scholar] [CrossRef]
  134. Sunkar, R.; Kapoor, A.; Zhu, J.-K. Posttranscriptional Induction of Two Cu/Zn Superoxide Dismutase Genes in Arabidopsis Is Mediated by Downregulation of miR398 and Important for Oxidative Stress Tolerance. Plant Cell 2006, 18, 2051–2065. [Google Scholar] [CrossRef] [PubMed] [Green Version]
  135. Gou, X.; Zhong, C.; Zhang, P.; Mi, L.; Li, Y.; Lu, W.; Zheng, J.; Xu, J.; Meng, Y.; Shan, W. miR398b and AtC2GnT form a negative feedback loop to regulate Arabidopsis thaliana resistance against Phytophthora parasitica. Plant J. 2022, 111, 360–373. [Google Scholar] [CrossRef]
  136. Rasul, S.; Dubreuil-Maurizi, C.; Lamotte, O.; Koen, E.; Poinssot, B.; Alcaraz, G.; Wendehenne, D.; Jeandroz, S. Nitric oxide production mediates oligogalacturonide-triggered immunity and resistance to Botrytis cinerea in Arabidopsis thaliana. Plant Cell Environ. 2012, 35, 1483–1499. [Google Scholar] [CrossRef]
  137. Wei, S.-S.; Niu, W.-T.; Zhai, X.-T.; Liang, W.-Q.; Xu, M.; Fan, X.; Lv, T.-T.; Xu, W.-Y.; Bai, J.-T.; Jia, N.; et al. Arabidopsis mtHSC70-1 plays important roles in the establishment of COX-dependent respiration and redox homeostasis. J. Exp. Bot. 2019, 70, 5575–5590. [Google Scholar] [CrossRef] [PubMed]
  138. Kvaratskhelia, M.; George, S.J.; Thorneley, R.N.F. Salicylic Acid Is a Reducing Substrate and Not an Effective Inhibitor of Ascorbate Peroxidase*. J. Biol. Chem. 1997, 272, 20998–21001. [Google Scholar] [CrossRef] [Green Version]
Figure 1. Arabidopsis thaliana seedlings responses to Erwinia amylovora mVOCs. (A) Control Petri capsule with only A. thaliana seedlings and the two culture media (the top one for plant and the bottom one for bacterial growth). The insect shows a typical root in control plants. (B) A. thaliana seedlings of the same age as (A) but exposed for 8 days to E. amylovora mVOCs. The inset shows a typical A. thaliana root exposed to mVOCs. The width of the Petri dish is 100 mm.
Antioxidants 12 00600 g001
Figure 2. Plasma membrane potential (Vm) depolarization time course analysis in roots and leaves of A. thaliana seedlings exposed to E. amylovora mVOCs. Metric bars indicate standard deviation.
Antioxidants 12 00600 g002
Figure 3. Time-course changes in [Ca2+]cyt in roots and shoots of A. thaliana seedlings exposed to E. amylovora mVOCs. Values are expressed as the fold change between the fluorescence of treatments vs. controls (see Materials and Methods). Bars represent standard deviation.
Antioxidants 12 00600 g003
Figure 4. Time-course changes in (A) Voltage gated K+ channels (VGKC) and (B) Ligand gated/resting inward rectified channels (KG/RIRKC) in roots and shoots of A. thaliana seedlings exposed to E. amylovora mVOCs. Values are expressed as the fold change between the fluorescence of treatments vs. controls (see Materials and Methods). Bars represent standard deviation.
Antioxidants 12 00600 g004
Figure 5. Time-course changes in ROS (A) and NO (B) in roots and shoots of A. thaliana seedlings exposed to E. amylovora mVOCs. Values are expressed as the fold change between the fluorescence of treatments vs. controls. Bars represent standard deviation.
Antioxidants 12 00600 g005
Figure 6. CLSM images of ROS (AC) and NO (DG) localization in A. thaliana seedlings upon exposure to E. amylovora mVOCs. (A) control root of a plant grown without the presence of mVOCs and stained with Amplex Red. (B) Yellow fluorescence of ROS and active peroxidases in a plant exposed for 6 h to mVOCs showing a portion of the junction between the root and the shoot, where the yellow fluorescence refers to the reaction of 10-acetyl-3,7-dihydroxyphenoxazine (Amplex Red) with H2O2, whereas the root and shoot tissues not reacting with Amplex Red are shown in bright red color. (C) Portion of a root exposed for 6 h to mVOCs showing the presence of a secondary root with a clear reaction with the dye Amplex Red both in the secondary root tip and in the vasculature of the main root. (D) Portion of a control root perfused with carboxy-2-phenyl-4,4,5,5-tetra-methylimidazolinone-3-oxide-1-oxyl (cPTIO), an NO scavenger, before being stained with 4,5-diaminofluorescein diacetate (DAF-FM DA) in plants exposed for 16 h to mVOCs. (E) Reaction of NO with DAF-FM DA in roots of plants exposed for 16 h to E. amylovora mVOCs; a bright yellow fluorescence indicates the reaction in the root vascular tissues and in the secondary root tips. (F) Control stems treated as in (E) but after 3 h exposure to mVOCs. (G) Vascular tissues of A. thaliana stems show an NO localization after 3 h of exposure to E. amylovora mVOCs. Metric bars: 250 µm.
Antioxidants 12 00600 g006
Figure 7. Association networks between proteins coded by the DEGs of Table S2 obtained with STRING [30]. Nodes indicate the different proteins. Associations are meant to be specific and meaningful, i.e., proteins jointly contribute to a shared function; this does not necessarily mean they are physically binding to each other. Color codes of known, predicted and other interactions are indicated at the bottom of the figure. Different node colors indicate proteins clustered by k-means clustering. Edges between clusters are indicated by dotted lines, and the confidence cutoff for showing interaction links has been set to “highest” (0.900). Roman numbers (IVII) refer to the different clusters.
Antioxidants 12 00600 g007
Figure 8. Localization of PIN1 (AC) and PIN3 (DE) efflux carriers in A. thaliana roots. (A) GUS staining of transgenic plants carrying PIN1::GUS construct efflux carriers in control roots; (B) GUS staining of transgenic plants carrying PIN1::GUS construct efflux carriers in roots exposed to E. amylovora mVOCs for 9 h; (C) CLSM of PIN1:GFP efflux carriers in roots exposed for 16 h to E. amylovora mVOCs; (D) GUS staining of transgenic plants carrying PIN3::GUS construct efflux carriers in control roots; (E) GUS staining of transgenic plants carrying PIN3::GUS construct efflux carriers in roots exposed to E. amylovora mVOCs for 9 h; (F) CLSM of columella localized PIN3:GFP efflux carriers in roots exposed for 9 h to E. amylovora mVOCs. (See also Supplementary Figure S5 for DR5::GUS, PIN1:GFP, and PIN3:GFP controls). Metric bars: (AE), 200 µm; (F) 100 µm.
Antioxidants 12 00600 g008
Figure 9. Expression of PIN1 (AT1G73590) and PIN3 (AT1G70940) genes in time-course exposure of A. thaliana shoots and roots to E. amylovora mVOCs. Data are expressed as fold change with respect to the controls (DMSO). Values above or below the dotted line indicate upregulation and downregulation, respectively. Bars indicate standard deviation.
Antioxidants 12 00600 g009
Figure 10. Effect of exposure to synthetic mVOCs 1-dodecanol and 1-nonanol on root length of A. thaliana seedlings. Metric bars indicate standard deviation, different letters indicate significant (p < 0.05) differences.
Antioxidants 12 00600 g010
Figure 11. Gene expression of RBOHH, SOD1, CAT1, PER4, and APX1 in A. thaliana roots (A,C) and shoots (B,D) exposed for 72 h to 1.nonanol (A,B) and 1-dodecanol (C,D). Data are expressed as fold change with respect to control (DMSO, dotted line). Values above or below the dotted line indicate upregulation and downregulation, respectively. Bars indicate standard deviation.
Antioxidants 12 00600 g011
Figure 12. Early and late events in A. thaliana cells upon exposure to E. amylovora mVOCs. mVOCs are perceived at the plasma membrane by a still uncharacterized receptor/sensor, which eventually initiates a cascade of events involving the opening of Ca2+ channels. The increased Ca2+ cytosolic concentration triggers the opening of ligand-gated or resting inward rectifier K+ channels that, along with Ca2+, depolarize the membrane potential (Vm). These events are followed by the production of H2O2 by RBOHH and SOD, which increases the cell and tissue content of ROS. The latter are scavenged by CAT, APX, and PER4 that generate H2O and O2 from H2O2. The increased cellular ROS (and probably the increased cytosolic Ca2+) increase the NO content. All of these early events induce expression of genes involved in defense and storage, and those responding to phytohormones and heat stress.
Antioxidants 12 00600 g012
Table 1. Chemical composition of E. amylovora mVOCs. Values are expressed as relative percentage and ordered according to the Kovàts retention index. See also Supplementary Figure S2 for GC mass spectra data.
CompoundKovàts Retention IndexRelative Percentage
Iso amyl alcohol6971.21
Styrene8834.04
6-Methyl-2-heptanone8880.93
4-Octen-3-one9602.91
Benzaldehyde9821.13
Octanal10051.08
Tetraisobutylene10301.93
(E)-2-Octenal10361.96
1,8-Cineole10580.31
1-octanol10652.58
Nonanal11041.32
1-Nonanol11593.03
Dichloromethyl propyl sulfone11725.54
trans-2-Decenal12122.16
Methylcyclodecane12603.33
trans-2-Decenol12662.36
Undecanal13032.32
Tridecane13131.08
6,10-Dimethyl-2-undecanone13218.32
1-Undecanol13572.08
2-Ethyl-1-decanol13930.39
1-Tetradecene14030.94
E-2-dodecenal14100.48
Tetradecane14131.21
1-Dodecanol145710.10
Tridecanal15022.21
Pentadecane151211.73
Tetradecanal16011.38
Tetradecanal16012.12
2-Pentadecanone16481.23
1-Tetradecanol16561.94
Pentadecanal17016.19
Heptadecane17112.68
6,10,14-Trimethyl-2-pentadecanone17546.48
Disclaimer/Publisher’s Note: The statements, opinions and data contained in all publications are solely those of the individual author(s) and contributor(s) and not of MDPI and/or the editor(s). MDPI and/or the editor(s) disclaim responsibility for any injury to people or property resulting from any ideas, methods, instructions or products referred to in the content.

