
Oil Extraction from Hemp Plant as a Potential Source of Cannabidiol for Healthy Protein Foods
 ,
,  , and
, and
Abstract
:1. Introduction
2. Materials and Methods
2.1. Raw Materials
2.2. Extraction Methods
2.3. Proteic Dough Preparation
2.4. HPLC Analysis
2.5. Antioxidant Activity
2.6. Rheological Characterization
2.7. Baking Trials and Characterization
3. Results and Discussion
3.1. Extraction and Characterization of Extracts
3.2. Antioxidant Activity Results
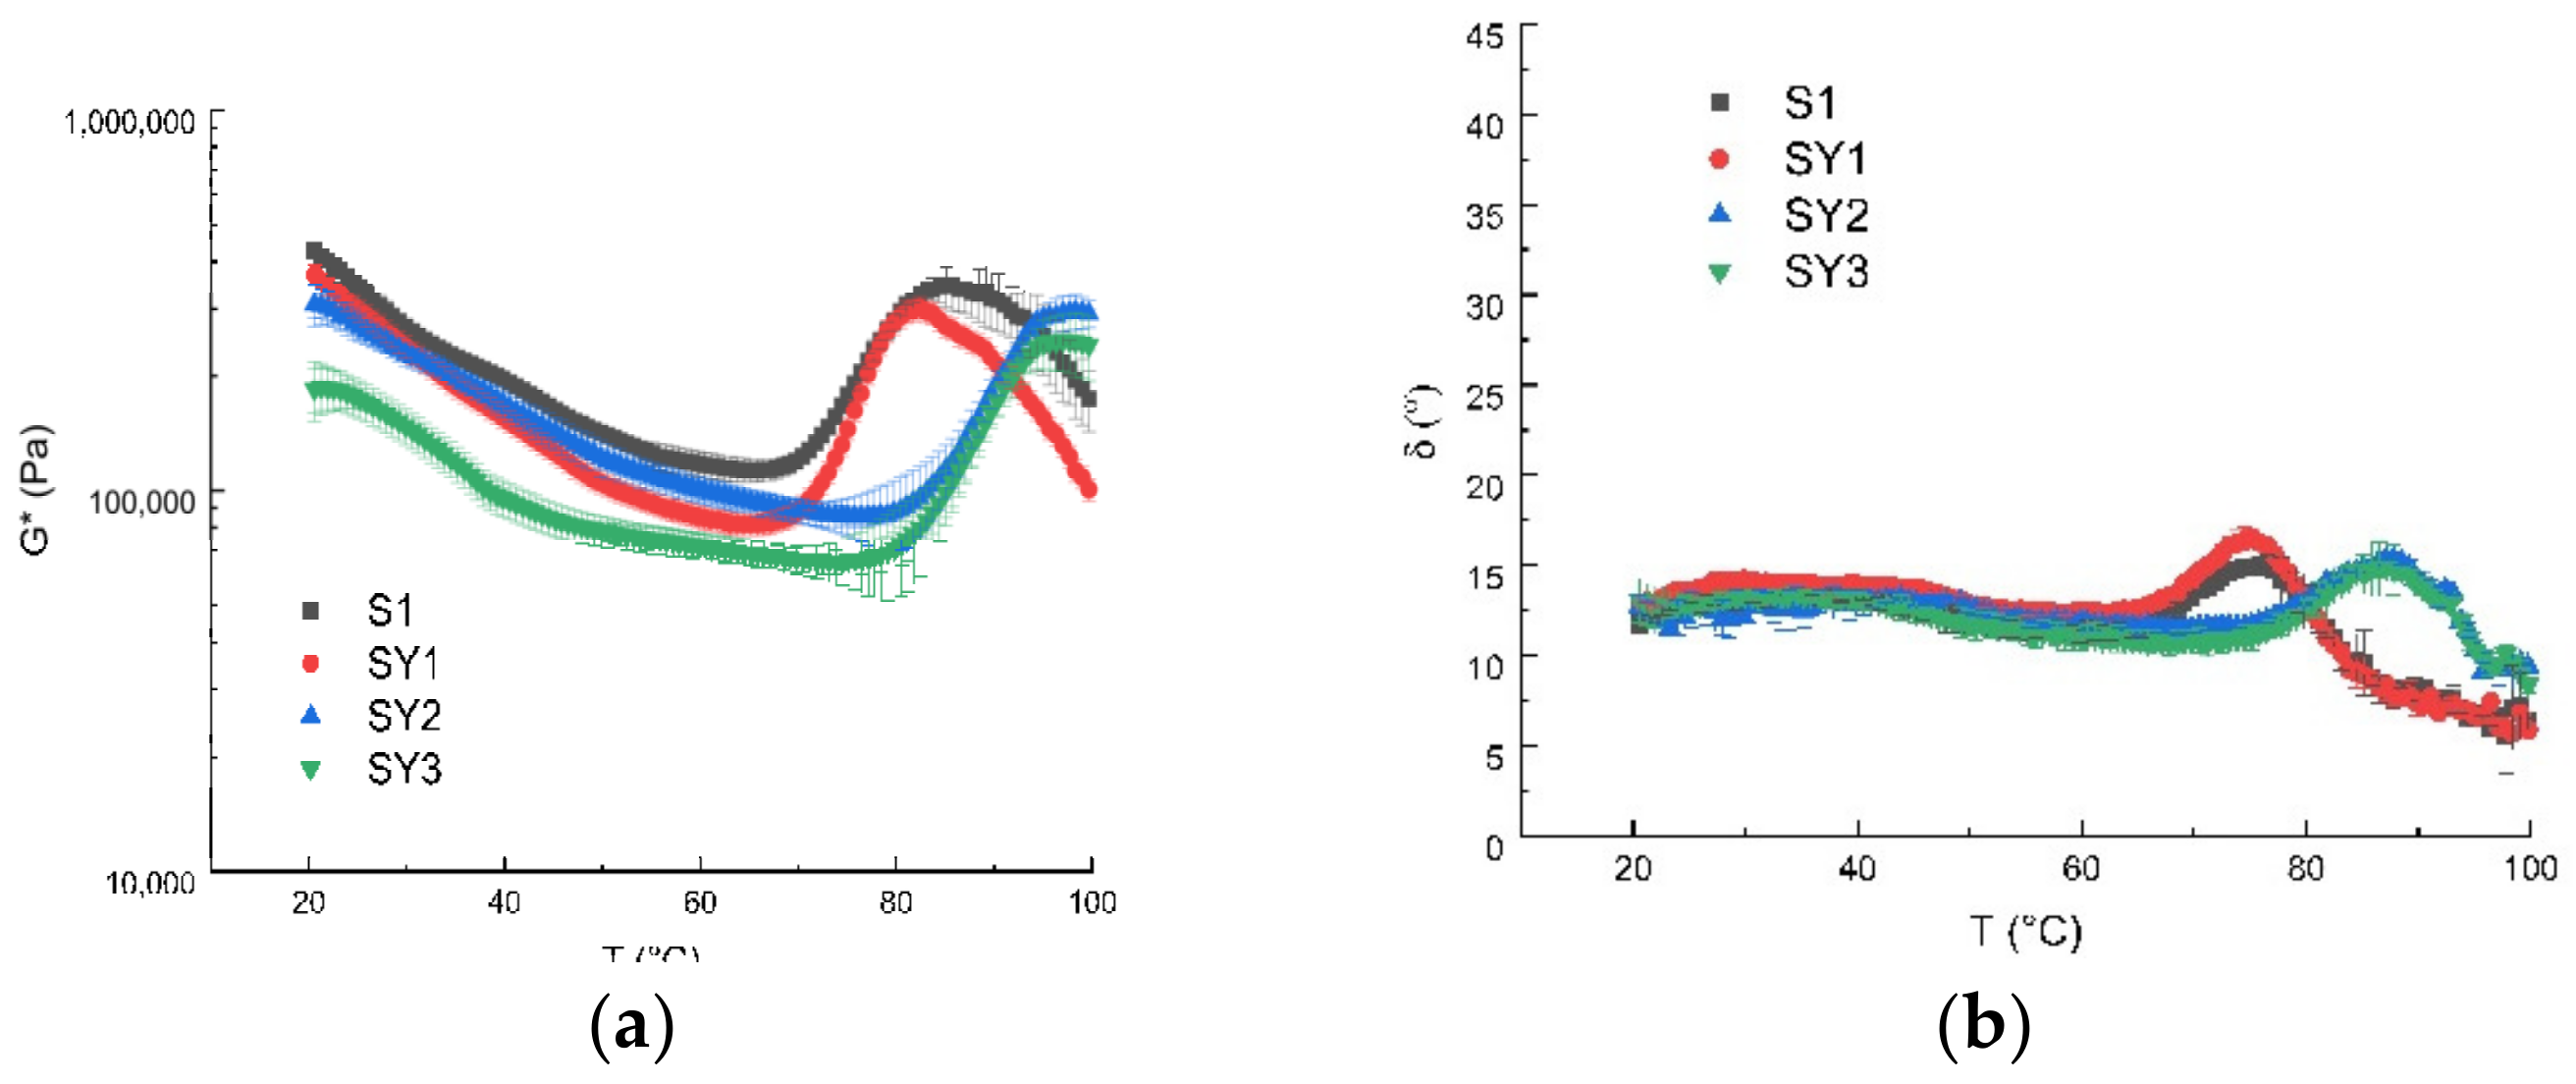
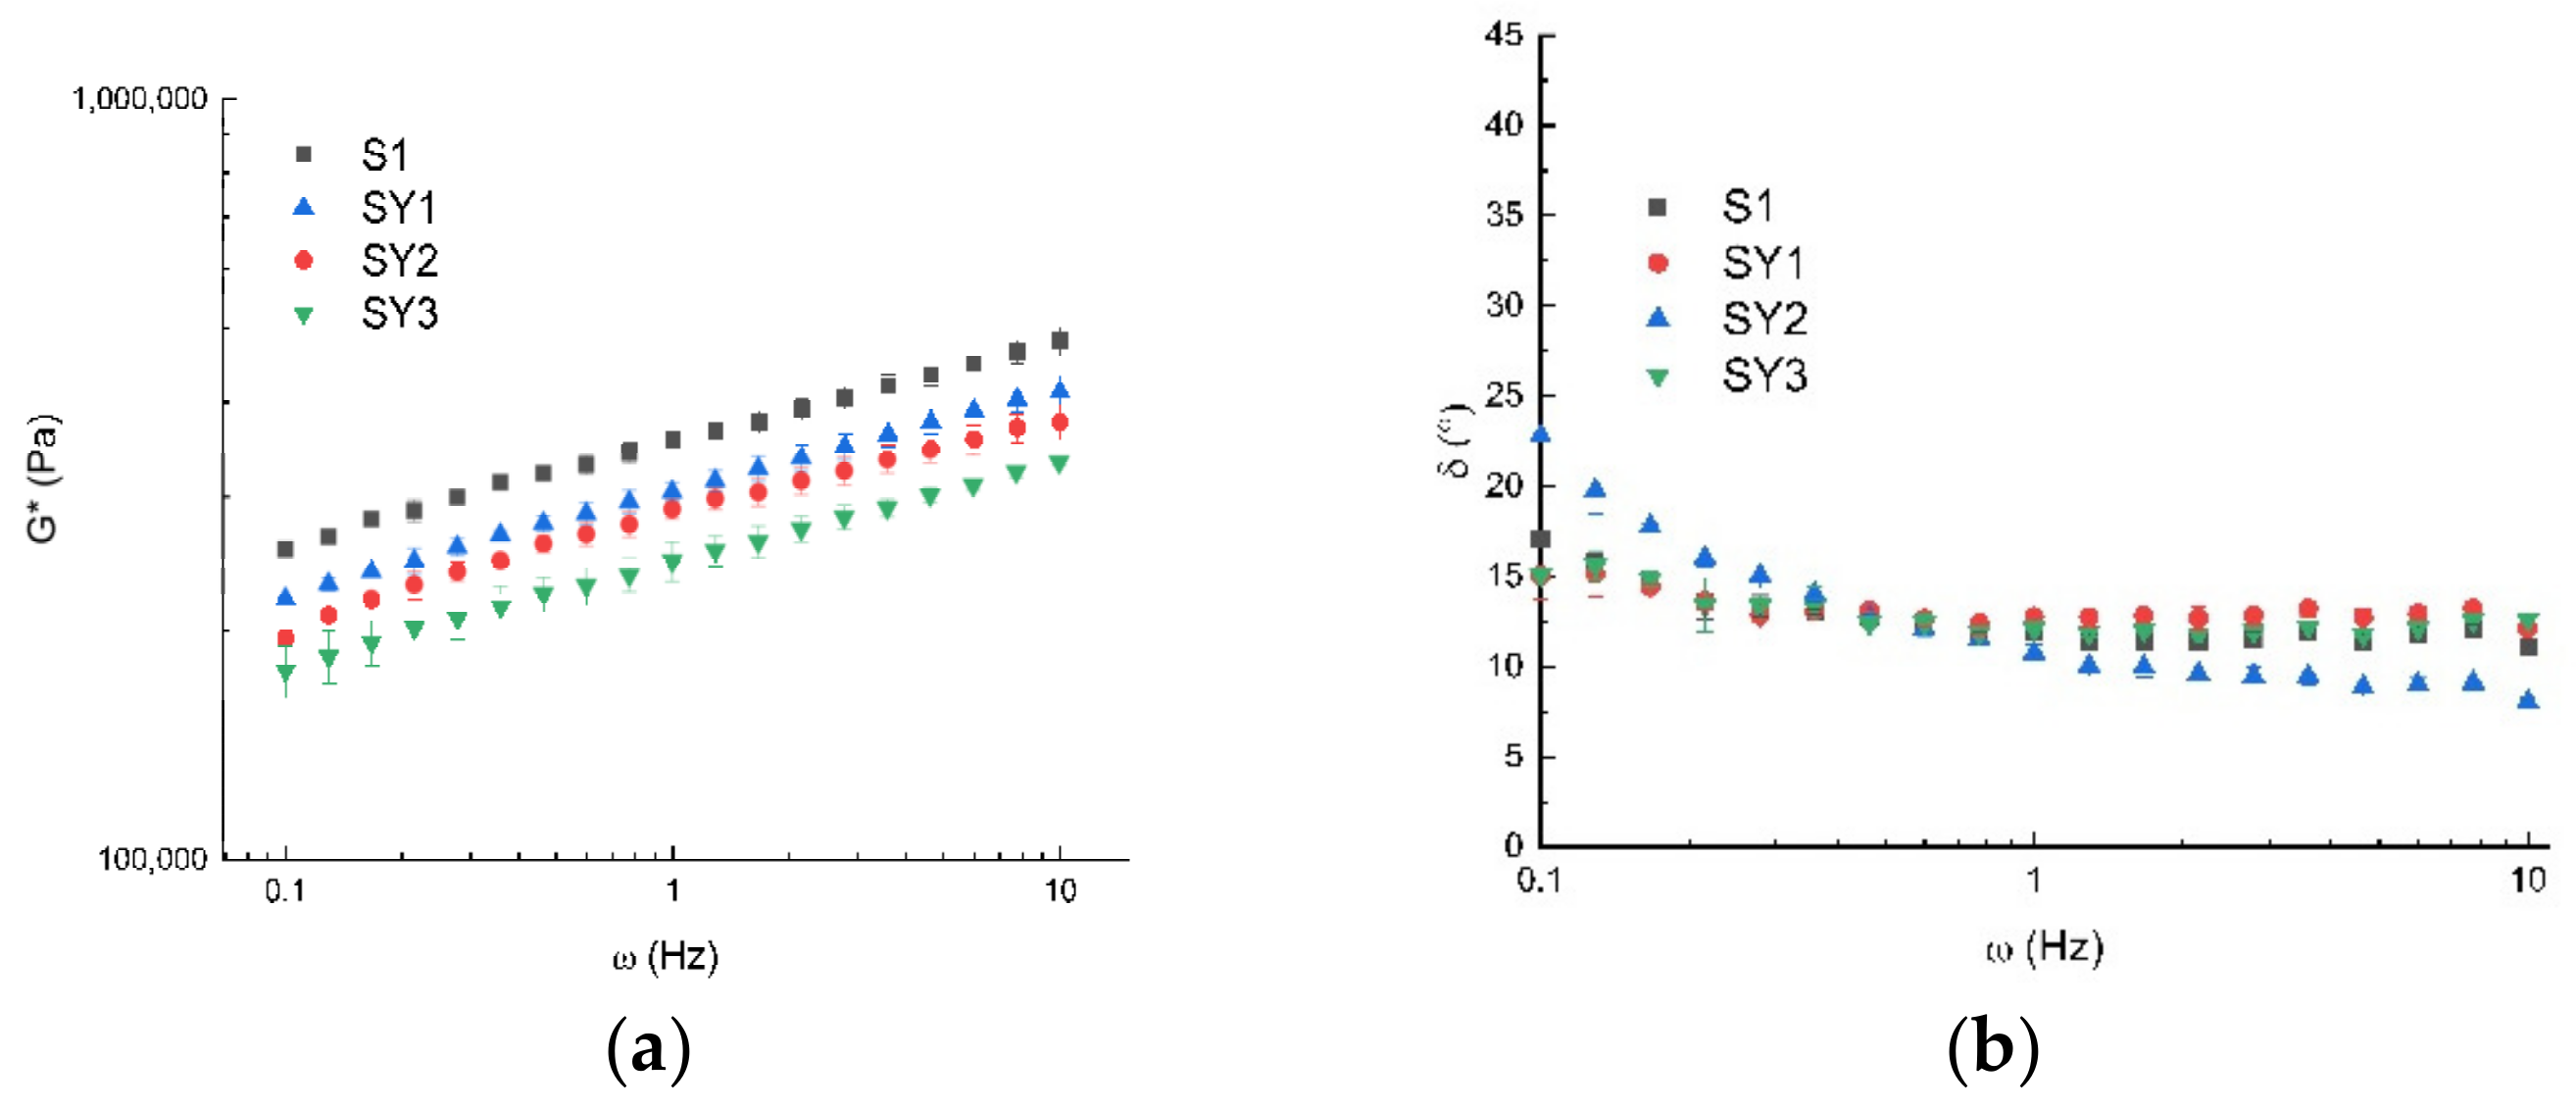
3.3. Rheology
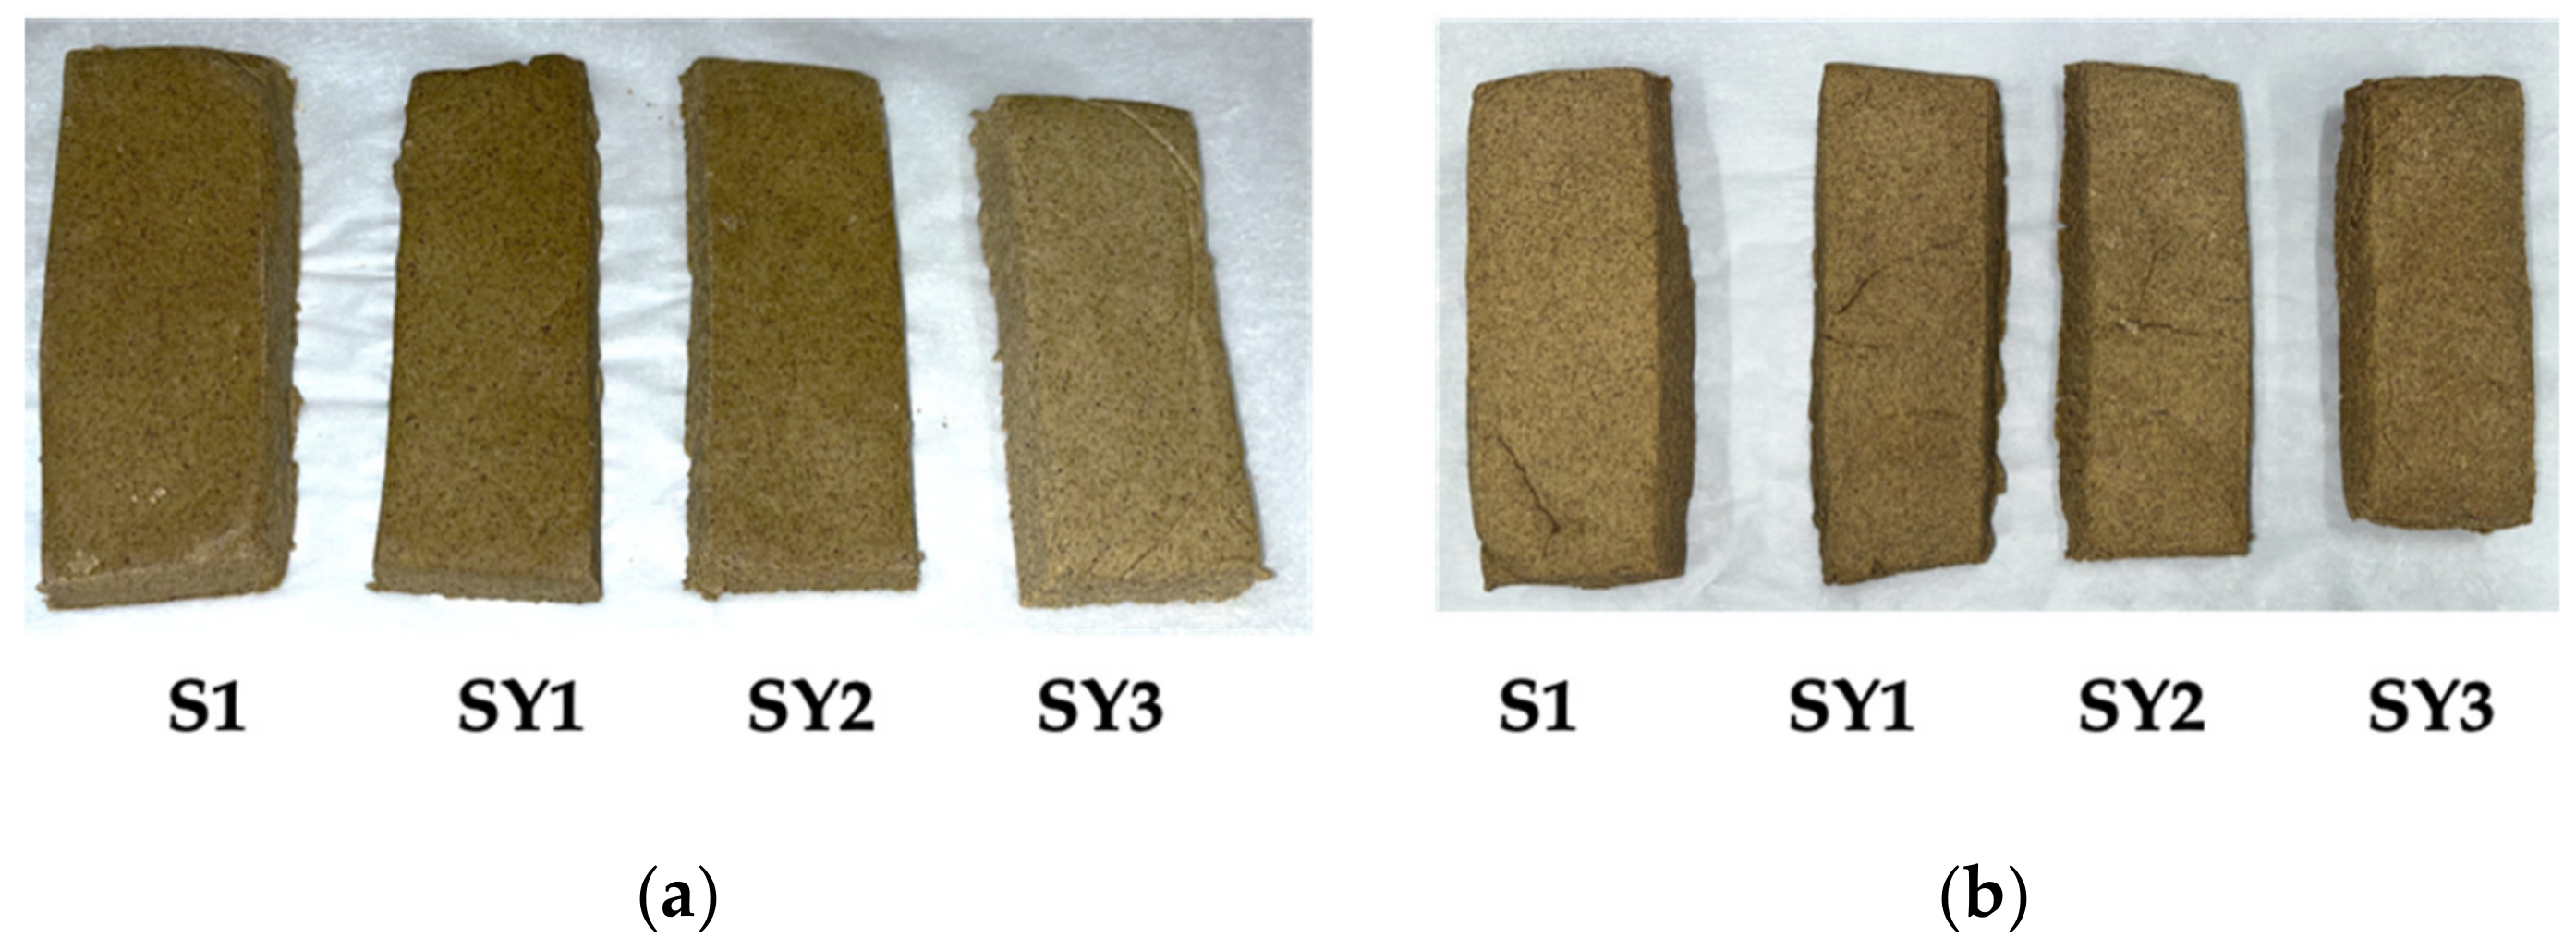
3.4. Application
4. Conclusions
Author Contributions
Funding
Institutional Review Board Statement
Informed Consent Statement
Data Availability Statement
Conflicts of Interest
References
- Drinić, Z.; Vladic, J.; Koren, A.; Zeremski, T.; Stojanov, N.; Tomić, M.; Vidović, S. Application of conventional and high-pressure extraction techniques for the isolation of bioactive compounds from the aerial part of hemp (Cannabis sativa L.) assortment Helena. Ind. Crop. Prod. 2021, 171, 113908. [Google Scholar] [CrossRef]
- Brighenti, V.; Pellati, F.; Steinbach, M.; Maran, D.; Benvenuti, S. Development of a new extraction technique and HPLC method for the analysis of non-psychoactive cannabinoids in fibre-type Cannabis sativa L. (hemp). J. Pharm. Biomed. Anal. 2017, 143, 228–236. [Google Scholar] [CrossRef] [PubMed]
- Baldino, N.; Carnevale, I.; Mileti, O.; Aiello, D.; Lupi, F.R.; Napoli, A.; Gabriele, D. Hemp Seed Oil Extraction and Stable Emulsion Formulation with Hemp Protein Isolates. Appl. Sci. 2022, 12, 11921. [Google Scholar] [CrossRef]
- Pellati, F.; Borgonetti, V.; Brighenti, V.; Biagi, M.; Benvenuti, S.; Corsi, L. Cannabis sativa L. and Nonpsychoactive Cannabinoids: Their Chemistry and Role against Oxidative Stress, Inflammation, and Cancer. BioMed Res. Int. 2018, 2018, 1691428. [Google Scholar] [CrossRef] [PubMed]
- Atalay, S.; Atalay, S.; Jarocka-Karpowicz, I.; Skrzydlewska, E. Antioxidative and Anti-Inflammatory Properties of Cannabidiol. Antioxidants 2019, 9, 21. [Google Scholar] [CrossRef] [PubMed]
- Baron, E.P. Medicinal Properties of Cannabinoids, Terpenes, and Flavonoids in Cannabis, and Benefits in Migraine, Headache, and Pain: An Update on Current Evidence and Cannabis Science. Headache J. Head Face Pain 2018, 58, 1139–1186. [Google Scholar] [CrossRef] [PubMed]
- Nahar, L.; Uddin, S.J.; Alam, M.A.; Sarker, S.D. Extraction of naturally occurring cannabinoids: An update. Phytochem. Anal. 2021, 32, 228–241. [Google Scholar] [CrossRef]
- Ryu, B.R.; Islam, M.J.; Kalam Azad, M.O.; Go, E.J.; Rahman, M.H.; Rana, M.S.; Lim, Y.S.; Lim, J.D. Conversion characteristics of some major cannabinoids from hemp (Cannabis sativa L.) raw materials by new rapid simultaneous analysis method. Molecules 2021, 26, 4113. [Google Scholar] [CrossRef]
- Wang, M.; Wang, Y.-H.; Avula, B.; Radwan, M.; Wanas, A.; Antwerp, J.; Parcher, J.; Elsohly, M.; Khan, I. Decarboxylation Study of Acidic Cannabinoids: A Novel Approach Using Ultra-High-Performance Supercritical Fluid Chromatography/Photodiode Array-Mass Spectrometry. Cannabis Cannabinoid Res. 2016, 1, 262–271. [Google Scholar] [CrossRef]
- De Vita, D.; Madia, V.N.; Tudino, V.; Saccoliti, F.; De Leo, A.; Messore, A.; Roscilli, P.; Botto, A.; Pindinello, I.; Santilli, G.; et al. Comparison of different methods for the extraction of cannabinoids from cannabis. Nat. Prod. Res. 2020, 34, 2952–2958. [Google Scholar] [CrossRef]
- Moreno, T.; Montanes, F.; Tallon, S.J.; Fenton, T.; King, J.W. Extraction of cannabinoids from hemp (Cannabis sativa L.) using high pressure solvents: An overview of different processing options. J. Supercrit. Fluids 2020, 161, 104850. [Google Scholar] [CrossRef]
- Korus, J.; Witczak, M.; Ziobro, R.; Juszczak, L. Hemp (Cannabis sativa subsp. sativa) flour and protein preparation as natural nutrients and structure forming agents in starch based gluten-free bread. LWT 2017, 84, 143–150. [Google Scholar] [CrossRef]
- Lewis-Bakker, M.M.; Yang, Y.; Vyawahare, R.; Kotra, L.P. Extractions of Medical Cannabis Cultivars and the Role of Decarboxylation in Optimal Receptor Responses. Cannabis Cannabinoid Res. 2019, 4, 183–194. [Google Scholar] [CrossRef] [PubMed]
- Mileti, O.; Baldino, N.; Carmona, J.A.; Lupi, F.R.; Muñoz, J.; Gabriele, D. Shear and dilatational rheological properties of vegetable proteins at the air/water interface. Food Hydrocoll. 2022, 126, 107472. [Google Scholar] [CrossRef]
- Jovanov, P.; Sakač, M.; Jurdana, M.; Pražnikar, Z.J.; Kenig, S.; Hadna Dev, M.; Jakus, T.; Petelin, A.; Škrobot, D.; Marić, A. High-protein bar as a meal replacement in elite sports nutrition: A pilot study. Foods 2021, 10, 2628. [Google Scholar] [CrossRef] [PubMed]
- Baldino, N.; Carnevale, I.; Laitano, F.; Lupi, F.; Curcio, S.; Gabriele, D. Formulation of bread model doughs with resistant starch, vegetable proteins and transglutaminase. Eur. Food Res. Technol. 2020, 246, 397–408. [Google Scholar] [CrossRef]
- Graça, C.; Raymundo, A.; Sousa, I. Yogurt as an alternative ingredient to improve the functional and nutritional properties of gluten-free breads. Foods 2020, 9, 111. [Google Scholar] [CrossRef] [PubMed]
- Iacopetta, D.; Fazio, A.; La Torre, C.; Barbarossa, A.; Ceramella, J.; Francomano, F.; Saturnino, C.; El-Kashef, H.; Alcaro, S.; Sinicropi, M.S. Annona cherimola Mill. Leaf Extracts Affect Melanoma Cells Growth and Progression. Foods 2022, 11, 2420. [Google Scholar] [CrossRef]
- Gabriele, D.; de Cindio, B.; D’Antona, P. A weak gel model for foods. Rheol. Acta 2001, 40, 120–127. [Google Scholar] [CrossRef]
- Gonzales, A.P.; Burin, L.; del Pilar Buera, M. Color changes during storage of honeys in relation to their composition and initial color. Food Res. Int. 1999, 32, 185–191. [Google Scholar] [CrossRef]
- Christodoulou, M.C.; Christou, A.; Stavrou, I.J.; Kapnissi-Christodoulou, C.P. Evaluation of different extraction procedures for the quantification of seven cannabinoids in cannabis-based edibles by the use of LC-MS. J. Food Compos. Anal. 2023, 115, 104915. [Google Scholar] [CrossRef]
- Citti, C.; Braghiroli, D.; Vandelli, M.A.; Cannazza, G. Pharmaceutical and biomedical analysis of cannabinoids: A critical review. J. Pharm. Biomed. Anal. 2018, 147, 565–579. [Google Scholar] [CrossRef] [PubMed]
- Szalata, M.; Dreger, M.; Zielińska, A.; Banach, J.; Szalata, M.; Wielgus, K. Simple Extraction of Cannabinoids from Female Inflorescences of Hemp (Cannabis sativa L.). Molecules 2022, 27, 5868. [Google Scholar] [CrossRef] [PubMed]
- Duan, Y.; Tao, Z.; Zhu, A.; Len, C.; Wang, Y.; Yang, W. Enhanced valorization of hemp stalk via chemo-catalytic and hydrothermal conversions. Fuel 2022, 327, 125059. [Google Scholar] [CrossRef]
- Marrot, L.; Candelier, K.; Valette, J.; Lanvin, C.; Horvat, B.; Legan, L.; DeVallance, D.B. Valorization of Hemp Stalk Waste Through Thermochemical Conversion for Energy and Electrical Applications. Waste Biomass Valorization 2022, 13, 2267–2285. [Google Scholar] [CrossRef]
- Xu, D.P.; Li, Y.; Meng, X.; Zhou, T.; Zhou, Y.; Zheng, J.; Zhang, J.J.; Li, H.B. Natural antioxidants in foods and medicinal plants: Extraction, assessment and resources. Int. J. Mol. Sci. 2017, 18, 96. [Google Scholar] [CrossRef] [PubMed]
- Milkovic, L.; Gasparovic, A.C.; Cindric, M.; Mouthuy, P.A.; Zarkovic, N. Short overview of ROS as cell function regulators and their implications in therapy concepts. Cells 2019, 8, 793. [Google Scholar] [CrossRef]
- Antolovich, M.; Prenzler, P.D.; Patsalides, E.; McDonald, S.; Robards, K. Methods for testing antioxidant activity. Analyst 2002, 127, 183–198. [Google Scholar] [CrossRef]
- Dawidowicz, A.L.; Olszowy-Tomczyk, M.; Typek, R. CBG, CBD, Δ9-THC, CBN, CBGA, CBDA and Δ9-THCA as antioxidant agents and their intervention abilities in antioxidant action. Fitoterapia 2021, 152, 104915. [Google Scholar] [CrossRef]
- Istrate, A.M.; Dabija, A.; Codină, G.G.; Rusu, L. Influence of Hemp Flour on Dough Rheology and Bread Quality. Eng. Biotechnol. Food Ind. 2021, 22, 521–531. [Google Scholar]
- Marcus, R.T. Chapter 2—The Measurement of Color. AZimuth 1998, 1, 31–96. [Google Scholar] [CrossRef]
- Iuga, M.; Boestean, O.; Ghendov-Mosanu, A.; Mironeasa, S. impact of dairy ingredients on wheat flour dough rheology and bread properties. Foods 2020, 9, 828. [Google Scholar] [CrossRef]
- Gyawali, R.; Ibrahim, S.A. Effects of hydrocolloids and processing conditions on acid whey production with reference to Greek yogurt. Trends Food Sci. Technol. 2016, 56, 61–76. [Google Scholar] [CrossRef]


| HPF % w/w | Hi-Maize® % w/w | Greek Yogurt % w/w | Water % w/w | |
|---|---|---|---|---|
| S1 * | 27 | 35 | - | 38 |
| SY1 ** | 27 | 35 | 3 | 35 |
| SY2 ** | 27 | 35 | 6 | 32 |
| SY3 ** | 27 | 35 | 9 | 29 |
| HI 1a (mg/g) | DHI 1b (mg/g) | HS 2a (mg/g) | DHS 2b (mg/g) | HPF 3a (mg/g) | DHPF 3b (mg/g) | |
|---|---|---|---|---|---|---|
| DME * | 18.6 ± 0.9 | 11.7 ± 0.4 | negligible | negligible | 206.3 ± 10.0 | 180 ± 10.0 |
| SE ** | 53.0 ± 8.0 | 52.7 ± 1.6 | 37.6 ± 3 | 35.0 ± 3.0 | 70.0 ± 4.5 | 50.0 ± 3.0 |
| SFE *** | 27.6 ± 2.0 | 33.7 ± 4.0 | 4.3 ± 0.3 | 5.6 ± 0.4 | 180.0 ± 10.0 | 160.0 ± 20.0 |
| HI 1a (mg/g) | DHI 1b (mg/g) | HS 2a (mg/g) | DHS 2b (mg/g) | HPF 3a (mg/g) | DHPF 3b (mg/g) | ||
|---|---|---|---|---|---|---|---|
| DME * | CBD | 13.9 ± 1.7 | 26.7 ± 2 | 0.27 ± 0.01 | 1.9 ± 0.1 | negligible | negligible |
| CBDA | 35.3 ± 1.0 | 6.60 ± 0.50 | 1.4 ± 0.1 | 0.5 ± 0.01 | negligible | negligible | |
| SE ** | CBD | 5.24 ± 0.3 | 11.3 ± 0.1 | 1.90 ± 0.20 | 2.6 ± 0.2 | 0.36 ± 0.02 | 0.67 ± 0.04 |
| CBDA | 10.9 ± 0.5 | 0.18 ± 0.01 | 3.40 ± 0.70 | 1.08 ± 0.1 | 0.69 ± 0.01 | negligible | |
| SFE *** | CBD | 5.44 ± 0.5 | 14.6 ± 2 | 0.204 ± 0.02 | 0.39 ± 0.01 | 0.26 ± 0.03 | 0.75 ± 0.01 |
| CBDA | 4.5 ± 0.2 | negligible | 0.573 ± 0.05 | 0.06 ± 0.01 | 0.55 ± 0.08 | negligible |
| IC50 (µg/mL) | ||
|---|---|---|
| ABTS | DPPH | |
| HS 1 | 125.1 ± 3.3 | 550.1 ± 4.5 |
| DHS 2 | 87.2 ± 2.2 | 348.5 ± 2.4 |
| HFP 3 | >2000 | >5000 |
| DHFP 4 | >2000 | >5000 |
| HI 5 | 85.3 ± 2.4 | 1122.0 ± 7.7 |
| DHI 6 | 38.1 ± 1.1 | 535.7 ± 4.7 |
| Trolox | 15.9 ± 1.3 | 29.3 ± 1.5 |
| T °C | 20 °C | 40 °C | 60 °C | |||
|---|---|---|---|---|---|---|
| ID | A [Pa·s] | z [-] | A [Pa·s] | z [-] | A [Pa·s] | z [-] |
| S1 * | 354,241 ± 7000 | 7.5 ± 0.3 | 164,373 ± 900 | 8.4 ± 0.4 | 133,627 ± 7000 | 8.5 ± 0.5 |
| SY1 ** | 305,042 ± 10,000 | 7.4 ± 0.1 | 176,235 ± 7000 | 8.0 ± 0.3 | 1,059,128 ± 1000 | 9.1 ± 0.1 |
| SY2 ** | 297,758 ± 11,000 | 7.5 ± 0.4 | 124,496 ± 3000 | 6.7 ± 0.1 | 94,302 ± 2000 | 9.4 ± 0.6 |
| SY3 ** | 245,606 ± 11,000 | 7.8 ± 0.4 | 114,326 ± 2000 | 7.5 ± 0.5 | 82,550 ± 5000 | 8.5 ± 0.8 |
| ID | L* | a* | b* | BI |
|---|---|---|---|---|
| S1 * | 45.4 ± 1.7 | 2.5 ± 0.2 | 20.4 ± 0.4 | 42.8 ± 0.6 |
| SY1 ** | 49.3 ± 0.6 | 3.1 ± 0.2 | 21.9 ± 0.9 | 43.7 ± 1.1 |
| SY2 ** | 49.2 ± 1.5 | 3.2 ± 0.1 | 22.2 ± 0.2 | 44.6 ± 0.6 |
| SY3 ** | 45.9 ± 0.1 | 3.6 ± 0.4 | 21.8 ± 0.6 | 46.8 ± 1.7 |
Disclaimer/Publisher’s Note: The statements, opinions and data contained in all publications are solely those of the individual author(s) and contributor(s) and not of MDPI and/or the editor(s). MDPI and/or the editor(s) disclaim responsibility for any injury to people or property resulting from any ideas, methods, instructions or products referred to in the content. |
© 2023 by the authors. Licensee MDPI, Basel, Switzerland. This article is an open access article distributed under the terms and conditions of the Creative Commons Attribution (CC BY) license (https://creativecommons.org/licenses/by/4.0/).
Share and Cite
Mileti, O.; Baldino, N.; Paleologo, M.F.O.; Lupi, F.R.; Marra, M.; Iacopetta, D.; Gabriele, D. Oil Extraction from Hemp Plant as a Potential Source of Cannabidiol for Healthy Protein Foods. Antioxidants 2023, 12, 1950. https://doi.org/10.3390/antiox12111950
Mileti O, Baldino N, Paleologo MFO, Lupi FR, Marra M, Iacopetta D, Gabriele D. Oil Extraction from Hemp Plant as a Potential Source of Cannabidiol for Healthy Protein Foods. Antioxidants. 2023; 12(11):1950. https://doi.org/10.3390/antiox12111950
Chicago/Turabian StyleMileti, Olga, Noemi Baldino, Mario F. O. Paleologo, Francesca R. Lupi, Maria Marra, Domenico Iacopetta, and Domenico Gabriele. 2023. "Oil Extraction from Hemp Plant as a Potential Source of Cannabidiol for Healthy Protein Foods" Antioxidants 12, no. 11: 1950. https://doi.org/10.3390/antiox12111950