
Boswellia Essential Oil: Natural Antioxidant as an Effective Antimicrobial and Anti-Inflammatory Agent

 , , , , , , ,
Abstract
:1. Introduction
2. Materials and Methods
2.1. Chemicals
2.1.1. Oil Samples
2.1.2. Gas Chromatography-Mass Spectrometry (GC/MS)
2.2. Antioxidant Capacity by 1,1-Diphenyl-2-Picrylhydrazyl (DPPH) Assay
- Acontrol—the absorbance value of the control sample
- Asample—the absorbance values of the extracted sample.
2.3. Oxidative Stability Determination
2.3.1. Application of BEO to Sunflower Oil
2.3.2. Determination of Peroxide Value
- V1—volume of sodium thiosulphate solution in the titration of the test sample (mL);
- V2—volume of sodium thiosulphate solution in the titration at the blank determination, (mL);
- m—mass of analyte sampled in the blank determination, (g);
- n—normality of the sodium thiosulphate solution used in the titration (0.01 respectively) [21].
2.3.3. p-Anisidine Value (p-AV)
- A1—absorbance of oil samples dissolved in isooctane;
- A2—absorbance of oil samples in isooctane and p-anisidine solution;
- W—mass of sunflower oil samples (g).
2.3.4. Total Oxidation Value (TOTOX)
2.3.5. Assessing the Lipid Oxidation Degree of Oil Samples by Thiobarbituric Acid (TBA) Test
2.4. Anti-Inflammatory Activity
2.4.1. Membrane Lysis Assay
Preparation of Red Cell Suspension
2.4.2. Heat-Induced Haemolysis
- A1 represents the absorbance of the tested sample
- A2 represents the absorbance of the negative control.
2.4.3. The Effect on Protein Denaturation
- A1 represents the absorbance of the tested sample
- A2 represents the absorbance of the control.
2.5. Antimicrobial Activity
2.5.1. Bacterial Culture
- ODsample—optical density at 540 nm as a mean value of triplicate readings for essential oil in the presence of the selected bacteria;
- ODnegative control—optical density at 540 nm as a mean value of triplicate readings for the selected bacteria in BHI.
2.5.2. Fungal Culture
2.6. Molecular Docking Study
2.7. Statistical Analysis
3. Results
3.1. Gas Chromatography-Mass Spectrometry (GC/MS)
3.2. Antioxidant Profile
3.3. Oxidative Stability
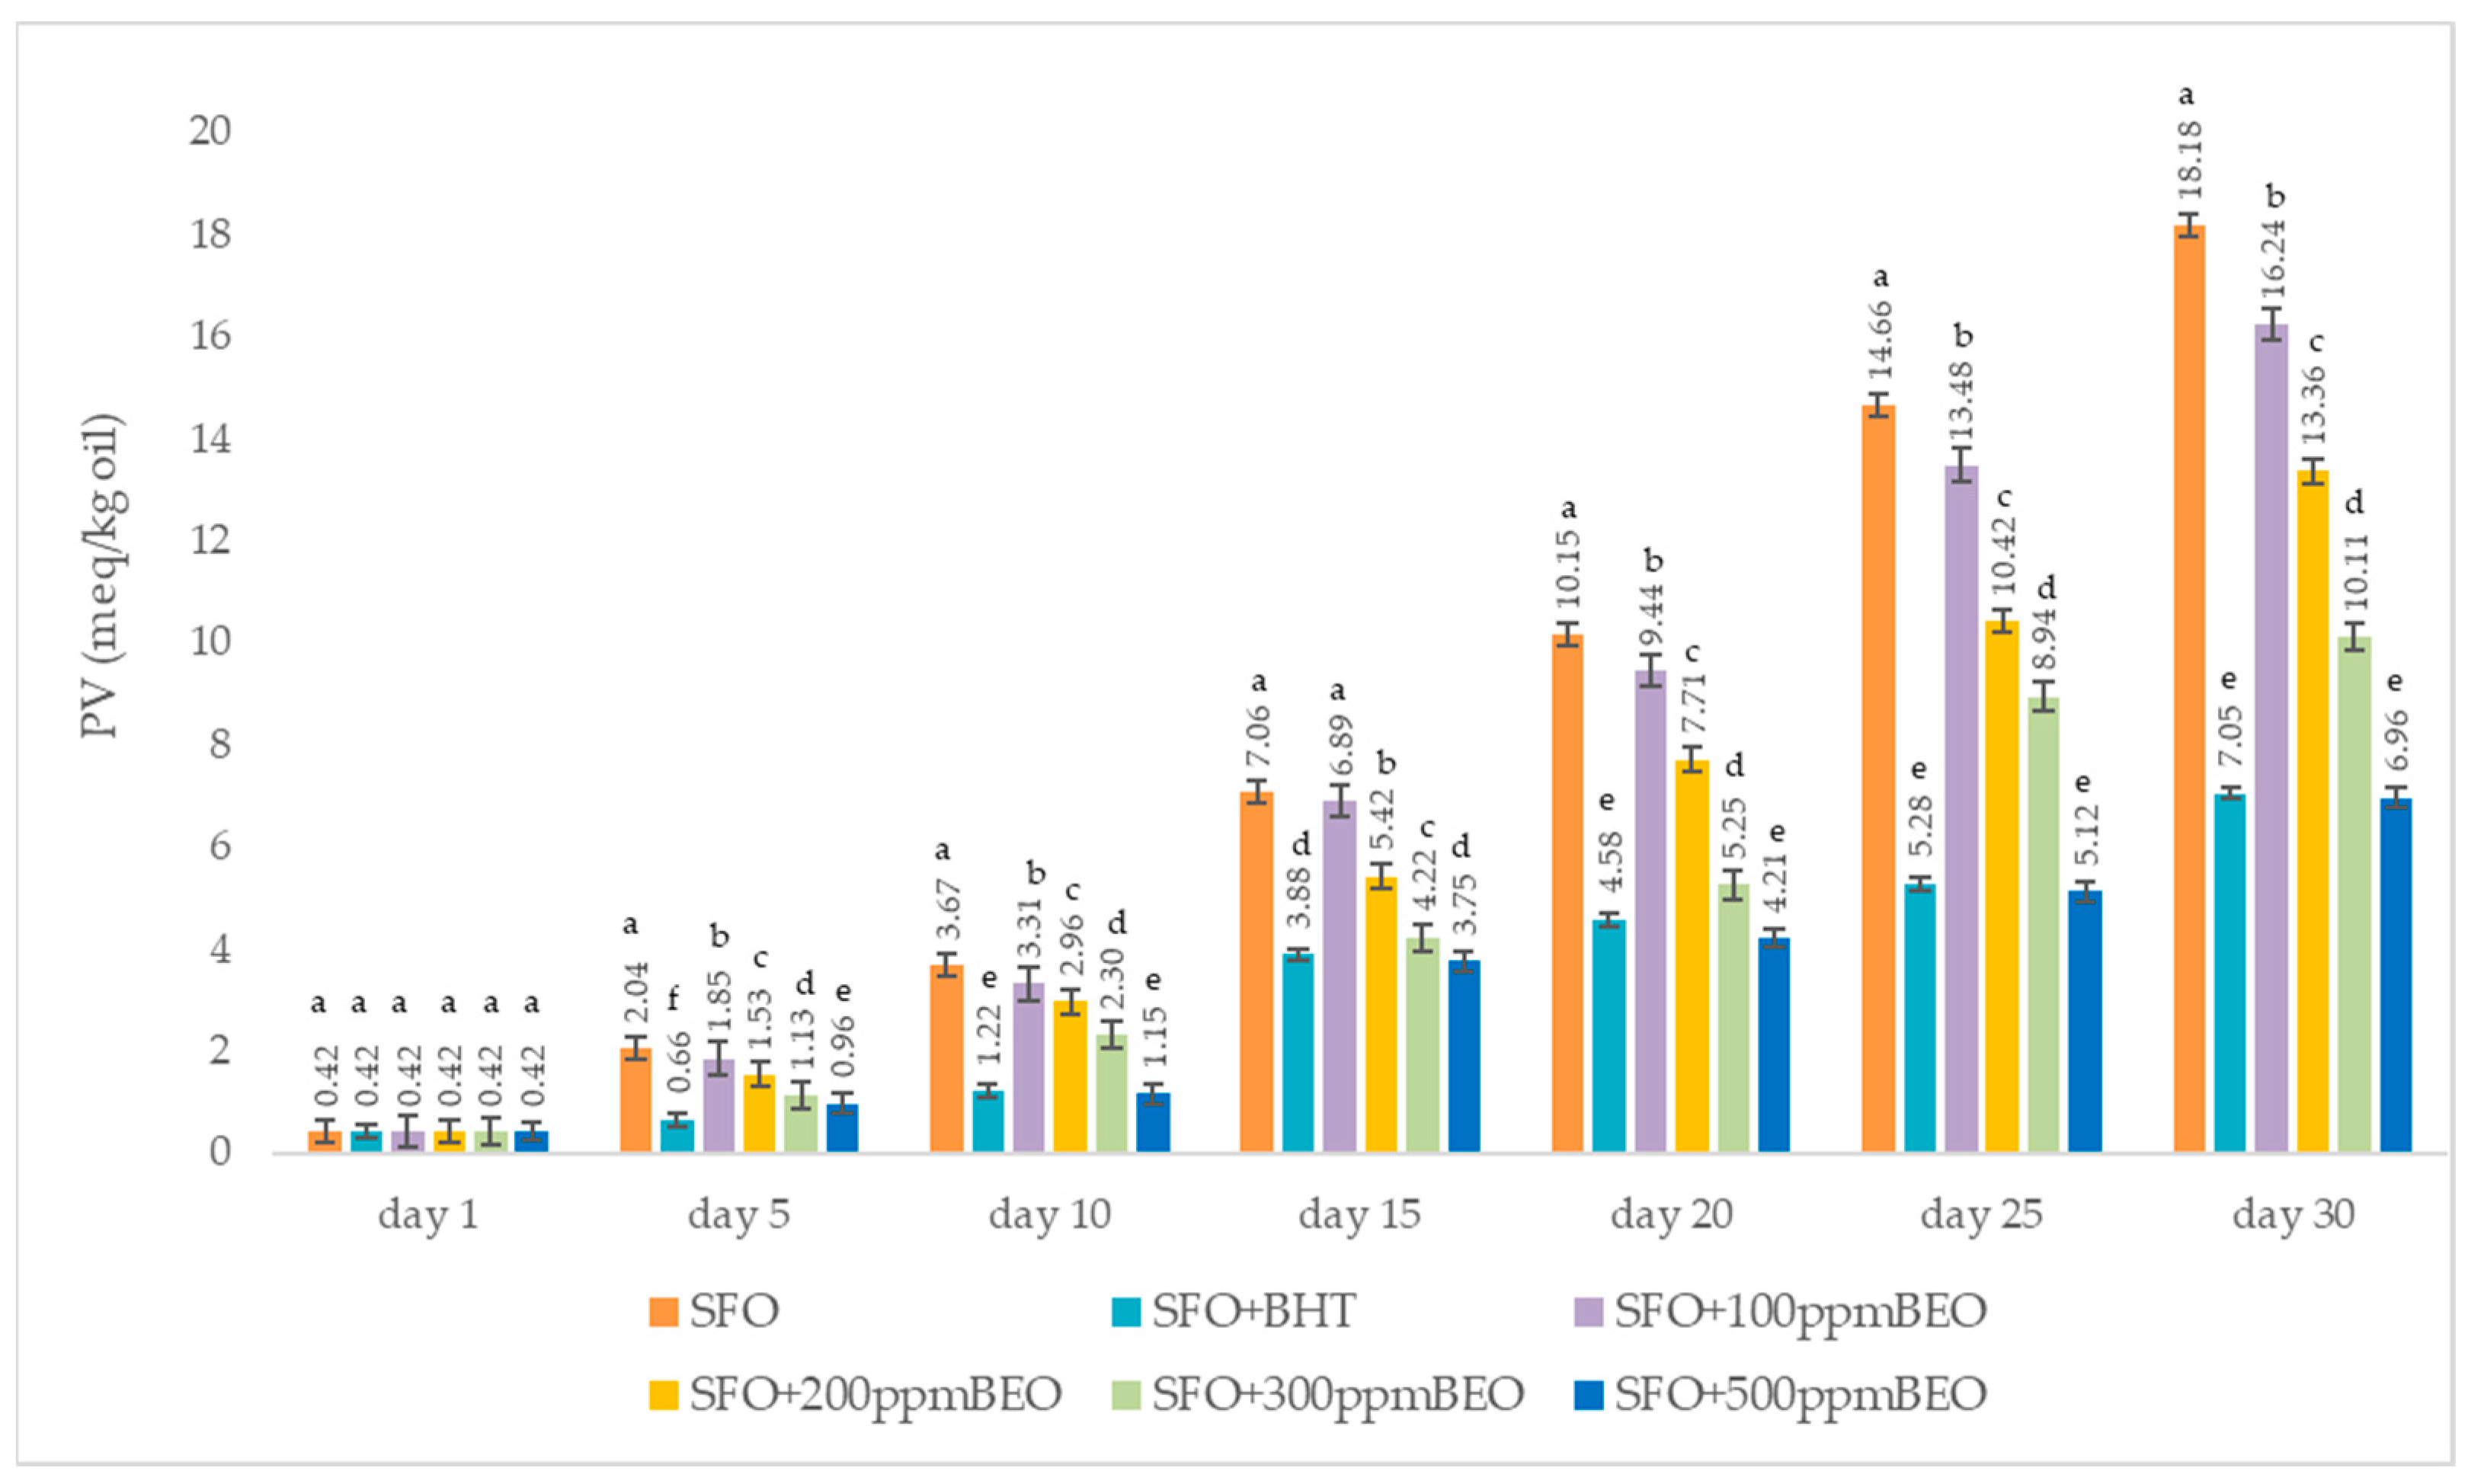
3.3.1. Peroxide Value
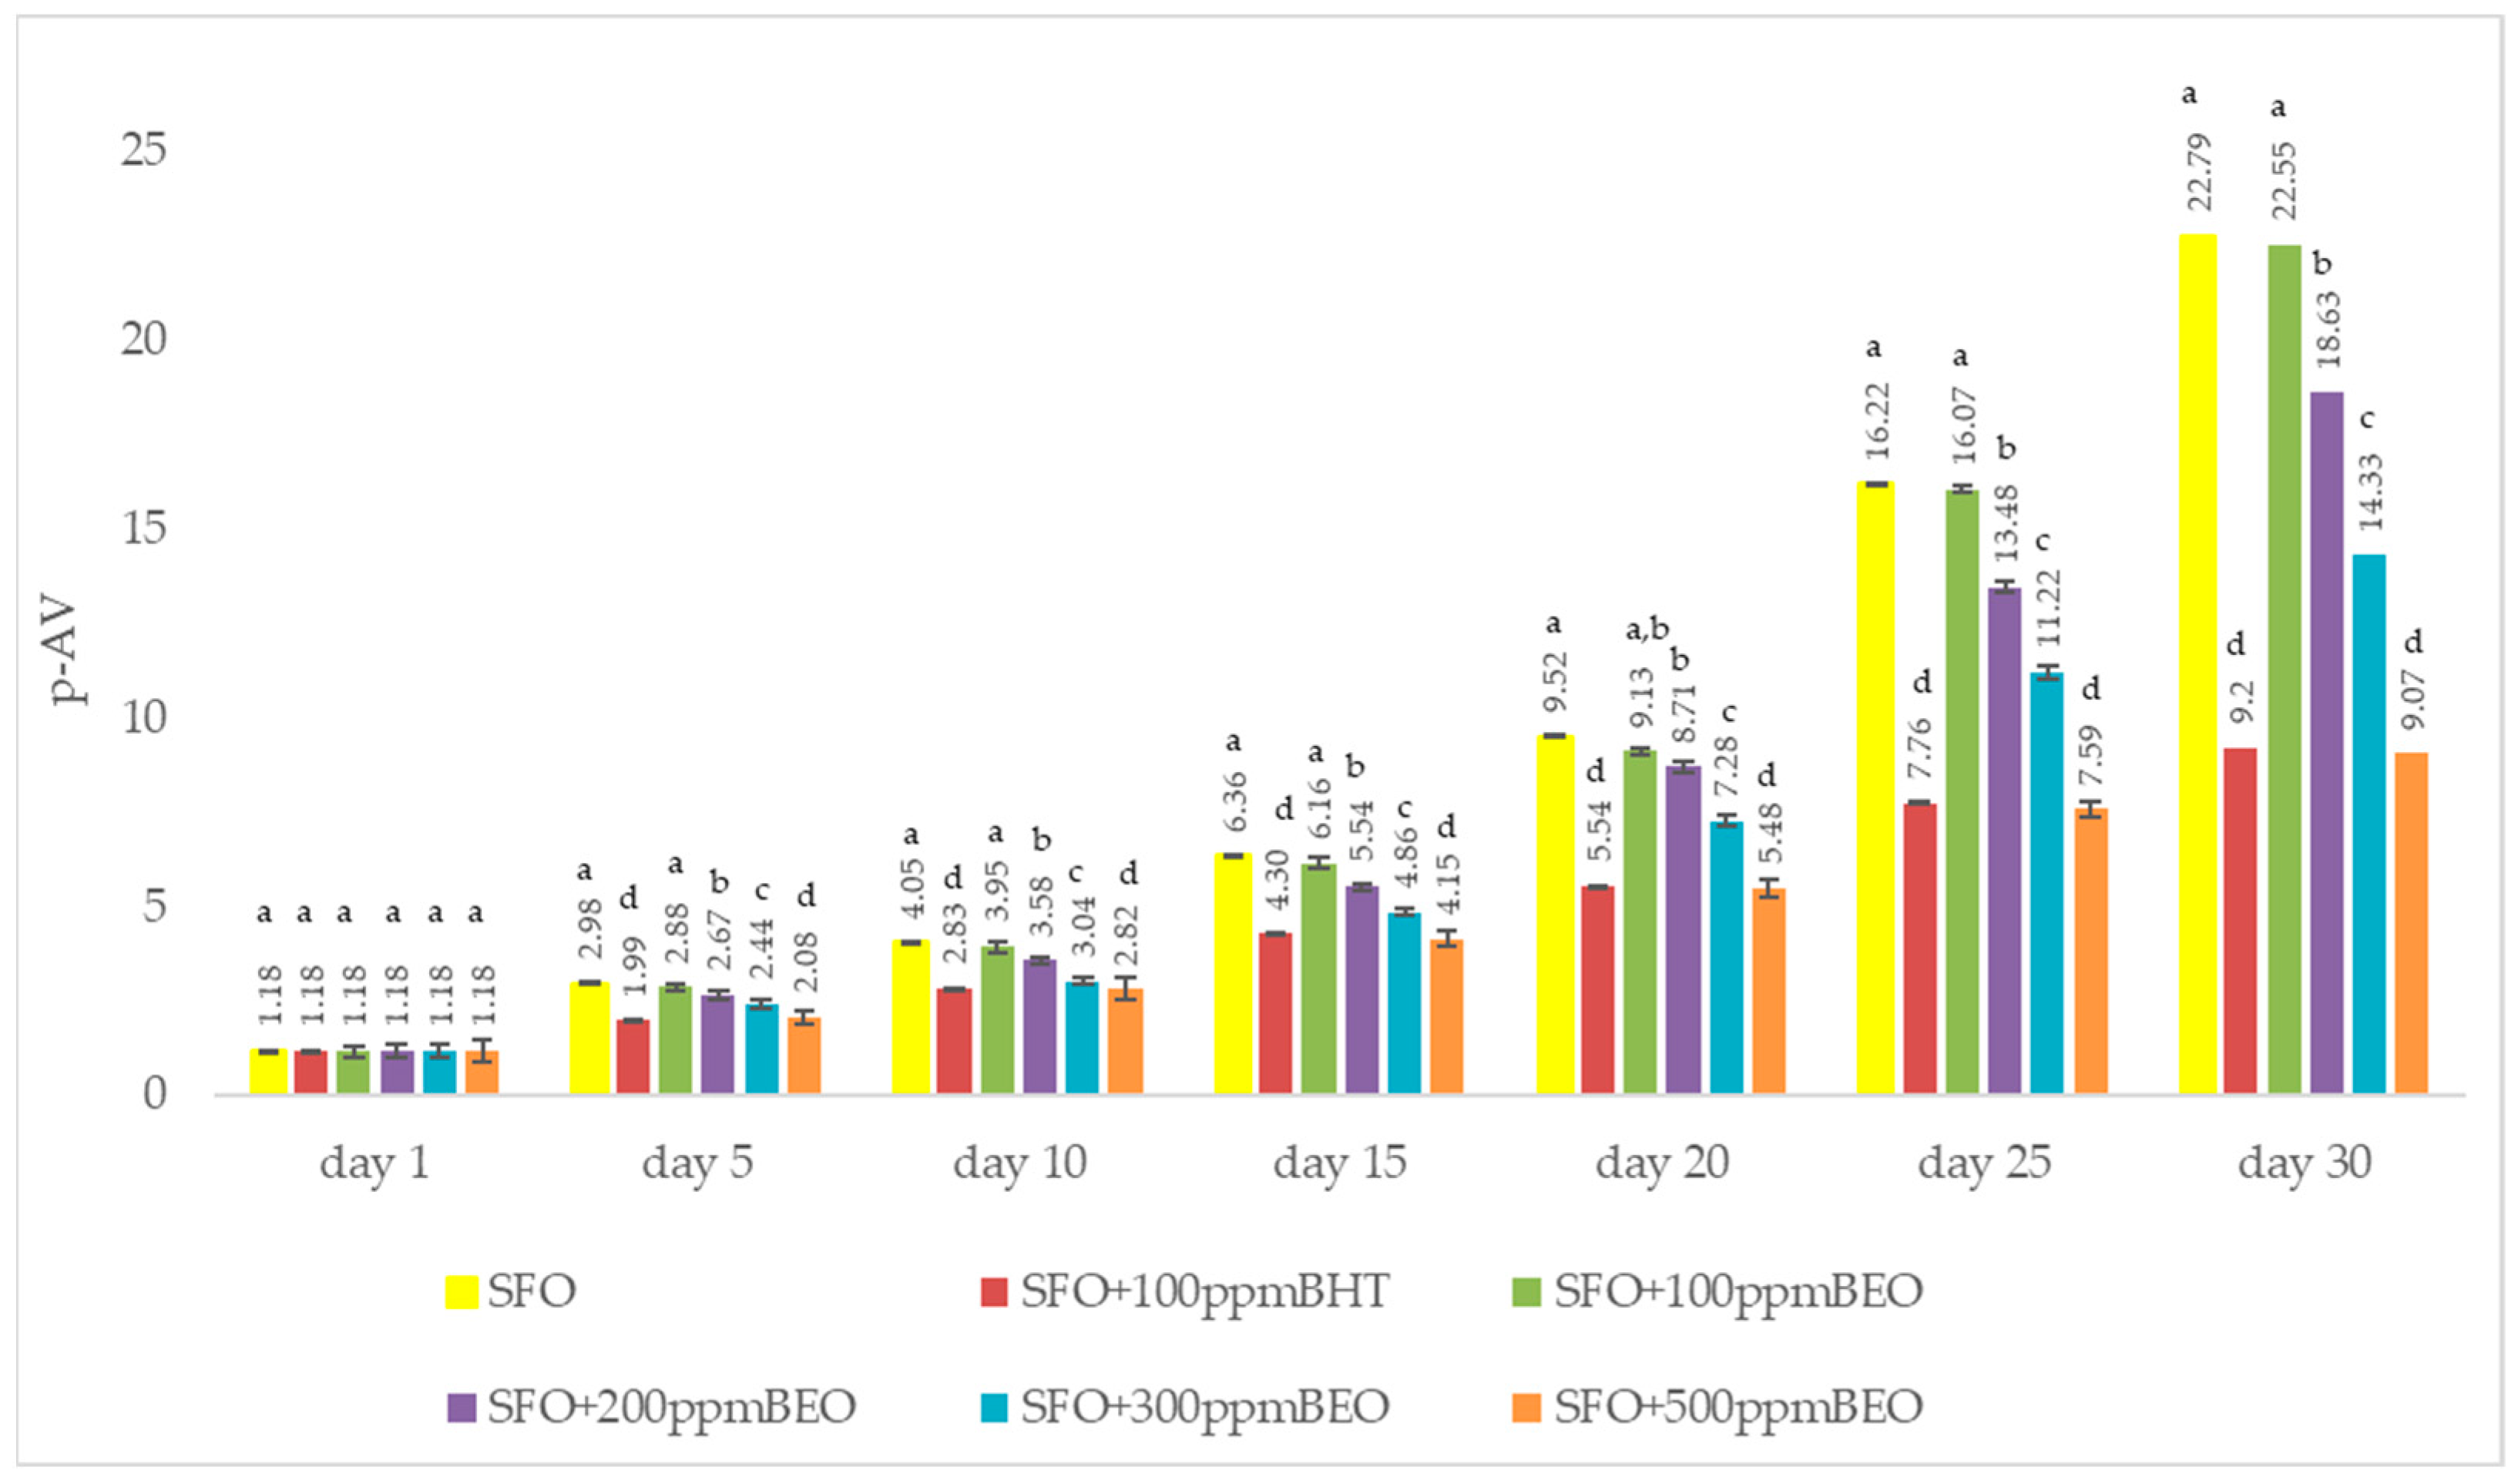
3.3.2. p-Anisidine Value (p-AV)
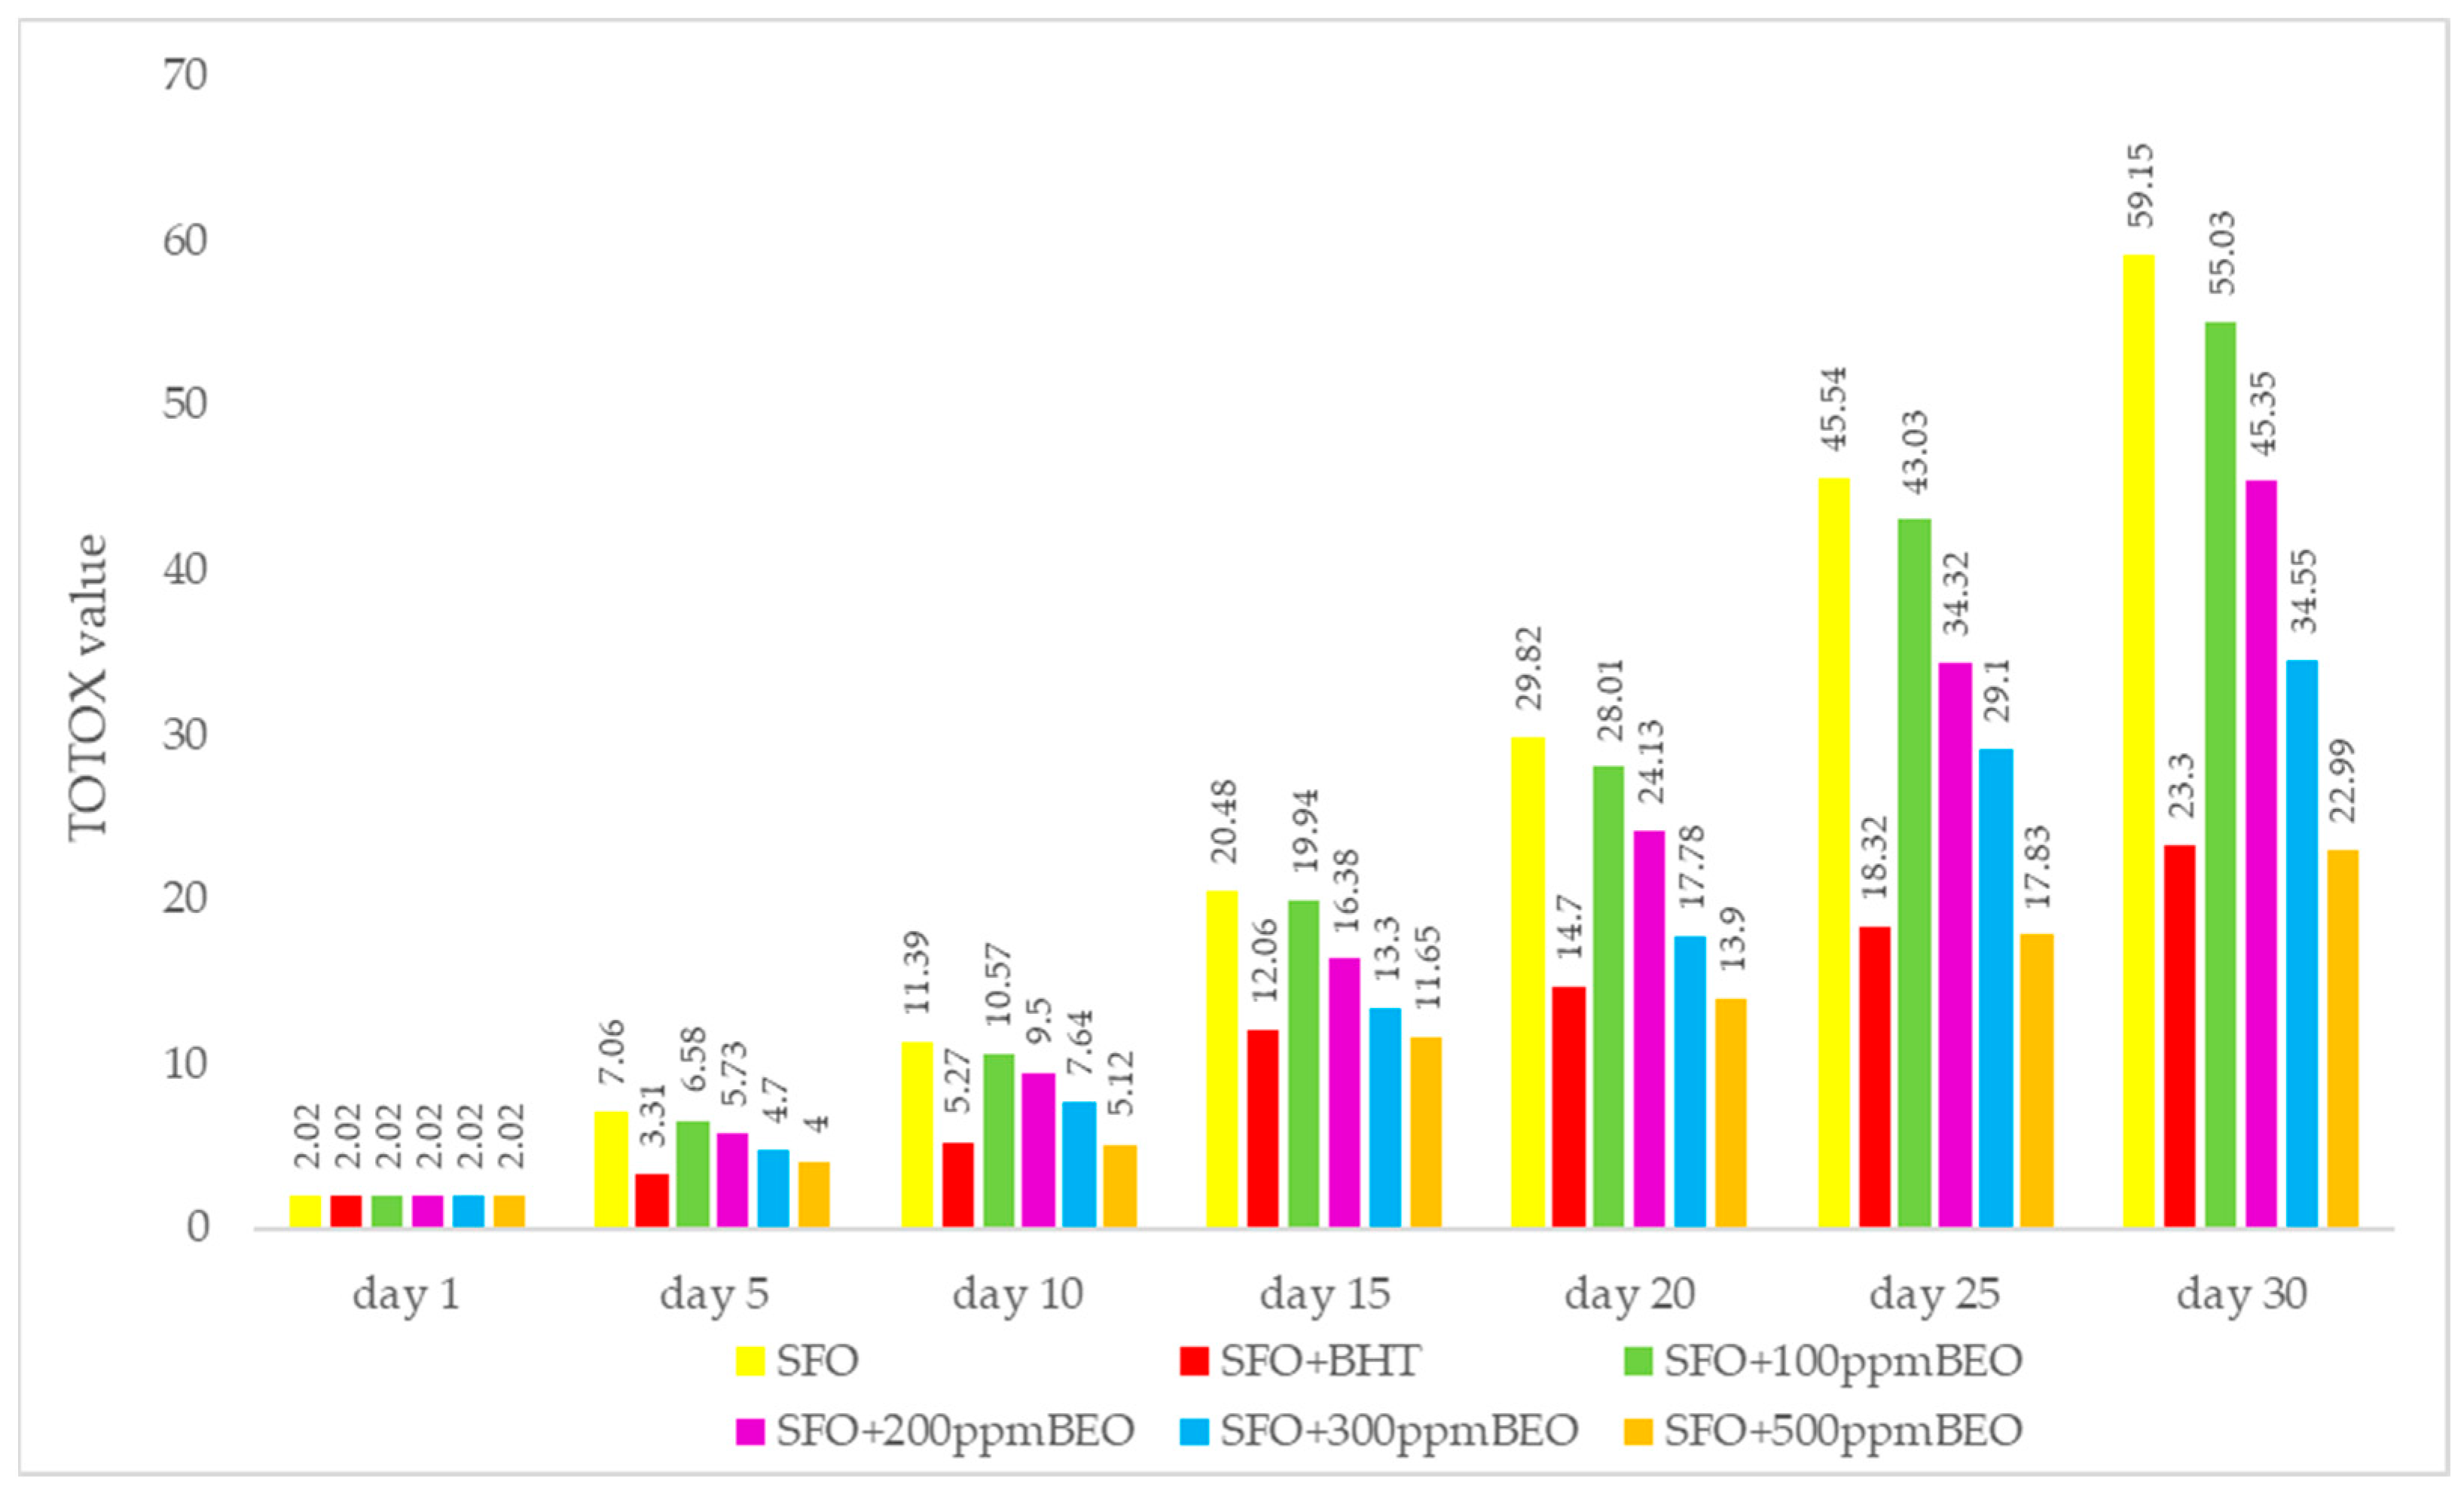
3.3.3. Total Oxidation Value (TOTOX)
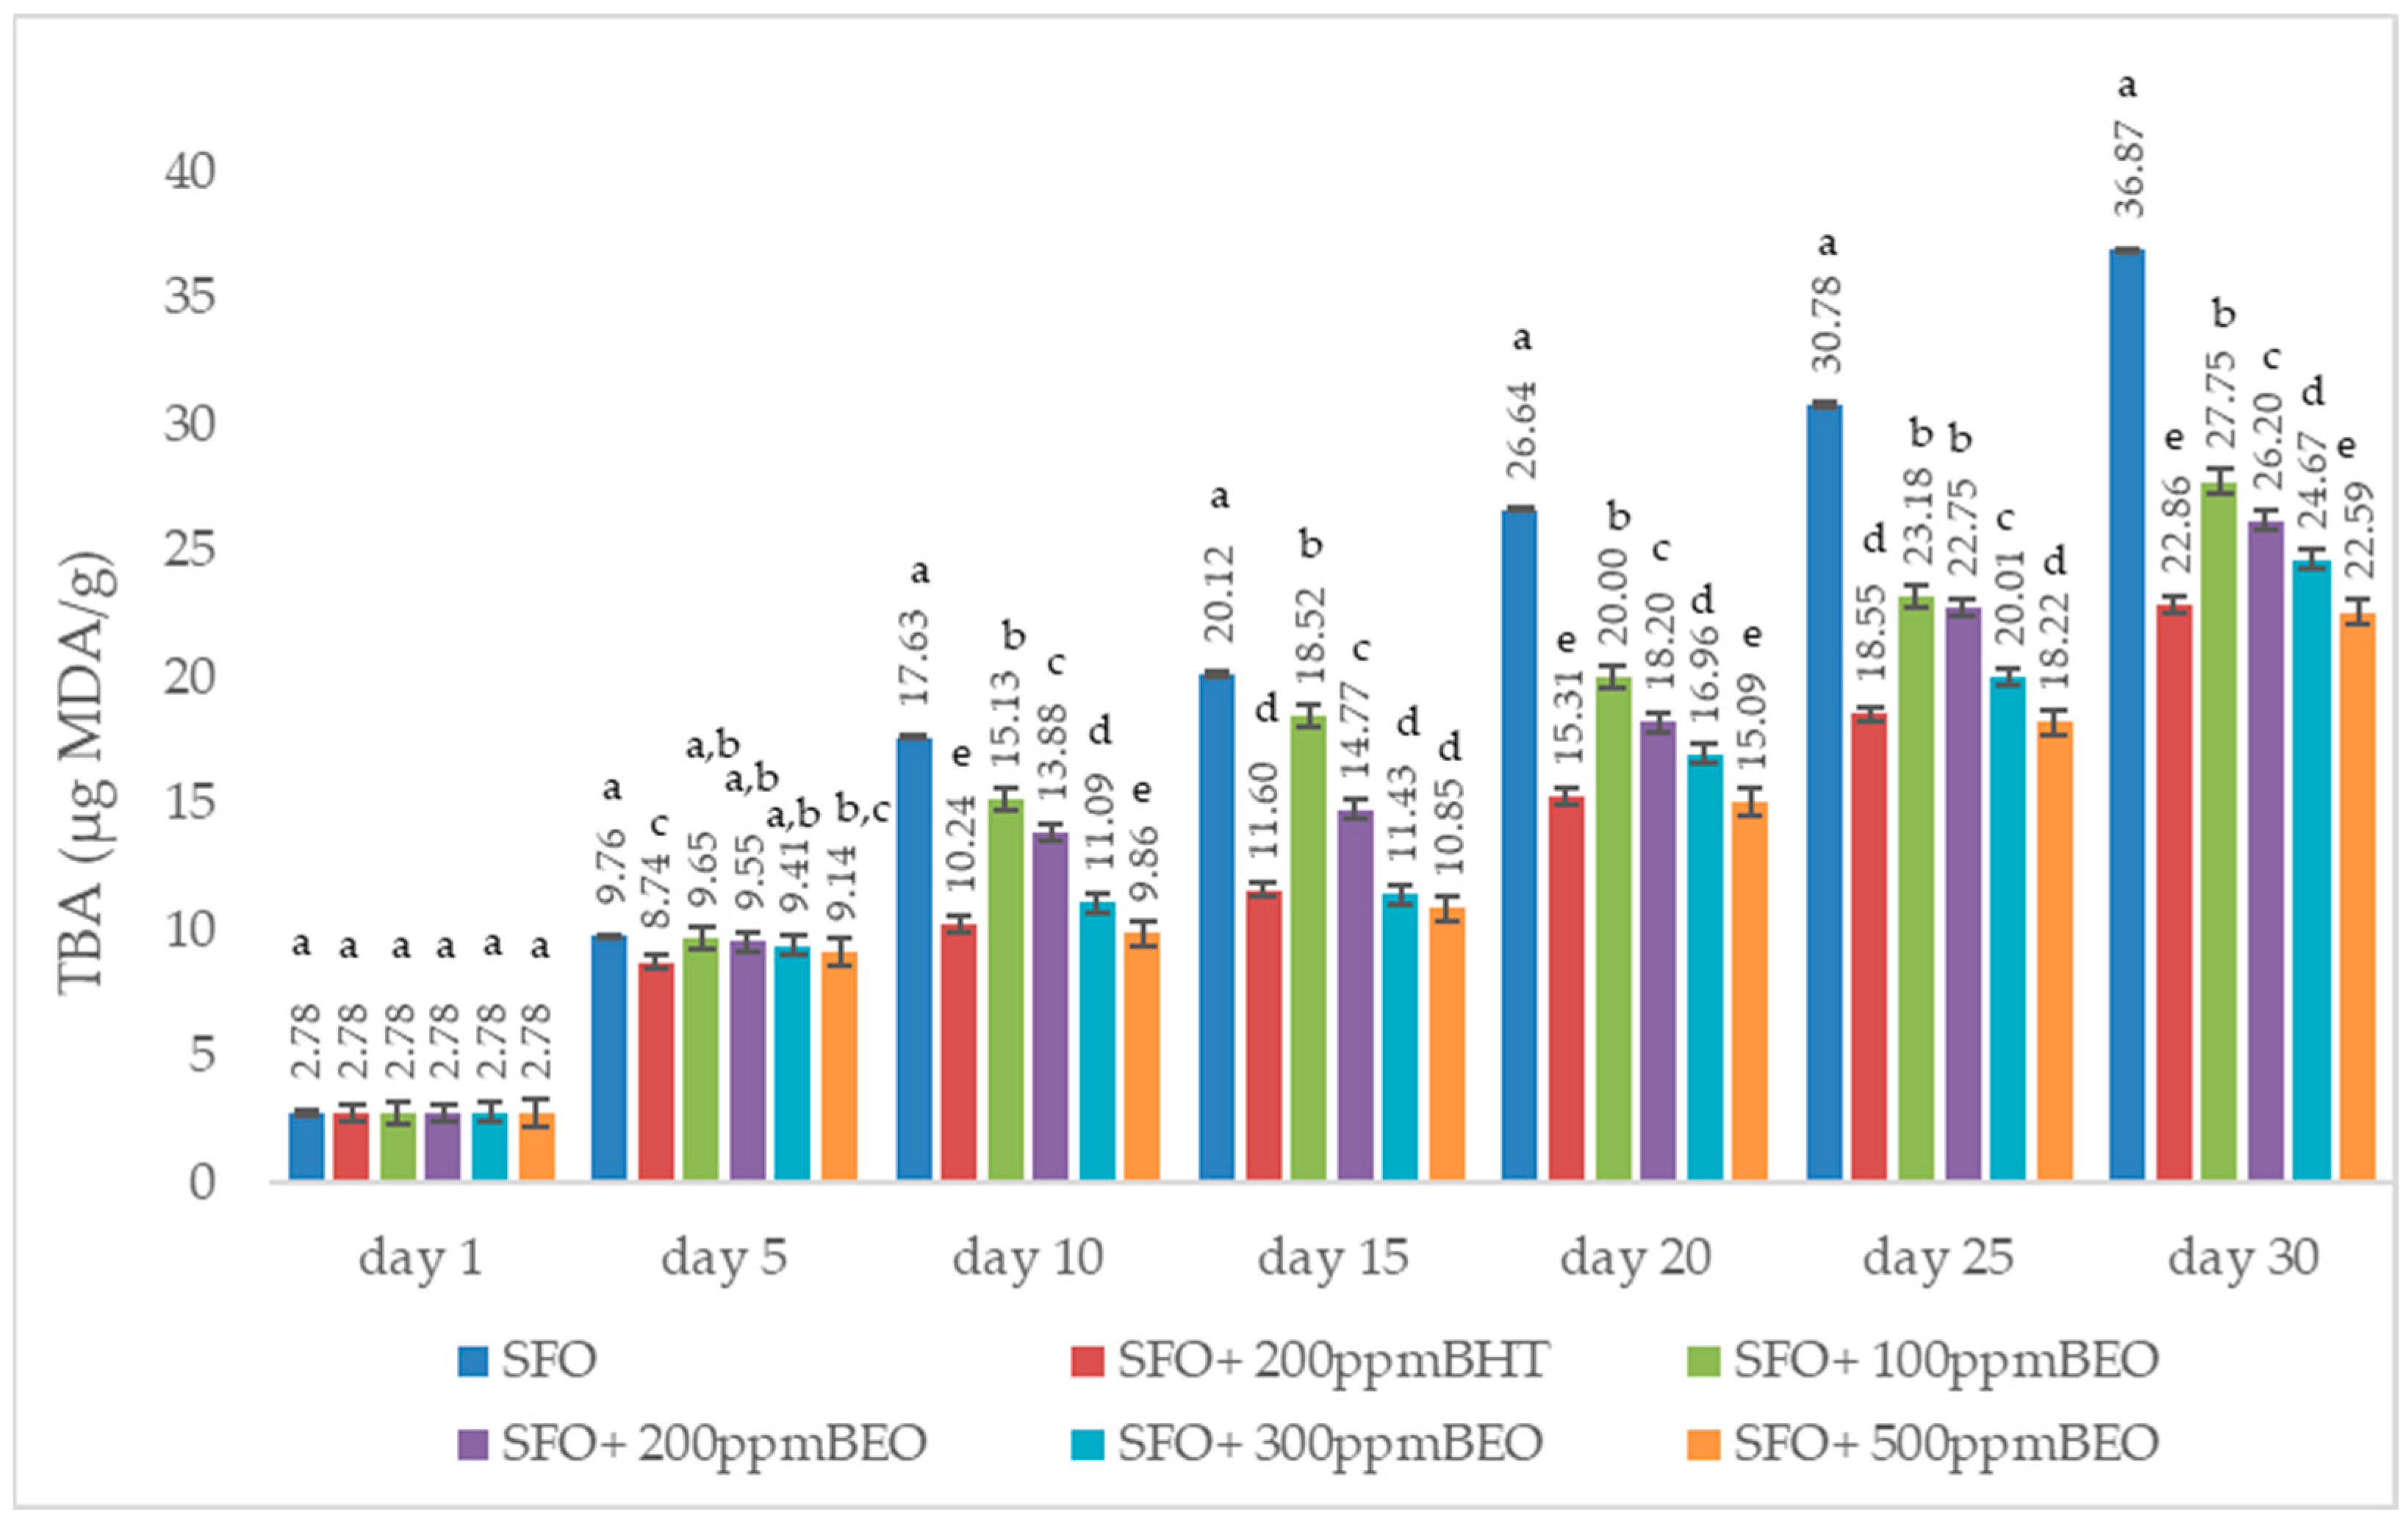
3.3.4. Assessing the Lipid Oxidation Degree of Oil Samples by Thiobarbituric Acid (TBA) Test
3.4. Anti-Inflammatory Activity
3.4.1. Membrane Lysis Assay
3.4.2. The Effect on Protein Denaturation
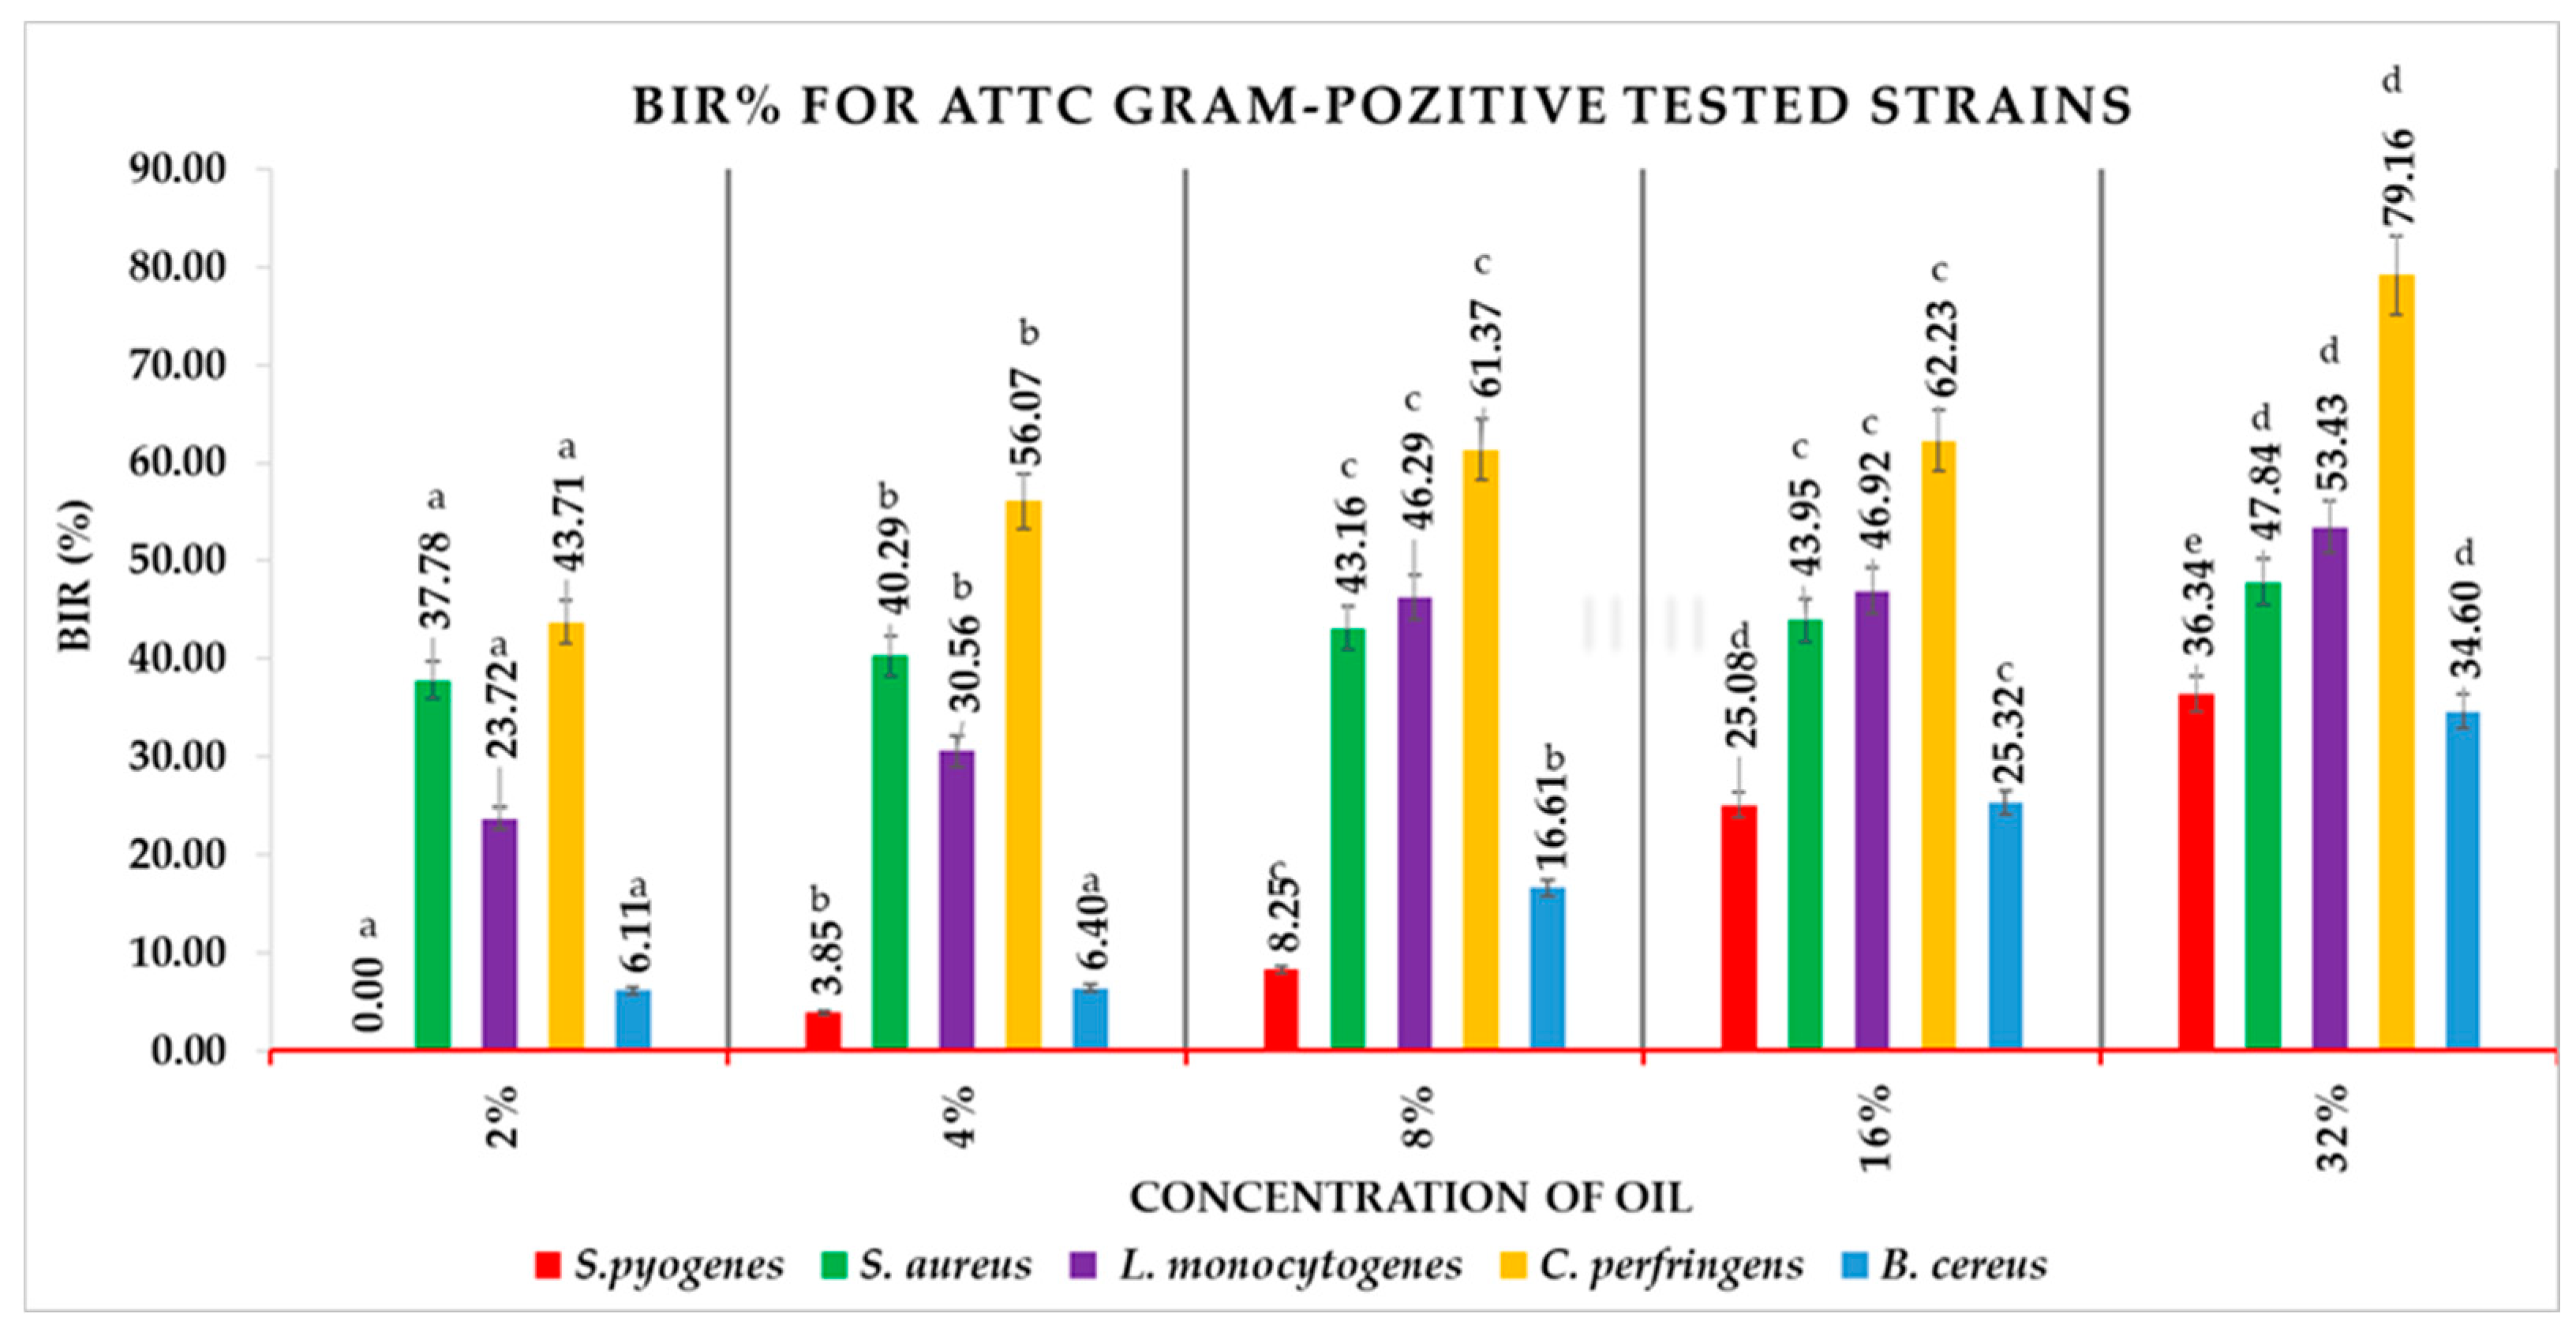
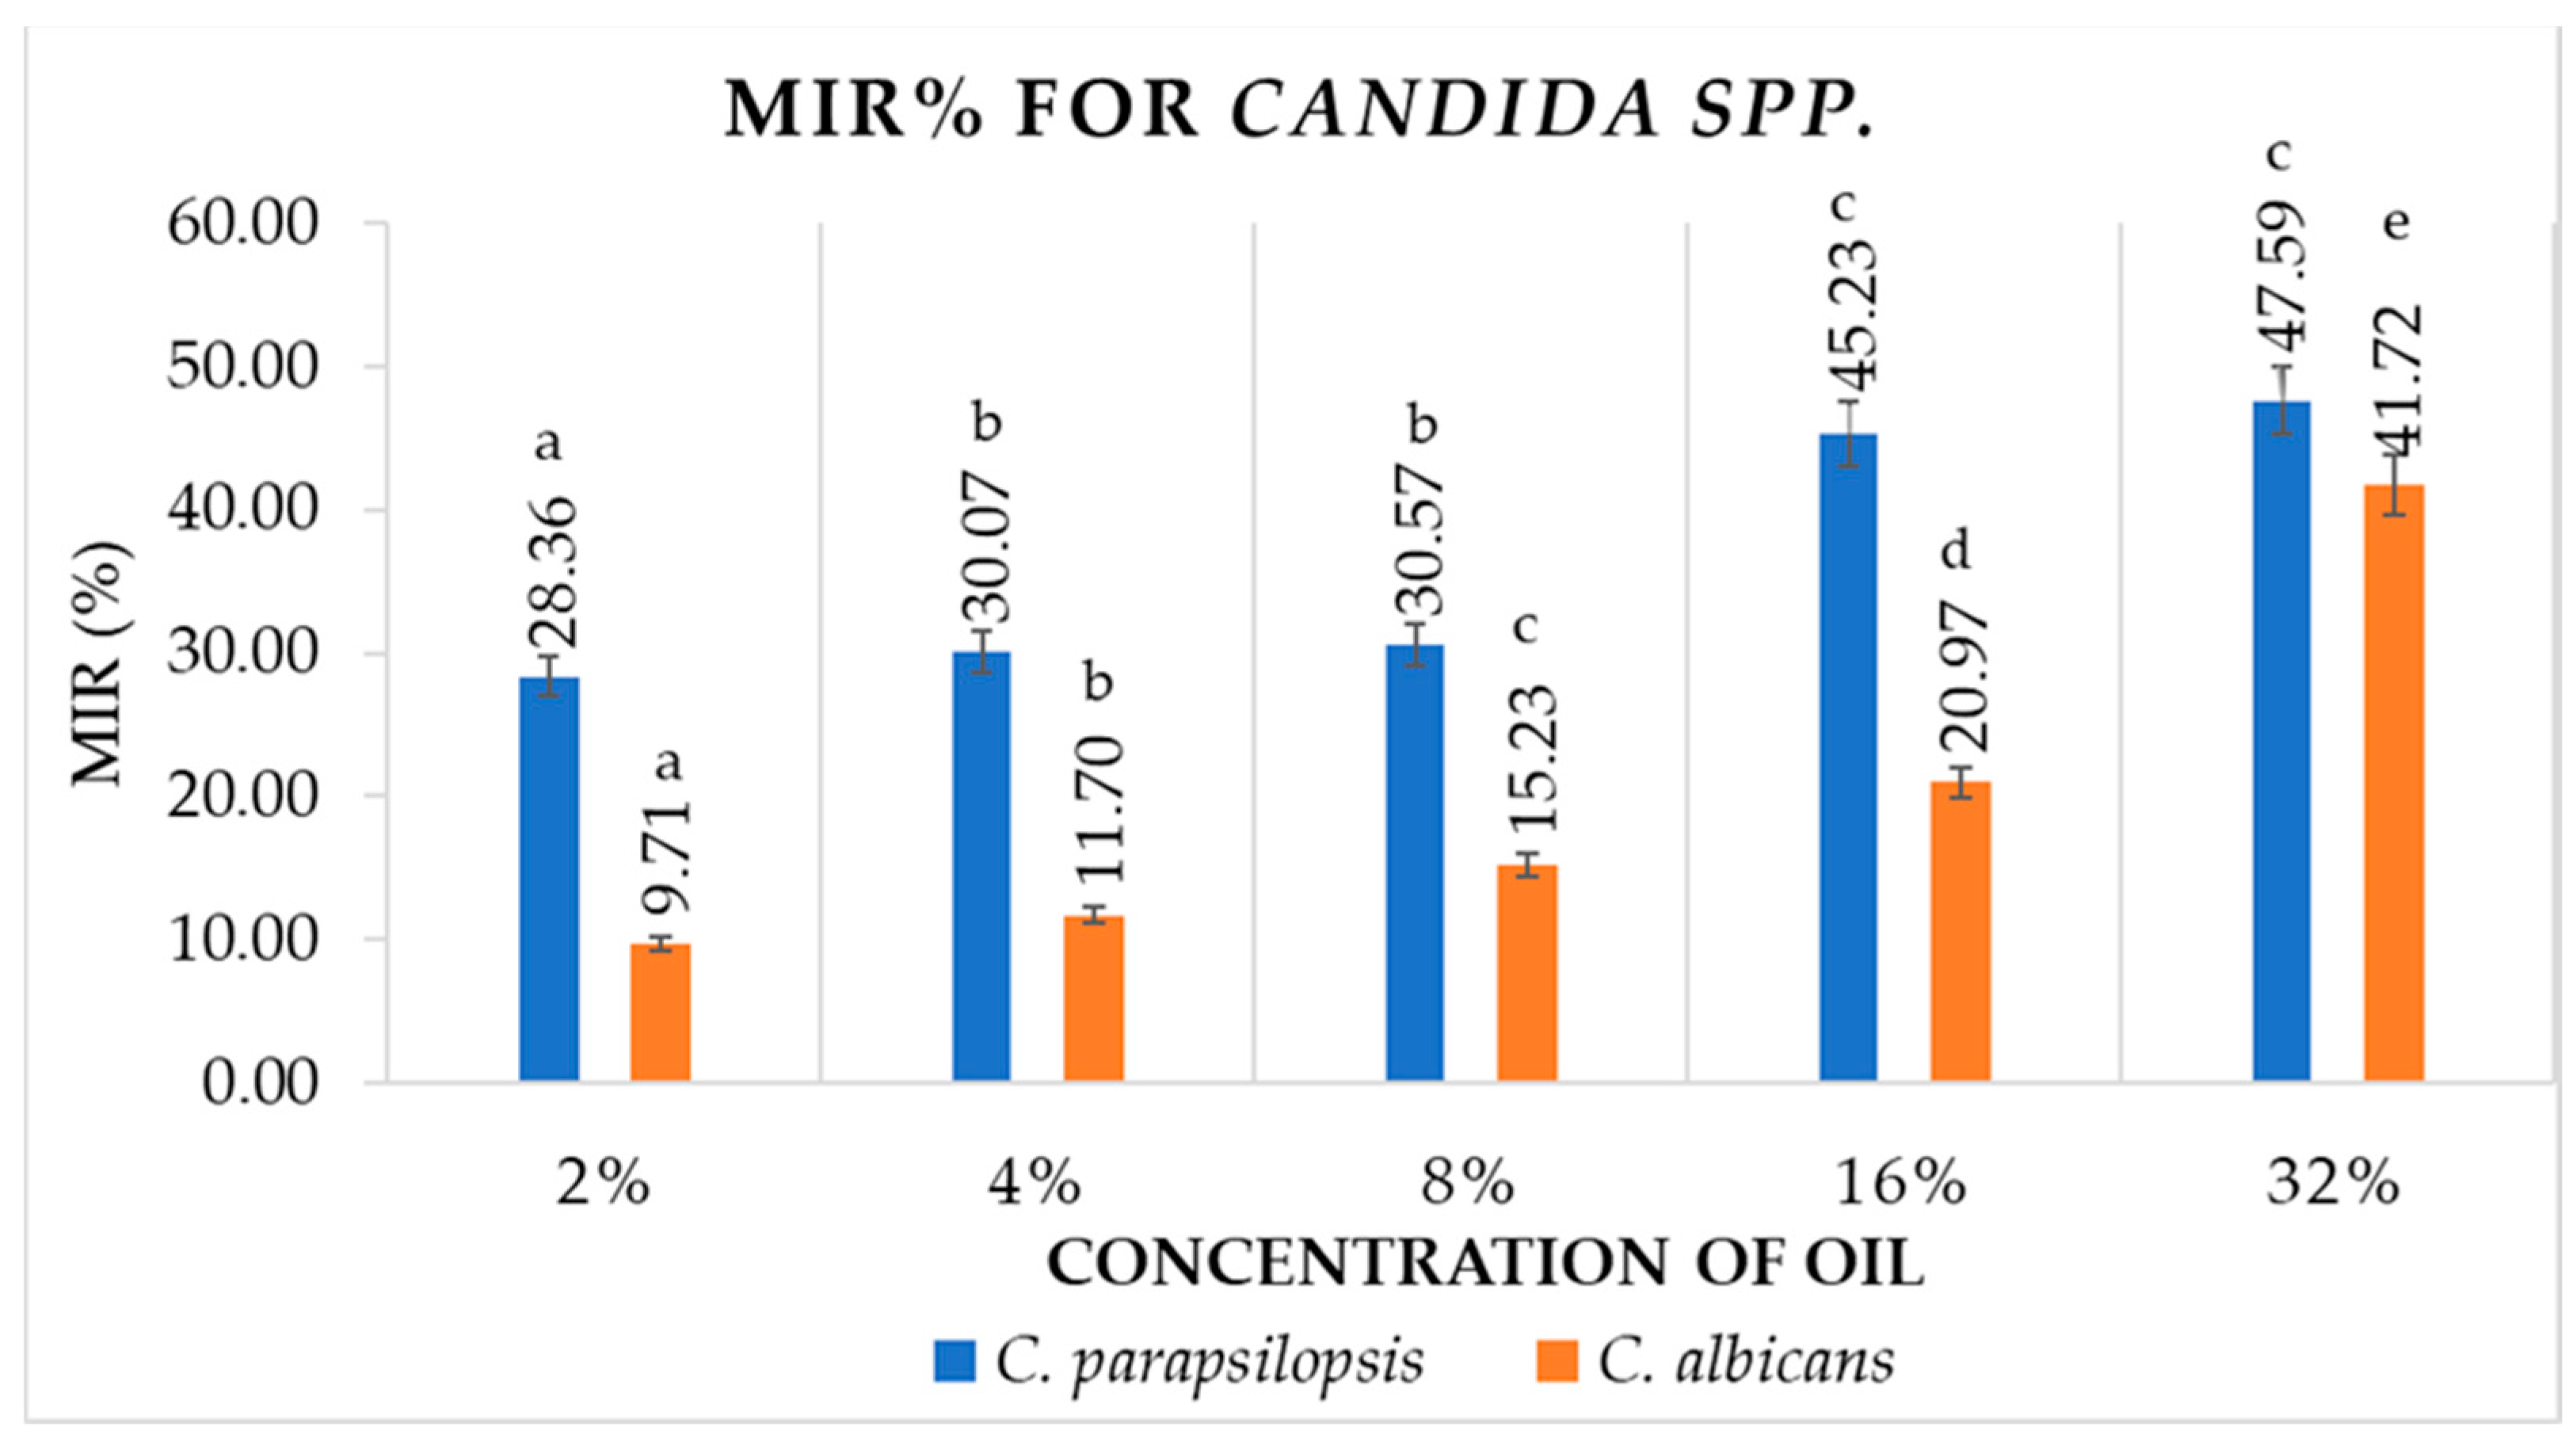
3.5. Antimicrobial Activity
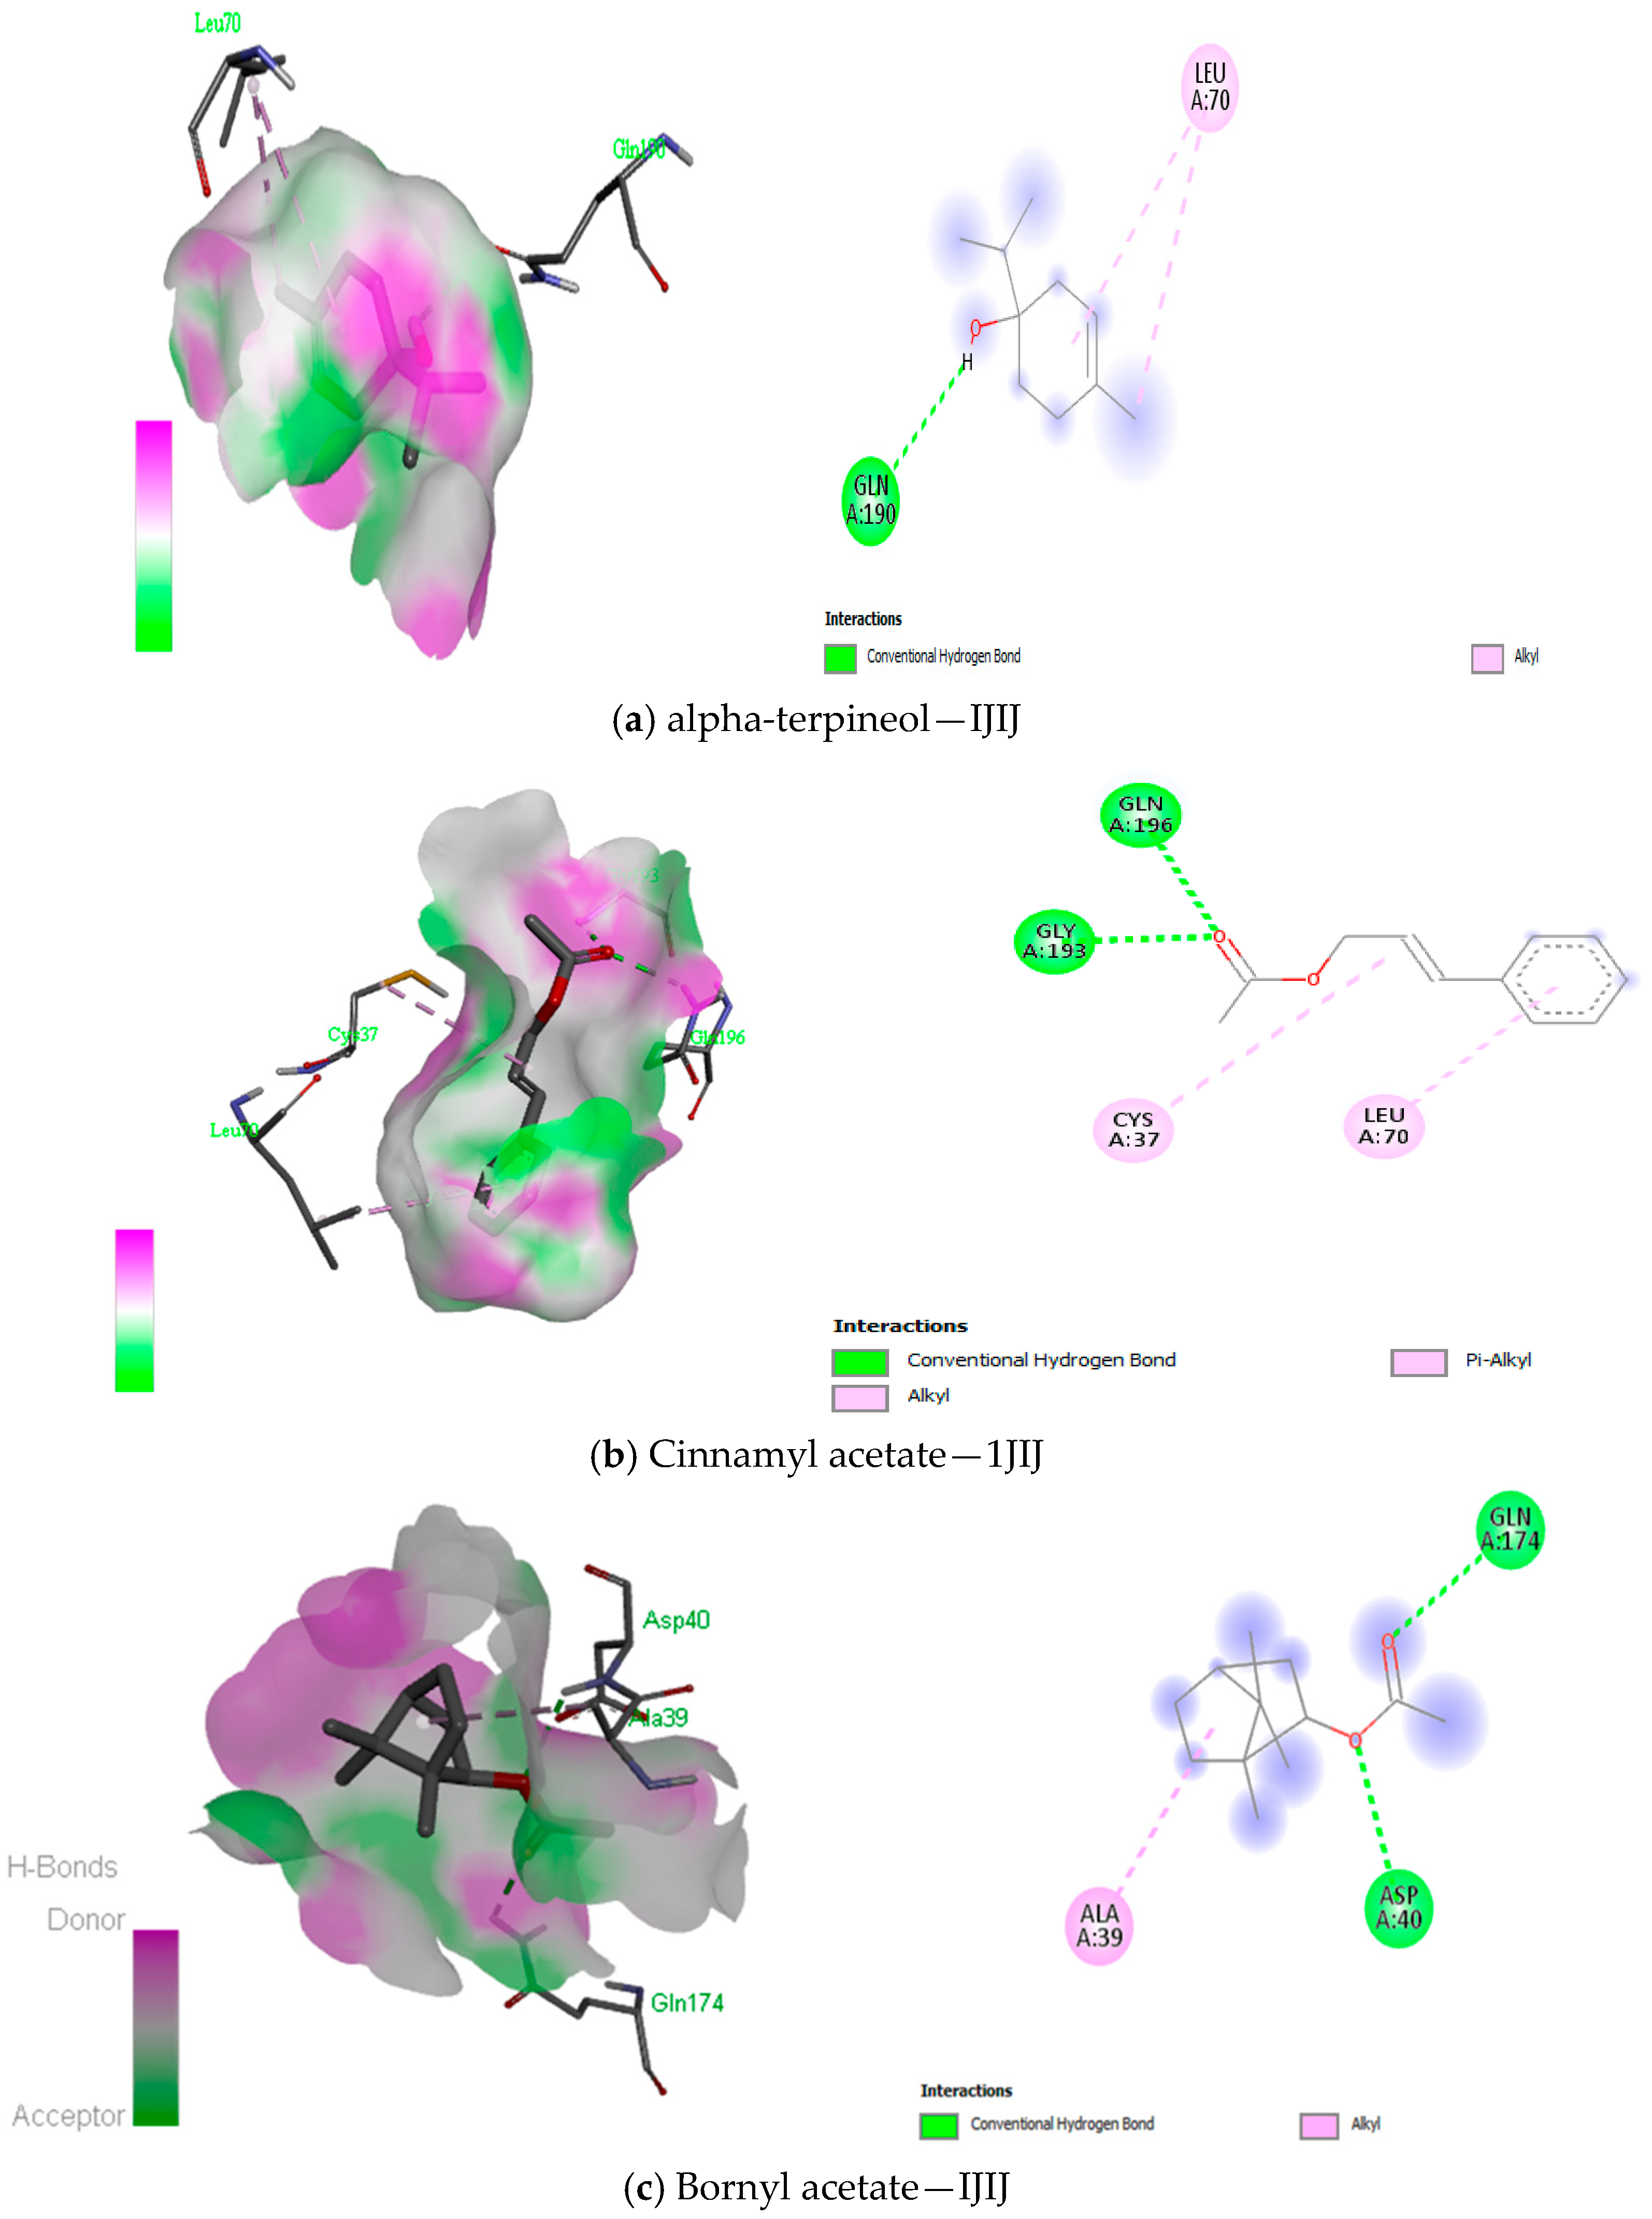
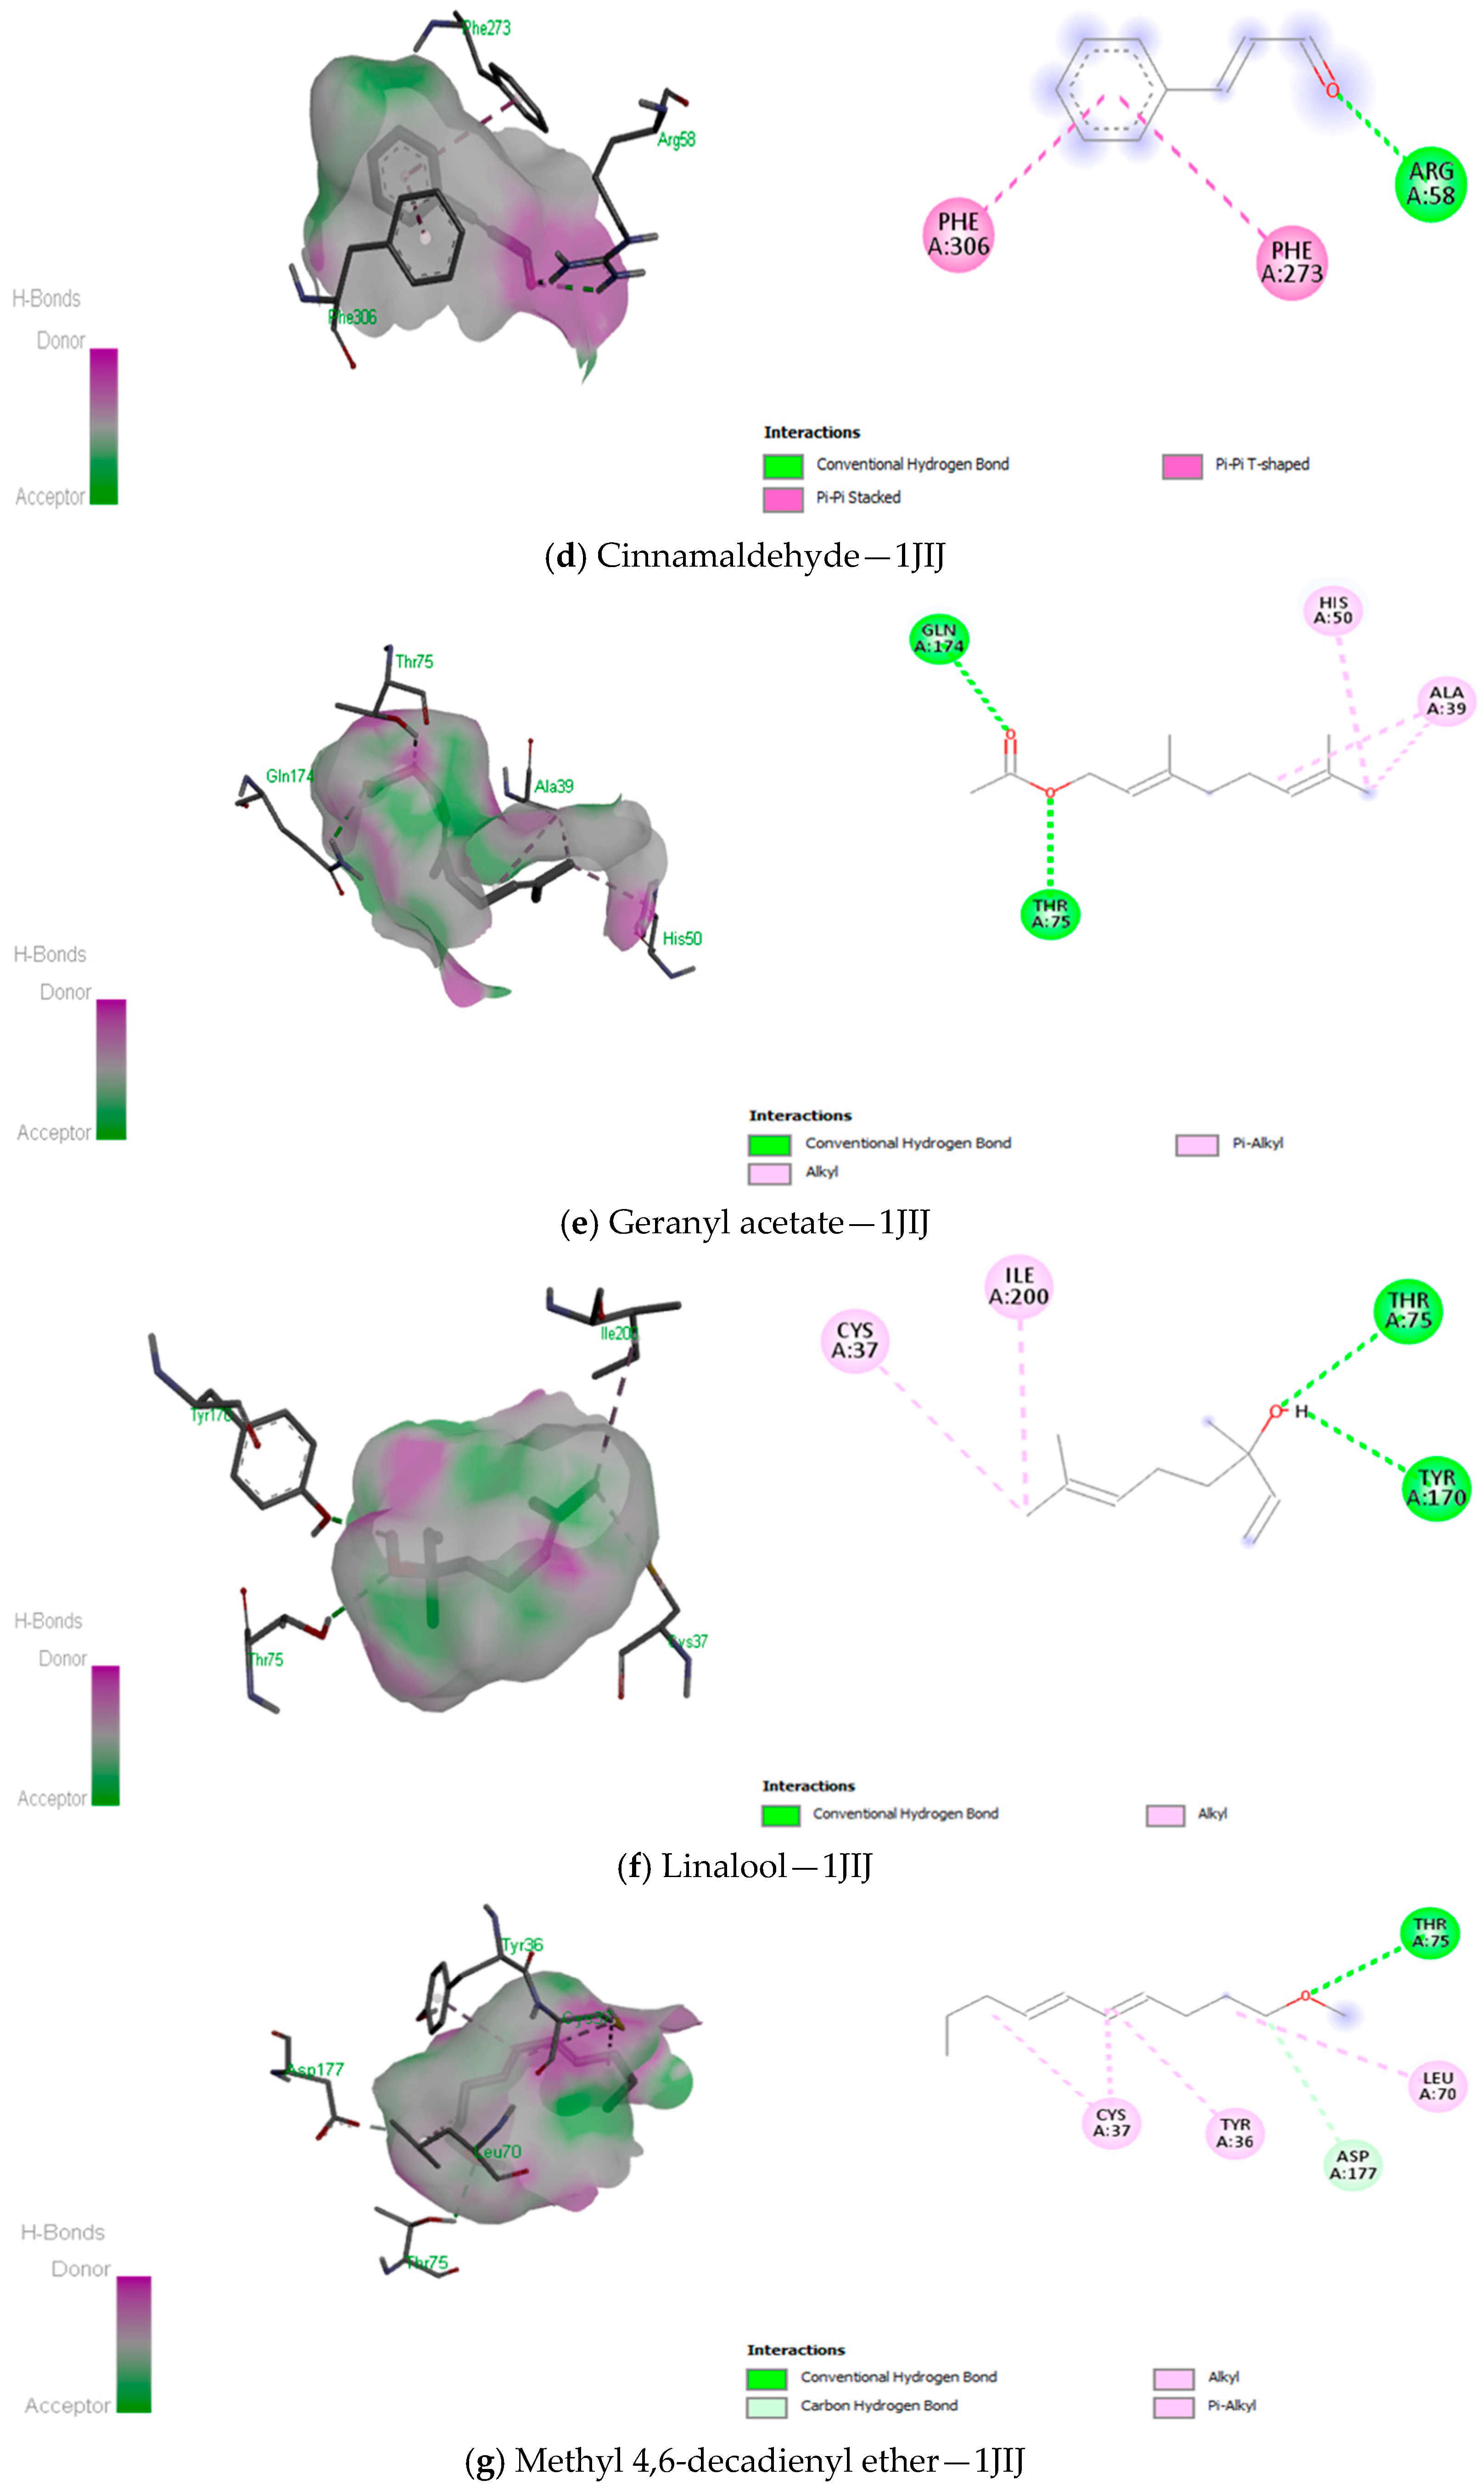
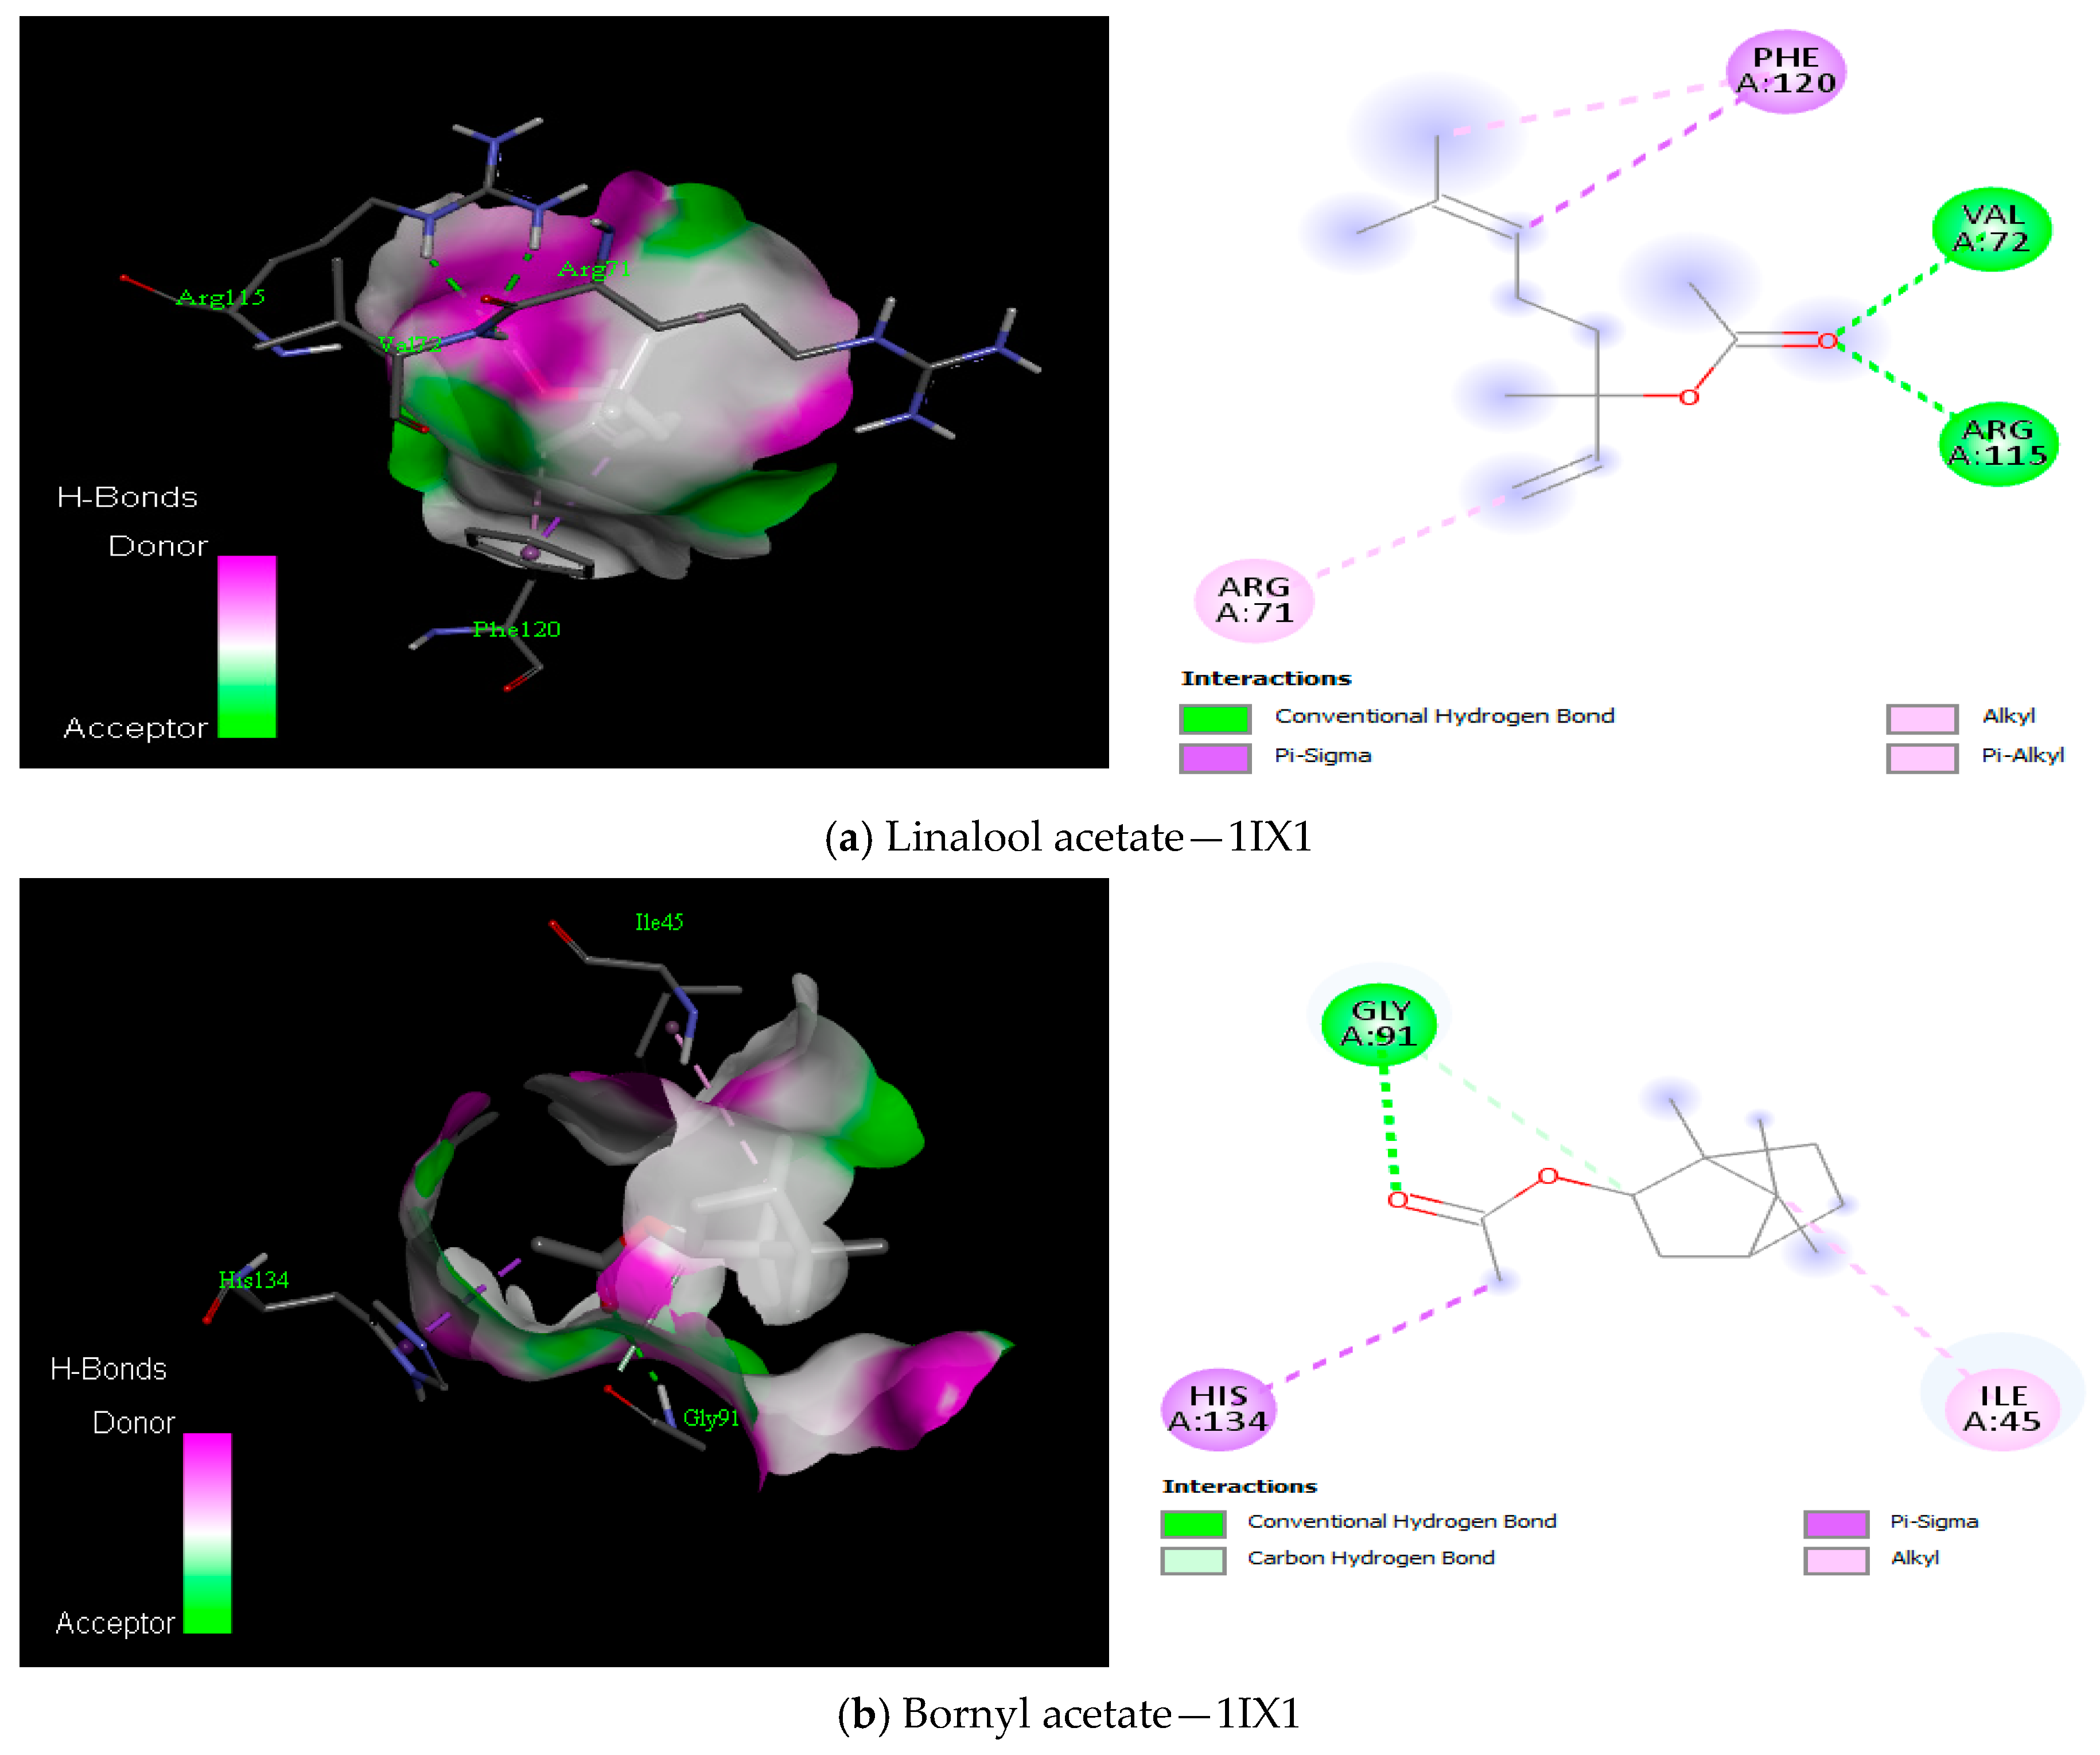
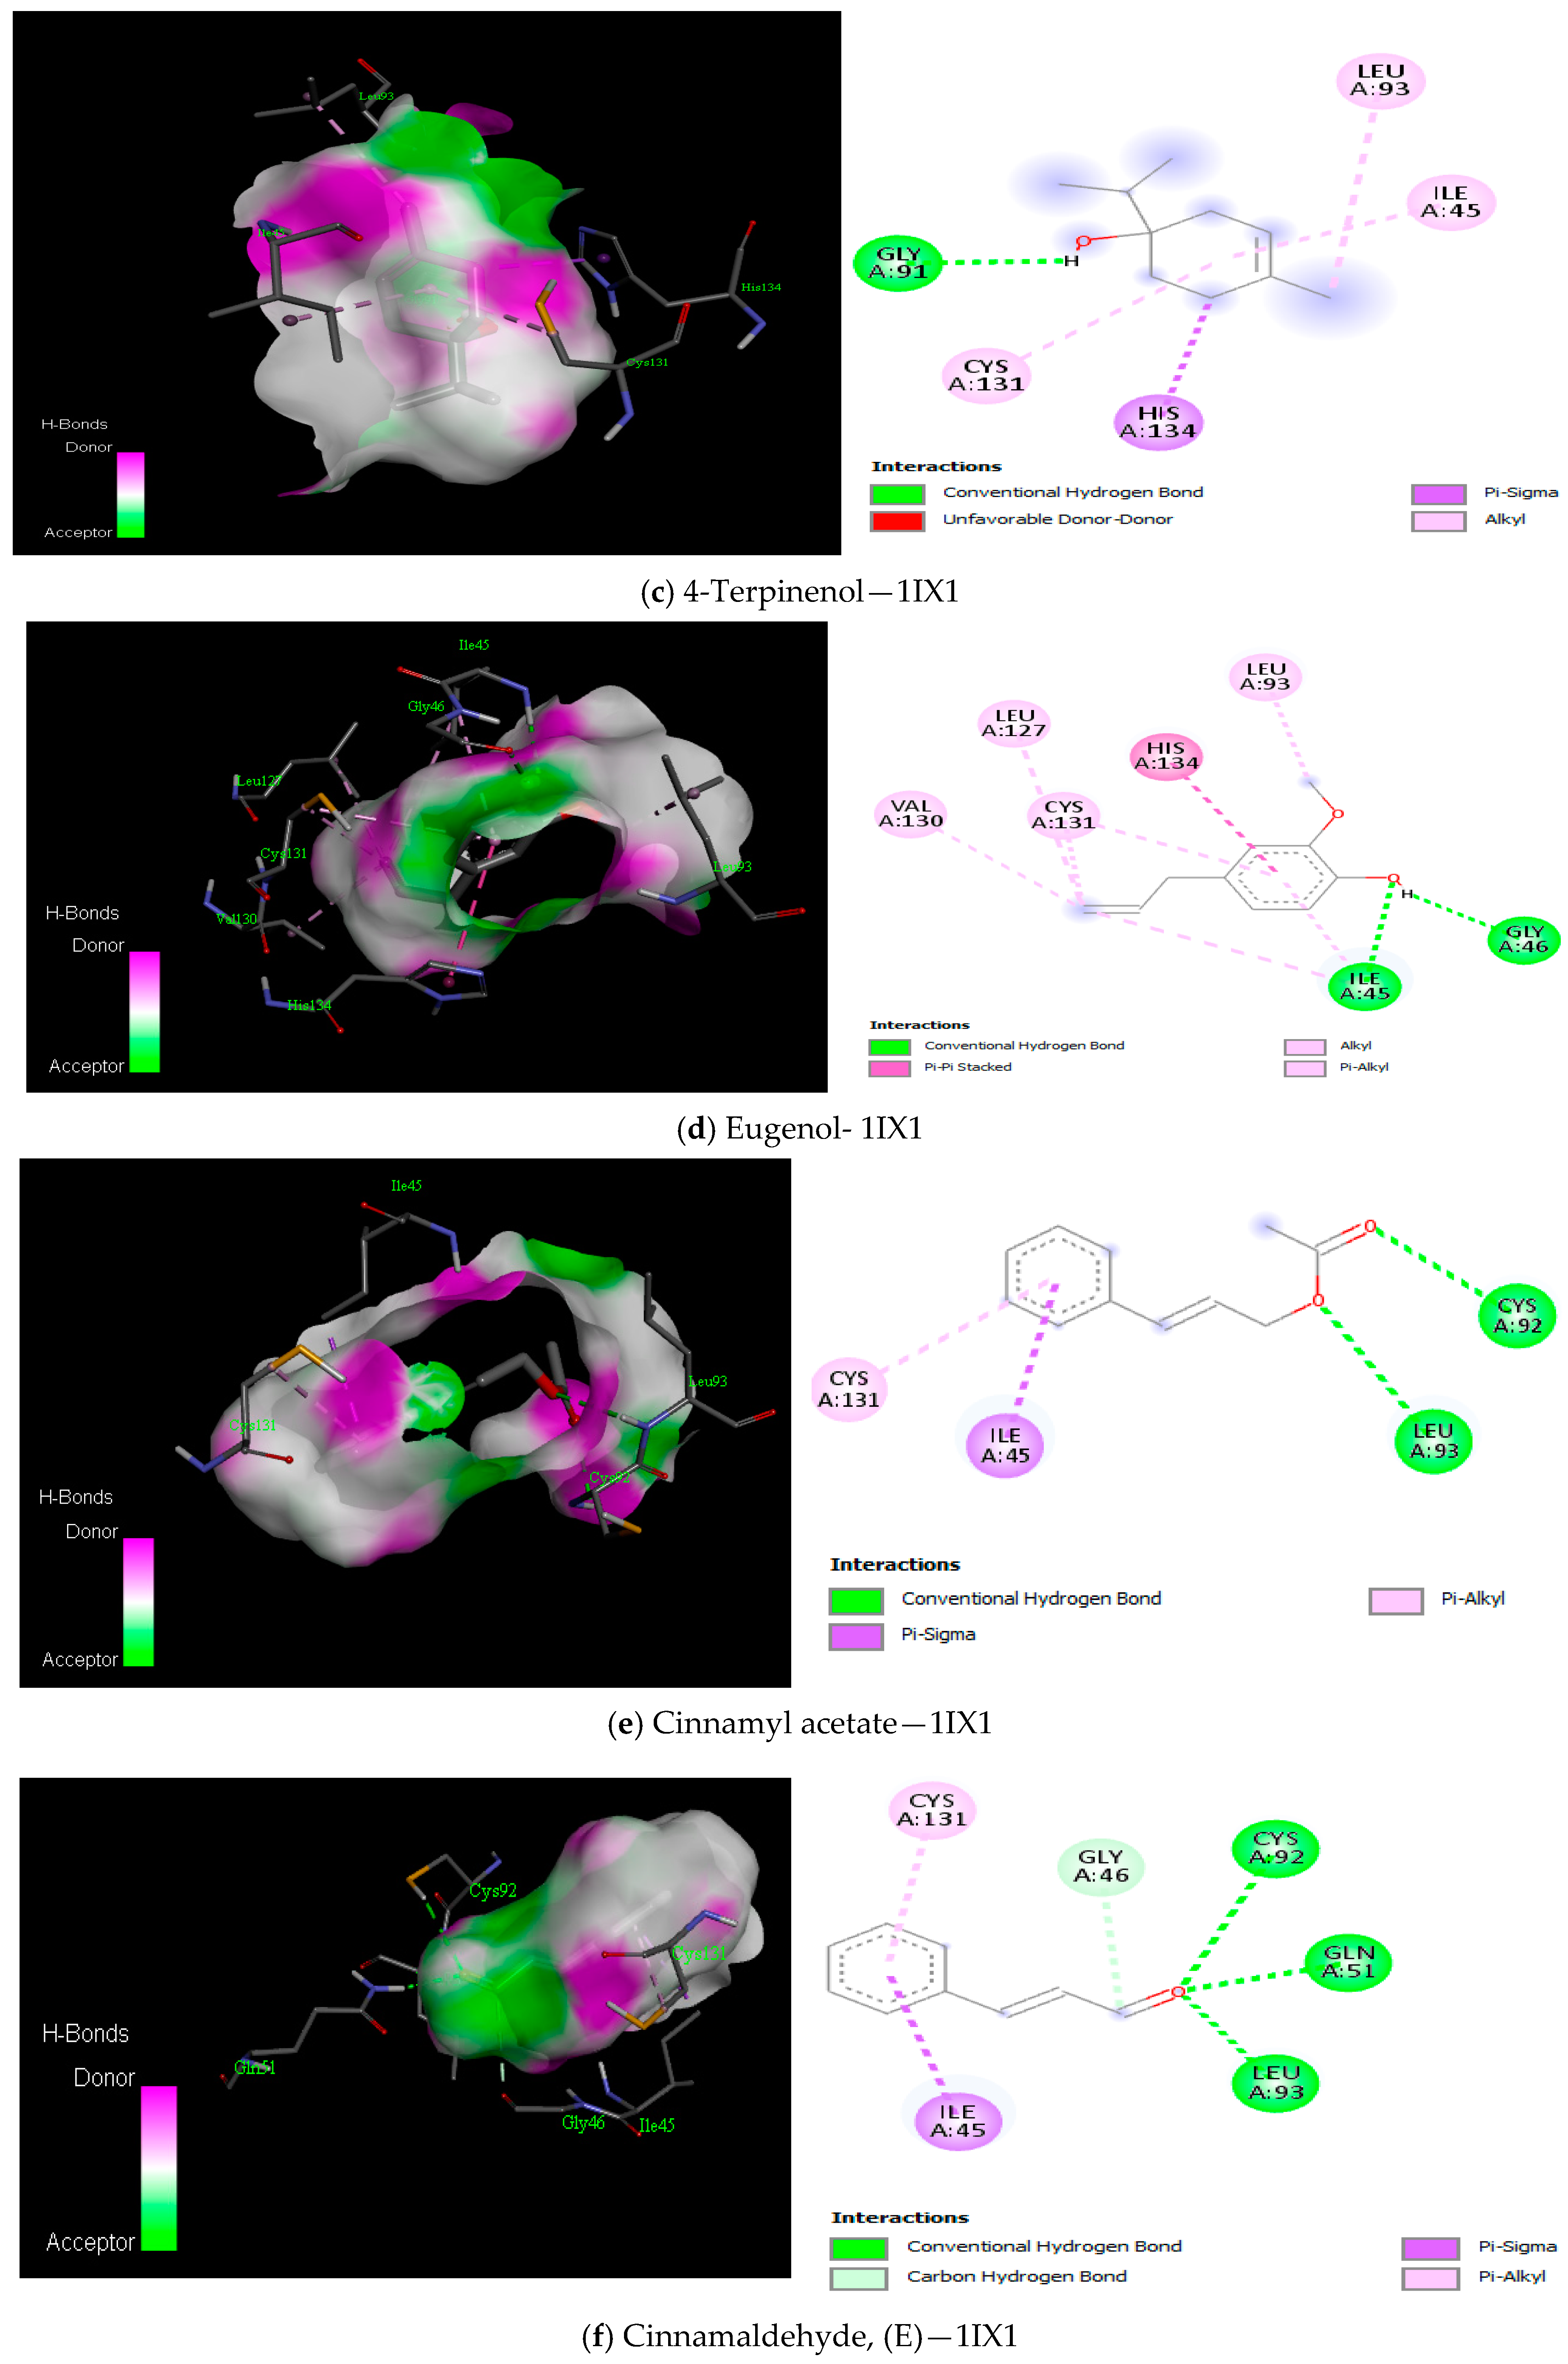
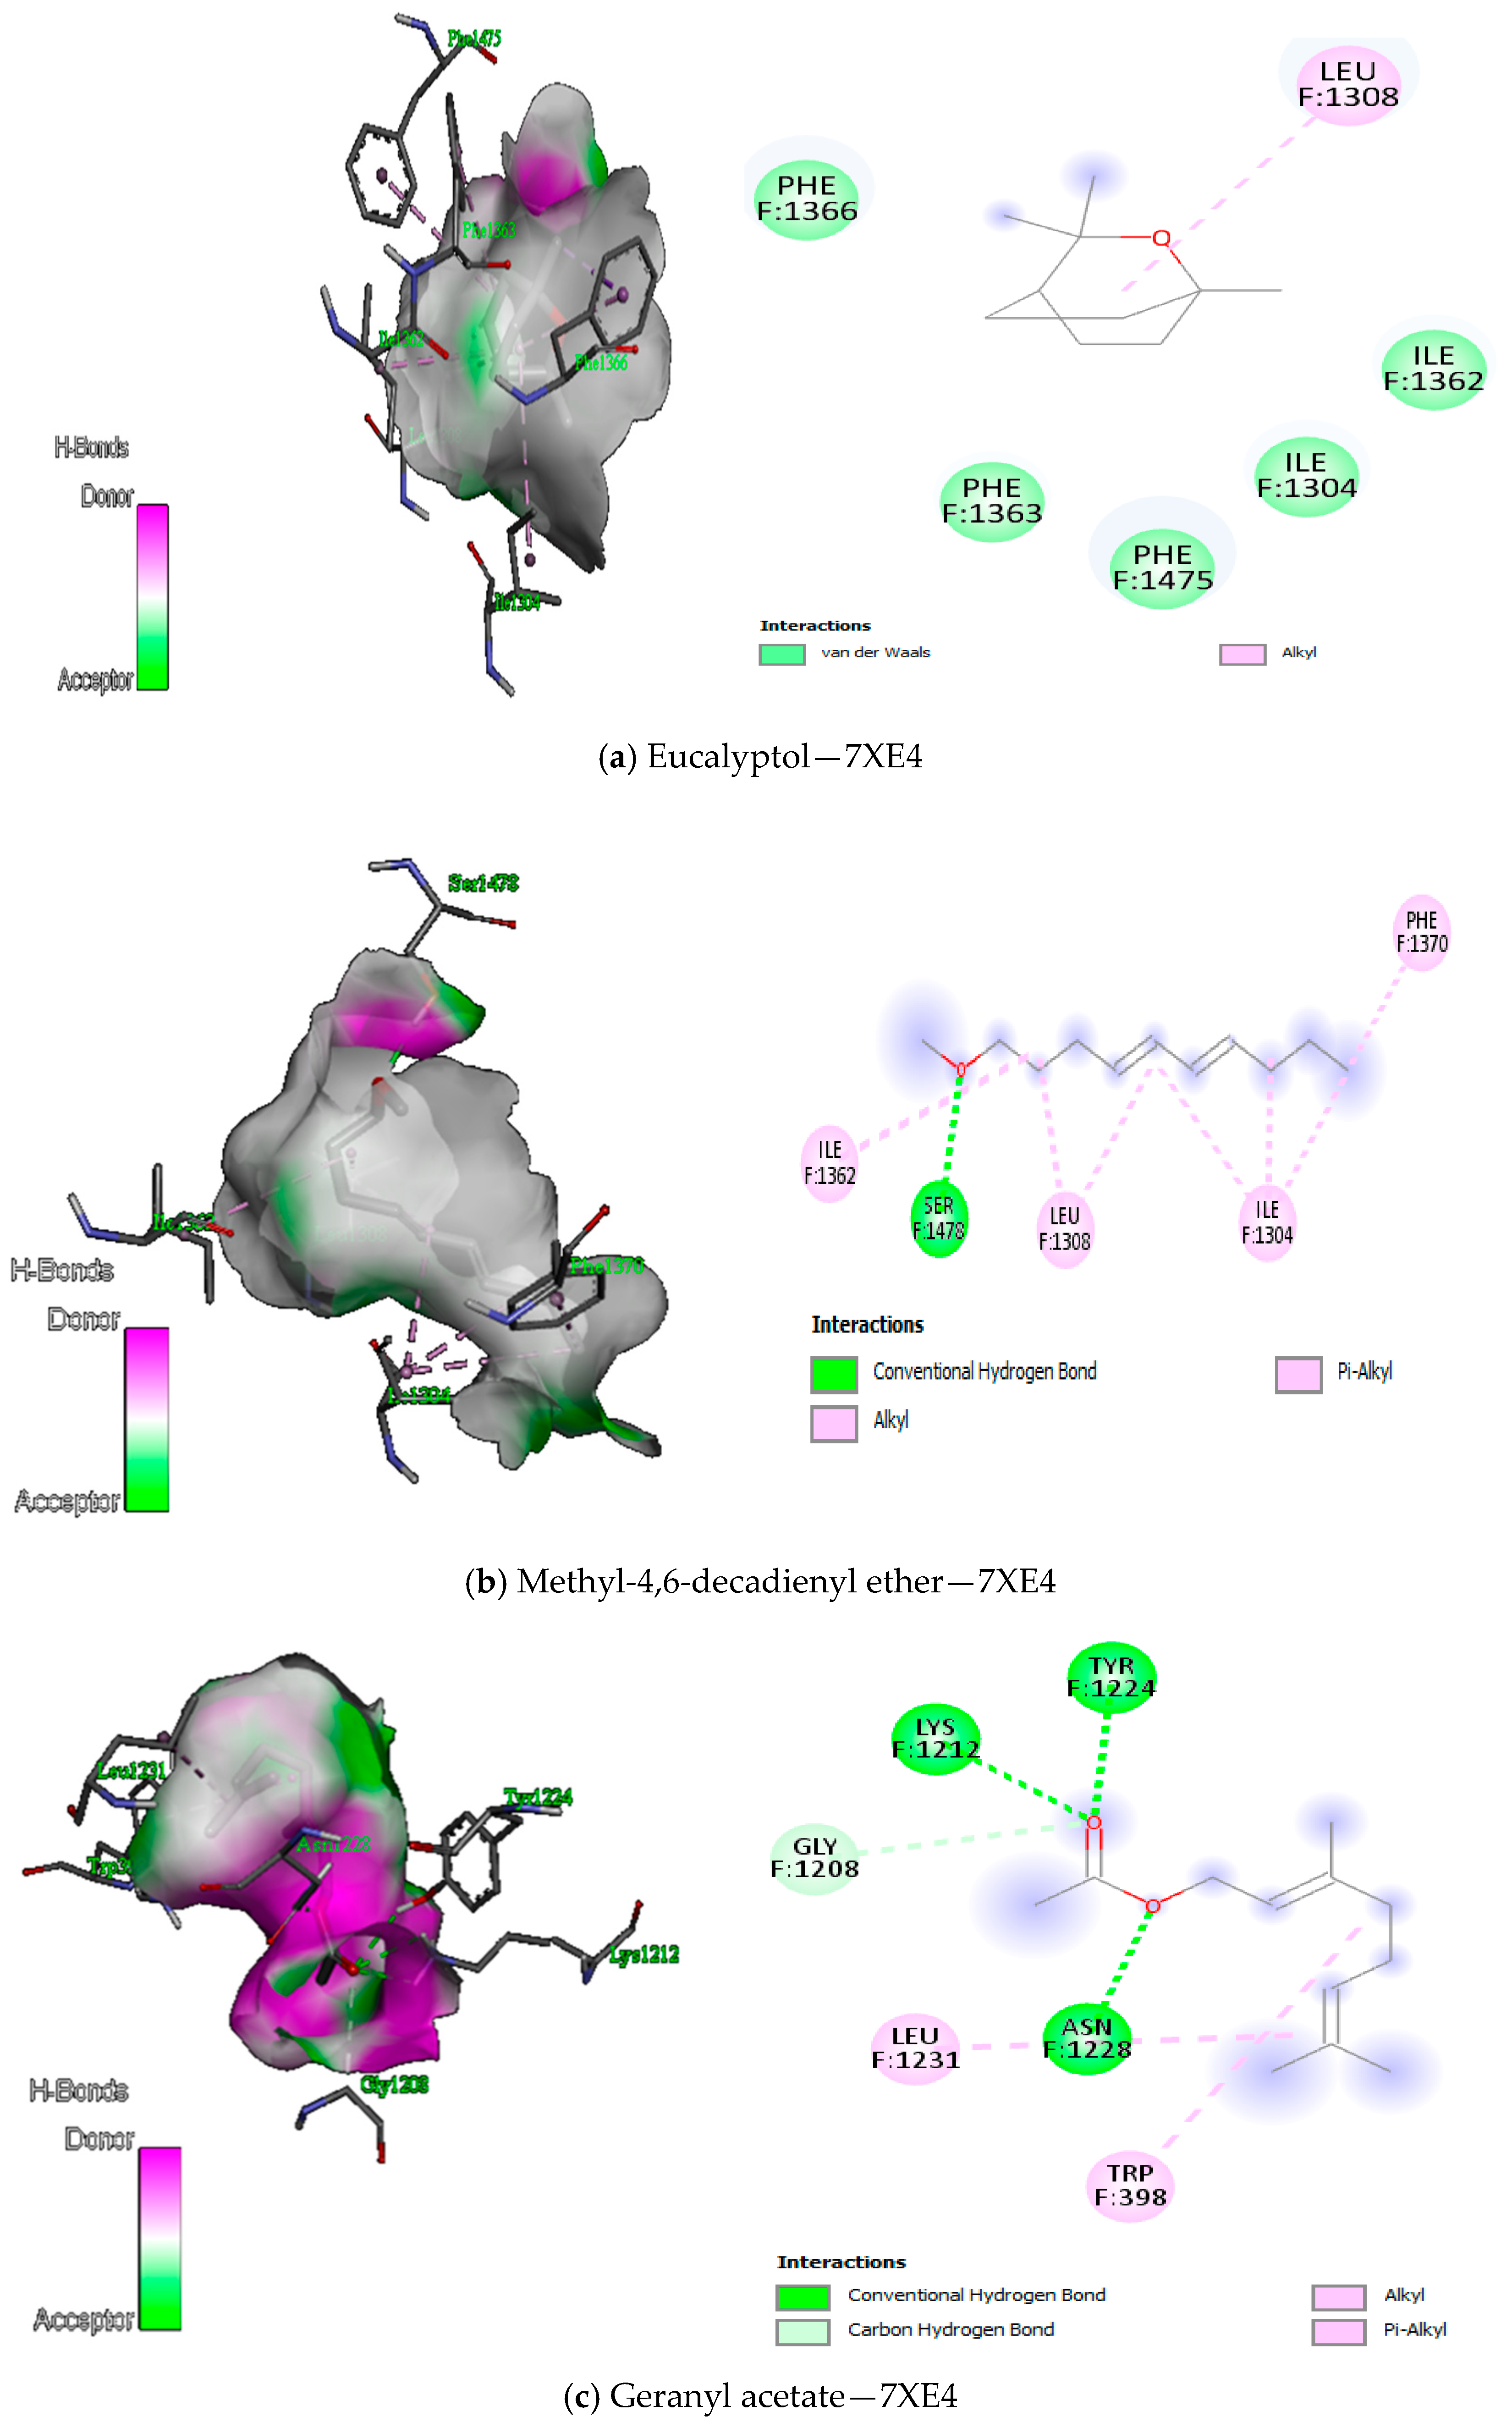
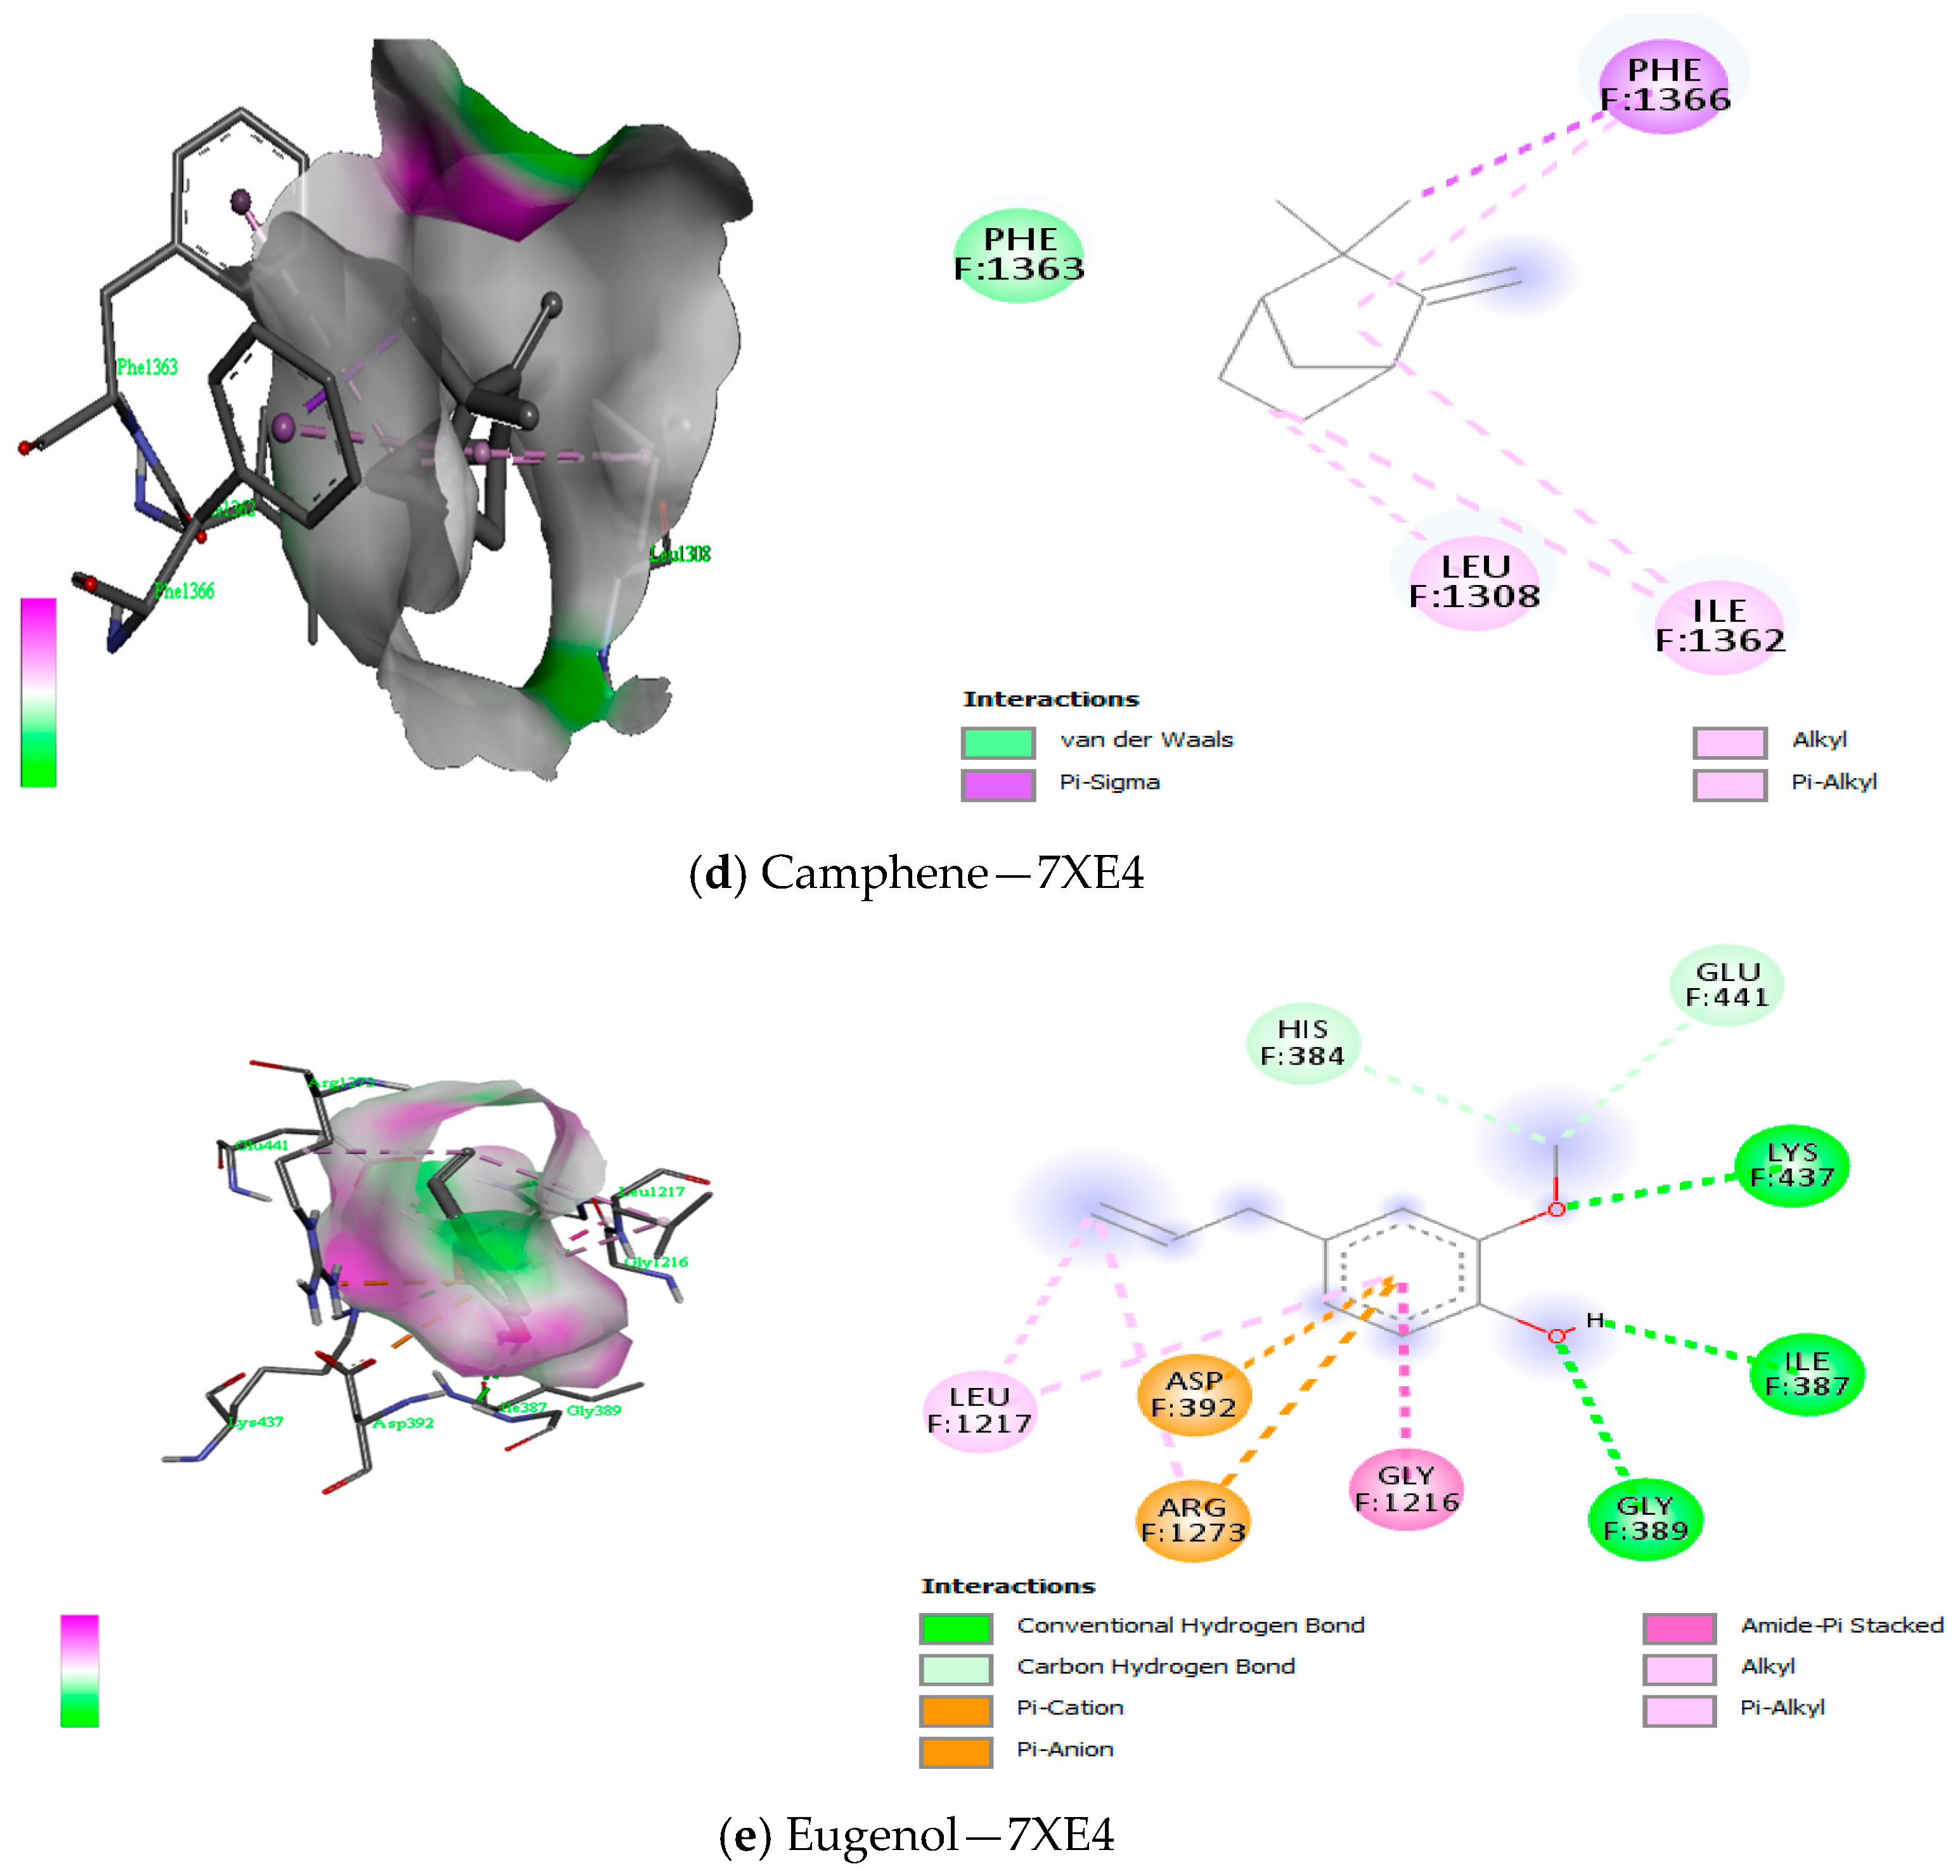
3.6. Molecular Docking Analysis
4. Discussion
4.1. Chemical Composition
4.2. Antioxidant Profile
4.3. Oxidative Stability
4.3.1. Peroxide Value
4.3.2. p-Anisidine Value (p-AV)
4.3.3. Total Oxidation Value (TOTOX)
4.3.4. Assessing the Lipid Oxidation Degree of Oil Samples by Thiobarbituric Acid (TBA) Test
4.4. Anti-Inflammatory Activity
4.5. Antimicrobial Activity
4.6. Molecular Docking
5. Conclusions
Supplementary Materials
Author Contributions
Funding
Institutional Review Board Statement
Informed Consent Statement
Data Availability Statement
Acknowledgments
Conflicts of Interest
References
- Verhoff, M.; Seitz, S.; Paul, M.; Noha, S.M.; Jauch, J.; Schuster, D.; Werz, O. Tetra- and Pentacyclic Triterpene Acids from the Ancient Anti-Inflammatory Remedy Frankincense as Inhibitors of Microsomal Prostaglandin E 2 Synthase-1. J. Nat. Prod. 2014, 77, 1445–1451. [Google Scholar] [CrossRef]
- Iram, F.; Khan, S.A.; Husain, A. Phytochemistry and Potential Therapeutic Actions of Boswellic Acids: A Mini-Review. Asian Pac. J. Trop. Biomed. 2017, 7, 513–523. [Google Scholar] [CrossRef]
- Rashan, L.; White, A.; Haulet, M.; Favelin, N.; Das, P.; Cock, I.E. Chemical Composition, Antibacterial Activity, and Antibiotic Potentiation of Boswellia Sacra Flueck. Oleoresin Extracts from the Dhofar Region of Oman. Evid.-Based Complement. Altern. Med. 2021, 2021, 9918935. [Google Scholar] [CrossRef]
- Mahdian, D.; Abbaszadeh-Goudarzi, K.; Raoofi, A.; Dadashizadeh, G.; Abroudi, M.; Zarepour, E.; Hosseinzadeh, H. Effect of Boswellia Species on the Metabolic Syndrome: A Review. Iran. J. Basic Med. Sci. 2020, 23, 1374. [Google Scholar] [CrossRef]
- Di Stefano, V.; Schillaci, D.; Cusimano, M.G.; Rishan, M.; Rashan, L. In Vitro Antimicrobial Activity of Frankincense Oils from Boswellia Sacra Grown in Different Locations of the Dhofar Region (Oman). Antibiotics 2020, 9, 195. [Google Scholar] [CrossRef]
- Skupińska, M.; Belter, A.; Giel-Pietraszuk, M.; Rychlewski, L.; Barciszewski, J. aaRS--the etiological factor and the attractive target of many disorders. Postep. Biochem. 2009, 55, 373–384. [Google Scholar]
- De Ruysscher, D.; Pang, L.; Mattelaer, C.-A.; Nautiyal, M.; De Graef, S.; Rozenski, J.; Strelkov, S.V.; Lescrinier, E.; Weeks, S.D.; Van Aerschot, A. Phenyltriazole-Functionalized Sulfamate Inhibitors Targeting Tyrosyl- or Isoleucyl-tRNA Synthetase. Bioorganic Med. Chem. 2020, 28, 115580. [Google Scholar] [CrossRef]
- Sun, J.; Lv, P.-C.; Zhu, H.-L. Tyrosyl-tRNA Synthetase Inhibitors: A Patent Review. Expert Opin. Ther. Pat. 2017, 27, 557–564. [Google Scholar] [CrossRef] [PubMed]
- Alminderej, F.; Bakari, S.; Almundarij, T.I.; Snoussi, M.; Aouadi, K.; Kadri, A. Antimicrobial and Wound Healing Potential of a New Chemotype from Piper Cubeba L. Essential Oil and In Silico Study on S. Aureus Tyrosyl-tRNA Synthetase Protein. Plants 2021, 10, 205. [Google Scholar] [CrossRef]
- Wolfson, J.S.; Hooper, D.C. The Fluoroquinolones: Structures, Mechanisms of Action and Resistance, and Spectra of Activity in Vitro. Antimicrob. Agents Chemother. 1985, 28, 581–586. [Google Scholar] [CrossRef]
- Spencer, A.C.; Panda, S.S. DNA Gyrase as a Target for Quinolones. Biomedicines 2023, 11, 371. [Google Scholar] [CrossRef] [PubMed]
- Cynamon, M.H.; Alvirez-Freites, E.; Yeo, A.E.T. BB-3497, a Peptide Deformylase Inhibitor, Is Active against Mycobacterium Tuberculosis. J. Antimicrob. Chemother. 2004, 53, 403–405. [Google Scholar] [CrossRef] [PubMed]
- Serero, A.; Giglione, C.; Sardini, A.; Martinez-Sanz, J.; Meinnel, T. An Unusual Peptide Deformylase Features in the Human Mitochondrial N-Terminal Methionine Excision Pathway. J. Biol. Chem. 2003, 278, 52953–52963. [Google Scholar] [CrossRef] [PubMed]
- Clements, J.M.; Beckett, R.P.; Brown, A.; Catlin, G.; Lobell, M.; Palan, S.; Thomas, W.; Whittaker, M.; Wood, S.; Salama, S.; et al. Antibiotic Activity and Characterization of BB-3497, a Novel Peptide Deformylase Inhibitor. Antimicrob. Agents Chemother. 2001, 45, 563–570. [Google Scholar] [CrossRef] [PubMed]
- Gow, N.A.R.; Latge, J.-P.; Munro, C.A. The Fungal Cell Wall: Structure, Biosynthesis, and Function. Microbiol. Spectr. 2017, 5, 10–1128. [Google Scholar] [CrossRef] [PubMed]
- Perlin, D.S. Cell Wall-Modifying Antifungal Drugs. In The Fungal Cell Wall; Latgé, J.-P., Ed.; Current Topics in Microbiology and Immunology; Springer International Publishing: Cham, Switzerland, 2019; Volume 425, pp. 255–275. ISBN 978-3-030-49927-3. [Google Scholar]
- Sadhasivam, S.; Palanivel, S.; Ghosh, S. Synergistic Antimicrobial Activity of Boswellia Serrata Roxb. Ex Colebr. (Burseraceae) Essential Oil with Various Azoles against Pathogens Associated with Skin, Scalp and Nail Infections. Lett. Appl. Microbiol. 2016, 63, 495–501. [Google Scholar] [CrossRef]
- Al-Kharousi, Z.S.; Mothershaw, A.S.; Nzeako, B. Antimicrobial Activity of Frankincense (Boswellia Sacra) Oil and Smoke against Pathogenic and Airborne Microbes. Foods 2023, 12, 3442. [Google Scholar] [CrossRef]
- Lucero, M.; Estell, R.; Tellez, M.; Fredrickson, E. A Retention Index Calculator Simplifies Identification of Plant Volatile Organic Compounds: A Retention Index Calculator. Phytochem. Anal. 2009, 20, 378–384. [Google Scholar] [CrossRef]
- Ciulca, S.; Roma, G.; Alexa, E.; Radulov, I.; Cocan, I.; Madosa, E.; Ciulca, A. Variation of Polyphenol Content and Antioxidant Activity in Some Bilberry (Vaccinium Myrtillus L.) Populations from Romania. Agronomy 2021, 11, 2557. [Google Scholar] [CrossRef]
- Symoniuk, E.; Ksibi, N.; Wroniak, M.; Lefek, M.; Ratusz, K. Oxidative Stability Analysis of Selected Oils from Unconventional Raw Materials Using Rancimat Apparatus. Appl. Sci. 2022, 12, 10355. [Google Scholar] [CrossRef]
- AOCS. AOCS Official Method Cd 18-90: P-Anisidine Value. Official Methods and Recommended Practices of the American Oil Chemists’ Society 1996; American Oil Chemists Society Press: Champaign, IL, USA, 2011. [Google Scholar]
- Cocan, I.; Negrea, M.; Cozma, A.; Alexa, E.; Poiana, M.-A.; Raba, D.; Danciu, C.; Popescu, I.; Cadariu, A.I.; Obistioiu, D.; et al. Chili and Sweet Pepper Seed Oil Used as a Natural Antioxidant to Improve the Thermo-Oxidative Stability of Sunflower Oil. Agronomy 2021, 11, 2579. [Google Scholar] [CrossRef]
- Gunathilake, K.; Ranaweera, K.; Rupasinghe, H. In Vitro Anti-Inflammatory Properties of Selected Green Leafy Vegetables. Biomedicines 2018, 6, 107. [Google Scholar] [CrossRef] [PubMed]
- Okoli, C.O.; Akah, P.A.; Onuoha, N.J.; Okoye, T.C.; Nwoye, A.C.; Nworu, C.S. Acanthus Montanus: An Experimental Evaluation of the Antimicrobial, Anti-Inflammatory and Immunological Properties of a Traditional Remedy for Furuncles. BMC Complement. Altern. Med. 2008, 8, 27. [Google Scholar] [CrossRef] [PubMed]
- Hulea, A.; Obiștioiu, D.; Cocan, I.; Alexa, E.; Negrea, M.; Neacșu, A.-G.; Hulea, C.; Pascu, C.; Costinar, L.; Iancu, I.; et al. Diversity of Monofloral Honey Based on the Antimicrobial and Antioxidant Potential. Antibiotics 2022, 11, 595. [Google Scholar] [CrossRef] [PubMed]
- Pătruică, S.; Alexa, E.; Obiștioiu, D.; Cocan, I.; Radulov, I.; Berbecea, A.; Lazăr, R.N.; Simiz, E.; Vicar, N.M.; Hulea, A.; et al. Chemical Composition, Antioxidant and Antimicrobial Activity of Some Types of Honey from Banat Region, Romania. Molecules 2022, 27, 4179. [Google Scholar] [CrossRef]
- Obistioiu, D.; Cocan, I.; Tîrziu, E.; Herman, V.; Negrea, M.; Cucerzan, A.; Neacsu, A.-G.; Cozma, A.L.; Nichita, I.; Hulea, A.; et al. Phytochemical Profile and Microbiological Activity of Some Plants Belonging to the Fabaceae Family. Antibiotics 2021, 10, 662. [Google Scholar] [CrossRef]
- RCSB Protein Data Bank. Available online: https://www.rcsb.org/ (accessed on 20 May 2023).
- The National Center for Biotechnology Information. Available online: https://pubchem.ncbi.nlm.nih.gov/ (accessed on 20 May 2023).
- UCSF Chimera. Version 1.17.3. Available online: https://www.cgl.ucsf.edu/chimera/download.html (accessed on 20 May 2023).
- Dassault Systemes BIOVIA. Discovery Studio Visualizer; v21.1.0.20298; Dassault Systemes: San Diego, CA, USA, 2020. [Google Scholar]
- NIST Chemistry WebBook. Available online: https://webbook.nist.gov/chemistry/ (accessed on 29 May 2023).
- dōTERRA International. Available online: https://www.doterra.com/US/en (accessed on 15 July 2023).
- Poiana, M.-A. Enhancing Oxidative Stability of Sunflower Oil during Convective and Microwave Heating Using Grape Seed Extract. Int. J. Mol. Sci. 2012, 13, 9240–9259. [Google Scholar] [CrossRef]
- Abeyrathne, E.D.N.S.; Nam, K.; Ahn, D.U. Analytical Methods for Lipid Oxidation and Antioxidant Capacity in Food Systems. Antioxidants 2021, 10, 1587. [Google Scholar] [CrossRef]
- Al-Saidi, S.; Rameshkumar, K.B.; Hisham, A.; Sivakumar, N.; Al-Kindy, S. Composition and Antibacterial Activity of the Essential Oils of Four Commercial Grades of Omani Luban, the Oleo-Gum Resin of Boswellia sacraFlueck. Chem. Biodivers. 2012, 9, 615–624. [Google Scholar] [CrossRef]
- Niebler, J.; Buettner, A. Identification of Odorants in Frankincense (Boswellia Sacra Flueck.) by Aroma Extract Dilution Analysis and Two-Dimensional Gas Chromatography–Mass Spectrometry/Olfactometry. Phytochemistry 2015, 109, 66–75. [Google Scholar] [CrossRef]
- Van Vuuren, S.F.; Kamatou, G.P.P.; Viljoen, A.M. Volatile Composition and Antimicrobial Activity of Twenty Commercial Frankincense Essential Oil Samples. S. Afr. J. Bot. 2010, 76, 686–691. [Google Scholar] [CrossRef]
- Al-Harrasi, A.; Al-Saidi, S. Phytochemical Analysis of the Essential Oil from Botanically Certified Oleogum Resin of Boswellia Sacra (Omani Luban). Molecules 2008, 13, 2181–2189. [Google Scholar] [CrossRef] [PubMed]
- Camarda, L.; Dayton, T.; Di Stefano, V.; Pitonzo, R.; Schillaci, D. Chemical Composition and Antimicrobial Activity of Some Oleogum Resin Essential Oils from Boswellia SPP. (Burseraceae). Ann. Chim. 2007, 97, 837–844. [Google Scholar] [CrossRef]
- Al-Harrasi, A.; Rehman, N.U.; Khan, A.L.; Al-Broumi, M.; Al-Amri, I.; Hussain, J.; Hussain, H.; Csuk, R. Chemical, Molecular and Structural Studies of Boswellia Species: β-Boswellic Aldehyde and 3-Epi-11β-Dihydroxy BA as Precursors in Biosynthesis of Boswellic Acids. PLoS ONE 2018, 13, e0198666. [Google Scholar] [CrossRef]
- Almutairi, M.B.F.; Alrouji, M.; Almuhanna, Y.; Asad, M.; Joseph, B. In-Vitro and In-Vivo Antibacterial Effects of Frankincense Oil and Its Interaction with Some Antibiotics against Multidrug-Resistant Pathogens. Antibiotics 2022, 11, 1591. [Google Scholar] [CrossRef]
- Gupta, M.; Rout, P.K.; Misra, L.N.; Gupta, P.; Singh, N.; Darokar, M.P.; Saikia, D.; Singh, S.C.; Bhakuni, R.S. Chemical Composition and Bioactivity of Boswellia Serrata Roxb. Essential Oil in Relation to Geographical Variation. Plant Biosyst.—Int. J. Deal. Asp. Plant Biol. 2017, 151, 623–629. [Google Scholar] [CrossRef]
- Maděra, P.; Paschová, Z.; Ansorgová, A.; Vrškový, B.; Lvončík, S.; Habrová, H. Volatile Compounds in Oleo-Gum Resin of Socotran Species of Burseraceae. Acta Univ. Agric. Silvic. Mendel. Brun. 2017, 65, 73–90. [Google Scholar] [CrossRef]
- Ljaljević Grbić, M.; Unković, N.; Dimkić, I.; Janaćković, P.; Gavrilović, M.; Stanojević, O.; Stupar, M.; Vujisić, L.; Jelikić, A.; Stanković, S.; et al. Frankincense and Myrrh Essential Oils and Burn Incense Fume against Micro-Inhabitants of Sacral Ambients. Wisdom of the Ancients? J. Ethnopharmacol. 2018, 219, 1–14. [Google Scholar] [CrossRef]
- Ayub, M.A.; Hanif, M.A.; Sarfraz, R.A.; Shahid, M. Biological Activity of Boswellia Serrata Roxb. Oleo Gum Resin Essential Oil: Effects of Extraction by Supercritical Carbon Dioxide and Traditional Methods. Int. J. Food Prop. 2018, 21, 808–820. [Google Scholar] [CrossRef]
- Mothana, R.A.A.; Hasson, S.S.; Schultze, W.; Mowitz, A.; Lindequist, U. Phytochemical Composition and in Vitro Antimicrobial and Antioxidant Activities of Essential Oils of Three Endemic Soqotraen Boswellia Species. Food Chem. 2011, 126, 1149–1154. [Google Scholar] [CrossRef]
- Ali, N.A.A.; Wurster, M.; Arnold, N.; Teichert, A.; Schmidt, J.; Lindequist, U.; Wessjohann, L.A. Chemical Composition and Biological Activities of Essential Oils from the Oleogum Resins of Three Endemic Soqotraen Boswellia Species. Rec. Nat. Prod. 2008, 2, 6–12. [Google Scholar]
- Kohoude, M.J.; Gbaguidi, F.; Agbani, P.; Ayedoun, M.-A.; Cazaux, S.; Bouajila, J. Chemical Composition and Biological Activities of Extracts and Essential Oil of Boswellia Dalzielii Leaves. Pharm. Biol. 2017, 55, 33–42. [Google Scholar] [CrossRef] [PubMed]
- Jianu, C.; Stoin, D.; Cocan, I.; David, I.; Pop, G.; Lukinich-Gruia, A.T.; Mioc, M.; Mioc, A.; Șoica, C.; Muntean, D.; et al. In Silico and In Vitro Evaluation of the Antimicrobial and Antioxidant Potential of Mentha × Smithiana R. GRAHAM Essential Oil from Western Romania. Foods 2021, 10, 815. [Google Scholar] [CrossRef] [PubMed]
- Tena, N.; Lobo-Prieto, A.; Aparicio, R.; García-González, D.L. Storage and Preservation of Fats and Oils. In Encyclopedia of Food Security and Sustainability; Elsevier: Amsterdam, The Netherlands, 2019; pp. 605–618. [Google Scholar] [CrossRef]
- Alsufiani, H.; Ashour, W. Effectiveness of the Natural Antioxidant 2,4,4′-Trihydroxychalcone on the Oxidation of Sunflower Oil during Storage. Molecules 2021, 26, 1630. [Google Scholar] [CrossRef]
- Wang, D.; Meng, Y.; Zhao, X.; Fan, W.; Yi, T.; Wang, X. Sunflower Oil Flavored by Essential Oil from Punica Granatum Cv. Heyinshiliu Peels Improved Its Oxidative Stability and Sensory Properties. LWT 2019, 111, 55–61. [Google Scholar] [CrossRef]
- Metzner Ungureanu, C.-R.; Poiana, M.-A.; Cocan, I.; Lupitu, A.I.; Alexa, E.; Moigradean, D. Strategies to Improve the Thermo-Oxidative Stability of Sunflower Oil by Exploiting the Antioxidant Potential of Blueberries Processing Byproducts. Molecules 2020, 25, 5688. [Google Scholar] [CrossRef]
- Hashemi, M.B.; Niakousari, M.; Saharkhiz, M.J.; Eskandari, M.H. Stabilization of Sunflower Oil with Carum Copticum Benth & Hook Essential Oil. J. Food Sci. Technol. 2014, 51, 142–147. [Google Scholar] [CrossRef]
- Okhli, S.; Mirzaei, H.; Hosseini, S.E. Antioxidant Activity of Citron Peel (Citrus Medica L.) Essential Oil and Extract on Stabilization of Sunflower Oil. OCL 2020, 27, 32. [Google Scholar] [CrossRef]
- Al-Dalain, S.Y.; Al-Fraihat, A.H.; Al Kassabeh, E.T. Effect of Aromatic Plant Essential Oils on Oxidative Stability of Sunflower Oil During Heating and Storage. Pak. J. Nutr. 2011, 10, 864–870. [Google Scholar] [CrossRef]
- Siddiqui, M.Z. Boswellia Serrata, a Potential Antiinflammatory Agent: An Overview. Indian J. Pharm. Sci. 2011, 73, 255–261. [Google Scholar] [CrossRef]
- Cuaz-Pérolin, C.; Billiet, L.; Baugé, E.; Copin, C.; Scott-Algara, D.; Genze, F.; Büchele, B.; Syrovets, T.; Simmet, T.; Rouis, M. Antiinflammatory and Antiatherogenic Effects of the NF-κB Inhibitor Acetyl-11-Keto-β-Boswellic Acid in LPS-Challenged ApoE−/− Mice. ATVB 2008, 28, 272–277. [Google Scholar] [CrossRef] [PubMed]
- Henkel, A.; Kather, N.; Mönch, B.; Northoff, H.; Jauch, J.; Werz, O. Boswellic Acids from Frankincense Inhibit Lipopolysaccharide Functionality through Direct Molecular Interference. Biochem. Pharmacol. 2012, 83, 115–121. [Google Scholar] [CrossRef] [PubMed]
- Bertocchi, M.; Isani, G.; Medici, F.; Andreani, G.; Tubon Usca, I.; Roncada, P.; Forni, M.; Bernardini, C. Anti-Inflammatory Activity of Boswellia Serrata Extracts: An In Vitro Study on Porcine Aortic Endothelial Cells. Oxidative Med. Cell. Longev. 2018, 2018, 2504305. [Google Scholar] [CrossRef] [PubMed]
- Syrovets, T.; Büchele, B.; Krauss, C.; Laumonnier, Y.; Simmet, T. Acetyl-Boswellic Acids Inhibit Lipopolysaccharide-Mediated TNF-α Induction in Monocytes by Direct Interaction with IκB Kinases. J. Immunol. 2005, 174, 498–506. [Google Scholar] [CrossRef]
- Roy, S.; Khanna, S.; Krishnaraju, A.V.; Subbaraju, G.V.; Yasmin, T.; Bagchi, D.; Sen, C.K. Regulation of Vascular Responses to Inflammation: Inducible Matrix Metalloproteinase-3 Expression in Human Microvascular Endothelial Cells Is Sensitive to Antiinflammatory Boswellia. Antioxid. Redox Signal. 2006, 8, 653–660. [Google Scholar] [CrossRef]
- Gokulan, A.; Narayanan, J.; Chitra, V.; Tamilanban, T. Evaluation of Wound Healing And AntiInflammatory Effect Of Topical Formulations Of Boswellia Serrata Using Adult Zebra Fish And Macrophage Raw 264.7 Cells. J. Pharm. Negat. Results 2022, 13, 1822–1831. [Google Scholar] [CrossRef]
- Geetha, V.; Chakravarthula, S.N. Chemical Composition and Anti-Inflammatory Activity of Boswellia Ovalifoliolata Essential Oils from Leaf and Bark. J. For. Res. 2018, 29, 373–381. [Google Scholar] [CrossRef]
- Bstia, S.; Mishra, G.; Patra, S. Anti-Arthritic Activity of Glycyrrhiza Glabra, Boswellia Serrata and Their Synergistic Activity in Combined Formulation Studied in Freund’s Adjuvant Induced Arthritic Rats. J. Pharm. Educ. Res. 2011, 2, 92. [Google Scholar]
- Perera, P.; Perera, M.; Kumarasinghe, N. Effect of Sri Lankan Traditional Medicine and Ayurveda on Sandhigata Vata (Osteoarthritis of Knee Joint). AYU 2014, 35, 411. [Google Scholar] [CrossRef]
- Sengupta, K.; Krishnaraju, A.V.; Vishal, A.A.; Mishra, A.; Trimurtulu, G.; Sarma, K.V.; Raychaudhuri, S.K.; Raychaudhuri, S.P. Comparative Efficacy and Tolerability of 5-Loxin® and Aflapin® Against Osteoarthritis of the Knee: A Double Blind, Randomized, Placebo Controlled Clinical Study. Int. J. Med. Sci. 2010, 7, 366. [Google Scholar] [CrossRef]
- Yu, G.; Xiang, W.; Zhang, T.; Zeng, L.; Yang, K.; Li, J. Effectiveness of Boswellia and Boswellia Extract for Osteoarthritis Patients: A Systematic Review and Meta-Analysis. BMC Complement. Med. 2020, 20, 225. [Google Scholar] [CrossRef]
- Syahruddin, A.N.; Dahlan, C.K.; Taslim, N.A. The Effects of Kaempferia Galanga L Extract on Pain, Stiffness and Functional Physic in Patient with Knee Osteoarthritis: Double Blind Randomized Clinical Trial. Int. J. Sci. Healthc. Res. 2017, 2, 37–43. [Google Scholar]
- Henrotin, Y.; Dierckxsens, Y.; Delisse, G.; Maes, N.; Albert, A. Curcuma Longa and Boswellia Serrata Extract Combination for Hand Osteoarthritis: An Open-Label Pre-Post Trial. Pharm. Biol. 2022, 60, 2295–2299. [Google Scholar] [CrossRef] [PubMed]
- Al-Harrasi, A.; Al-Rawahi, A.; Hussain, J.; Ali, L.; Hussain, H.; Rehman, N.U.; Abbas, G.; Mehjabeen; Al-Harrasi, R. First in Vitro Lipid Peroxidation and in Vivo Anti-Inflammatory Activity of the Omani Frankincense of Boswellia sacra flueck. Int. J. Phytomed. 2013, 5, 73–77. [Google Scholar]
- Abdelsamad, A.; Ahmed, K.; Al-Magboul, A.; Fadul, E. Antimicrobial Activity of Essential Oils and Extracts of Oleo-Gum Resins from Boswellia Papyrifera (Tarak Tarak) Grown in Some Parts of the Sudan. Arab. J. Med. Aromat. Plants 2020, 6, 22–35. [Google Scholar] [CrossRef]
- Attallah, N.G.M.; Negm, W.A.; Elekhnawy, E.; Altwaijry, N.; Elmongy, E.I.; El-Masry, T.A.; Alturki, E.A.; Yousef, D.A.; Shoukheba, M.Y. Antibacterial Activity of Boswellia Sacra Flueck. Oleoresin Extract against Porphyromonas Gingivalis Periodontal Pathogen. Antibiotics 2021, 10, 859. [Google Scholar] [CrossRef] [PubMed]
- Abers, M.; Schroeder, S.; Goelz, L.; Sulser, A.; St. Rose, T.; Puchalski, K.; Langland, J. Antimicrobial Activity of the Volatile Substances from Essential Oils. BMC Complement. Med. 2021, 21, 124. [Google Scholar] [CrossRef] [PubMed]
- Raja, A.F.; Ali, F.; Khan, I.A.; Shawl, A.S.; Arora, D.S.; Shah, B.A.; Taneja, S.C. Antistaphylococcal and Biofilm Inhibitory Activities of Acetyl-11-Keto-β-Boswellic Acid from Boswellia Serrata. BMC Microbiol. 2011, 11, 54. [Google Scholar] [CrossRef]
- Gupta, M.; Singh, S.; Kurmi, A.; Luqman, S.; Saikia, D.; Thomas, M.; Rout, P.K. Correlation of Boswellic Acids with Antiproliferative, Antioxidant and Antimicrobial Activities of Topographically Collected Boswellia Serrata Oleo-Gum-Resin. Phytomedicine Plus 2022, 2, 100289. [Google Scholar] [CrossRef]
- Prakash, B.; Mishra, P.K.; Kedia, A.; Dubey, N.K. Antifungal, Antiaflatoxin and Antioxidant Potential of Chemically Characterized Boswellia Carterii Birdw Essential Oil and Its in Vivo Practical Applicability in Preservation of Piper Nigrum L. Fruits. LWT—Food Sci. Technol. 2014, 56, 240–247. [Google Scholar] [CrossRef]
- Nazzaro, F.; Fratianni, F.; De Martino, L.; Coppola, R.; De Feo, V. Effect of Essential Oils on Pathogenic Bacteria. Pharmaceuticals 2013, 6, 1451–1474. [Google Scholar] [CrossRef] [PubMed]
- Tariq, S.; Wani, S.; Rasool, W.; Shafi, K.; Bhat, M.A.; Prabhakar, A.; Shalla, A.H.; Rather, M.A. A Comprehensive Review of the Antibacterial, Antifungal and Antiviral Potential of Essential Oils and Their Chemical Constituents against Drug-Resistant Microbial Pathogens. Microb. Pathog. 2019, 134, 103580. [Google Scholar] [CrossRef] [PubMed]
- Genčić, M.S.; Aksić, J.M.; Živković Stošić, M.Z.; Randjelović, P.J.; Stojanović, N.M.; Stojanović-Radić, Z.Z.; Radulović, N.S. Linking the Antimicrobial and Anti-Inflammatory Effects of Immortelle Essential Oil with Its Chemical Composition—The Interplay between the Major and Minor Constituents. Food Chem. Toxicol. 2021, 158, 112666. [Google Scholar] [CrossRef] [PubMed]
- He, F.; Qian, Y.L.; Qian, M.C. Flavor and Chiral Stability of Lemon-Flavored Hard Tea during Storage. Food Chem. 2018, 239, 622–630. [Google Scholar] [CrossRef]


| No. | Chemical Compound | Percentage of Total Compounds (%) a | Type of Compounds | LRI Reported in Literature [33] | LRI Determined Experimental |
|---|---|---|---|---|---|
| 1. | alpha-Pinene | 39.34 ± 0.082 | MH | 1001 | 1021 |
| 2. | Thujene | 3.00 ± 0.018 | MH | 1040 | 1056 |
| 3. | beta-Pinene | 1.89 ± 0.011 | MH | 1071 | 1106 |
| 4. | 3-Carene | 0.67 ± 0.001 | MH | 1138 | 1110 |
| 5. | alpha-Phellandrene | 5.48 ± 0.021 | MH | 1154 | 1156 |
| 6. | beta-Myrcene | 1.74 ± 0.010 | MH | 1149 | 1164 |
| 7. | Limonene | 13.79 ± 0.027 | MH | 1164 | 1196 |
| 8. | Eucalyptol | 1.21 ± 0.048 | MO | 1218 | 1204 |
| 9. | p-Cymene | 4.21 ± 0.023 | MH | 1258 | 1241 |
| 10. | Acetic acid, octyl ester | 3.71 ± 0.019 | - | 1464 | 1465 |
| 11. | τ-Elemene | 0.51 ± 0.003 | SH | 1482 | 1484 |
| 12. | Linalool | 2.47 ± 0.014 | MO | 1533 | 1532 |
| 13. | Linalool acetate | 2.58 ± 0.005 | MO | 1545 | 1550 |
| 14. | Menthyl acetate | 2.03 ± 0.012 | MO | 1539 | 1552 |
| 15. | Isomenthone | 2.86 ± 0.015 | MO | 1555 | 1556 |
| 16. | Bornyl acetate | 0.75 ± 0.011 | MO | 1562 | 1560 |
| 17. | Menthone | 0.73 ± 0.001 | MO | 1568 | 1570 |
| 18. | 4-Terpineol | 0.97 ± 0.002 | MO | 1571 | 1573 |
| 19. | Verbenone | 0.51 ± 0.001 | MO | 1580 | 1581 |
| 21. | Caryophyllene | 2.03 ± 0.001 | SH | 1581 | 1598 |
| 22. | β-Elemene | 0.50 ± 0.001 | SH | 1582 | 1599 |
| 23. | Caryophyllene oxide | 2.26 ± 0.013 | SO | 1954 | 1960 |
| 24. | Eugenol | 0.98 ± 0.004 | PHT | 2141 | 2192 |
| Total of major compounds | 95.04% | ||||
| Monoterpene hidrocarbonates (MH) | 70.98% | ||||
| Monoterpene oxygenate (MO) | 14.09% | ||||
| Sesquiterpene hidrocarbonates (SH) | 3.03% | ||||
| Sesquiterpene oxygenate (SO) | 2.26% | ||||
| Phenolic monoterpenoid (PHT) | 0.98% |
| Sample | AA (%) |
|---|---|
| BEO | 86.44 ± 2.12 a |
| BHT | 89.06 ± 1.88 a |
| Concentration (µg/mL) | BEO | Ascorbic Acid |
|---|---|---|
| Inhibition (%) | Inhibition (%) | |
| 50 | 15.18 | 25.22 |
| 60 | 29.45 | 54.48 |
| 70 | 52.24 | 65.24 |
| 80 | 70.25 | 82.32 |
| 100 | 86.44 | 94.54 |
| Samples | BEO | Ascorbic Acid |
|---|---|---|
| IC50 (µg/mL) | 249.37 | 228.40 |
| R2 | 0.9957 | 0.9913 |
| Hill Slope | 8.332 | 17.548 |
| The Concentrations of Boswellia Oil | The OD Values | % of Haemolysis | % Inhibition of the Haemolysis |
|---|---|---|---|
| 10 µL/mL | 2.947 ± 0.001 | 117.745 | - |
| 20 µL/mL | 2.803 ± 0.005 | 112.008 | - |
| 40 µL/mL | 2.462 ± 0.005 | 98.373 | 1.627 |
| 80 µL/mL | 1.996 ± 0.008 | 79.765 | 20.235 |
| 160 µL/mL | 1.846 ± 0.002 | 73.747 | 26.253 |
| Control sample with dexamethasone | 0.878 ± 0.003 | 35.100 | 64.900 |
| Control sample with PBS | 2.503 ± 0.005 | 100 | - |
| The Concentrations of Boswellia Oil (%) | The OD Values | % of Protein Denaturation | % Inhibition of Protein Denaturation |
|---|---|---|---|
| 10 µL/mL | 1.326 ± 0.003 | 100.990 | - |
| 20 µL/mL | 1.321 ± 0.003 | 100.630 | - |
| 40 µL/mL | 1.317 ± 0.002 | 100.307 | - |
| 80 µL/mL | 1.116 ± 0.003 | 84.976 | 15.024 |
| 160 µL/mL | 0.984 ± 0.004 | 74.945 | 25.055 |
| Control sample with dexamethasone | 0.472 ± 0.003 | 35.925 | 64.075 |
| Control sample with PBS | 1.313 ± 0.004 | 100 | - |
| The Concentration of Oil | The ATCC-Tested Strains | |||||||||||
|---|---|---|---|---|---|---|---|---|---|---|---|---|
| S. aureus (ATCC 25923) | S. pyogenes (ATCC 19615) | L. monocytogenes (ATCC 19114) | P. aeruginosa (ATCC 27853) | E. coli (ATCC 25922) | S. typhimurium (ATCC 14028) | S. flexneri (ATCC 12022) | H. influenzae (ATCC 10211) | B. cereus (ATCC 10876) | C. perfringens (ATCC 13124) | C. parapsilosus (ATCC 22019) | C. albicans (ATCC 10231) | |
| 2% | 0.447 ± 0.002 | 0.598 ± 0.005 | 0.926 ± 0.005 | 0.712 ± 0.002 | 0.867 ± 0.004 | 0.641 ± 0.002 | 0.425 ± 0.003 | 0.616 ± 0.004 | 0.543 ± 0.004 | 0.436 ± 0.003 | 0.476 ± 0.004 | 0.136 ± 0.005 |
| 4% | 0.429 ± 0.005 | 0.575 ± 0.003 | 0.843 ± 0.002 | 0.625 ± 0.005 | 0.859 ± 0.004 | 0.636 ± 0.003 | 0.416 ± 0.002 | 0.623 ± 0.002 | 0.541 ± 0.003 | 0.340 ± 0.001 | 0.464 ± 0.005 | 0.133 ± 0.002 |
| 8% | 0.409 ± 0.004 | 0.549 ± 0.005 | 0.652 ± 0.003 | 0.603 ± 0.004 | 0.773 ± 0.004 | 0.611 ± 0.001 | 0.382 ± 0.002 | 0.719 ± 0.003 | 0.482 ± 0.003 | 0.299 ± 0.002 | 0.461 ± 0.004 | 0.128 ± 0.001 |
| 16% | 0.403 ± 0.004 | 0.448 ± 0.005 | 0.644 ± 0.002 | 0.599 ± 0.002 | 0.695 ± 0.003 | 0.552 ± 0.007 | 0.363 ± 0.004 | 0.736 ± 0.004 | 0.432 ± 0.002 | 0.292 ± 0.002 | 0.364 ± 0.003 | 0.119 ± 0.002 |
| 32% | 0.375 ± 0.003 | 0.381 ± 0.001 | 0.565 ± 0.003 | 0.526 ± 0.004 | 0.673 ± 0.003 | 0.269 ± 0.003 | 0.345 ± 0.004 | 0.748 ± 0.003 | 0.378 ± 0.003 | 0.161 ± 0.003 | 0.348 ± 0.004 | 0.088 ± 0.002 |
| BHI | 0.719 ± 0.004 | 0.598 ± 0.017 | 1.214 ± 0.003 | 0.700 ± 0.003 | 0.733 ± 0.003 | 1.117 ± 0.004 | 0.676 ± 0.003 | 1.056 ± 0.007 | 0.578 ± 0.004 | 0.774 ± 0.004 | 0.664 ± 0.004 | 0.151 ± 0.004 |
| 2% | 4% | 8% | 16% | 32% | |
|---|---|---|---|---|---|
| S.pyogenes | |||||
| S. aureus | |||||
| L. monocytogenes | |||||
| Cl. perfringens | |||||
| B. cereus | |||||
| S. flexneri | |||||
| P. aeruginosa | |||||
| E.coli | |||||
| S. typhimurium | |||||
| H. influenzae | |||||
| C. parapsilopsis | |||||
| C. albicans |
| ATCC Strains | IC50 (%) |
|---|---|
| S.pyogenes | 11.89 |
| S. aureus | 3.731 |
| L. monocytogenes | 2.61 |
| Cl. perfringens | 6.00 |
| B. cereus | 5.84 |
| S. flexneri | 1.70 |
| P. aeruginosa | 6.79 |
| E. coli | 8.68 |
| S. typhimurium | 3.83 |
| H. influenzae | 2.15 |
| C. parapsilopsis | 1.69 |
| C. albicans | 0.78 |
| S/No | Chemical Compound of the Frankincense Oil | Binding Energies (kcal/mol) | Bonding Type (TyrRS + Compound) |
|---|---|---|---|
| 1 | .alpha.-Pinene | −5.6 | Pi-Sigma/Pi-Alkyl: PHE306 |
| 2 | .alpha.-Phellandrene | −6.0 | Pi-Alkyl: PHE273, PHE306 |
| 3 | Camphene | −5.5 | Pi-Sigma: PHE273, PHE306 Pi-Alkyl: PHE306 |
| 4 | .beta.-Pinene | −5.4 | Pi-Sigma: PHE273 Pi-Alkyl: PHE306 |
| 5 | 3-Carene | −6.1 | Nil |
| 6 | Thujene | −5.5 | Alkyl/Pi-Alkyl: LEU70, TYR170 |
| 7 | .beta.-Myrcene | −4.9 | Alkyl: CYS37, LEU70 |
| 8 | Limonene | −5.8 | Alkyl: CYS37, LEU70, ILE200 |
| 9 | Eucalyptol | −5.4 | Pi-Alkyl: PHE273, PHE306 |
| 10 | p-Cymene | −6.0 | Pi-Pi Stacked/Shaped: PHE273, PHE306 Pi-Alkyl: PHE306 |
| 11 | Methyl-4,6-decadienyl ether | −5.1 | H: THR75 C-H: ASP177 Alkyl/Pi-Alkyl: TYR36, CYS37, LEU70 |
| 12 | Copaene | −7.0 | Pi-Alkyl: PHE273, PHE306 |
| 13 | .alpha.-Bourbonene | −6.5 | Pi-Sigma: PHE273, PHE306 Alkyl/Pi-Alkyl: LYS305 |
| 14 | Acetic acid, octyl ester | −5.0 | H: GLN174 Alkyl/Pi-Alkyl: TYR36, CYS37, LEU70 |
| 15 | Linalool | −5.3 | H: THR75, TYR170 Alkyl: CYS37, ILE200 |
| 16 | Linalool acetate | −5.5 | H: ASP40 Alkyl/Pi-Alkyl: TYR36, LEU70 |
| 17 | Menthyl acetate | −6.2 | H: CYS37 |
| 18 | Caryophyllene | −6.8 | Pi-Sigma: PHE273 Pi-Alkyl: PHE306 |
| 19 | p-Menthan-3-one, cis-- | −5.9 | Nil |
| 20 | Geranyl acetate | −5.8 | H: THR75, GLN174 Alkyl/Pi-Alkyl: ALA39, HIS50 |
| 21 | Bornyl acetate | −5.8 | H: ASP40, GLN174 Alkyl: ALA39 |
| 22 | Isomenthone | −5.4 | Alkyl: CYS37, ILE200 |
| 23 | alpha-terpineol | −6.0 | H: GLN190 Alkyl: LEU70 |
| 24 | gamma.-Cadinene | −7.4 | Alkyl/Pi-Alkyl: CYS37, TYR36, ILE200 |
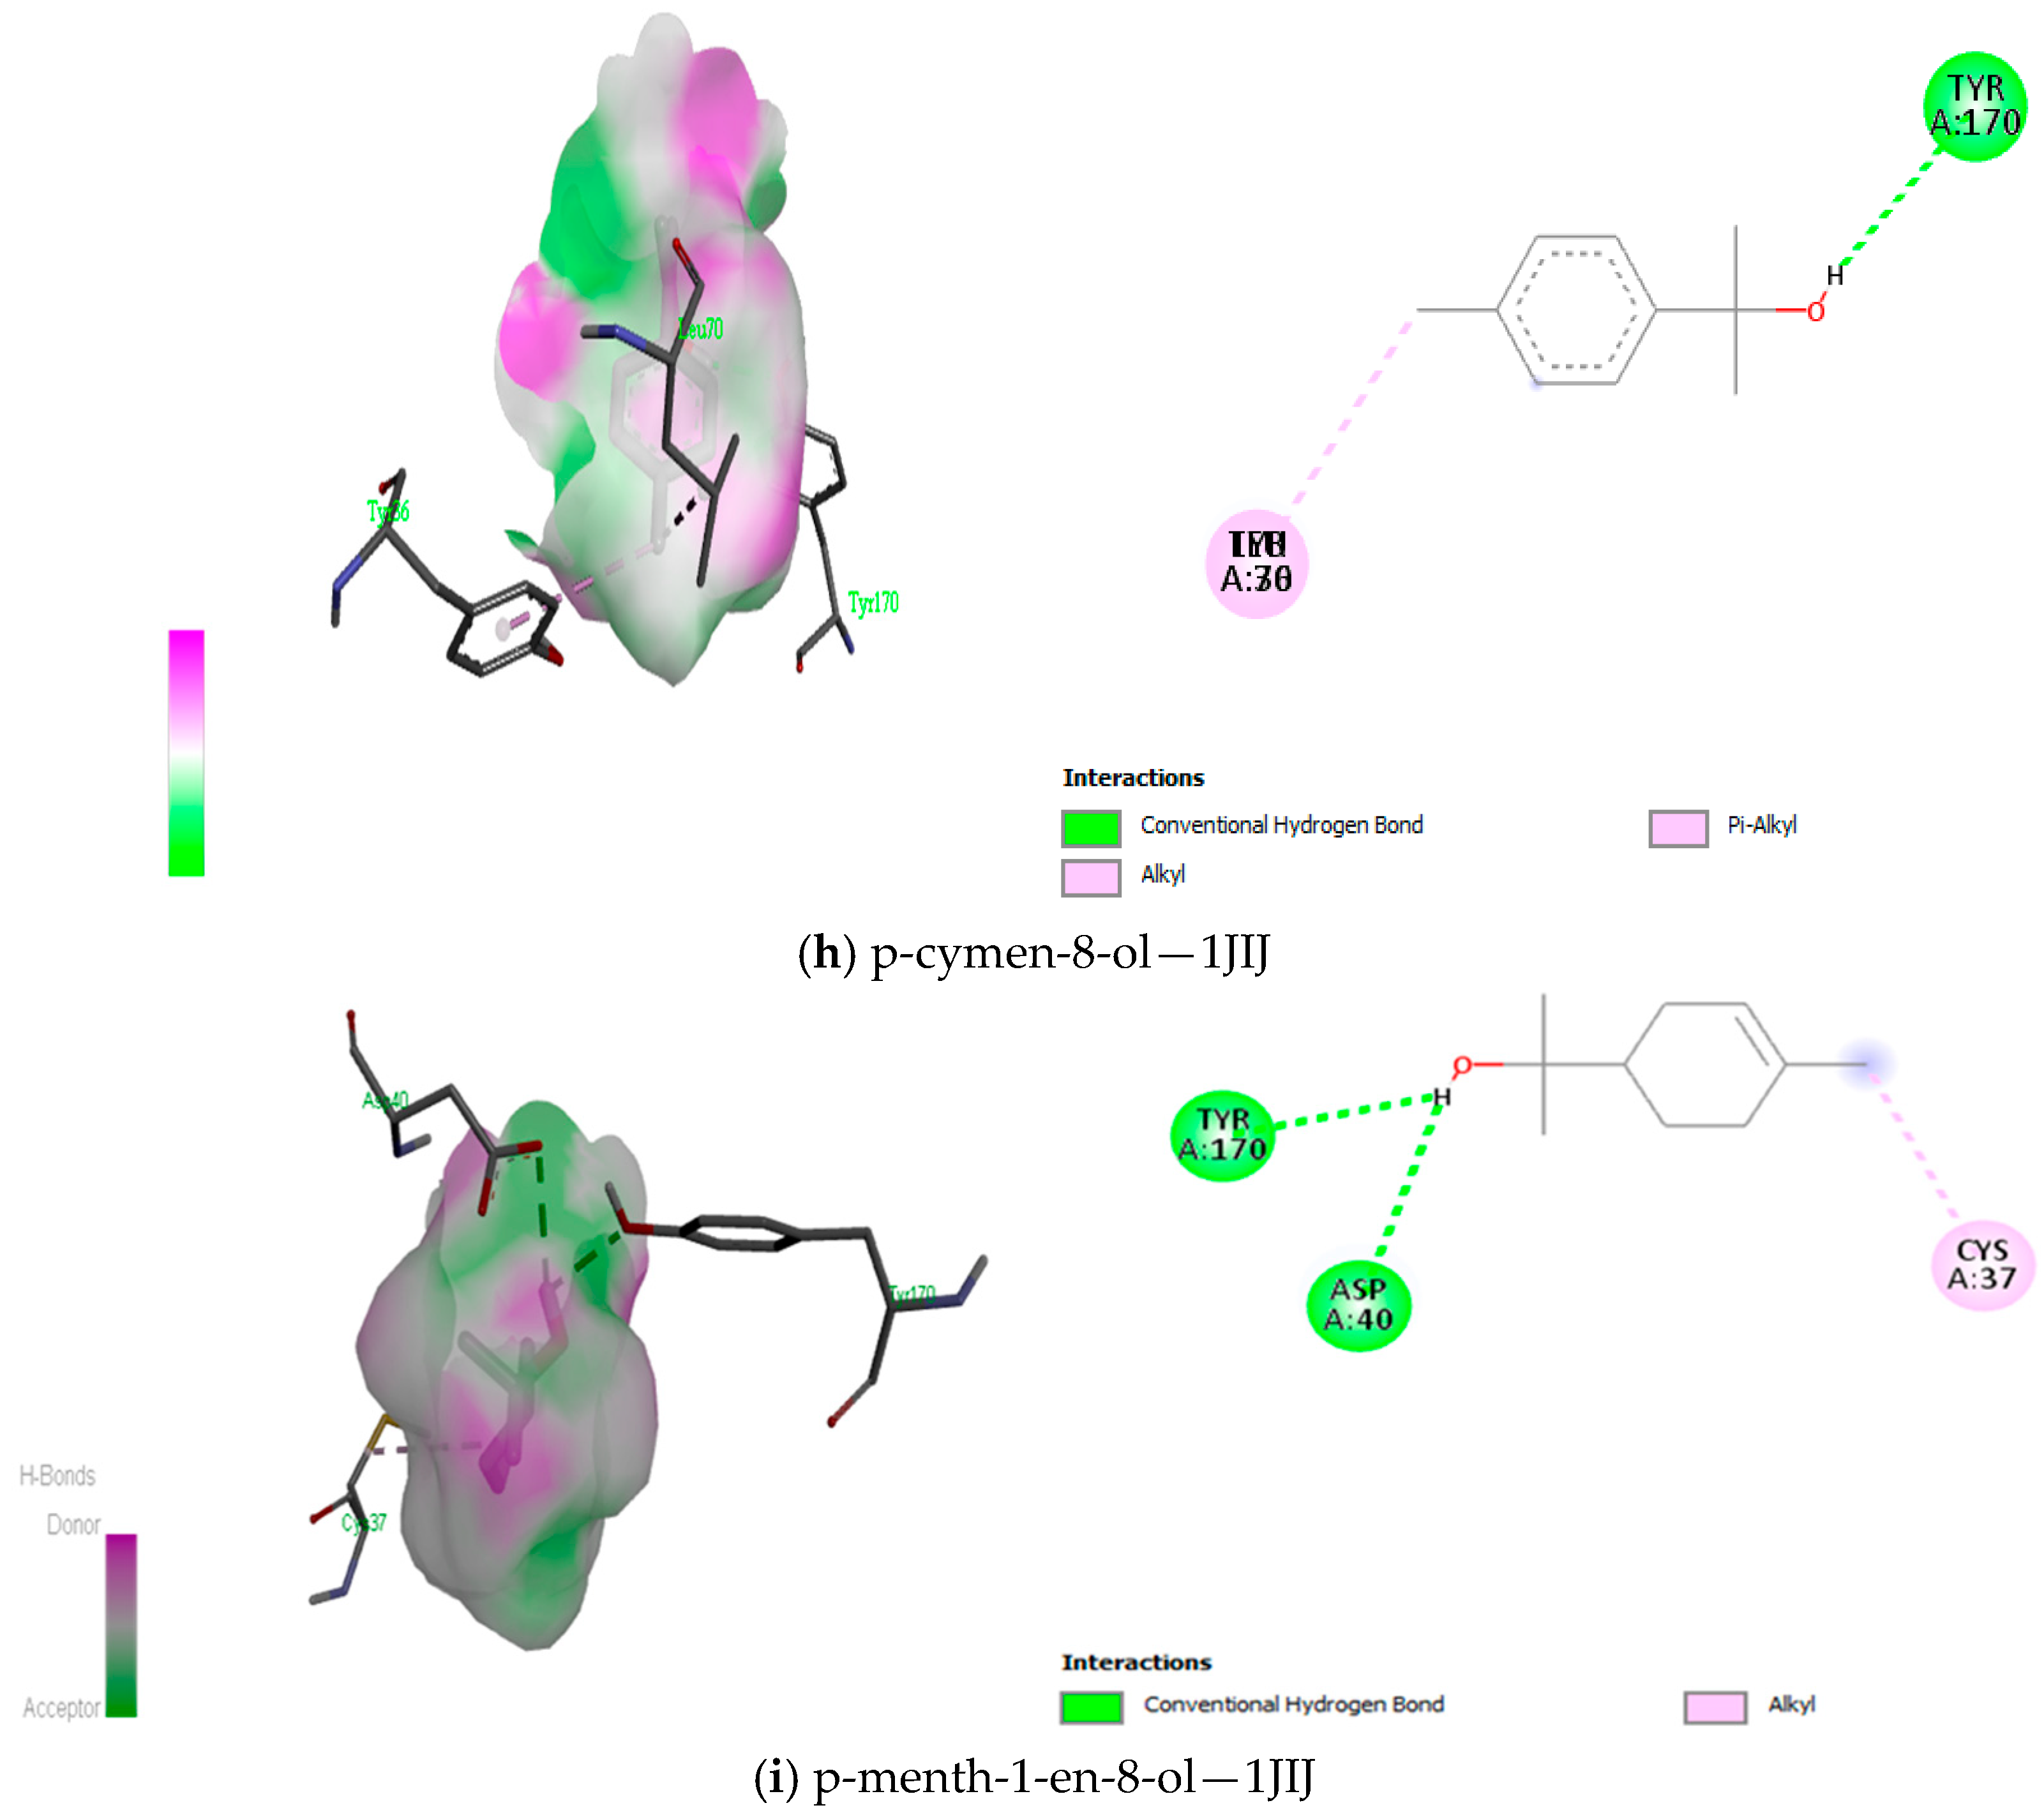
| 25 | p-menth-1-en-8-ol | −6.5 | H: TRY170, ASP40 Alkyl: CYS37 |
| 26 | p-Cymen-8-ol | −6.4 | H: TYR170 Alky/Pi-Alkyl: TYR36, LEU70 |
| 27 | Benzenemethanol, .alpha., .alpha., 4-trimethyl- | −6.5 | H: TYR170 Alkyl: CYS37 |
| 28 | Verbenone | −5.8 | Nil |
| 29 | beta.-Elemene | −6.5 | Pi-Sigma: PHE306 Alkyl/Pi-Alkyl: PHE273, LYS305 |
| 30 | Caryophyllene oxide | −6.8 | Nil |
| 31 | .tau.-Cadinol | −6.9 | Unfavorable Donor-Donor: GLY193 Alkyl: CYS37 |
| 32 | 1,3 hexadiene, 3-ethyl, 2,5-dimethyl- | −5.1 | Alkyl: CYS37 |
| 33 | Verticiol | −6.8 | H: GLU302 |
| 34 | Eugenol | −6.4 | H: ASP177 Alkyl/Pi-Alkyl: CYS37, LEU70, ILE200 |
| 35 | 2-Propen-1-ol, 3-phenyl-, acetate, (E)- | −3.2 | H: THR75 Alkyl/Pi-Alkyl: LEU70, TYR36 |
| 36 | Cinnamaldehyde, (E)- | −5.8 | H: ARG58 Pi-Pi Stacked/Shaped: PHE273, PHE306 |
| S/No | Chemical Compound of the Frankincense Oil | Binding Energies (kcal/mol) | Bonding Interaction (1AB4 + Compound) |
|---|---|---|---|
| 1 | .alpha.-Pinene | −5.1 | Alkyl/Pi-Alkyl: TYR100, ILE130 |
| 2 | .alpha.-Phellandrene | −5.2 | Alkyl: MET101, ALA128, ILE130 |
| 3 | Camphene | −5.0 | Nil |
| 4 | .beta.-Pinene | −5.2 | Nil |
| 5 | 3-Carene | −5.3 | Alkyl: ALA128, LYS129, ILE130 |
| 6 | Thujene | −5.1 | Alkyl: MET101, ALA128, ILE130 |
| 7 | .beta.-Myrcene | −4.8 | Alkyl/Pi-Alkyl: TRP59, TYR100, ALA128, LYS129, ILE130, PHE513 |
| 8 | L-Limonene | −5.1 | Alkyl/Pi-Alkyl: TYR100, ALA128, ILE130, PHE513 |
| 9 | D-Limonene | −5.2 | Alkyl/Pi-Alkyl: TYR100, ALA128, ILE130, PHE513 |
| 9 | Eucalyptol | −5.1 | Nil |
| 10 | p-Cymene | −5.2 | Pi-Sulfur: MET101 Alkyl/Pi-Alkyl: TYR100, ALA128, ILE130, PHE513 |
| 11 | Methyl-4,6-decadienyl ether | −4.4 | Alkyl/Pi-Alkyl: TYR100, ALA128, LYS129, ILE130, PHE513 |
| 12 | Copaene | −6.2 | Alkyl: MET101, ALA128 |
| 13 | .alpha.-Bourbonene | −6.4 | Alkyl/Pi-Alkyl: ALA128, LYS129, ILE130, PHE513 |
| 14 | Acetic acid, octyl ester | −4.4 | Alkyl/Pi-Alkyl: TYR100, ALA128, ILE130, PHE513 |
| 15 | Linalool | −4.6 | H: ILE130 Alkyl/Pi-Alkyl: TYR100, PHE513 |
| 16 | Linalool acetate | −4.9 | H: LYS129 Alkyl/Pi-Alkyl: TYR100, ILE130, PHE513 |
| 17 | Menthyl acetate | −5.2 | Alkyl: MET101, ALA128 |
| 18 | (E)-β-Caryophyllene | −6.1 | Nil |
| 19 | p-Menthan-3-one, cis- | −5.0 | Nil |
| 20 | Geranyl acetate | −5.3 | Alkyl/Pi-Alkyl:ILE130, PHE513 |
| 21 | Bornyl acetate | −5.5 | H: LYS129 Alkyl: ILE130 |
| 22 | Isomenthone | −5.3 | H: LYS129, ILE130 Alkyl/Pi-Alkyl: TYR100, PHE513 |
| 23 | alpha-terpinenol | −5.2 | H: GLN267 Pi-Alkyl: PHE96 |
| 24 | gamma.-Cadinene | −6.2 | Alkyl/Pi-Alkyl: TYR100, ALA128, LYS129, ILE130, PHE513 |
| 25 | p-menth-1-en-8-ol | −5.3 | H: GLY114 Pi-Alkyl: TYR266, PHE96 |
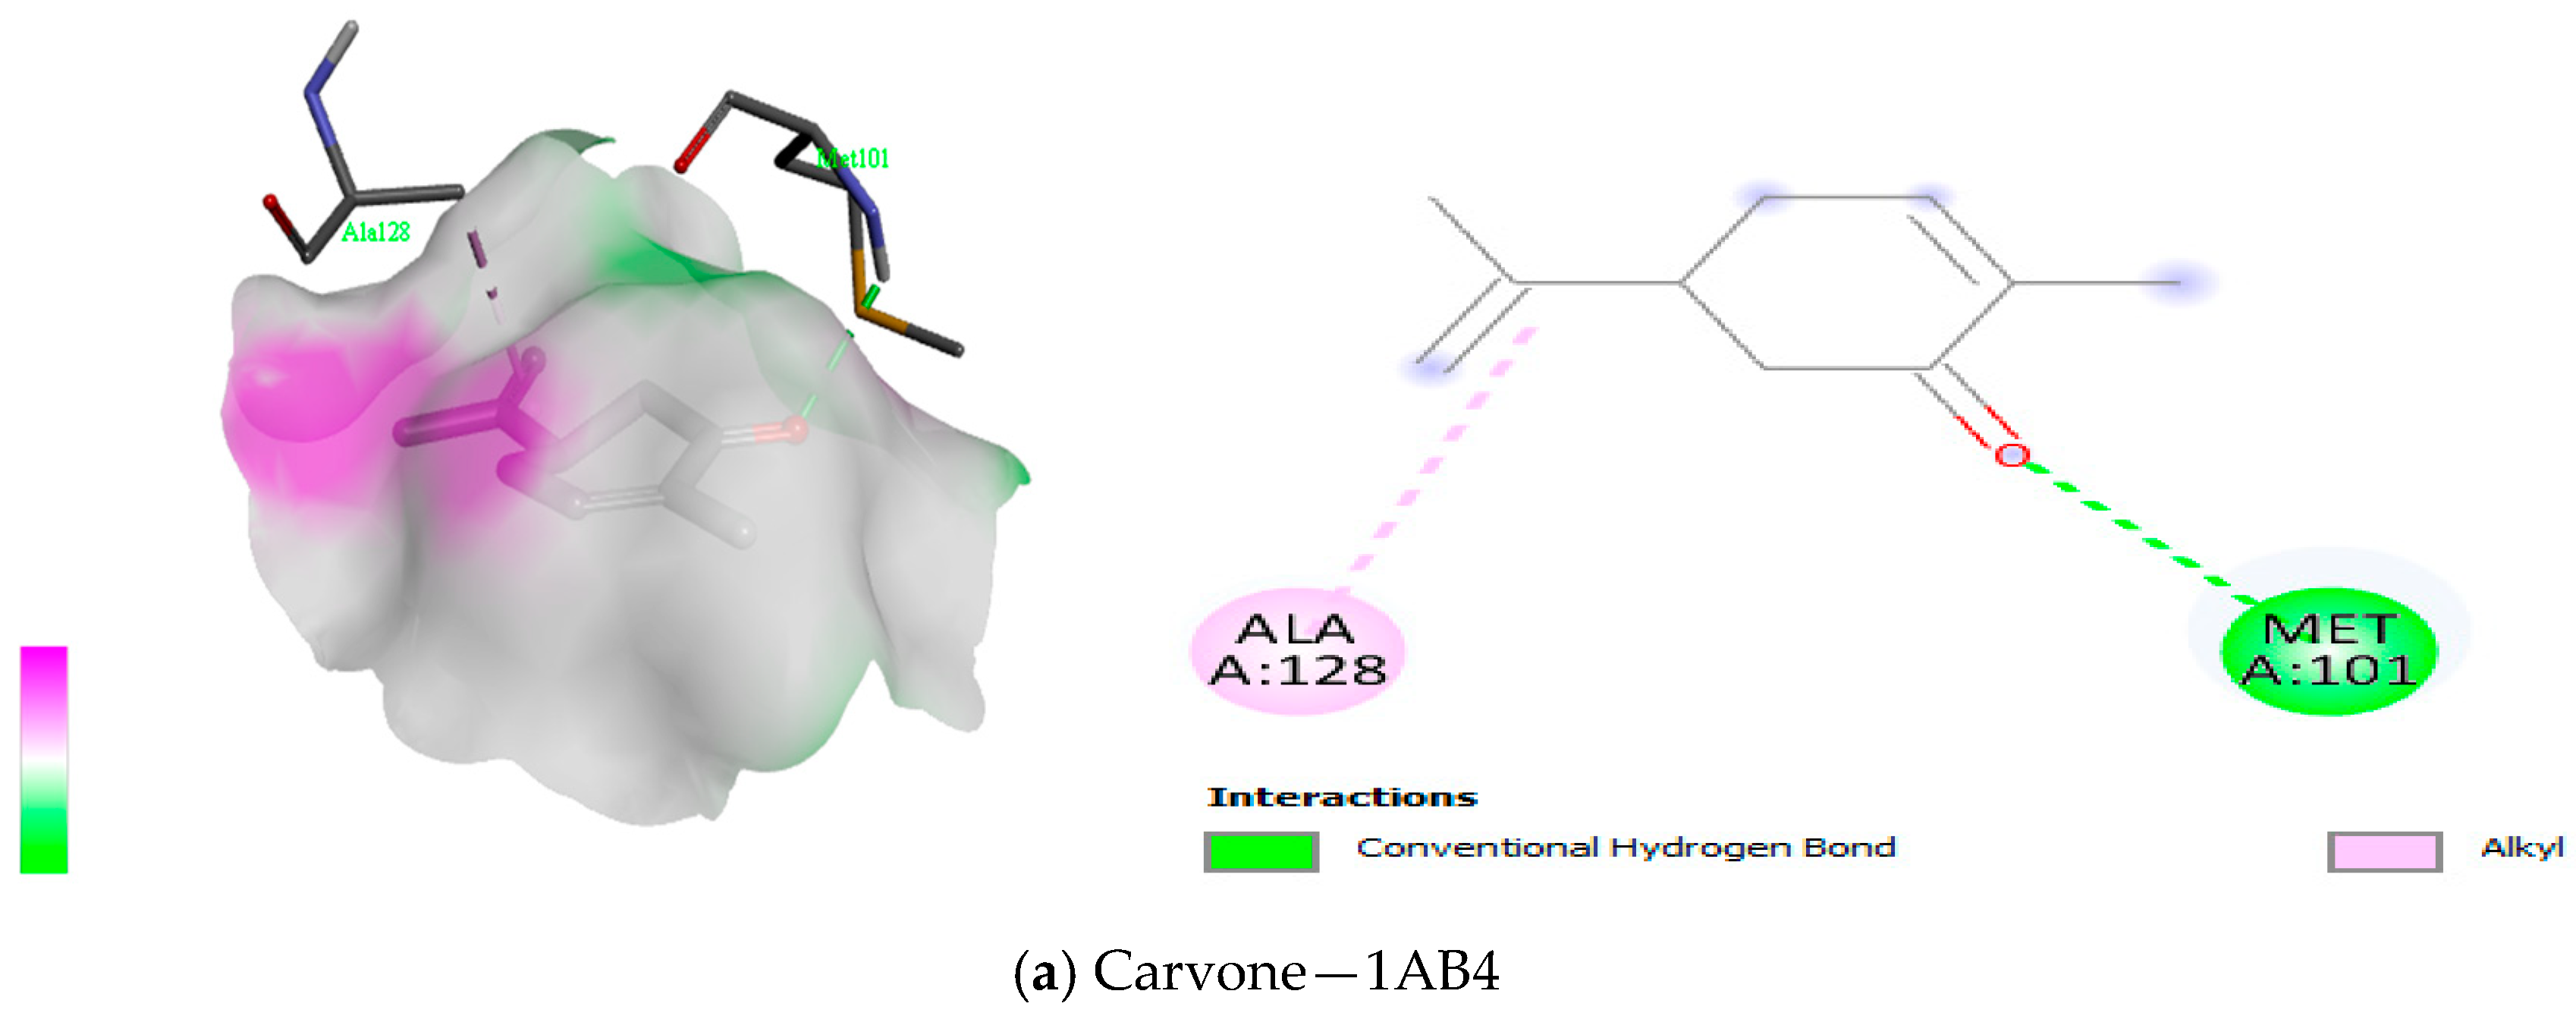
| 26 | Carvone | −5.5 | H: MET101 Alkyl: ALA128 |
| 27 | p-Cymen-8-ol | −5.4 | Pi-Sulfur: MET101 Alkyl/Pi-Alkyl: TYR100, ALA128, ILE130, PHE513 |
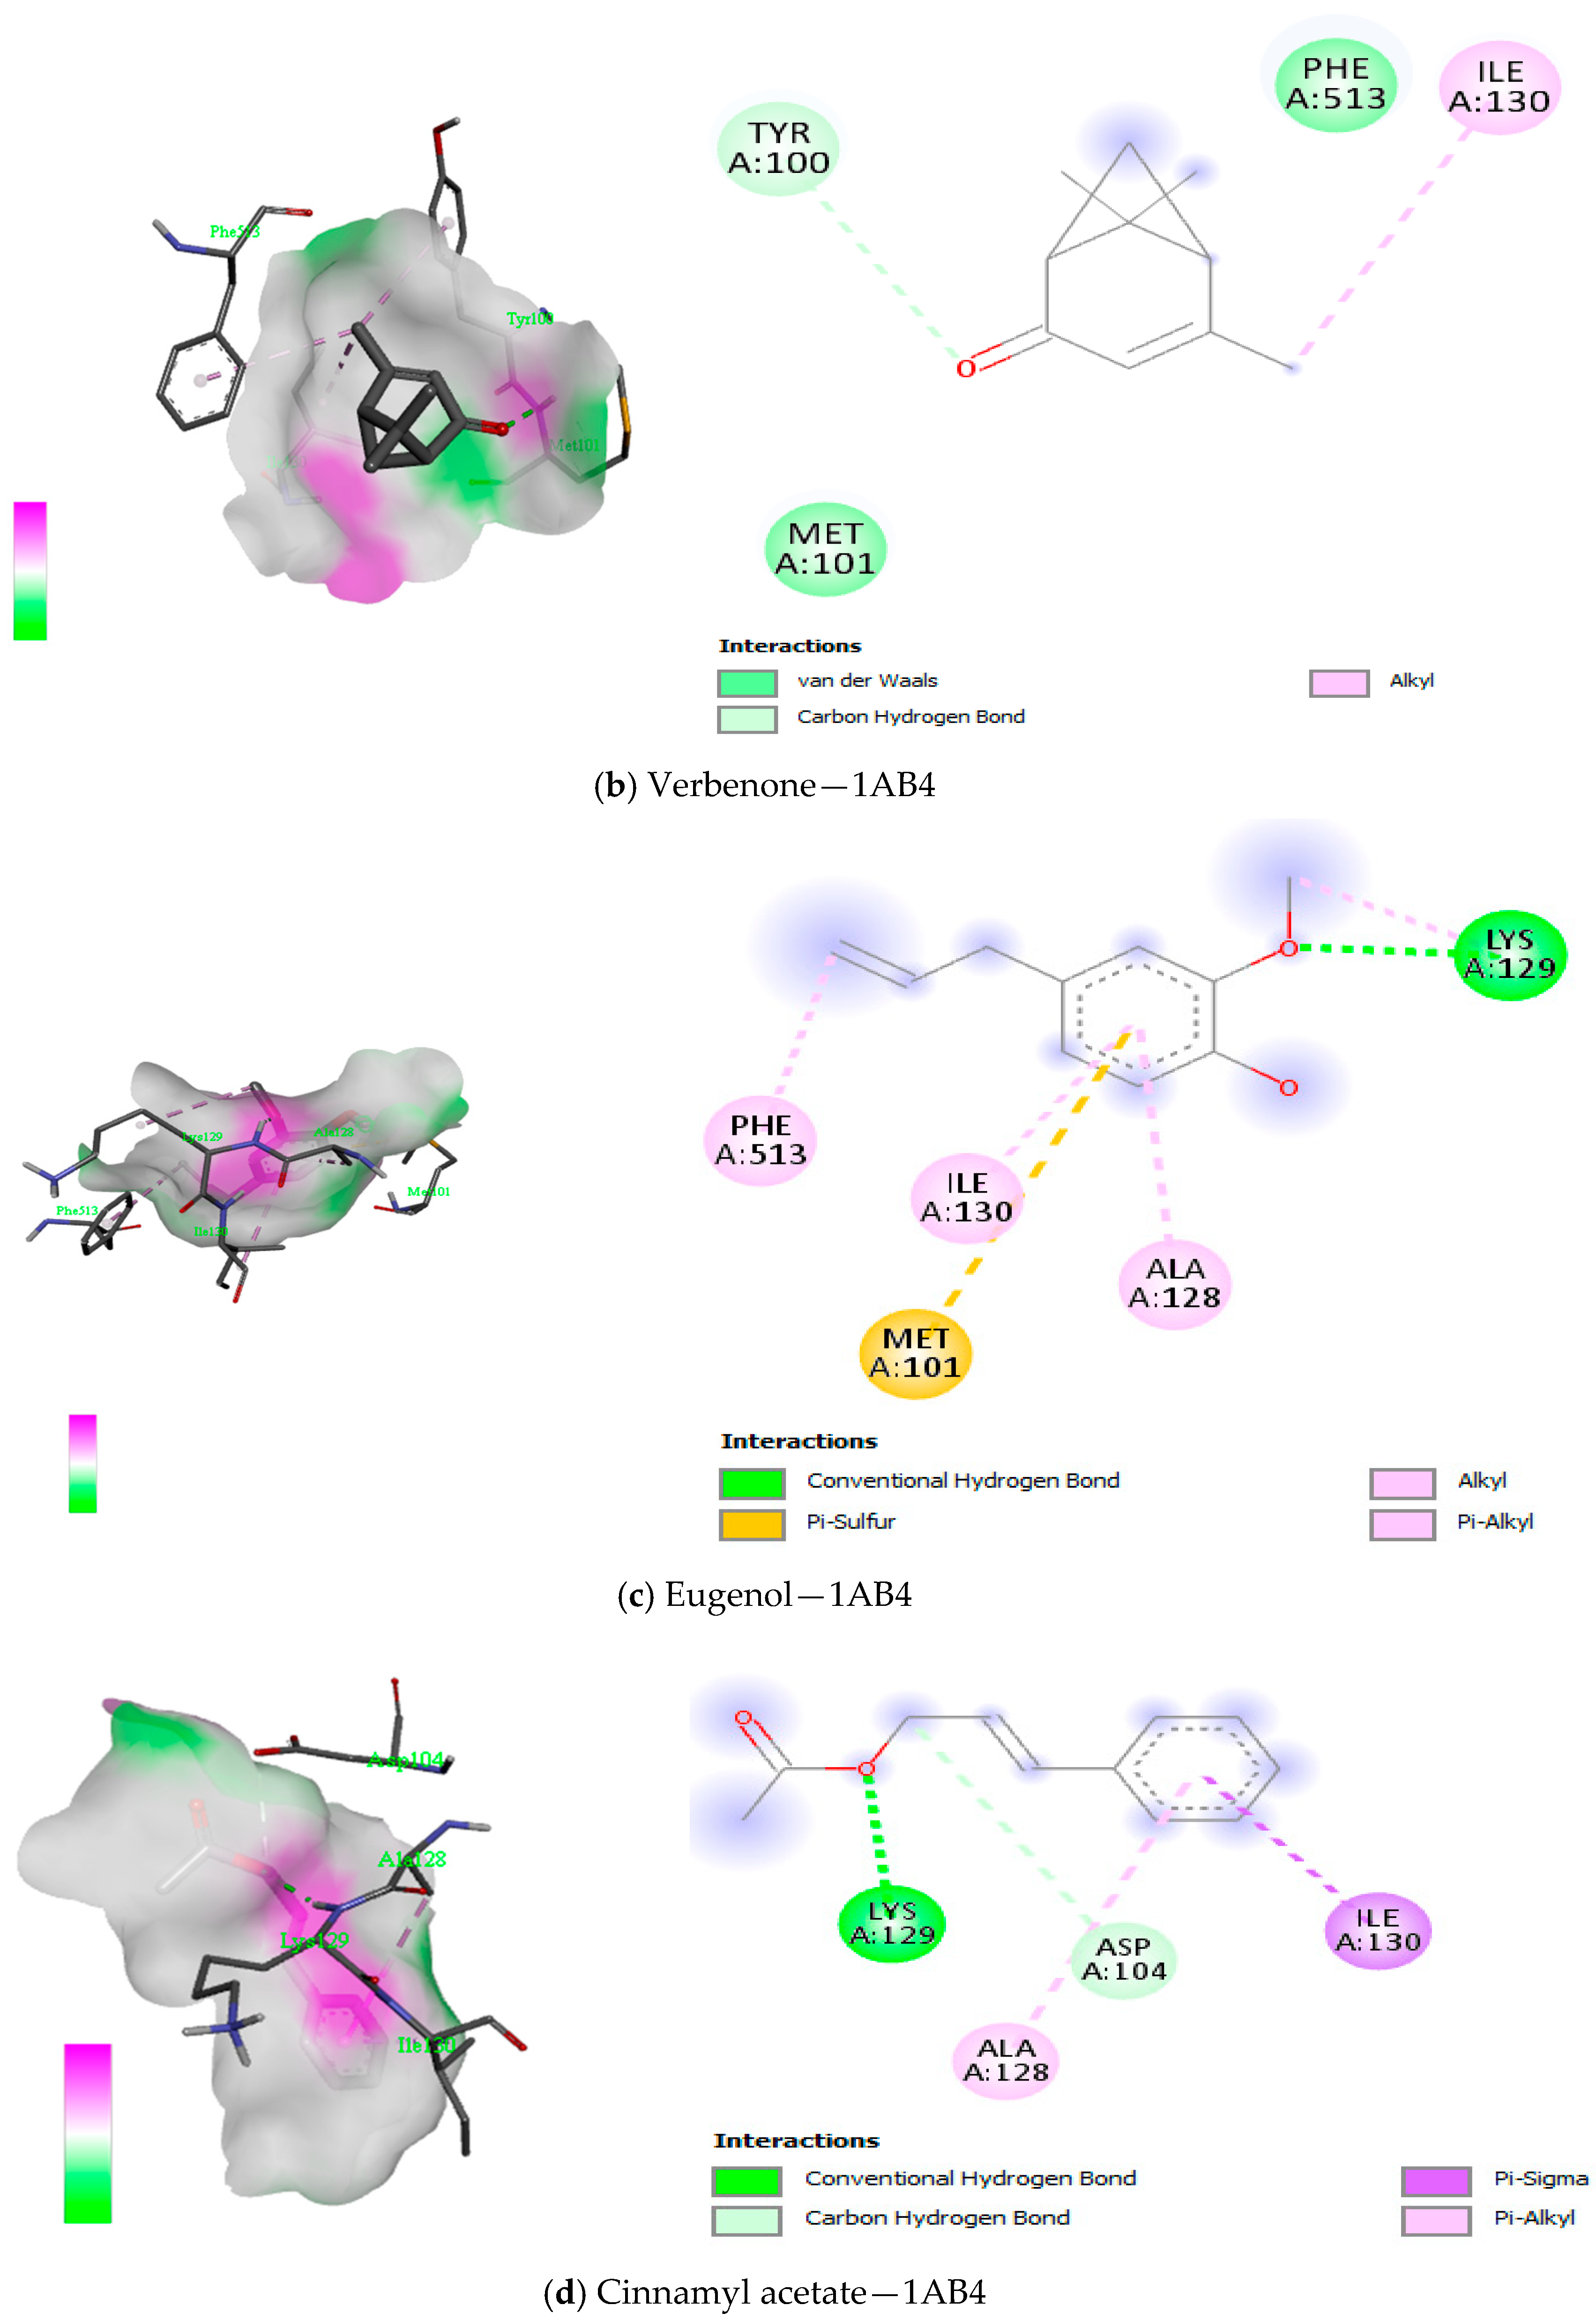
| 28 | Verbenone | −5.5 | Van der Waals: MET101, PHE513 C-H: TYR100 Alkyl: ILE130 |
| 29 | beta.-Elemene | −5.9 | Alkyl: ALA128, LYS129 |
| 30 | Caryophyllene oxide | −6.3 | Nil |
| 31 | .tau.-Cadinol | −6.1 | Alkyl/Pi-Alkyl: TYR100, ALA128, LYS129, ILE130, PHE513 |
| 32 | Verticiol | −7.1 | H: MET101 |
| 33 | Eugenol | −5.2 | H: LYS129 Pi-Sulfur: MET101 Alkyl/Pi-Alkyl: ALA128, ILE130, PHE513 |
| 34 | Cinnamyl acetate | −5.6 | H: LYS129 C-H: ASP104 Pi-Sigma: ILE130 Pi-Alkyl: ALA128 |
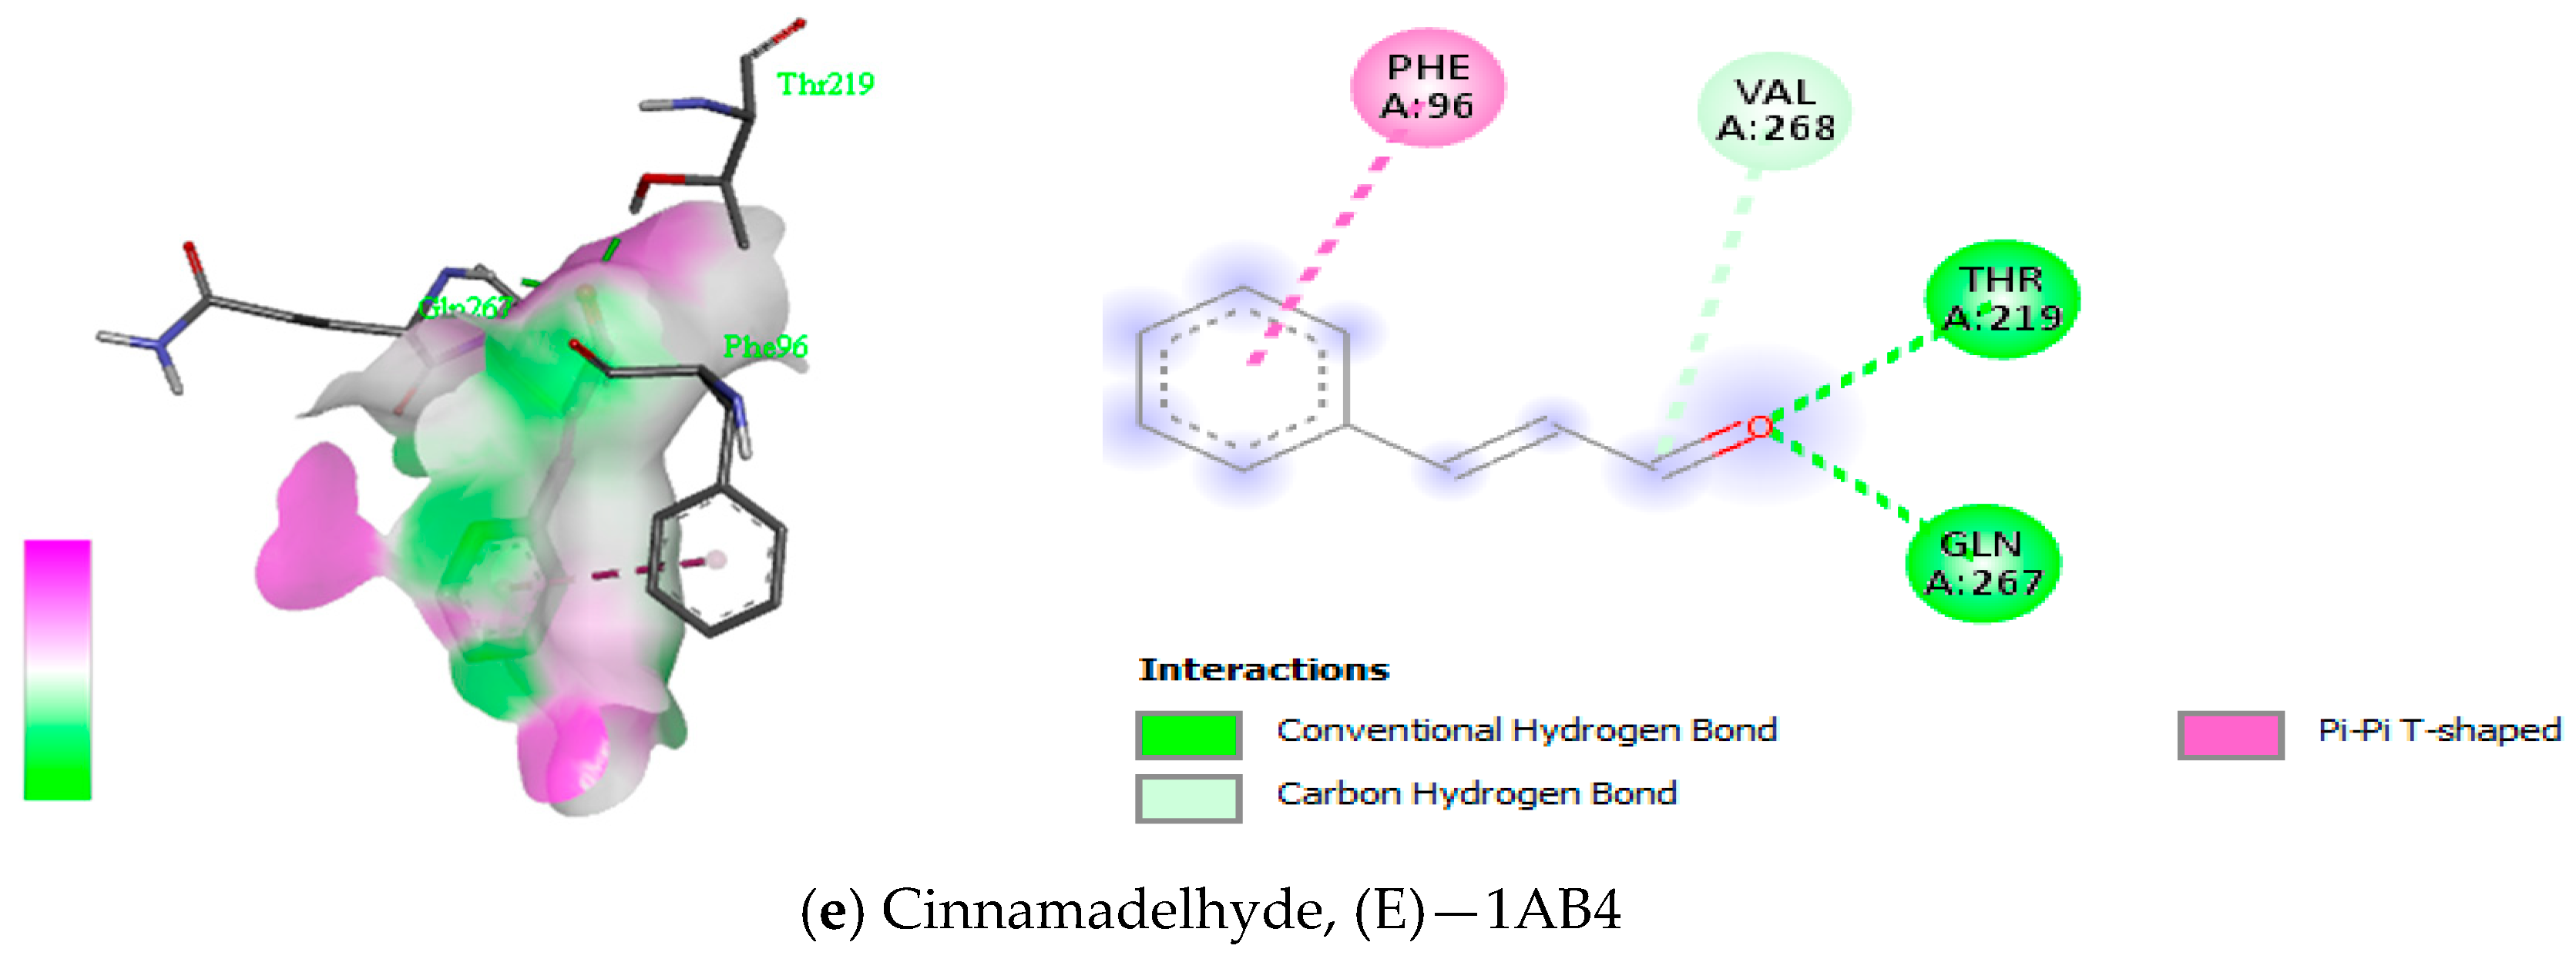
| 35 | Cinnamaldehyde, (E)- | −5.2 | H: THR219, GLN267 C-H: VAL268 Pi-Pi T-Shaped: PHE96 |
| S/No | Chemical Compound of the Frankincense Oil | Binding Energies (kcal/mol) | Bonding Interaction (1IX1 + Compound) |
|---|---|---|---|
| 1 | .alpha.-Pinene | −5.1 | Nil |
| 2 | .alpha.-Phellandrene | −5.4 | Alkyl/Pi-Alkyl: ILE45, CYS131, HIS134 |
| 3 | Camphene | −5.1 | Nil |
| 4 | .beta.-Pinene | −5.2 | Nil |
| 5 | 3-Carene | −5.0 | Pi-Alkyl: PHE120 |
| 6 | Thujene | −5.1 | Alkyl/Pi-Alkyl: LEU127, VAL130, CYS131, HIS134 |
| 7 | .beta.-Myrcene | −4.9 | Alkyl/Pi-Alkyl: ILE45, TYR88, LEU93, VAL130, HIS134 |
| 8 | L-Limonene | −5.4 | Alkyl/Pi-Alkyl: ILE45, LEU93, CYS131, HIS134 |
| 9 | Eucalyptol | −5.1 | Pi-Sigma: PHE120 Alkyl/Pi-Alkyl: ARG71 |
| 10 | p-Cymene | −5.5 | Pi-Pi Stacked: PHE120 Alkyl/Pi-Alkyl: ARG71, PHE73 |
| 11 | Methyl-4,6-decadienyl ether | −4.7 | Alkyl/Pi-Alkyl: ILE45, LEU93, VAL130, CYS131, HIS134 |
| 12 | Copaene | −6.2 | Alkyl: ILE45, LEU93 |
| 13 | .alpha.-Bourbonene | −6.9 | Alkyl: ILE45, CYS131 |
| 14 | Acetic acid, octyl ester | −4.8 | C-H: GLU135 Alkyl/Pi-Alkyl: TYR88, CYS131, HIS134 |
| 15 | Linalool | −5.6 | H: GLY46 Alkyl/Pi-Alkyl: ILE45, LEU127, VAL130, CYS131, HIS134 |
| 16 | Linalool acetate | −5.1 | H: VAL72, ARG115 Pi-Sigma: PHE120 Alkyl/Pi-Alkyl: ARG71, PHE120 |
| 17 | Menthyl acetate | −5.6 | H: GLY91 Alkyl/Pi-Alkyl: ILE45, LEU93, HIS134 |
| 18 | (E)-β-Caryophyllene | −6.7 | Alkyl/Pi-Alkyl: ILE45, HIS134 |
| 19 | p-Menthan-3-one, cis- | −5.5 | Nil |
| 20 | Geranyl acetate | −5.5 | H: ILE45, GLY46 Alkyl/Pi-Alkyl: LEU127, VAL130, CYS131, HIS134 |
| 21 | Bornyl acetate | −5.3 | H: GLY91 C-H: GLY91 Pi-Sigma: HIS134 Alkyl: ILE45 |
| 22 | Isomenthone | −5.4 | H: GLY91 Alkyl/Pi-Alkyl: ILE45, HIS134 |
| 23 | alpha-terpineol | −5.9 | H: GLY91 Pi-Sigma: HIS134 Alkyl: ILE45, LEU93, CYS131 |
| 24 | gamma.-Cadinene | −7.0 | Alkyl/Pi-Alkyl: ILE45, LEU93, TYR99, CYS131, HIS134 |
| 25 | p-menth-1-en-8-ol | −6.1 | H: GLY46 Alkyl/Pi-Alkyl: ILE45, LEU127, VAL130, CYS131, HIS134 |
| 26 | Carvone | −5.6 | Alkyl/Pi-Alkyl: VAL130, CYS131, HIS134 |
| 27 | p-Cymen-8-ol | −5.7 | Pi-Sigma: ILE45 Pi-Pi Stacked: HIS134 Alkyl/Pi-Alkyl: TYR88, LEU127, VAL130, CYS131 |
| 28 | Verbenone | −5.7 | Nil |
| 29 | beta.-Elemene | −6.2 | Alkyl/Pi-Alkyl: ILE45, HIS134 |
| 30 | Caryophyllene oxide | −6.6 | Nil |
| 31 | .tau.-Cadinol | −7.6 | Unfavorable Donor-Donor: ILE45 Alkyl/Pi-Alkyl: TYR88, VAL130, CYS131, HIS134 |
| 32 | Verticiol | −6.4 | Unfavorable Donor-Donor/Unfavorable Acceptor-Acceptor: ARG71, GLU122 |
| 33 | Eugenol | −5.8 | H: ILE45, GLY46 Pi-Pi Stacked: HIS134 Alkyl/Pi-Alkyl: LEU93, LEU127, VAL130, CYS131 |
| 34 | Cinnamyl acetate | −5.8 | H: CYS92, LEU93 Pi-Sigma: ILE45 Alkyl: CYS131 |
| 35 | Cinnamaldehyde, (E)- | −5.6 | H: GLN51, CYS92, LEU93 C-H: GLY46 Pi-Sigma: ILE45 Pi-Alkyl: CYS131 |
| S/No | Chemical Compound of the Frankincense Oil | Binding Energies (Kcal/mol) | Bonding Type (7XE4 + Compound) |
|---|---|---|---|
| 1 | .alpha.-Pinene | −6.3 | Pi-Sigma: PHE1366 Alkyl/Pi-Alkyl: ILE1304, LEU1308, ILE1362, PHE1363 |
| 2 | .alpha.-Phellandrene | −5.8 | Alkyl/Pi-Alkyl: TRP515, LEU528, PHE532 |
| 3 | Camphene | −6.1 | Van der Waals: PHE1363 Pi-Sigma: PHE1366 Alkyl/Pi-Alkyl: LEU1308, ILE1362 |
| 4 | .beta.-Pinene | −6.4 | Alkyl/Pi-Alkyl: ILE1304, LEU1308, ILE1362, PHE1363, PHE1366 |
| 5 | 3-Carene | −6.2 | Alkyl/Pi-Alkyl: LEU1308, PHE1363, PHE1366 |
| 6 | Thujene | −6.0 | Alkyl/Pi-Alkyl: LEU1308, PHE1363, PHE1366 |
| 7 | .beta.-Myrcene | −4.8 | Alkyl/Pi-Alkyl: ILE1340, LEU1308, ILE1362, PHE1366, PHE1370 |
| 8 | L-Limonene | −6.0 | Alkyl/Pi-Alkyl: ILE1304, LEU1308, ILE1362, PHE1363, PHE1366 |
| 9 | Eucalyptol | −5.8 | Van der Waals: ILE1304, ILE1362, PHE1363, PHE1366, PHE1475 |
| 10 | p-Cymene | −6.1 | Pi-Cation: ARG1273 Pi-Sigma: HIS1218 Amide-Pi Stacked: GLY1216 Pi-Alkyl: LEU1217 |
| 11 | Methyl-4,6-decadienyl ether | −4.5 | H: SER1478 Alkyl/Pi-Alkyl: ILE1304, LEU1308, ILE1362, PHE1370 |
| 12 | Copaene | −7.3 | Pi-Sigma: PHE1366 Alkyl/Pi-Alkyl: ILE1304, PHE1370 |
| 13 | .alpha.-Bourbonene | −7.6 | Pi-Sigma: PHE1366 Alkyl/Pi-Alkyl: LEU1308 |
| 14 | Acetic acid, octyl ester | −4.3 | Alkyl/Pi-Alkyl: LEU1308, ILE1304, PHE1366, PHE1363, ILE1362 |
| 15 | Linalool | −4.9 | Alkyl/Pi-Alkyl: ILE1304, PHE1366, PHE1370 |
| 16 | Linalool acetate | −5.4 | H: SER1478 Alkyl/Pi-Alkyl: LEU1308, ILE1362, PHE1363, PHE1366 |
| 17 | Menthyl acetate | −6.3 | H: SER1478 Alkyl/Pi-Alkyl: ILE1304, LEU1308, ILE1362, PHE1363, PHE1475 |
| 18 | (E)-β-Caryophyllene | −7.4 | Nil |
| 19 | p-Menthan-3-one, cis- | −5.7 | H: SER1478 Pi-Sigma: PHE1366 |
| 20 | Geranyl acetate | −5.8 | H: LYS1212, TYR1224, ASN1228 C-H: GLY1208 Alkyl/Pi-Alkyl: TRP398, LEU1231 |
| 21 | Bornyl acetate | −6.4 | Pi-Sigma: PHE1366 Alkyl/Pi-Alkyl: ILE1304, LEU1308 |
| 22 | Isomenthone | −5.7 | H: SER1478 Pi-Sigma: PHE1366 |
| 23 | alpha-terpinenol | −5.7 | Alkyl: ILE1304, LEU1308 |
| 24 | gamma.-Cadinene | −7.4 | Alkyl/Pi-Alkyl: ILE1304, LEU1308, ILE1362, PHE1366 |
| 25 | p-menth-1-en-8-ol | −6.1 | H: ARG1273 Unfavorable Donor-Donor: ASP392 Pi-Alkyl: TYR439 |
| 26 | Carvone | −6.2 | Pi-Alkyl: PHE532 |
| 27 | p-Cymen-8-ol | −5.7 | Pi-Pi Stacked: PHE1176 Pi-Alkyl: PHE1176 |
| 28 | Verbenone | −6.2 | Nil |
| 29 | beta.-Elemene | −7.1 | Alkyl/Pi-Alkyl: ILE1304, LEU1308, ILE1362, PHE1363, PHE1366, PHE1475 |
| 30 | Caryophyllene oxide | −7.2 | Nil |
| 31 | tau.-Cadinol | −7.2 | Pi-Sigma: PHE1366 Alkyl/Pi-Alkyl: LEU1308, PHE1363, LEU1479, LEU1482 |
| 32 | Verticiol | −7.3 | Pi-Sigma: PHE629 Alkyl: MET458 |
| 33 | Eugenol | −6.5 | H: ILE387, GLY389, LYS437 C-H: HIS384, GLU441 Pi-Cation/Pi-Anion: ASP392, ARG1273 Amide-Pi Stacked: GLY1216 Alkyl/Pi-Alkyl: LEU1217 |
| 34 | Cinnamyl acetate | −5.6 | H: GLN604 C-H: GLN604 Pi-Sigma/Pi-Pi T-shaped: PHE610 Alkyl/Pi-Alkyl: ALA608, PRO1283 |
| 35 | Cinnamaldehyde, (E)- | −5.5 | Pi-Sigma: PHE532 Pi-Pi Stacked: TRP515 Pi-Alkyl: LEU528 |
Disclaimer/Publisher’s Note: The statements, opinions and data contained in all publications are solely those of the individual author(s) and contributor(s) and not of MDPI and/or the editor(s). MDPI and/or the editor(s) disclaim responsibility for any injury to people or property resulting from any ideas, methods, instructions or products referred to in the content. |
© 2023 by the authors. Licensee MDPI, Basel, Switzerland. This article is an open access article distributed under the terms and conditions of the Creative Commons Attribution (CC BY) license (https://creativecommons.org/licenses/by/4.0/).
Share and Cite
Obiștioiu, D.; Hulea, A.; Cocan, I.; Alexa, E.; Negrea, M.; Popescu, I.; Herman, V.; Imbrea, I.M.; Heghedus-Mindru, G.; Suleiman, M.A.; et al. Boswellia Essential Oil: Natural Antioxidant as an Effective Antimicrobial and Anti-Inflammatory Agent. Antioxidants 2023, 12, 1807. https://doi.org/10.3390/antiox12101807
Obiștioiu D, Hulea A, Cocan I, Alexa E, Negrea M, Popescu I, Herman V, Imbrea IM, Heghedus-Mindru G, Suleiman MA, et al. Boswellia Essential Oil: Natural Antioxidant as an Effective Antimicrobial and Anti-Inflammatory Agent. Antioxidants. 2023; 12(10):1807. https://doi.org/10.3390/antiox12101807
Chicago/Turabian StyleObiștioiu, Diana, Anca Hulea, Ileana Cocan, Ersilia Alexa, Monica Negrea, Iuliana Popescu, Viorel Herman, Ilinca Merima Imbrea, Gabriel Heghedus-Mindru, Mukhtar Adeiza Suleiman, and et al. 2023. "Boswellia Essential Oil: Natural Antioxidant as an Effective Antimicrobial and Anti-Inflammatory Agent" Antioxidants 12, no. 10: 1807. https://doi.org/10.3390/antiox12101807