
Leukocyte Telomere Length Variability as a Potential Biomarker in Patients with PolyQ Diseases

 , , , , , , , and
Abstract
:1. Introduction
2. Materials and Methods
2.1. Subjects
2.2. Laboratory Methods
2.3. Statistical Analysis
3. Results
3.1. Subjects
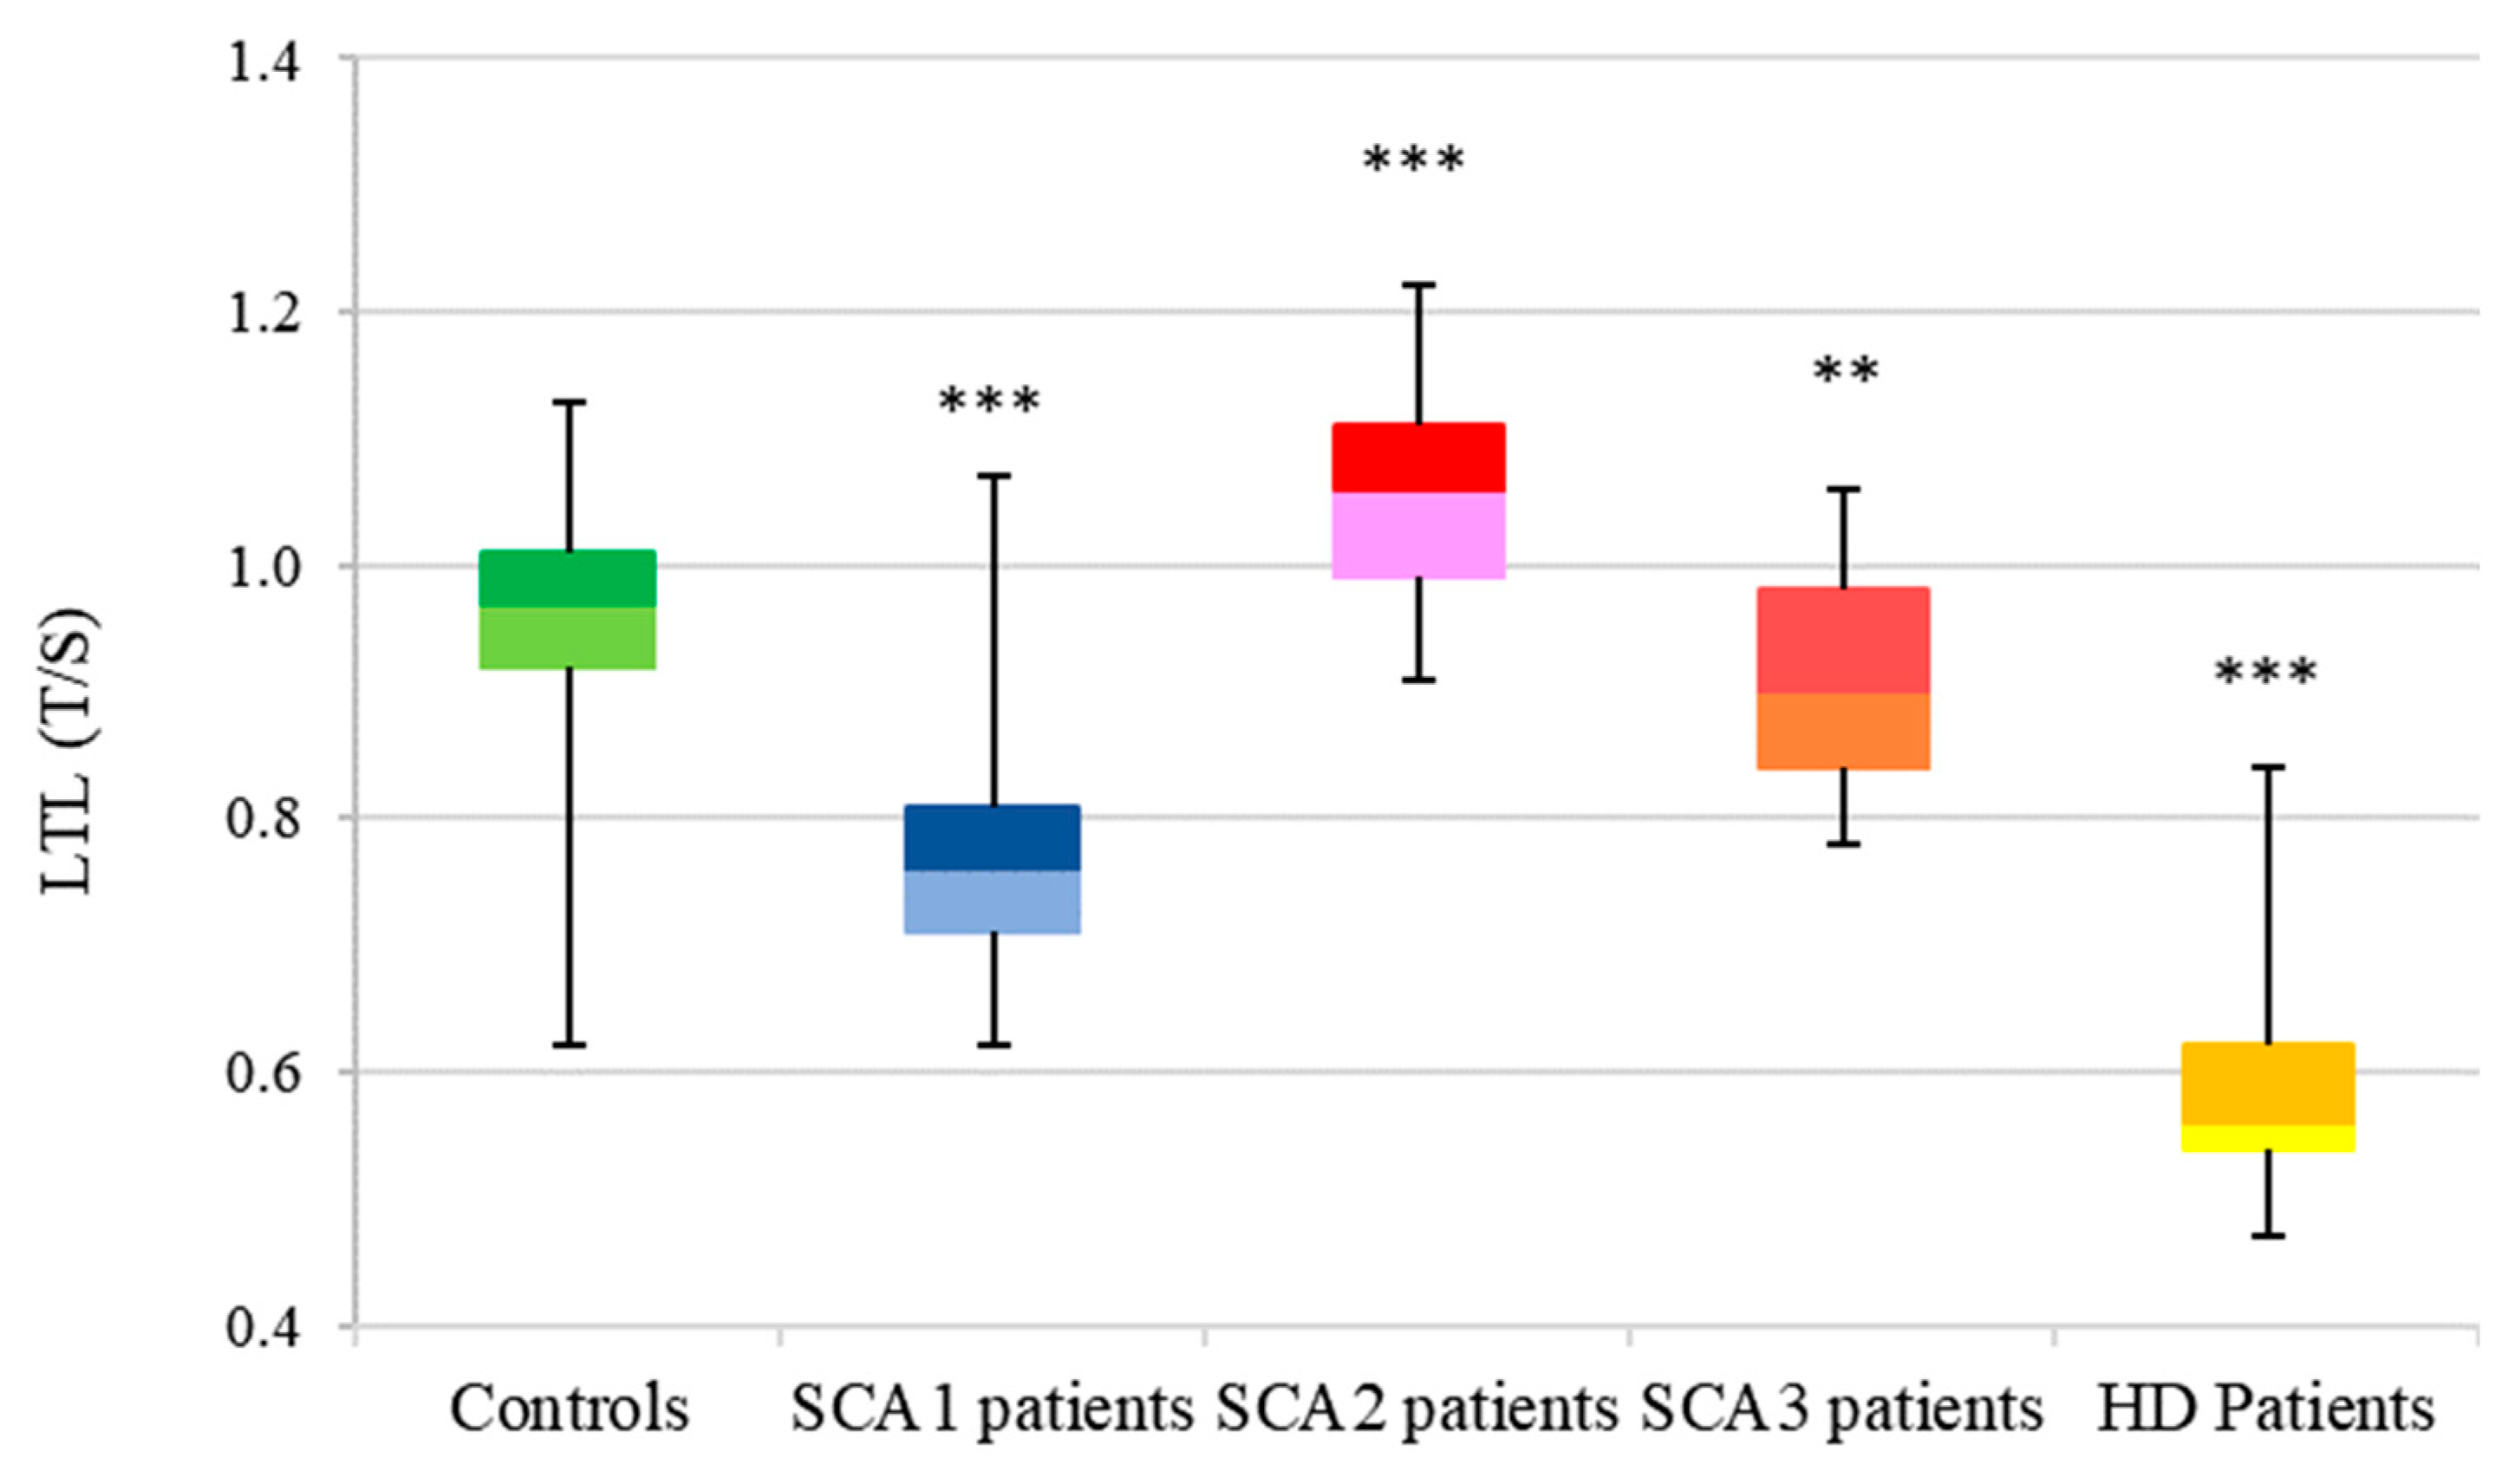
3.2. LTL Analysis
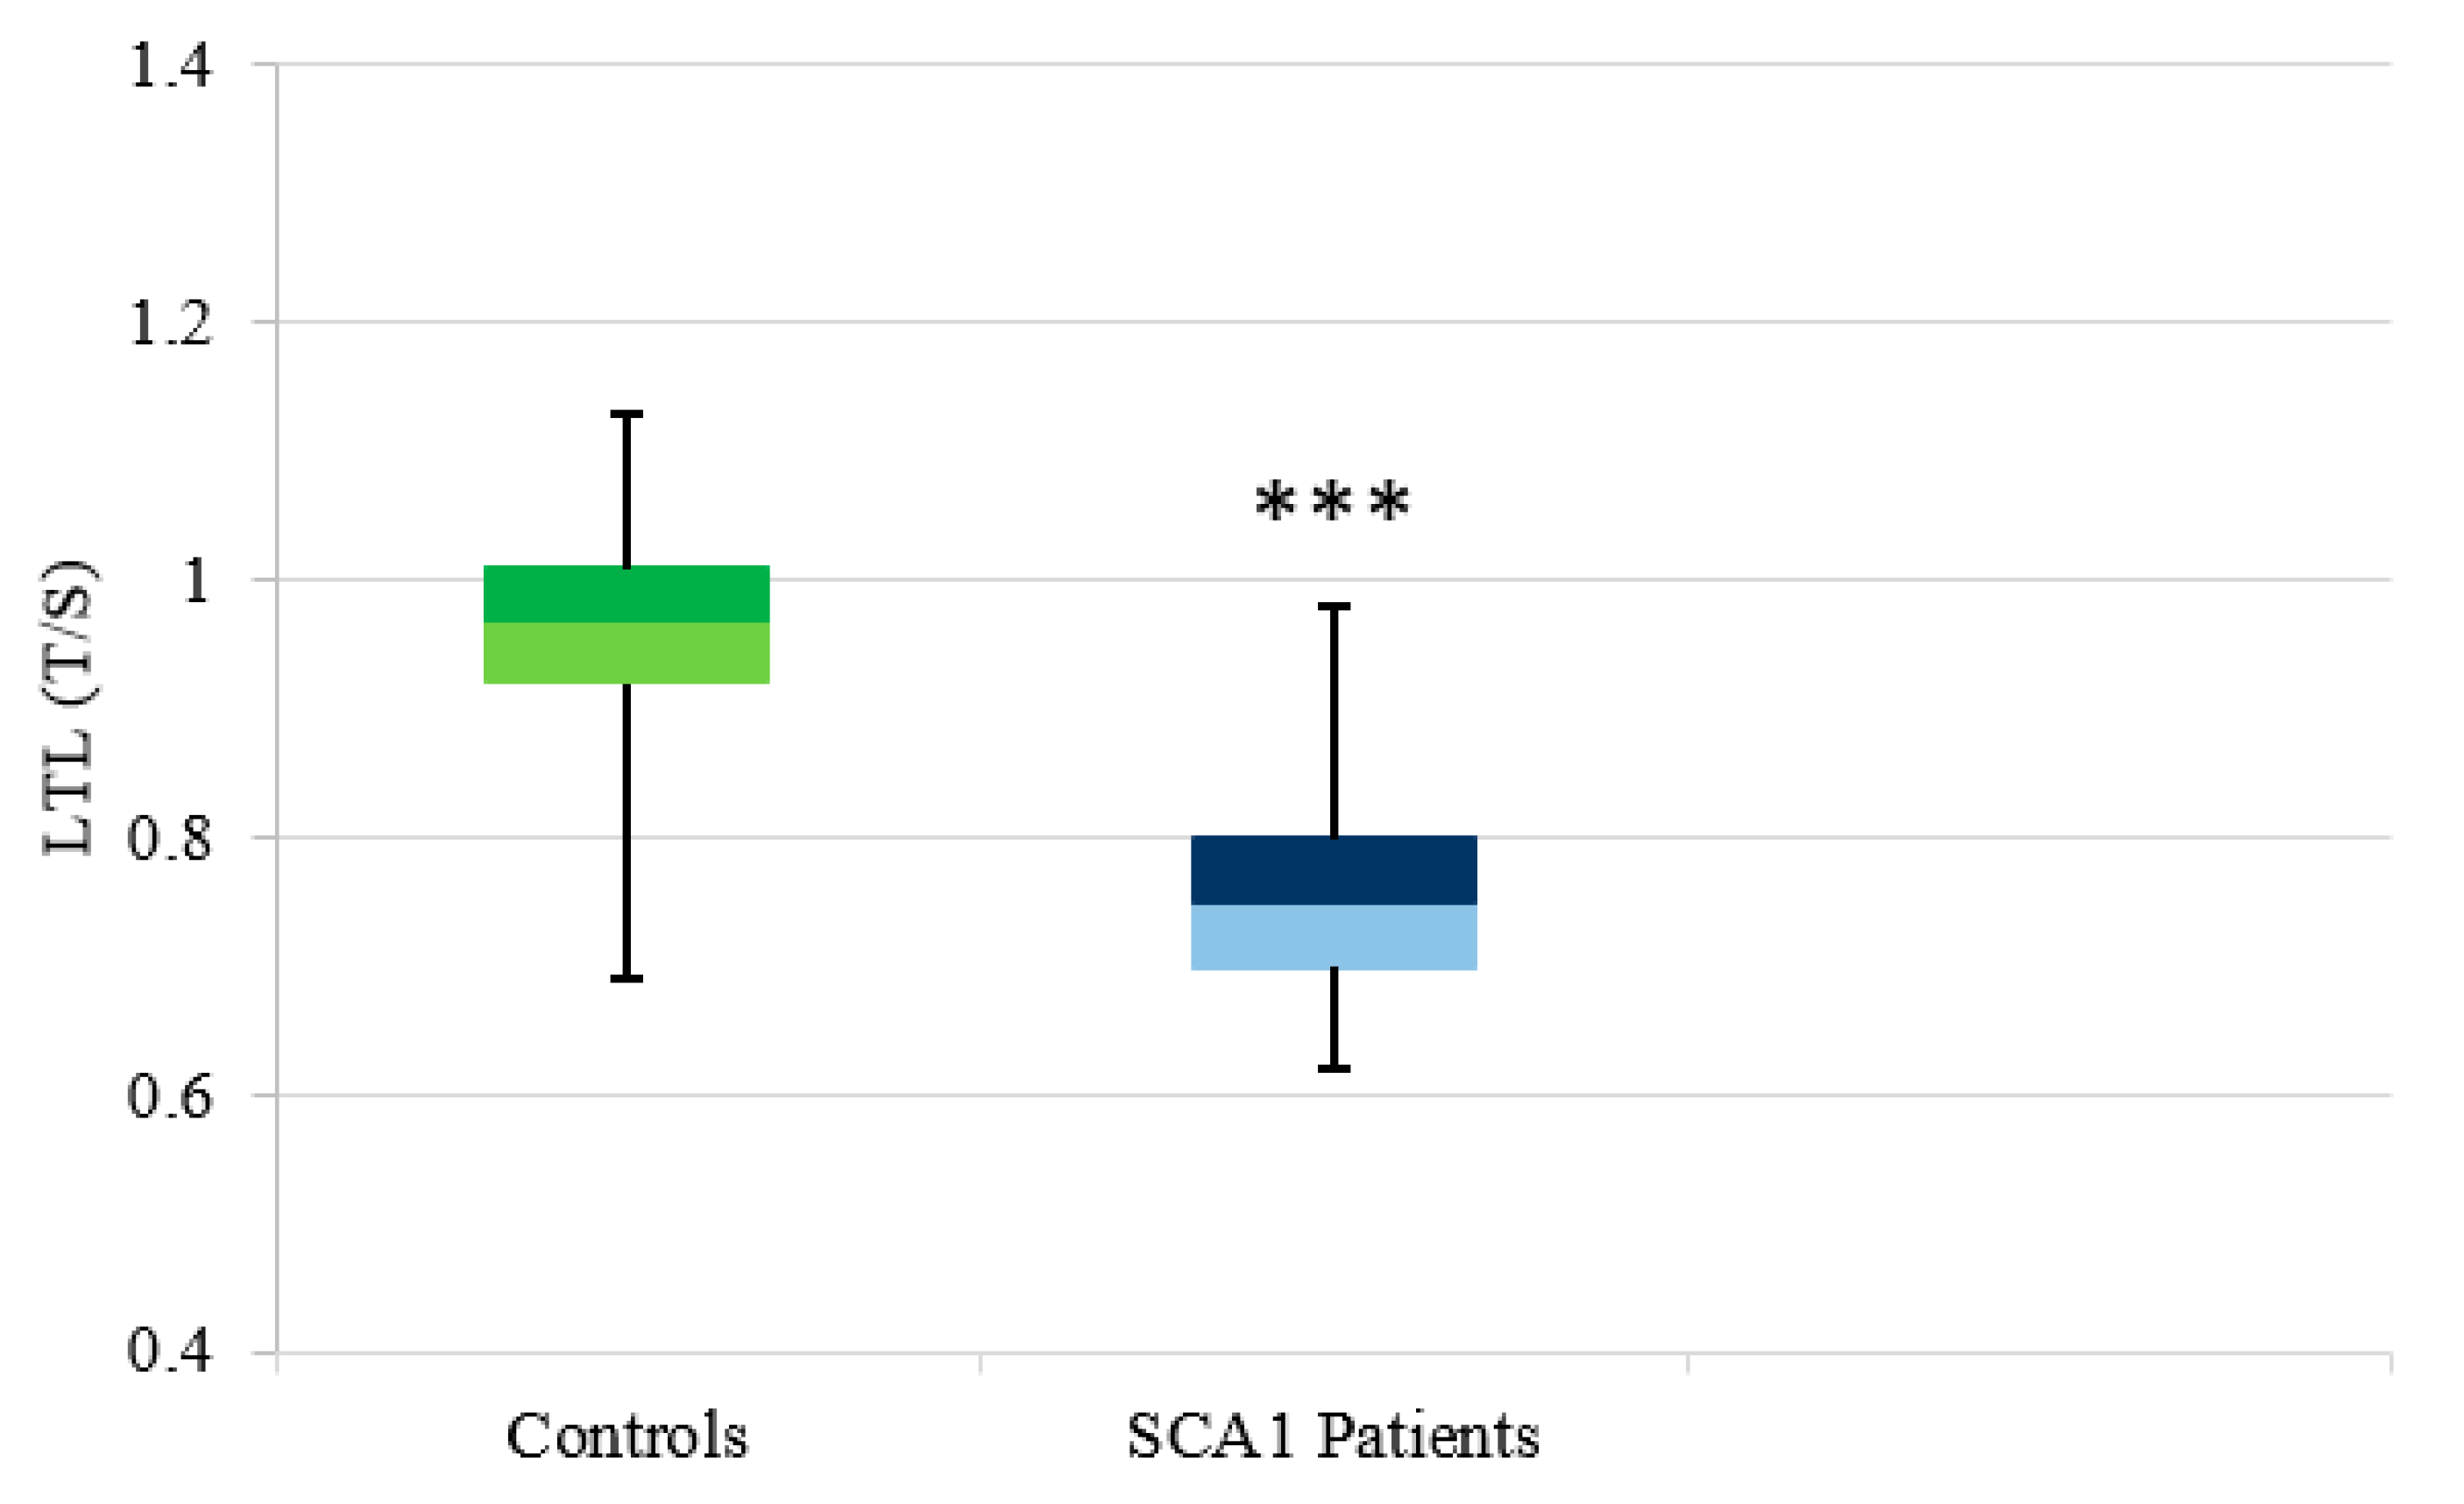
3.2.1. SCA1
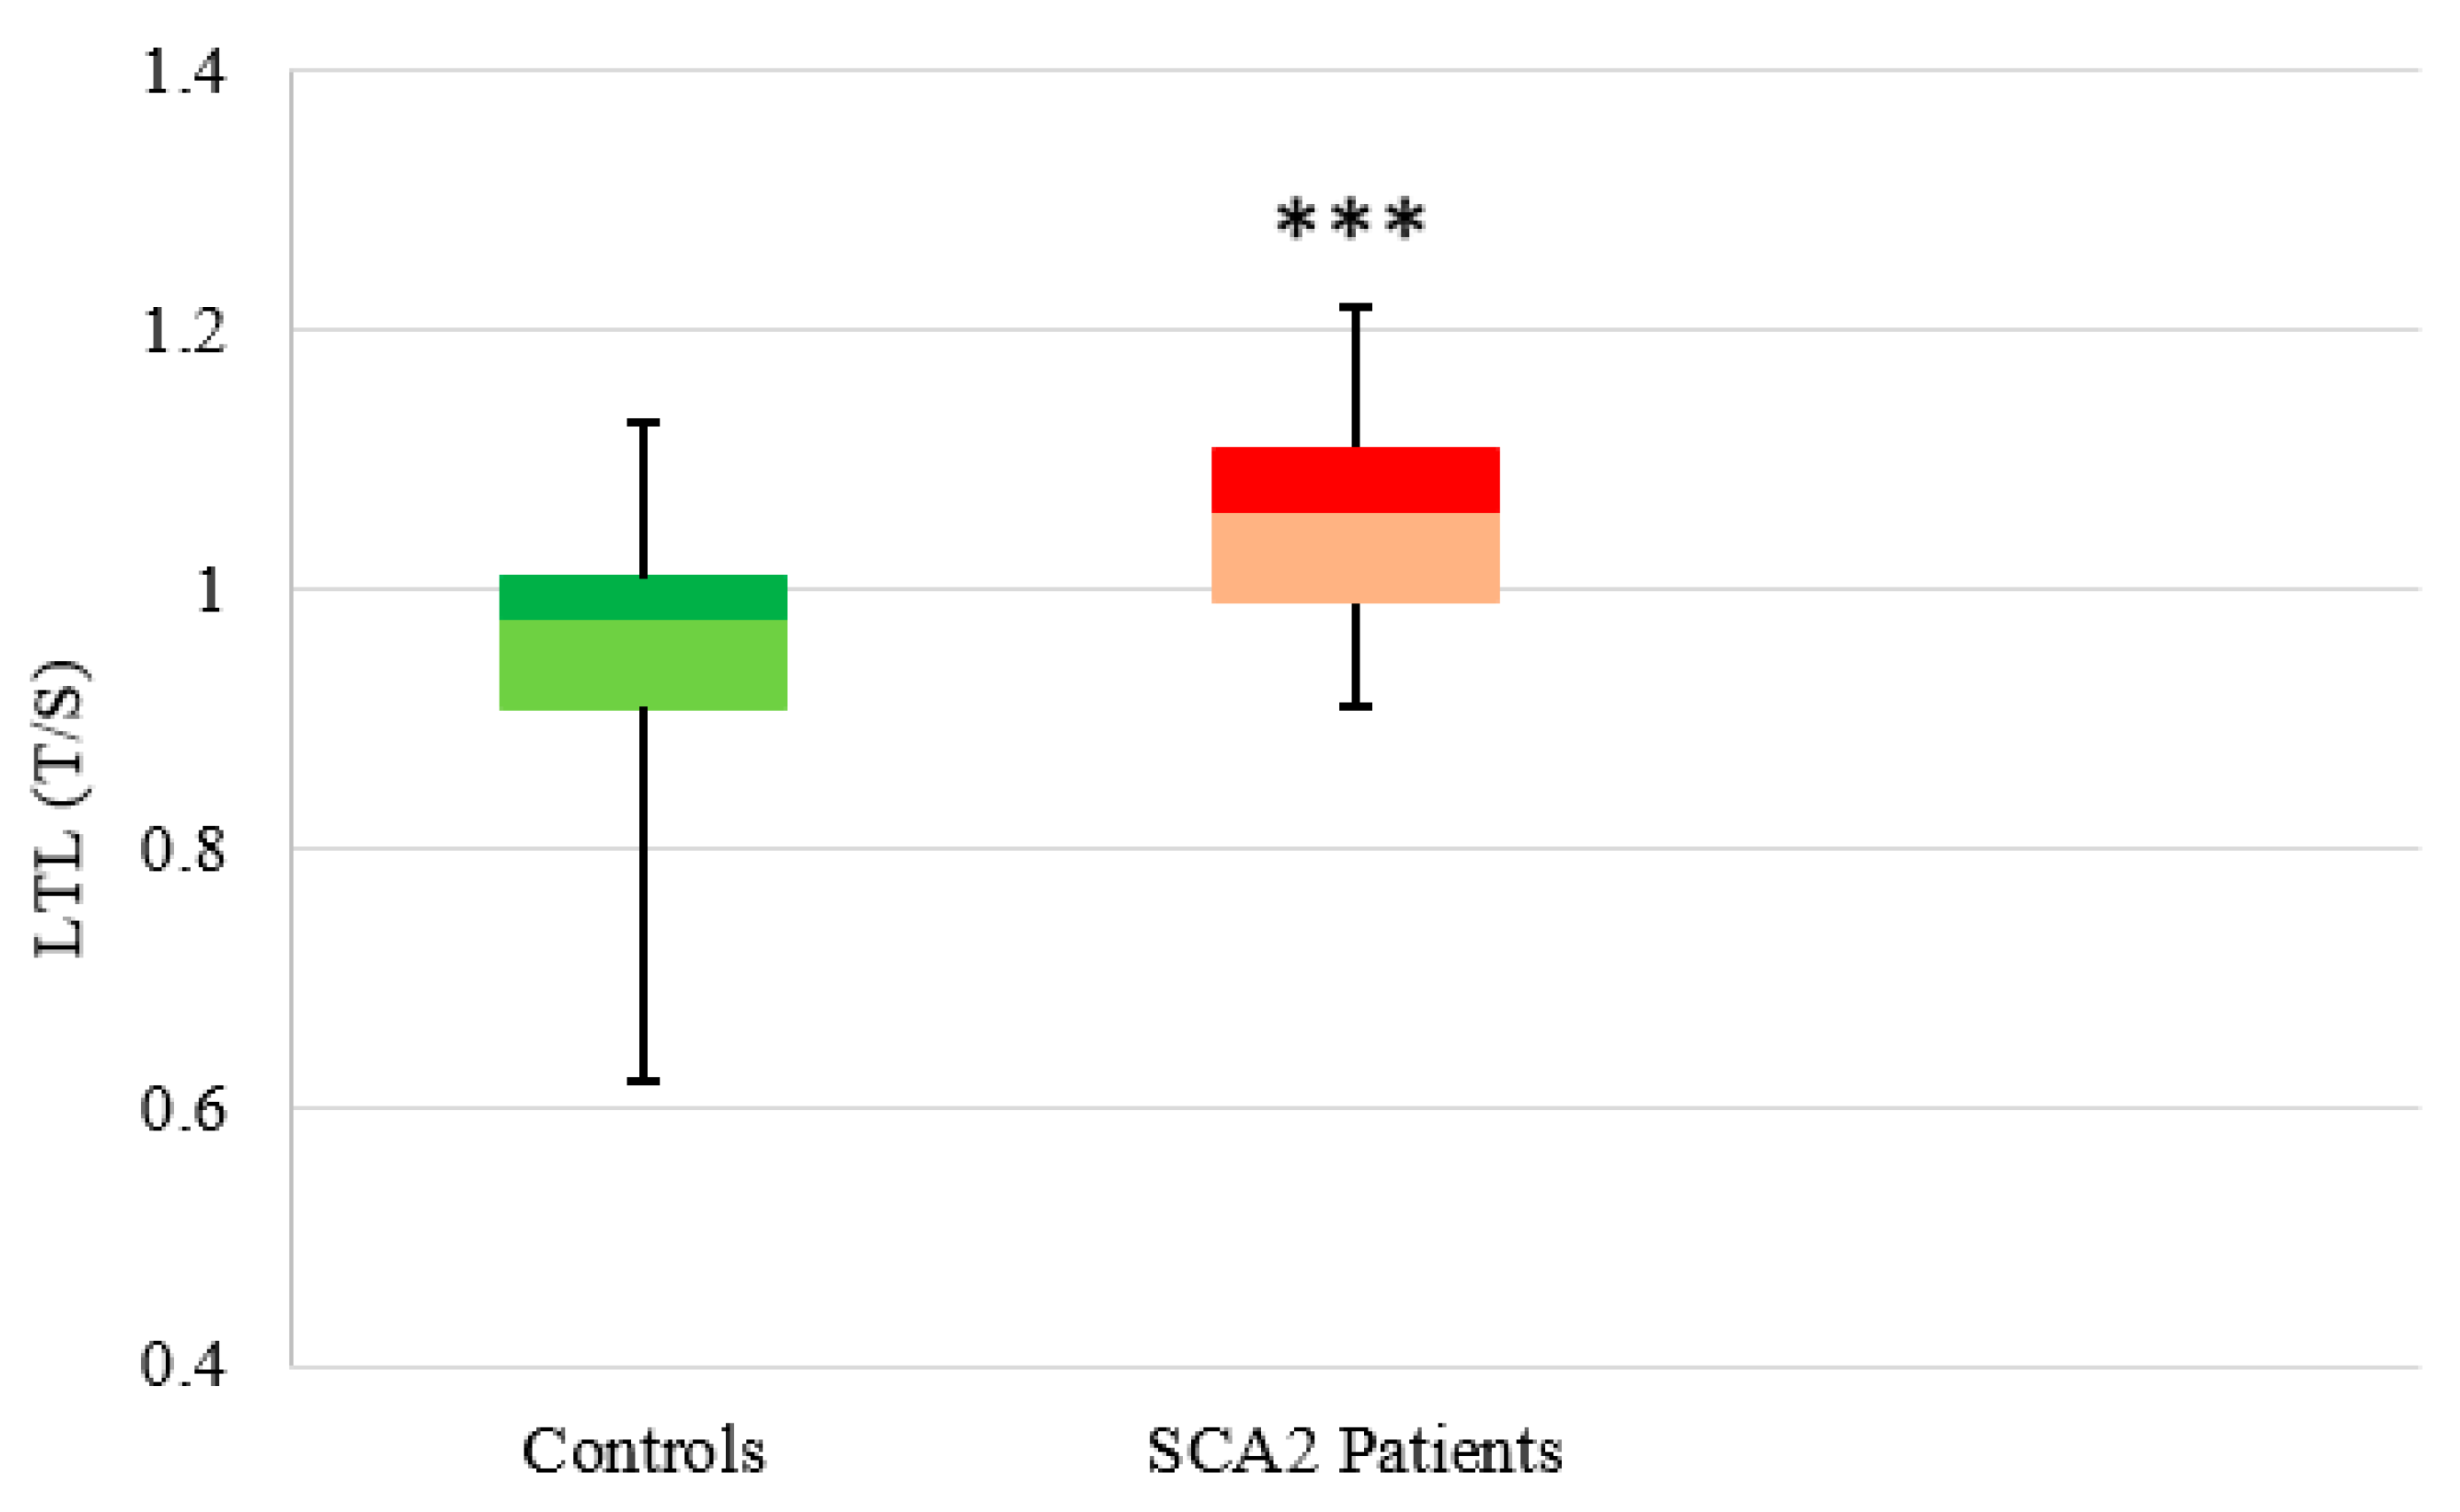
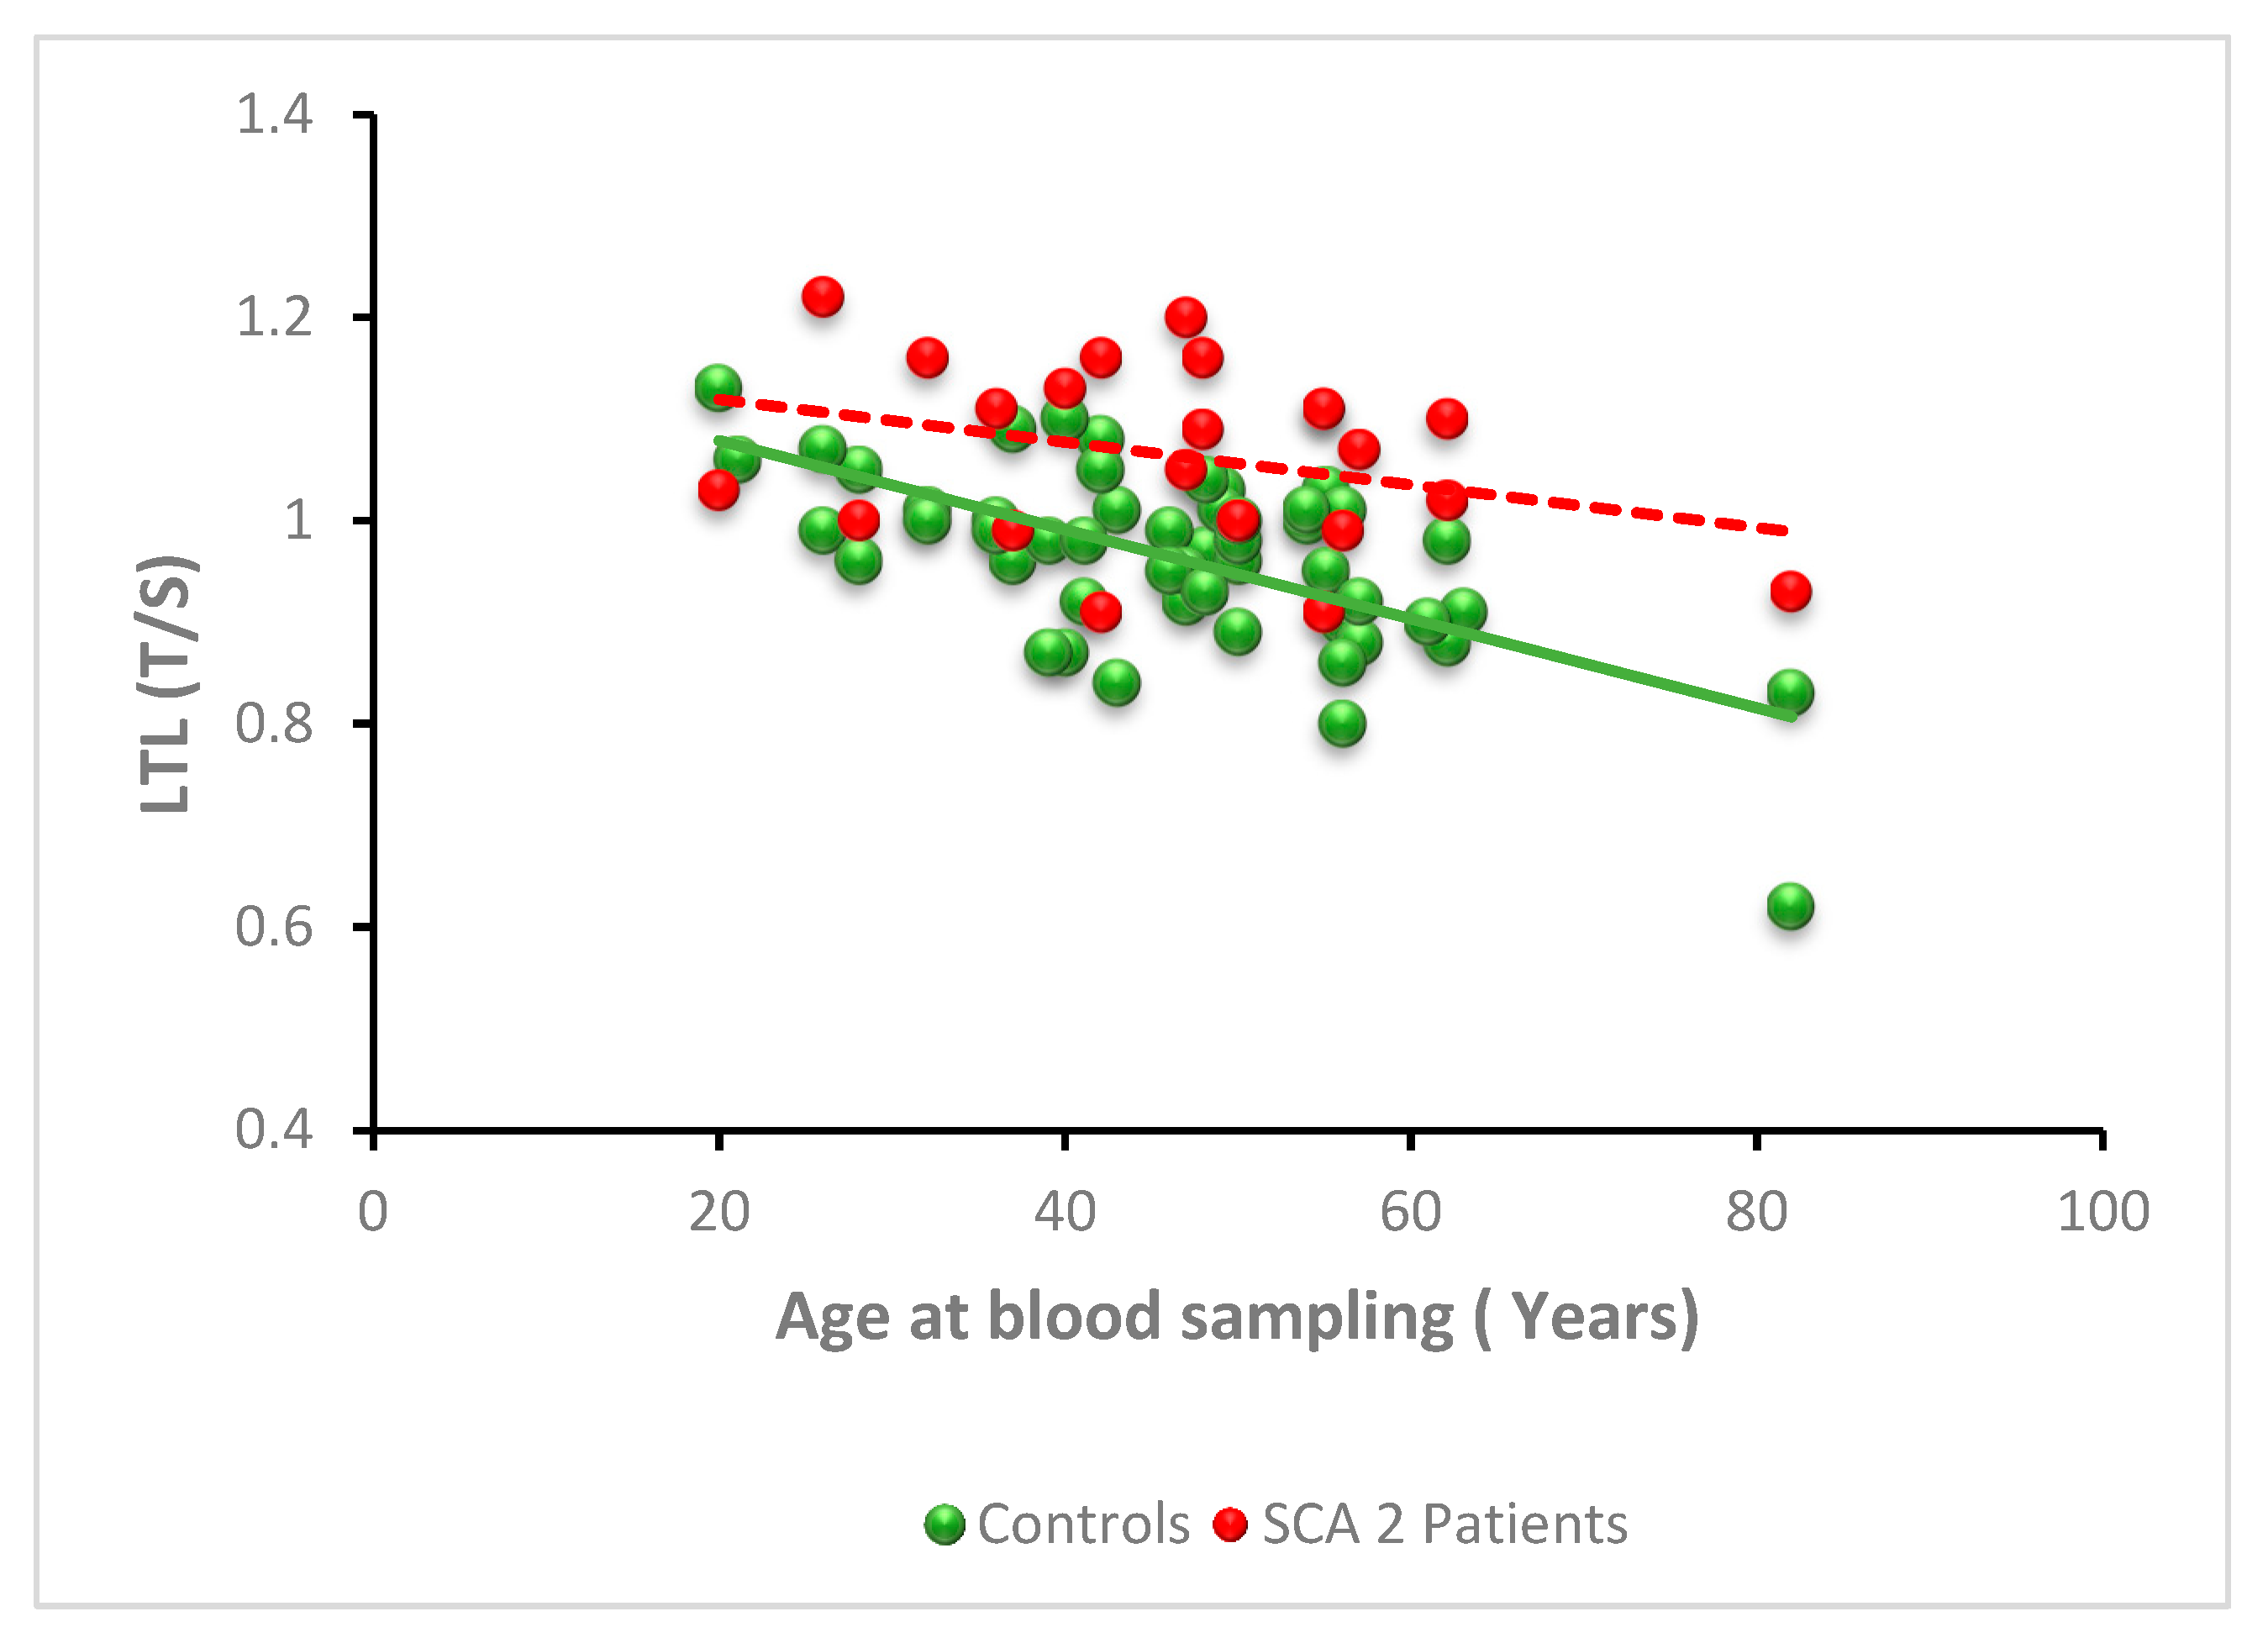
3.2.2. SCA2
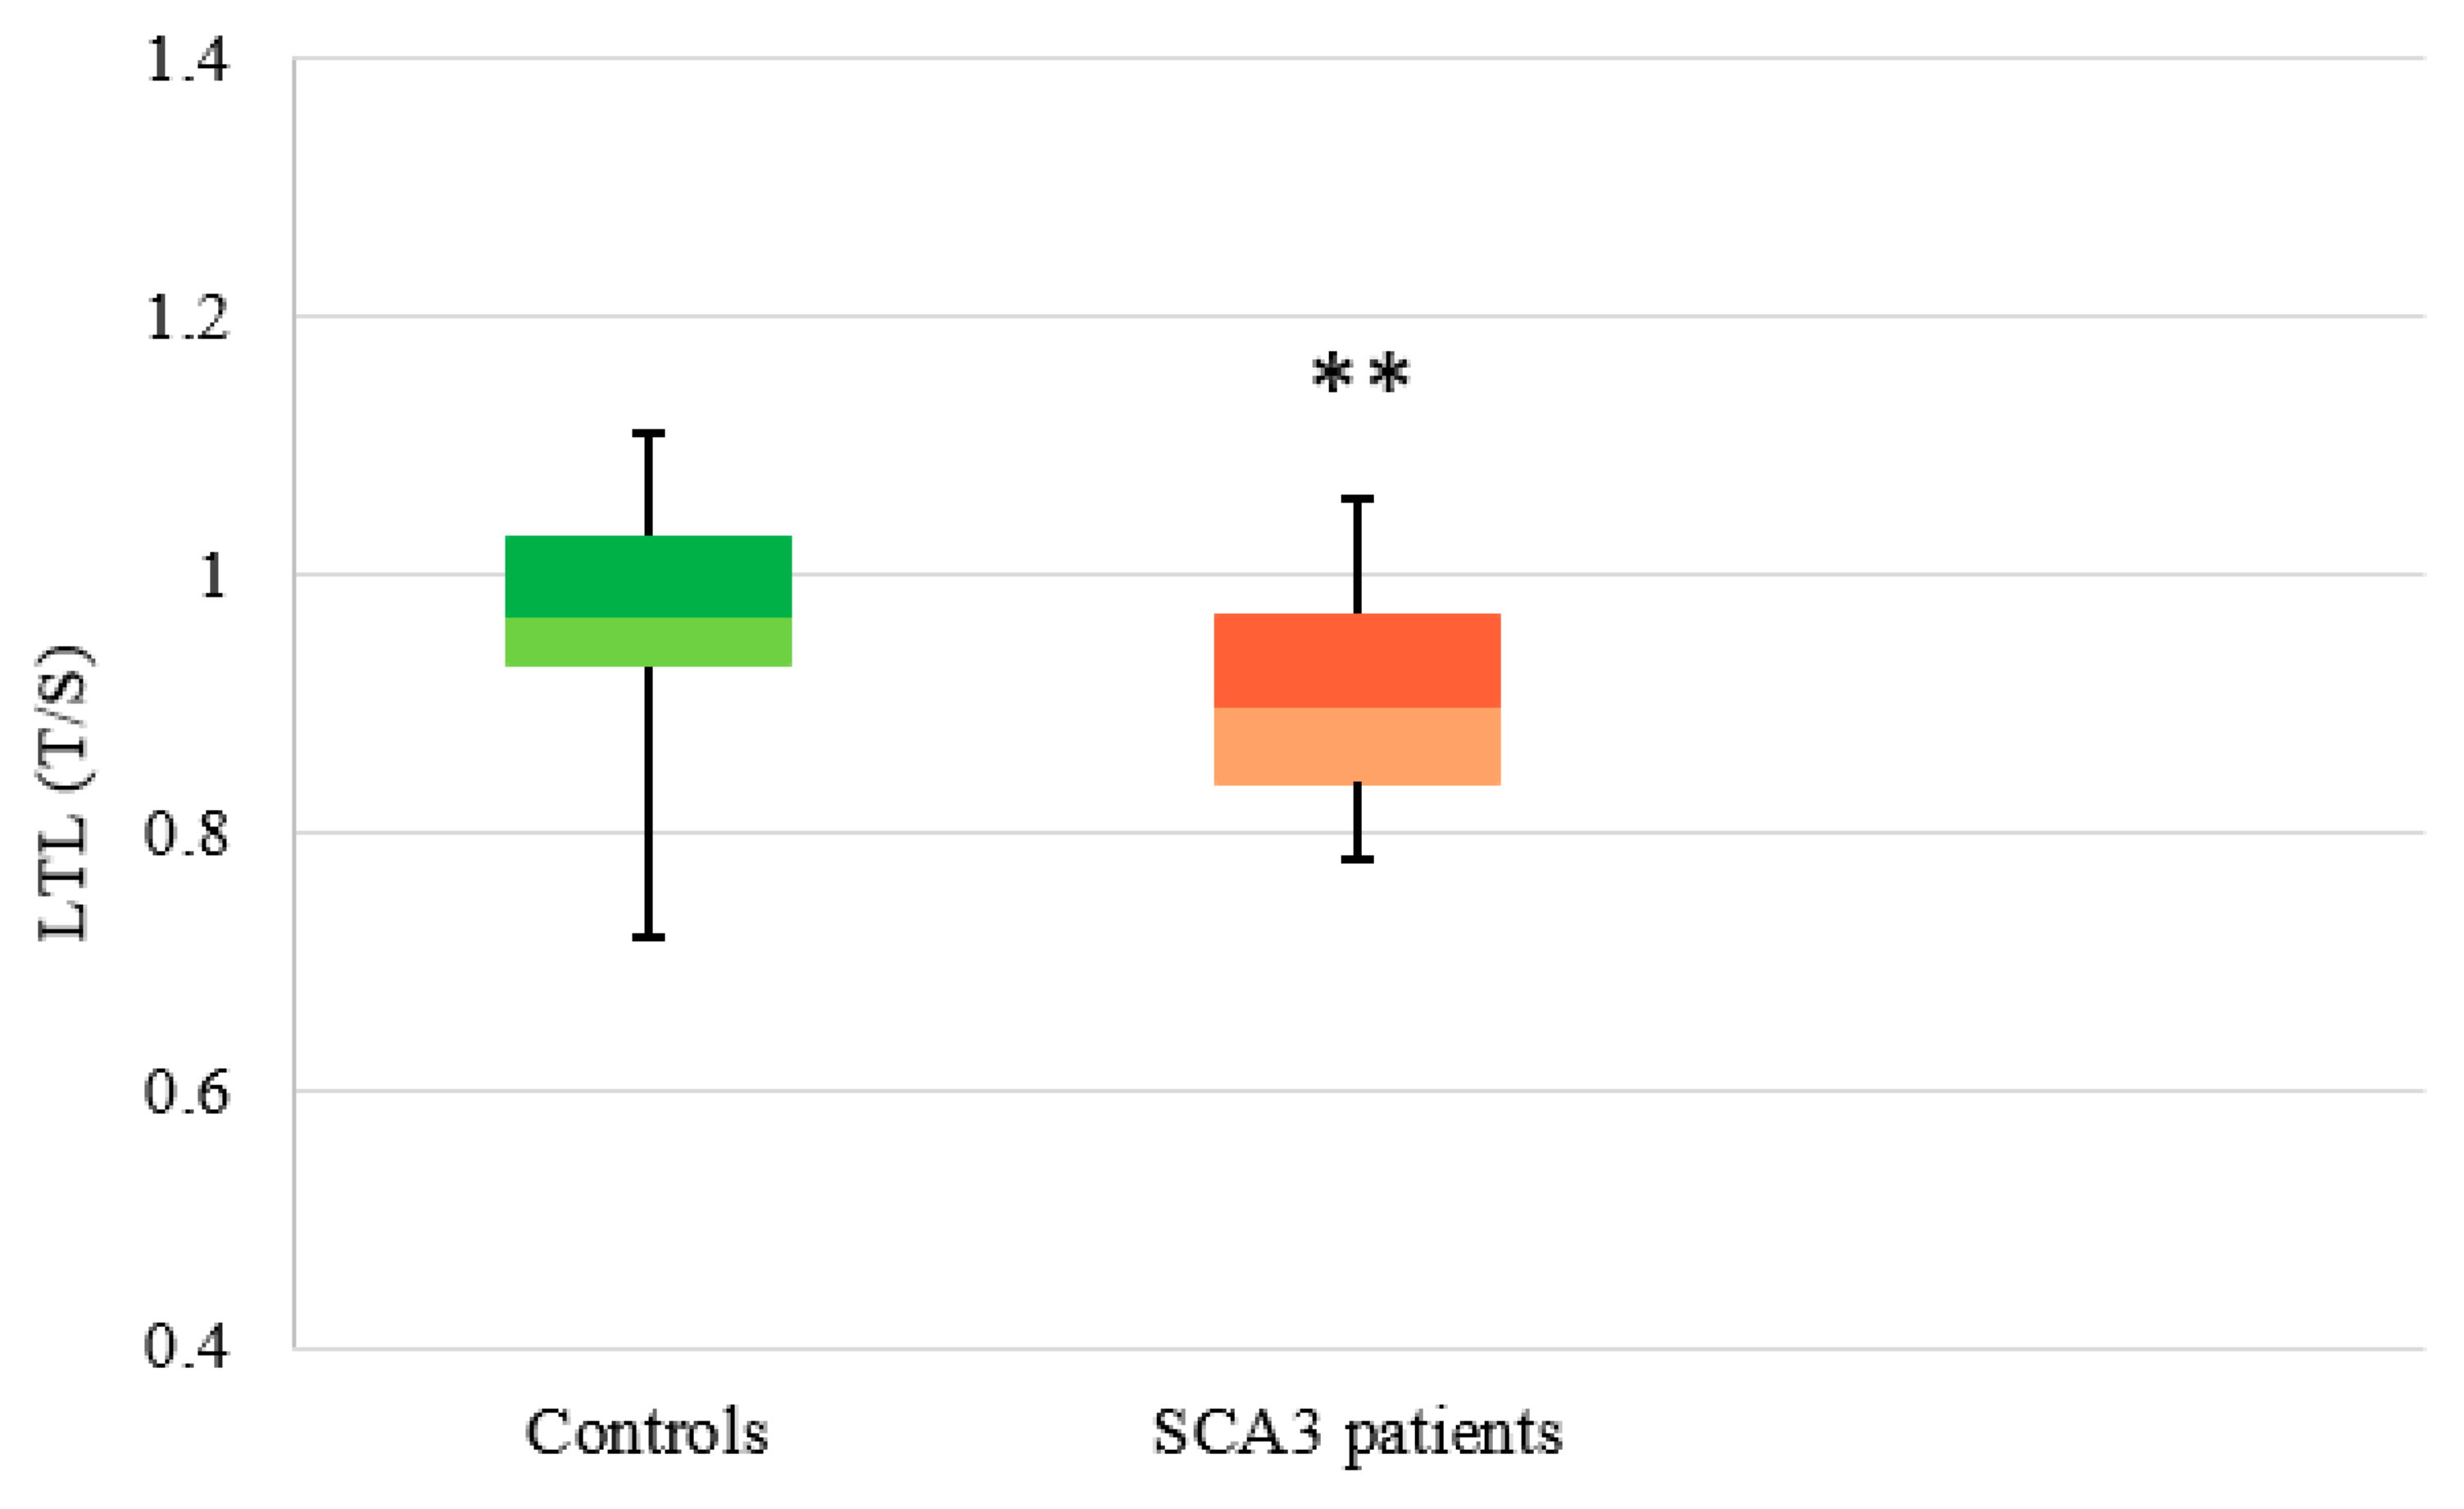
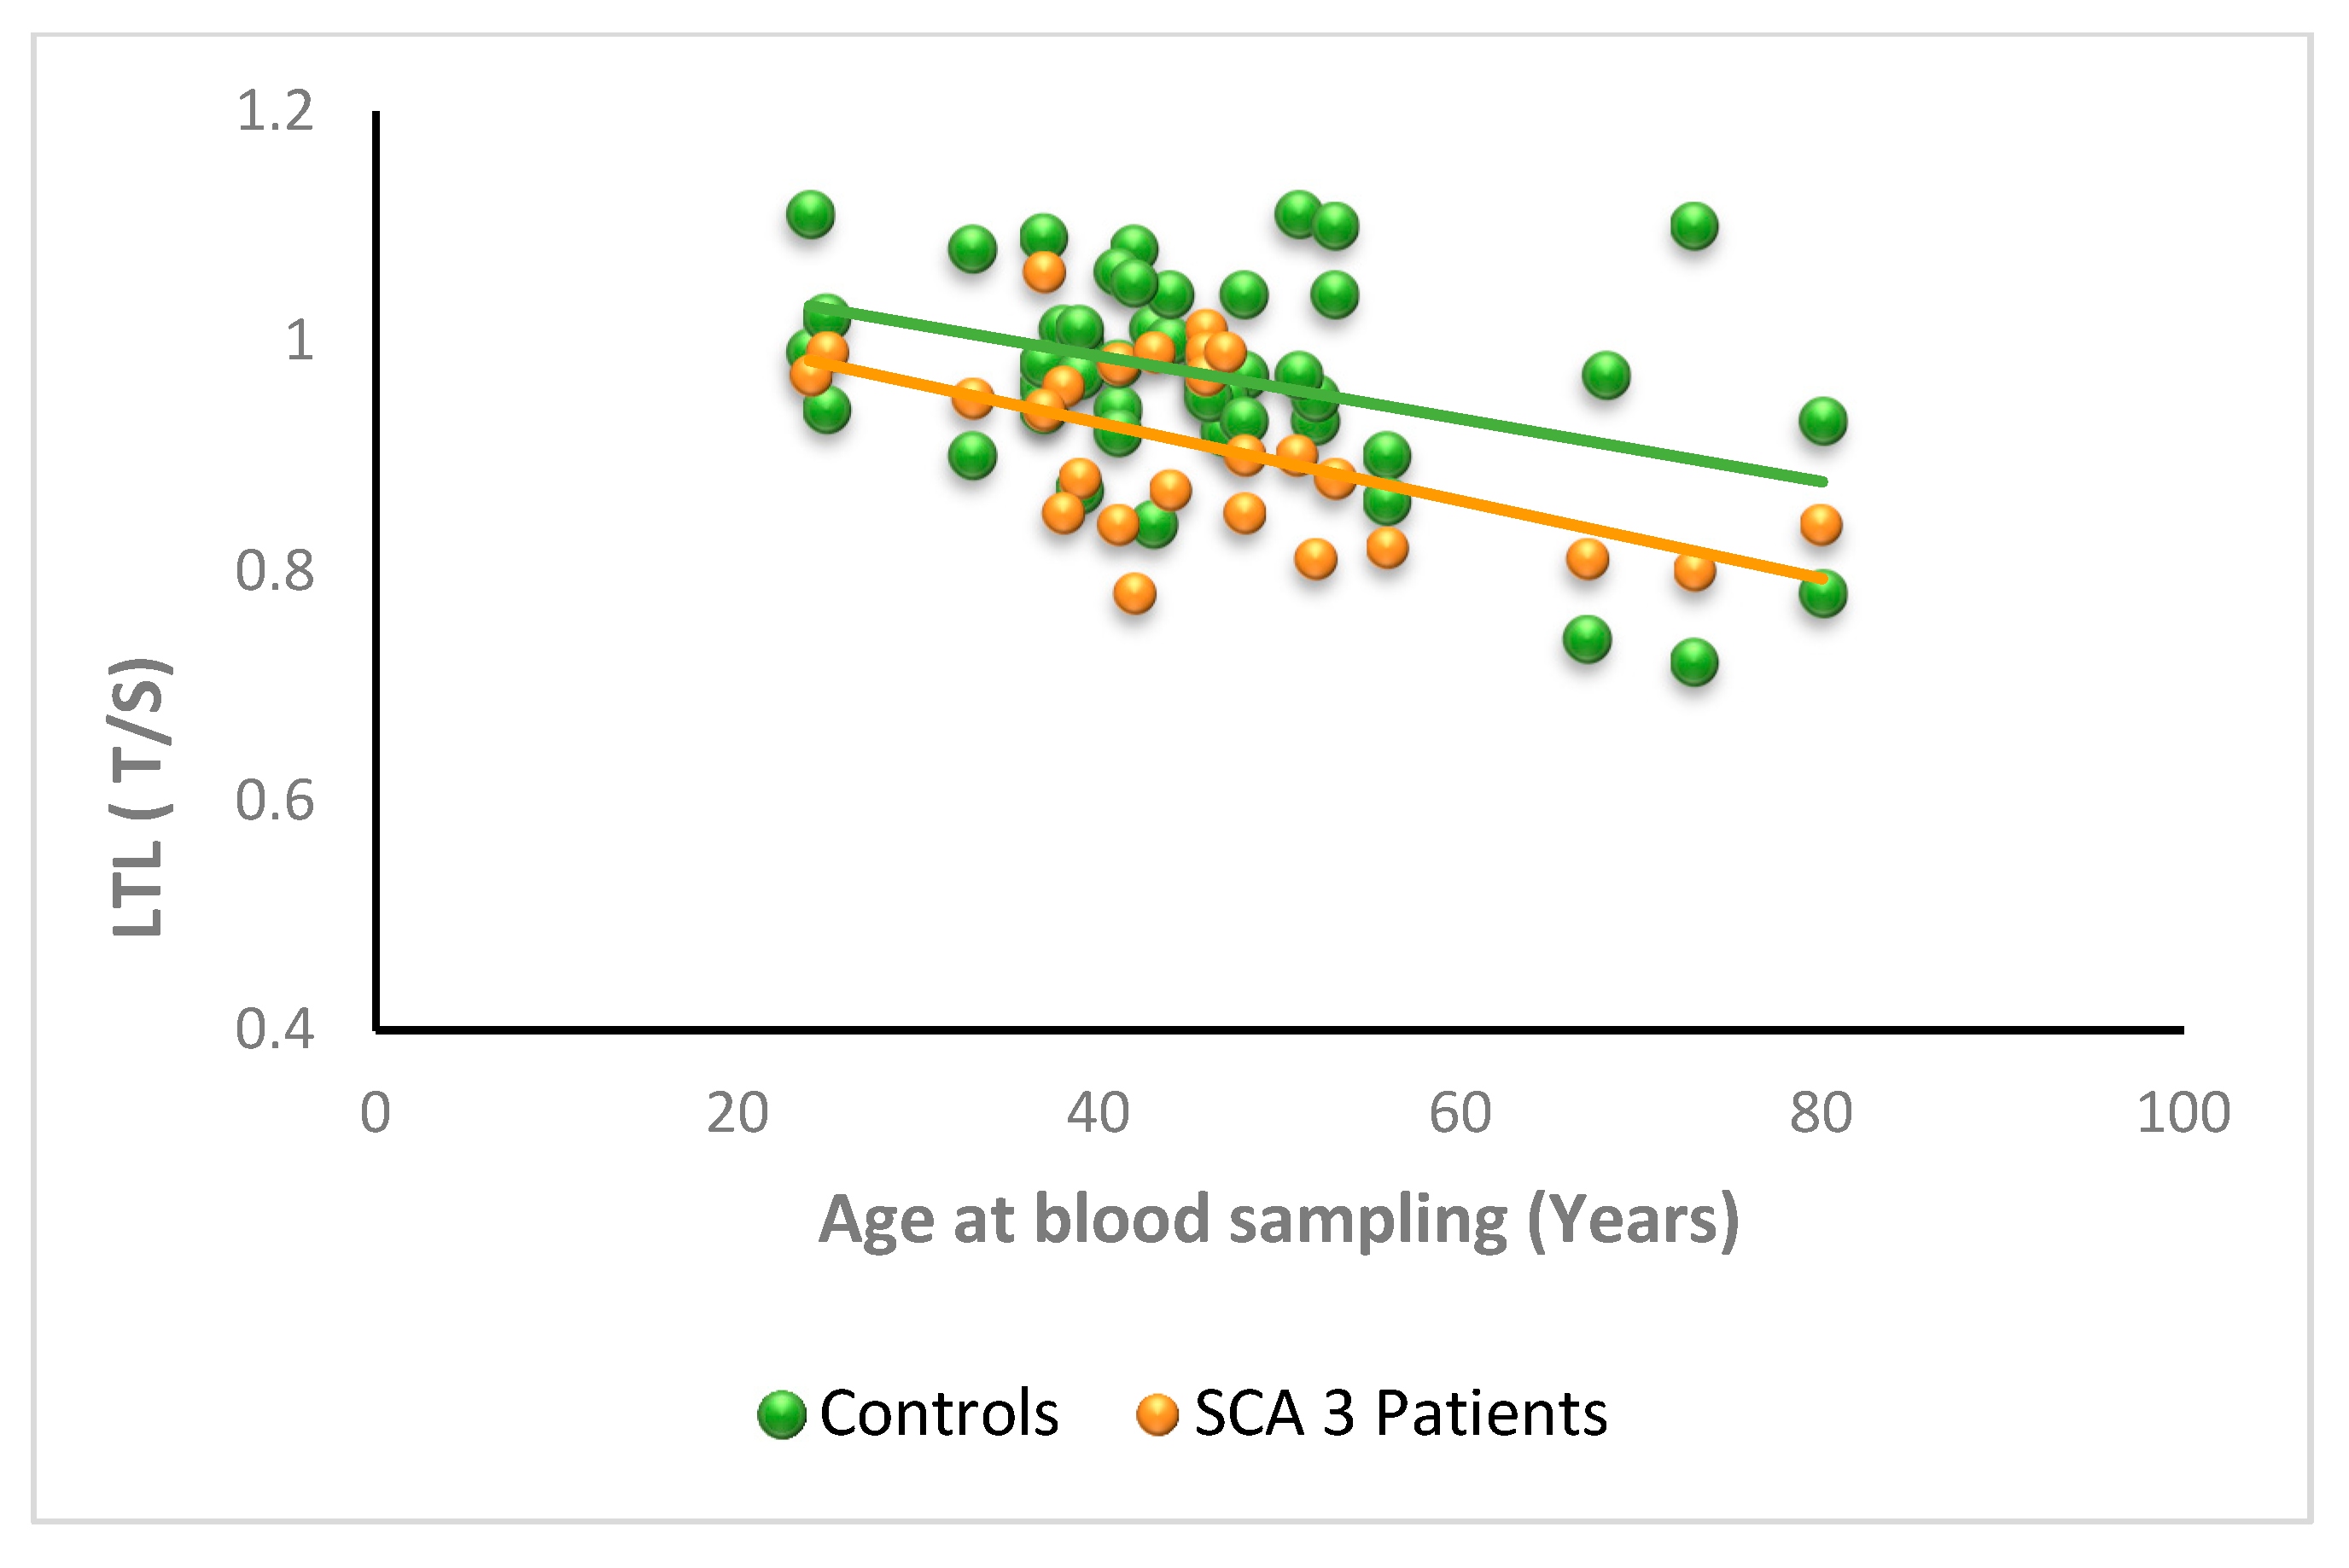
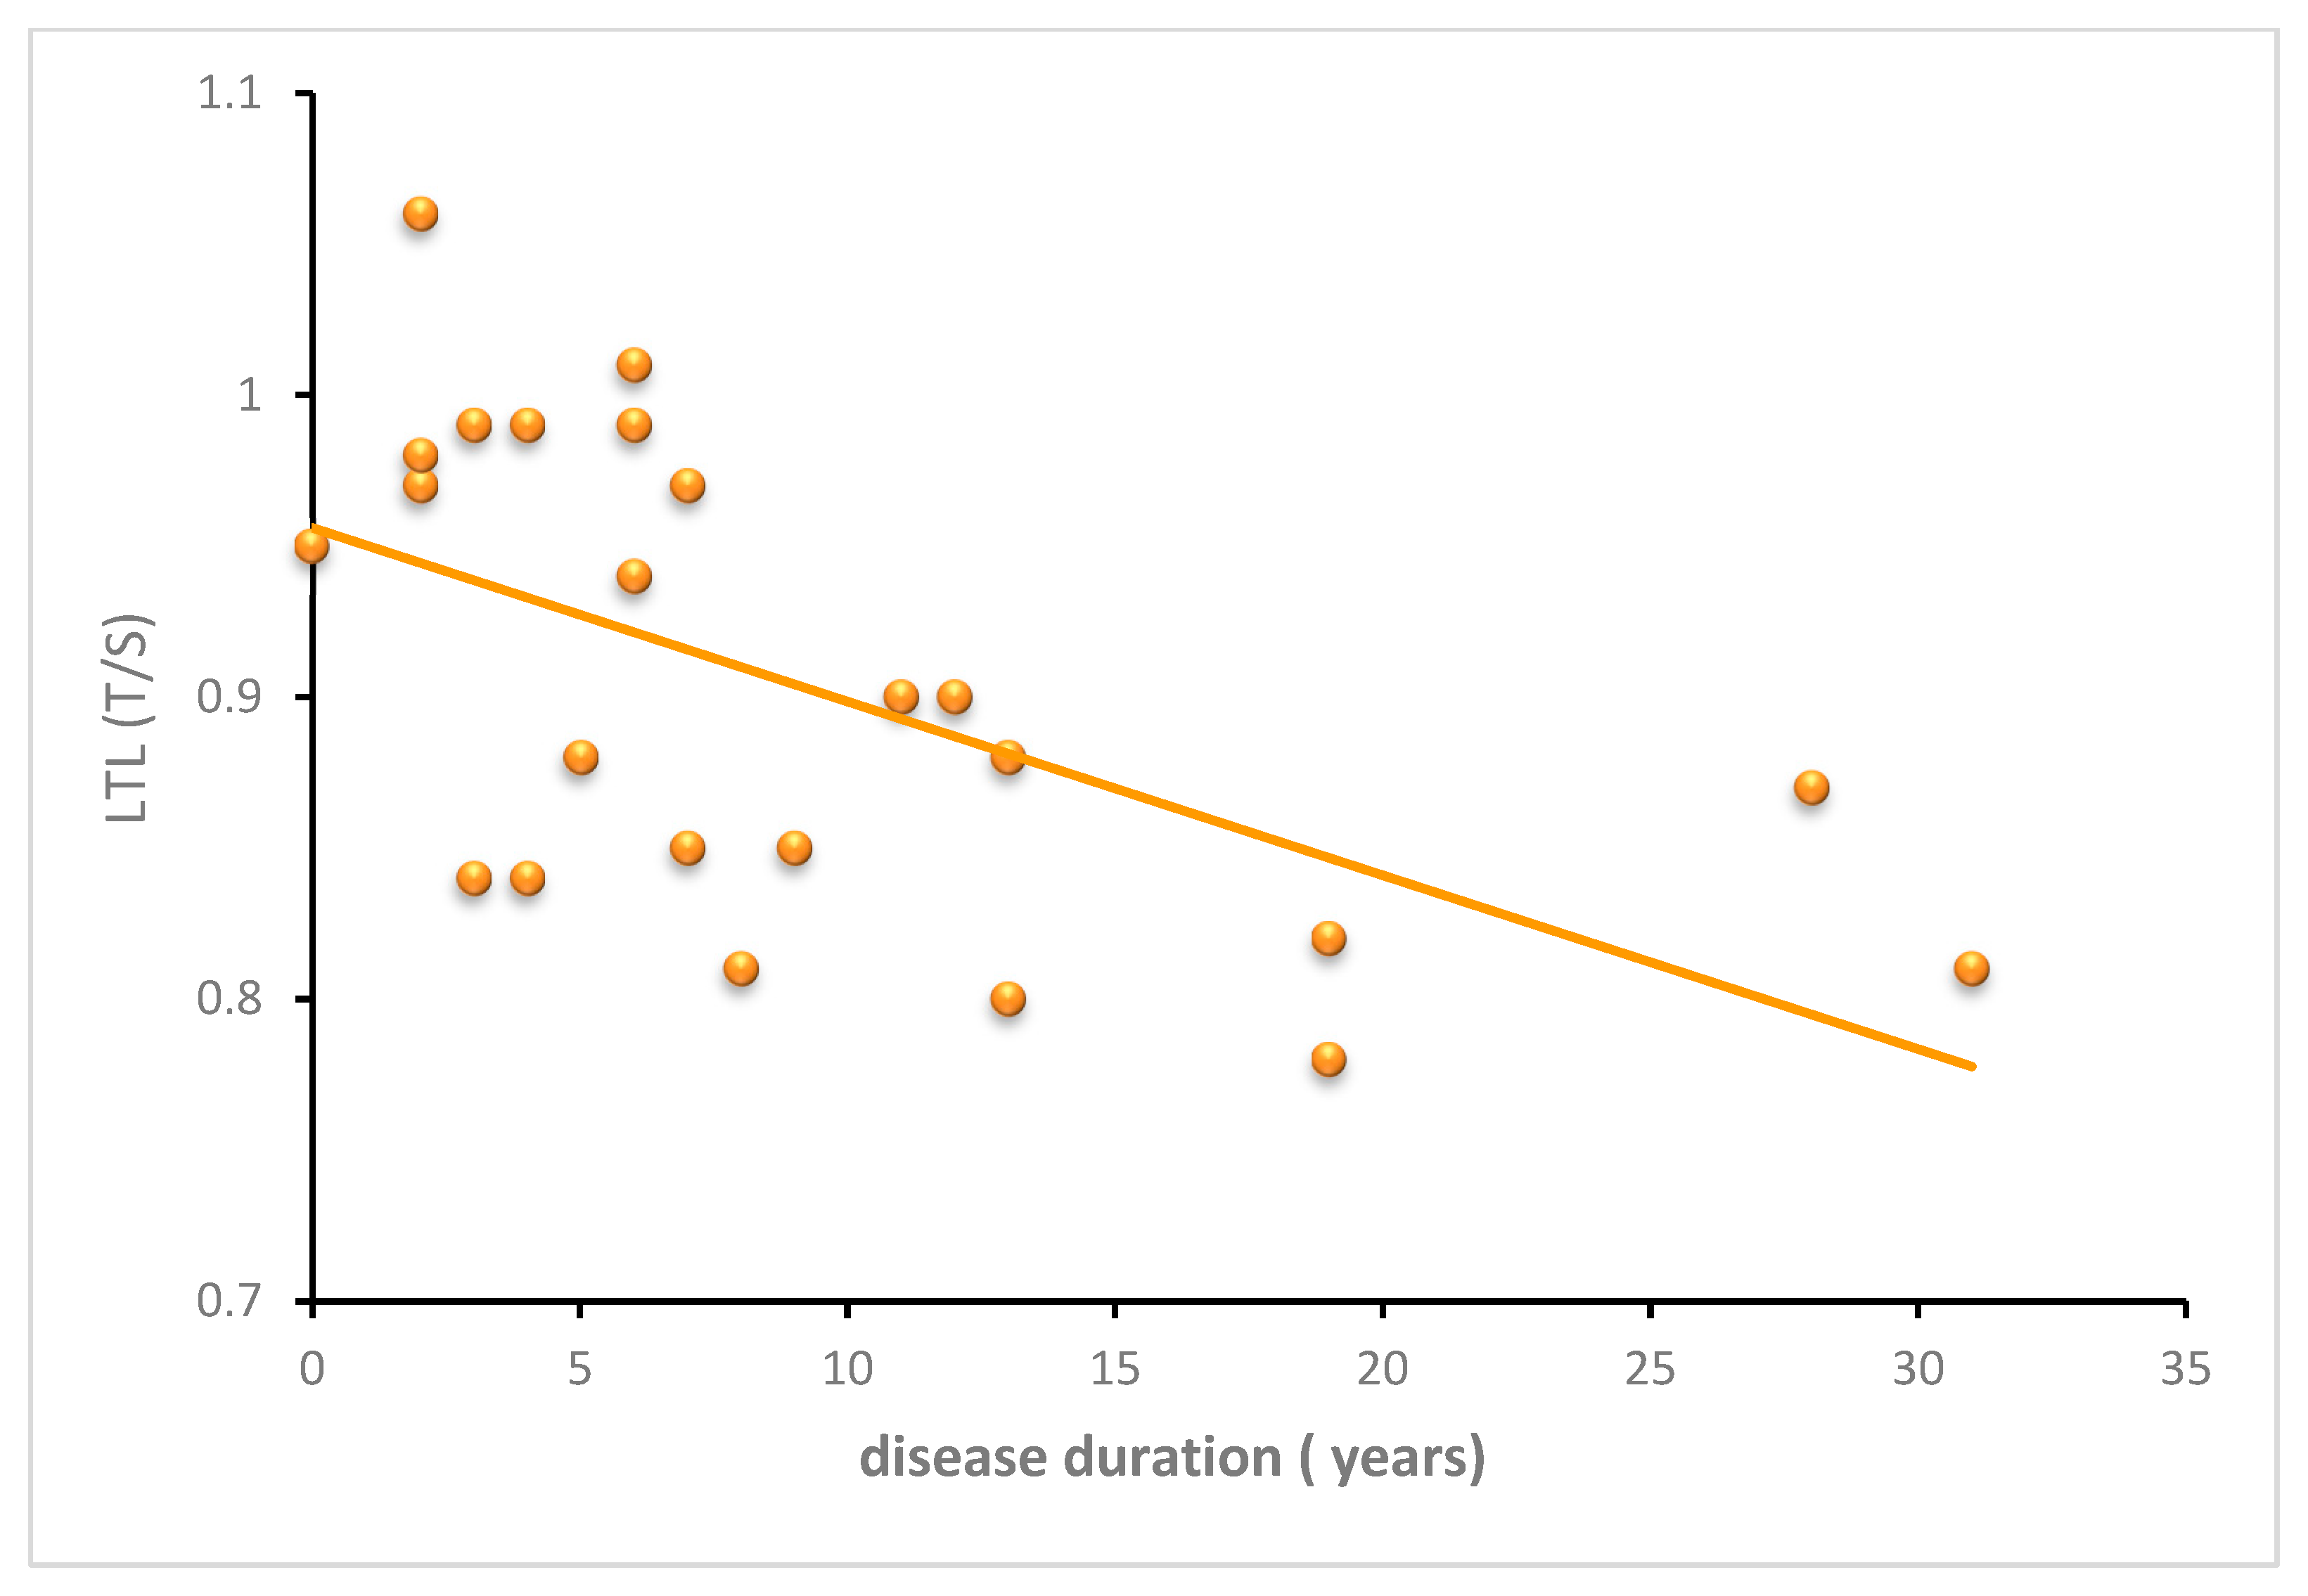
3.2.3. SCA3
4. Discussion
5. Conclusions
Supplementary Materials
Author Contributions
Funding
Institutional Review Board Statement
Informed Consent Statement
Data Availability Statement
Acknowledgments
Conflicts of Interest
References
- Robinson, K.J.; Watchon, M.; Laird, A.S. Aberrant Cerebellar Circuitry in the Spinocerebellar Ataxias. Front. Neurosci. 2020, 14, 707. [Google Scholar] [CrossRef] [PubMed]
- Paulson, H.L.; Shakkottai, V.G.; Clark, H.B.; Orr, H.T. Polyglutamine Spinocerebellar Ataxias—From Genes to Potential Treatments. Nat. Rev. Neurosci. 2017, 18, 613–626. [Google Scholar] [CrossRef] [PubMed]
- Ashizawa, T.; Öz, G.; Paulson, H.L. Spinocerebellar Ataxias: Prospects and Challenges for Therapy Development. Nat. Rev. Neurol. 2018, 14, 590–605. [Google Scholar] [CrossRef] [PubMed]
- Klockgether, T.; Mariotti, C.; Paulson, H.L. Spinocerebellar Ataxia. Nat. Rev. Dis. Primers 2019, 5, 24. [Google Scholar] [CrossRef] [PubMed]
- van de Warrenburg, B.P.C.; Hendriks, H.; Dürr, A.; van Zuijlen, M.C.A.; Stevanin, G.; Camuzat, A.; Sinke, R.J.; Brice, A.; Kremer, B.P.H. Age at Onset Variance Analysis in Spinocerebellar Ataxias: A Study in a Dutch-French Cohort. Ann. Neurol. 2005, 57, 505–512. [Google Scholar] [CrossRef] [PubMed]
- Matilla-Dueñas, A.; Corral-Juan, M.; Volpini, V.; Sanchez, I. The Spinocerebellar Ataxias: Clinical Aspects and Molecular Genetics. Adv. Exp. Med. Biol. 2012, 724, 351–374. [Google Scholar] [CrossRef] [PubMed]
- Kasumu, A.; Bezprozvanny, I. Deranged Calcium Signaling in Purkinje Cells and Pathogenesis in Spinocerebellar Ataxia 2 (SCA2) and Other Ataxias. Cerebellum 2012, 11, 630–639. [Google Scholar] [CrossRef] [Green Version]
- Gilman, S.; Sima, A.A.; Junck, L.; Kluin, K.J.; Koeppe, R.A.; Lohman, M.E.; Little, R. Spinocerebellar Ataxia Type 1 with Multiple System Degeneration and Glial Cytoplasmic Inclusions. Ann. Neurol. 1996, 39, 241–255. [Google Scholar] [CrossRef]
- Cvetanovic, M.; Ingram, M.; Orr, H.; Opal, P. Early Activation of Microglia and Astrocytes in Mouse Models of Spinocerebellar Ataxia Type 1. Neuroscience 2015, 289, 289–299. [Google Scholar] [CrossRef] [Green Version]
- Qu, W.; Johnson, A.; Kim, J.H.; Lukowicz, A.; Svedberg, D.; Cvetanovic, M. Inhibition of Colony-Stimulating Factor 1 Receptor Early in Disease Ameliorates Motor Deficits in SCA1 Mice. J. Neuroinflamm. 2017, 14, 107. [Google Scholar] [CrossRef]
- Zhou, L.; Wang, H.; Wang, P.; Ren, H.; Chen, D.; Ying, Z.; Wang, G. Ataxin-3 Protects Cells against H2O2-Induced Oxidative Stress by Enhancing the Interaction between Bcl-X(L) and Bax. Neuroscience 2013, 243, 14–21. [Google Scholar] [CrossRef] [PubMed]
- De Assis, A.M.; Saute, J.A.M.; Longoni, A.; Haas, C.B.; Torrez, V.R.; Brochier, A.W.; Souza, G.N.; Furtado, G.V.; Gheno, T.C.; Russo, A.; et al. Peripheral Oxidative Stress Biomarkers in Spinocerebellar Ataxia Type 3/Machado-Joseph Disease. Front. Neurol. 2017, 8, 485. [Google Scholar] [CrossRef] [PubMed] [Green Version]
- Chiu, Y.-J.; Lin, S.-A.; Chen, W.-L.; Lin, T.-H.; Lin, C.-H.; Yao, C.-F.; Lin, W.; Wu, Y.-R.; Chang, K.-H.; Lee-Chen, G.-J.; et al. Pathomechanism Characterization and Potential Therapeutics Identification for SCA3 Targeting Neuroinflammation. Aging 2020, 12, 23619–23646. [Google Scholar] [CrossRef] [PubMed]
- Cornelius, N.; Wardman, J.H.; Hargreaves, I.P.; Neergheen, V.; Bie, A.S.; Tümer, Z.; Nielsen, J.E.; Nielsen, T.T. Evidence of Oxidative Stress and Mitochondrial Dysfunction in Spinocerebellar Ataxia Type 2 (SCA2) Patient Fibroblasts: Effect of Coenzyme Q10 Supplementation on These Parameters. Mitochondrion 2017, 34, 103–114. [Google Scholar] [CrossRef]
- Wong, J.M.Y.; Collins, K. Telomere Maintenance and Disease. Lancet 2003, 362, 983–988. [Google Scholar] [CrossRef]
- Blackburn, E.H.; Greider, C.W.; Szostak, J.W. Telomeres and Telomerase: The Path from Maize, Tetrahymena and Yeast to Human Cancer and Aging. Nat. Med. 2006, 12, 1133–1138. [Google Scholar] [CrossRef]
- Ishaq, A.; Hanson, P.S.; Morris, C.M.; Saretzki, G. Telomerase Activity Is Downregulated Early During Human Brain Development. Genes 2016, 7, 27. [Google Scholar] [CrossRef] [Green Version]
- Cawthon, R.M.; Smith, K.R.; O’Brien, E.; Sivatchenko, A.; Kerber, R.A. Association between Telomere Length in Blood and Mortality in People Aged 60 Years or Older. Lancet 2003, 361, 393–395. [Google Scholar] [CrossRef]
- Kimura, M.; Hjelmborg, J.V.B.; Gardner, J.P.; Bathum, L.; Brimacombe, M.; Lu, X.; Christiansen, L.; Vaupel, J.W.; Aviv, A.; Christensen, K. Telomere Length and Mortality: A Study of Leukocytes in Elderly Danish Twins. Am. J. Epidemiol. 2008, 167, 799–806. [Google Scholar] [CrossRef]
- Lapham, K.; Kvale, M.N.; Lin, J.; Connell, S.; Croen, L.A.; Dispensa, B.P.; Fang, L.; Hesselson, S.; Hoffmann, T.J.; Iribarren, C.; et al. Automated Assay of Telomere Length Measurement and Informatics for 100,000 Subjects in the Genetic Epidemiology Research on Adult Health and Aging (GERA) Cohort. Genetics 2015, 200, 1061–1072. [Google Scholar] [CrossRef] [Green Version]
- Zou, Y.; Sfeir, A.; Gryaznov, S.M.; Shay, J.W.; Wright, W.E. Does a Sentinel or a Subset of Short Telomeres Determine Replicative Senescence? Mol. Biol. Cell 2004, 15, 3709–3718. [Google Scholar] [CrossRef] [PubMed]
- Lai, T.-P.; Zhang, N.; Noh, J.; Mender, I.; Tedone, E.; Huang, E.; Wright, W.E.; Danuser, G.; Shay, J.W. A Method for Measuring the Distribution of the Shortest Telomeres in Cells and Tissues. Nat. Commun. 2017, 8, 1356. [Google Scholar] [CrossRef] [PubMed] [Green Version]
- Jafri, M.A.; Ansari, S.A.; Alqahtani, M.H.; Shay, J.W. Roles of Telomeres and Telomerase in Cancer, and Advances in Telomerase-Targeted Therapies. Genome Med. 2016, 8, 69. [Google Scholar] [CrossRef] [PubMed] [Green Version]
- Lin, J.; Smith, D.L.; Esteves, K.; Drury, S. Telomere Length Measurement by QPCR—Summary of Critical Factors and Recommendations for Assay Design. Psychoneuroendocrinology 2019, 99, 271–278. [Google Scholar] [CrossRef] [PubMed]
- Demanelis, K.; Jasmine, F.; Chen, L.S.; Chernoff, M.; Tong, L.; Delgado, D.; Zhang, C.; Shinkle, J.; Sabarinathan, M.; Lin, H.; et al. Determinants of Telomere Length across Human Tissues. Science 2020, 369, eaaz6876. [Google Scholar] [CrossRef]
- Sanders, J.L.; Newman, A.B. Telomere Length in Epidemiology: A Biomarker of Aging, Age-Related Disease, Both, or Neither? Epidemiol. Rev. 2013, 35, 112–131. [Google Scholar] [CrossRef] [Green Version]
- Codd, V.; Nelson, C.P.; Albrecht, E.; Mangino, M.; Deelen, J.; Buxton, J.L.; Hottenga, J.J.; Fischer, K.; Esko, T.; Surakka, I.; et al. Identification of Seven Loci Affecting Mean Telomere Length and Their Association with Disease. Nat. Genet. 2013, 45, 422–427. [Google Scholar] [CrossRef] [Green Version]
- Barrett, J.H.; Iles, M.M.; Dunning, A.M.; Pooley, K.A. Telomere Length and Common Disease: Study Design and Analytical Challenges. Hum. Genet. 2015, 134, 679–689. [Google Scholar] [CrossRef] [Green Version]
- Gavia-García, G.; Rosado-Pérez, J.; Arista-Ugalde, T.L.; Aguiñiga-Sánchez, I.; Santiago-Osorio, E.; Mendoza-Núñez, V.M. Telomere Length and Oxidative Stress and Its Relation with Metabolic Syndrome Components in the Aging. Biology 2021, 10, 253. [Google Scholar] [CrossRef]
- Scarabino, D.; Broggio, E.; Gambina, G.; Corbo, R.M. Leukocyte Telomere Length in Mild Cognitive Impairment and Alzheimer’s Disease Patients. Exp. Gerontol. 2017, 98, 143–147. [Google Scholar] [CrossRef]
- Scarabino, D.; Veneziano, L.; Peconi, M.; Frontali, M.; Mantuano, E.; Corbo, R.M. Leukocyte Telomere Shortening in Huntington’s Disease. J. Neurol. Sci. 2019, 396, 25–29. [Google Scholar] [CrossRef] [PubMed] [Green Version]
- Forero, D.A.; González-Giraldo, Y.; López-Quintero, C.; Castro-Vega, L.J.; Barreto, G.E.; Perry, G. Telomere Length in Parkinson’s Disease: A Meta-Analysis. Exp. Gerontol. 2016, 75, 53–55. [Google Scholar] [CrossRef] [PubMed] [Green Version]
- Clark, L.F.; Kodadek, T. The Immune System and Neuroinflammation as Potential Sources of Blood-Based Biomarkers for Alzheimer’s Disease, Parkinson’s Disease, and Huntington’s Disease. ACS Chem. Neurosci. 2016, 7, 520–527. [Google Scholar] [CrossRef] [PubMed]
- Passos, J.F.; Nelson, G.; Wang, C.; Richter, T.; Simillion, C.; Proctor, C.J.; Miwa, S.; Olijslagers, S.; Hallinan, J.; Wipat, A.; et al. Feedback between P21 and Reactive Oxygen Production Is Necessary for Cell Senescence. Mol. Syst. Biol. 2010, 6, 347. [Google Scholar] [CrossRef] [PubMed]
- Sahin, E.; Colla, S.; Liesa, M.; Moslehi, J.; Müller, F.L.; Guo, M.; Cooper, M.; Kotton, D.; Fabian, A.J.; Walkey, C.; et al. Telomere Dysfunction Induces Metabolic and Mitochondrial Compromise. Nature 2011, 470, 359–365. [Google Scholar] [CrossRef] [Green Version]
- Qian, W.; Kumar, N.; Roginskaya, V.; Fouquerel, E.; Opresko, P.L.; Shiva, S.; Watkins, S.C.; Kolodieznyi, D.; Bruchez, M.P.; Van Houten, B. Chemoptogenetic Damage to Mitochondria Causes Rapid Telomere Dysfunction. Proc. Natl. Acad. Sci. USA 2019, 116, 18435–18444. [Google Scholar] [CrossRef] [Green Version]
- Gordon, D.M.; Santos, J.H. The Emerging Role of Telomerase Reverse Transcriptase in Mitochondrial DNA Metabolism. J. Nucl. Acids 2010, 2010, 390791. [Google Scholar] [CrossRef] [Green Version]
- Gordon, C.-A.; Madamanchi, N.R.; Runge, M.S.; Jarstfer, M.B. Effect of Oxidative Stress on Telomere Maintenance in Aortic Smooth Muscle Cells. Biochim. Biophys. Acta Mol. Basis Dis. 2022, 1868, 166397. [Google Scholar] [CrossRef]
- Globas, C.; du Montcel, S.T.; Baliko, L.; Boesch, S.; Depondt, C.; DiDonato, S.; Durr, A.; Filla, A.; Klockgether, T.; Mariotti, C.; et al. Early Symptoms in Spinocerebellar Ataxia Type 1, 2, 3, and 6. Mov. Disord. 2008, 23, 2232–2238. [Google Scholar] [CrossRef]
- Tezenas du Montcel, S.; Durr, A.; Rakowicz, M.; Nanetti, L.; Charles, P.; Sulek, A.; Mariotti, C.; Rola, R.; Schols, L.; Bauer, P.; et al. Prediction of the Age at Onset in Spinocerebellar Ataxia Type 1, 2, 3 and 6. J. Med. Genet. 2014, 51, 479–486. [Google Scholar] [CrossRef]
- Orr, H.T.; Chung, M.Y.; Banfi, S.; Kwiatkowski, T.J.; Servadio, A.; Beaudet, A.L.; McCall, A.E.; Duvick, L.A.; Ranum, L.P.; Zoghbi, H.Y. Expansion of an Unstable Trinucleotide CAG Repeat in Spinocerebellar Ataxia Type 1. Nat. Genet. 1993, 4, 221–226. [Google Scholar] [CrossRef] [PubMed]
- Pulst, S.M.; Nechiporuk, A.; Nechiporuk, T.; Gispert, S.; Chen, X.N.; Lopes-Cendes, I.; Pearlman, S.; Starkman, S.; Orozco-Diaz, G.; Lunkes, A.; et al. Moderate Expansion of a Normally Biallelic Trinucleotide Repeat in Spinocerebellar Ataxia Type 2. Nat. Genet. 1996, 14, 269–276. [Google Scholar] [CrossRef]
- Kawaguchi, Y.; Okamoto, T.; Taniwaki, M.; Aizawa, M.; Inoue, M.; Katayama, S.; Kawakami, H.; Nakamura, S.; Nishimura, M.; Akiguchi, I. CAG Expansions in a Novel Gene for Machado-Joseph Disease at Chromosome 14q32.1. Nat. Genet. 1994, 8, 221–228. [Google Scholar] [CrossRef]
- Cawthon, R.M. Telomere Measurement by Quantitative PCR. Nucl. Acids Res. 2002, 30, e47. [Google Scholar] [CrossRef] [PubMed]
- Blackburn, E.H.; Epel, E.S.; Lin, J. Human Telomere Biology: A Contributory and Interactive Factor in Aging, Disease Risks, and Protection. Science 2015, 350, 1193–1198. [Google Scholar] [CrossRef] [Green Version]
- Mantuano, E.; Peconi, M.; Scarabino, D. Can Leukocyte Telomere Shortening Be a Possible Biomarker to Track Huntington’s Disease Progression? Neural Regen. Res. 2019, 14, 1709–1710. [Google Scholar] [CrossRef]
- Scarabino, D.; Peconi, M.; Broggio, E.; Gambina, G.; Maggi, E.; Armeli, F.; Mantuano, E.; Morello, M.; Corbo, R.M.; Businaro, R. Relationship between Proinflammatory Cytokines (Il-1beta, Il-18) and Leukocyte Telomere Length in Mild Cognitive Impairment and Alzheimer’s Disease. Exp. Gerontol. 2020, 136, 110945. [Google Scholar] [CrossRef] [PubMed]
- Corbo, R.M.; Businaro, R.; Scarabino, D. Leukocyte Telomere Length and Plasma Interleukin-1β and Interleukin-18 Levels in Mild Cognitive Impairment and Alzheimer’s Disease: New Biomarkers for Diagnosis and Disease Progression? Neural Regen. Res. 2021, 16, 1397–1398. [Google Scholar] [CrossRef]
- Cai, Z.; Liu, N.; Wang, C.; Qin, B.; Zhou, Y.; Xiao, M.; Chang, L.; Yan, L.-J.; Zhao, B. Role of RAGE in Alzheimer’s Disease. Cell. Mol. Neurobiol. 2016, 36, 483–495. [Google Scholar] [CrossRef]
- Svenson, U.; Roos, G. Telomere Length as a Biological Marker in Malignancy. Biochim. Biophys. Acta 2009, 1792, 317–323. [Google Scholar] [CrossRef] [Green Version]
- Stanley, S.E.; Armanios, M. The Short and Long Telomere Syndromes: Paired Paradigms for Molecular Medicine. Curr. Opin. Genet. Dev. 2015, 33, 1–9. [Google Scholar] [CrossRef] [Green Version]
- Degerman, S.; Domellöf, M.; Landfors, M.; Linder, J.; Lundin, M.; Haraldsson, S.; Elgh, E.; Roos, G.; Forsgren, L. Long Leukocyte Telomere Length at Diagnosis Is a Risk Factor for Dementia Progression in Idiopathic Parkinsonism. PLoS ONE 2014, 9, e113387. [Google Scholar] [CrossRef] [PubMed]
- Tichon, A.; Gowda, B.K.S.; Slavin, S.; Gazit, A.; Priel, E. Telomerase Activity and Expression in Adult Human Mesenchymal Stem Cells Derived from Amyotrophic Lateral Sclerosis Individuals. Cytotherapy 2009, 11, 837–848. [Google Scholar] [CrossRef] [PubMed]
- De Felice, B.; Annunziata, A.; Fiorentino, G.; Manfellotto, F.; D’Alessandro, R.; Marino, R.; Borra, M.; Biffali, E. Telomerase Expression in Amyotrophic Lateral Sclerosis (ALS) Patients. J. Hum. Genet. 2014, 59, 555–561. [Google Scholar] [CrossRef]
- Al Khleifat, A.; Iacoangeli, A.; Shatunov, A.; Fang, T.; Sproviero, W.; Jones, A.R.; Opie-Martin, S.; Morrison, K.E.; Shaw, P.J.; Shaw, C.E.; et al. Telomere Length Is Greater in ALS than in Controls: A Whole Genome Sequencing Study. Amyotroph. Lateral Scler. Frontotempor. Degener. 2019, 20, 229–234. [Google Scholar] [CrossRef] [PubMed]
- Velázquez-Pérez, L.C.; Rodríguez-Labrada, R.; Fernandez-Ruiz, J. Spinocerebellar Ataxia Type 2: Clinicogenetic Aspects, Mechanistic Insights, and Management Approaches. Front. Neurol. 2017, 8, 472. [Google Scholar] [CrossRef] [PubMed] [Green Version]
- Evert, B.O.; Vogt, I.R.; Kindermann, C.; Ozimek, L.; de Vos, R.A.; Brunt, E.R.; Schmitt, I.; Klockgether, T.; Wüllner, U. Inflammatory Genes Are Upregulated in Expanded Ataxin-3-Expressing Cell Lines and Spinocerebellar Ataxia Type 3 Brains. J. Neurosci. 2001, 21, 5389–5396. [Google Scholar] [CrossRef] [Green Version]
- Evert, B.O.; Schelhaas, J.; Fleischer, H.; de Vos, R.a.I.; Brunt, E.R.; Stenzel, W.; Klockgether, T.; Wüllner, U. Neuronal Intranuclear Inclusions, Dysregulation of Cytokine Expression and Cell Death in Spinocerebellar Ataxia Type 3. Clin. Neuropathol. 2006, 25, 272–281. [Google Scholar]
- Da Silva Carvalho, G.; Saute, J.A.M.; Haas, C.B.; Torrez, V.R.; Brochier, A.W.; Souza, G.N.; Furtado, G.V.; Gheno, T.; Russo, A.; Monte, T.L.; et al. Cytokines in Machado Joseph Disease/Spinocerebellar Ataxia 3. Cerebellum 2016, 15, 518–525. [Google Scholar] [CrossRef]
- Raposo, M.; Bettencourt, C.; Ramos, A.; Kazachkova, N.; Vasconcelos, J.; Kay, T.; Bruges-Armas, J.; Lima, M. Promoter Variation and Expression Levels of Inflammatory Genes IL1A, IL1B, IL6 and TNF in Blood of Spinocerebellar Ataxia Type 3 (SCA3) Patients. Neuromolecular. Med. 2017, 19, 41–45. [Google Scholar] [CrossRef] [Green Version]
- Araujo, J.; Breuer, P.; Dieringer, S.; Krauss, S.; Dorn, S.; Zimmermann, K.; Pfeifer, A.; Klockgether, T.; Wuellner, U.; Evert, B.O. FOXO4-Dependent Upregulation of Superoxide Dismutase-2 in Response to Oxidative Stress Is Impaired in Spinocerebellar Ataxia Type 3. Hum. Mol. Genet. 2011, 20, 2928–2941. [Google Scholar] [CrossRef] [PubMed] [Green Version]
- Träger, U.; Andre, R.; Magnusson-Lind, A.; Miller, J.R.C.; Connolly, C.; Weiss, A.; Grueninger, S.; Silajdžić, E.; Smith, D.L.; Leavitt, B.R.; et al. Characterisation of Immune Cell Function in Fragment and Full-Length Huntington’s Disease Mouse Models. Neurobiol. Dis. 2015, 73, 388–398. [Google Scholar] [CrossRef] [PubMed] [Green Version]
- Lin, C.-C.; Ashizawa, T.; Kuo, S.-H. Collaborative Efforts for Spinocerebellar Ataxia Research in the United States: CRC-SCA and READISCA. Front. Neurol. 2020, 11, 902. [Google Scholar] [CrossRef] [PubMed]
- Virmouni, S.A.; Al-Mahdawi, S.; Sandi, C.; Yasaei, H.; Giunti, P.; Slijepcevic, P.; Pook, M.A. Identification of Telomere Dysfunction in Friedreich Ataxia. Mol. Neurodegener. 2015, 10, 22. [Google Scholar] [CrossRef] [Green Version]


| SCA1 | SCA2 | SCA3 | ||||
|---|---|---|---|---|---|---|
| Patients N = 52 | Controls N = 104 | Patients N = 26 | Controls N = 52 | Patients N = 29 | Controls N = 50 | |
| Age at blood sampling (years) | 49.9 ± 15.2 | 49.1 ± 15.1 | 46.1 ± 12.3 | 46.4 ± 12.8 | 47.4 ± 14.3 | 46.04 ± 12.9 |
| Sex (males %) | 64.3 | 55.0 | 53.8 | 53.3 | 45.8 | 48.0 |
| CAG size in the expanded allele | 46.6 ± 5.7 | NA | 39.4 ± 2.2 | NA | 68.8 ± 4.3 | NA |
| Age at onset (years) | 43.8 ± 13.2 | NA | 37.0 ± 10.2 | NA | 39.7 ± 13.4 | NA |
| Disease Duration (years) | 7.6. ± 6.3 | NA | 9.2 ± 7.4 | NA | 9.6 ± 7.8 | NA |
| Age Classes (Years) | Controls | SCA2 Patients | p Value |
|---|---|---|---|
| Total sample | 0.98, 0.91–1.11 (52) | 1.06, 0.99–1.11 (26) | <0.0001 |
| 19–29 | 1.06, 0.98–1.09 (6) | 1.03, 1–1.22 (3) | 0.90 |
| 30–39 | 1.00, 0.97–1.01 (8) | 1.11, 1.02–1.15 (4) | 0.20 |
| 40–49 | 0.98, 0.93–1.07 (18) | 1.09, 1.02–1.16 (9) | 0.009 |
| >49 | 0.92, 0.88–1.0 (20) | 1.01, 0.98–1.01 (10) | 0.004 |
| p value | 0.009 | 0.39 |
| LTL Patient vs. Controls | LTL/Age Relationship | LTL/ CAG Repeat n° Relationship | LTL/Disease Duration Relationship | |
|---|---|---|---|---|
| SCA1 |  | + | − | − |
| SCA2 |  | − | − | − |
| SCA3 |  | + | − | + |
| HD |  | + | − | − |
Publisher’s Note: MDPI stays neutral with regard to jurisdictional claims in published maps and institutional affiliations. |
© 2022 by the authors. Licensee MDPI, Basel, Switzerland. This article is an open access article distributed under the terms and conditions of the Creative Commons Attribution (CC BY) license (https://creativecommons.org/licenses/by/4.0/).
Share and Cite
Scarabino, D.; Veneziano, L.; Fiore, A.; Nethisinghe, S.; Mantuano, E.; Garcia-Moreno, H.; Bellucci, G.; Solanky, N.; Morello, M.; Zanni, G.; et al. Leukocyte Telomere Length Variability as a Potential Biomarker in Patients with PolyQ Diseases. Antioxidants 2022, 11, 1436. https://doi.org/10.3390/antiox11081436
Scarabino D, Veneziano L, Fiore A, Nethisinghe S, Mantuano E, Garcia-Moreno H, Bellucci G, Solanky N, Morello M, Zanni G, et al. Leukocyte Telomere Length Variability as a Potential Biomarker in Patients with PolyQ Diseases. Antioxidants. 2022; 11(8):1436. https://doi.org/10.3390/antiox11081436
Chicago/Turabian StyleScarabino, Daniela, Liana Veneziano, Alessia Fiore, Suran Nethisinghe, Elide Mantuano, Hector Garcia-Moreno, Gianmarco Bellucci, Nita Solanky, Maria Morello, Ginevra Zanni, and et al. 2022. "Leukocyte Telomere Length Variability as a Potential Biomarker in Patients with PolyQ Diseases" Antioxidants 11, no. 8: 1436. https://doi.org/10.3390/antiox11081436