
Direct Derivatization in Dried Blood Spots for Oxidized and Reduced Glutathione Quantification in Newborns

 , , , ,
  and
and 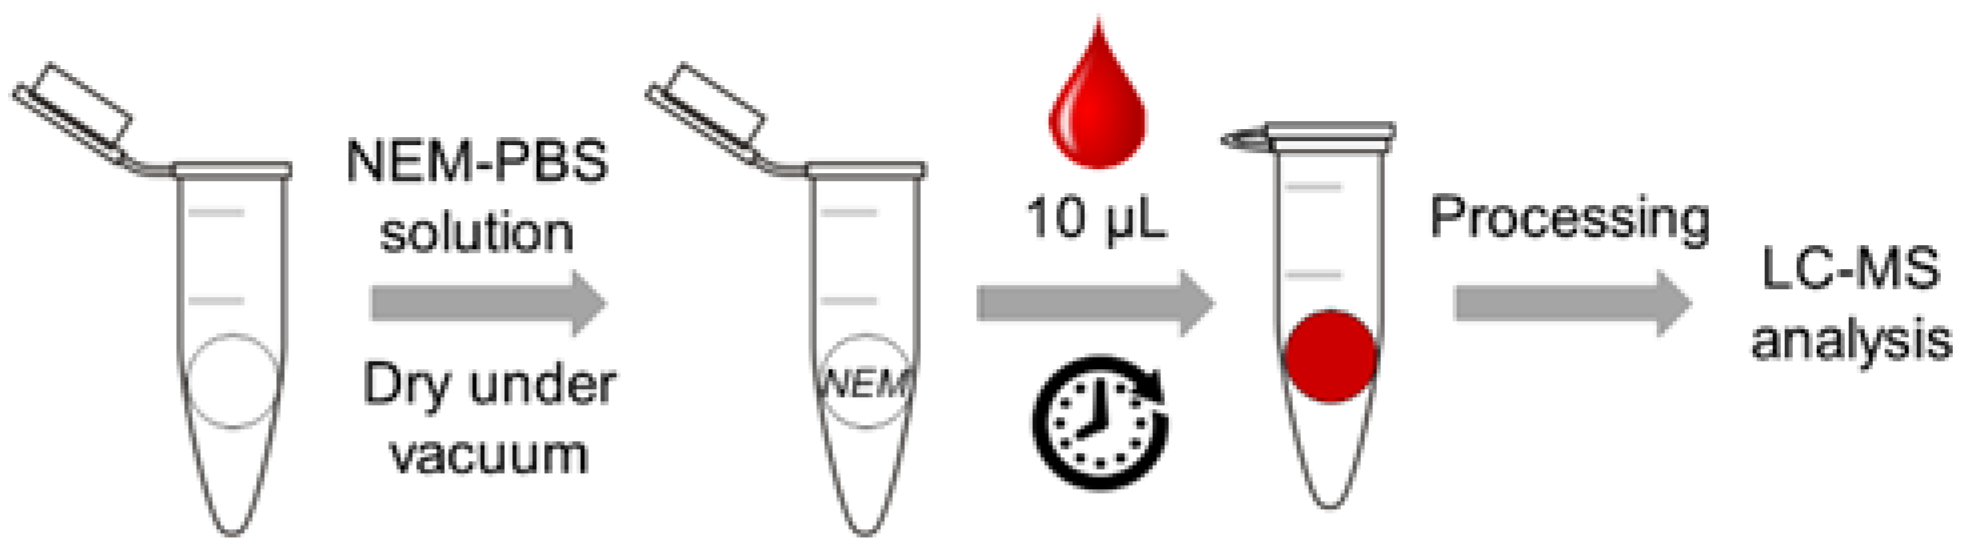
Abstract
:1. Introduction
2. Materials and Methods
2.1. Standards and Reagents
2.2. UPLC-MS/MS Chromatographic System
2.3. Sample Collection and Processing
2.4. Method Performance
2.5. Blood Samples and Clinical Approach
3. Results
3.1. Derivatization Efficiency Using NEM-Treated Papers
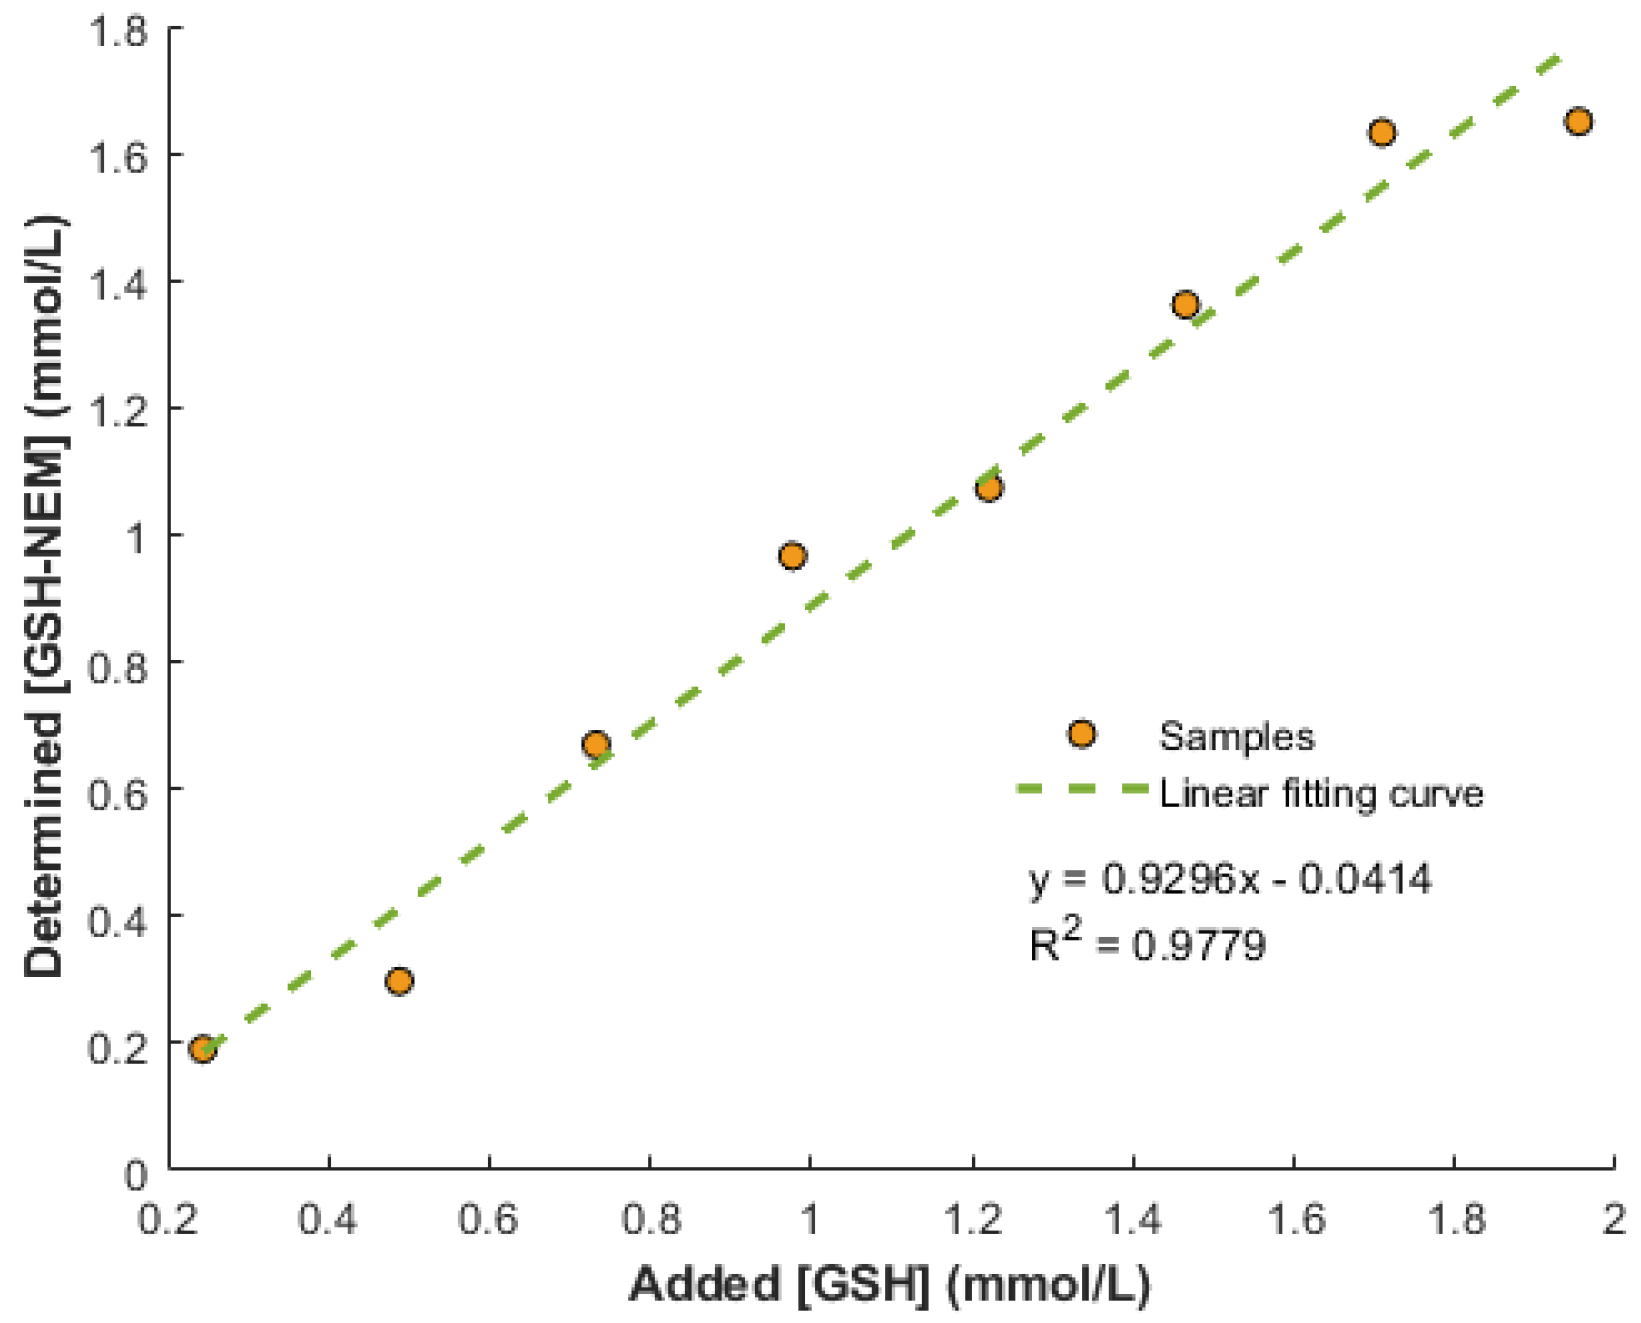
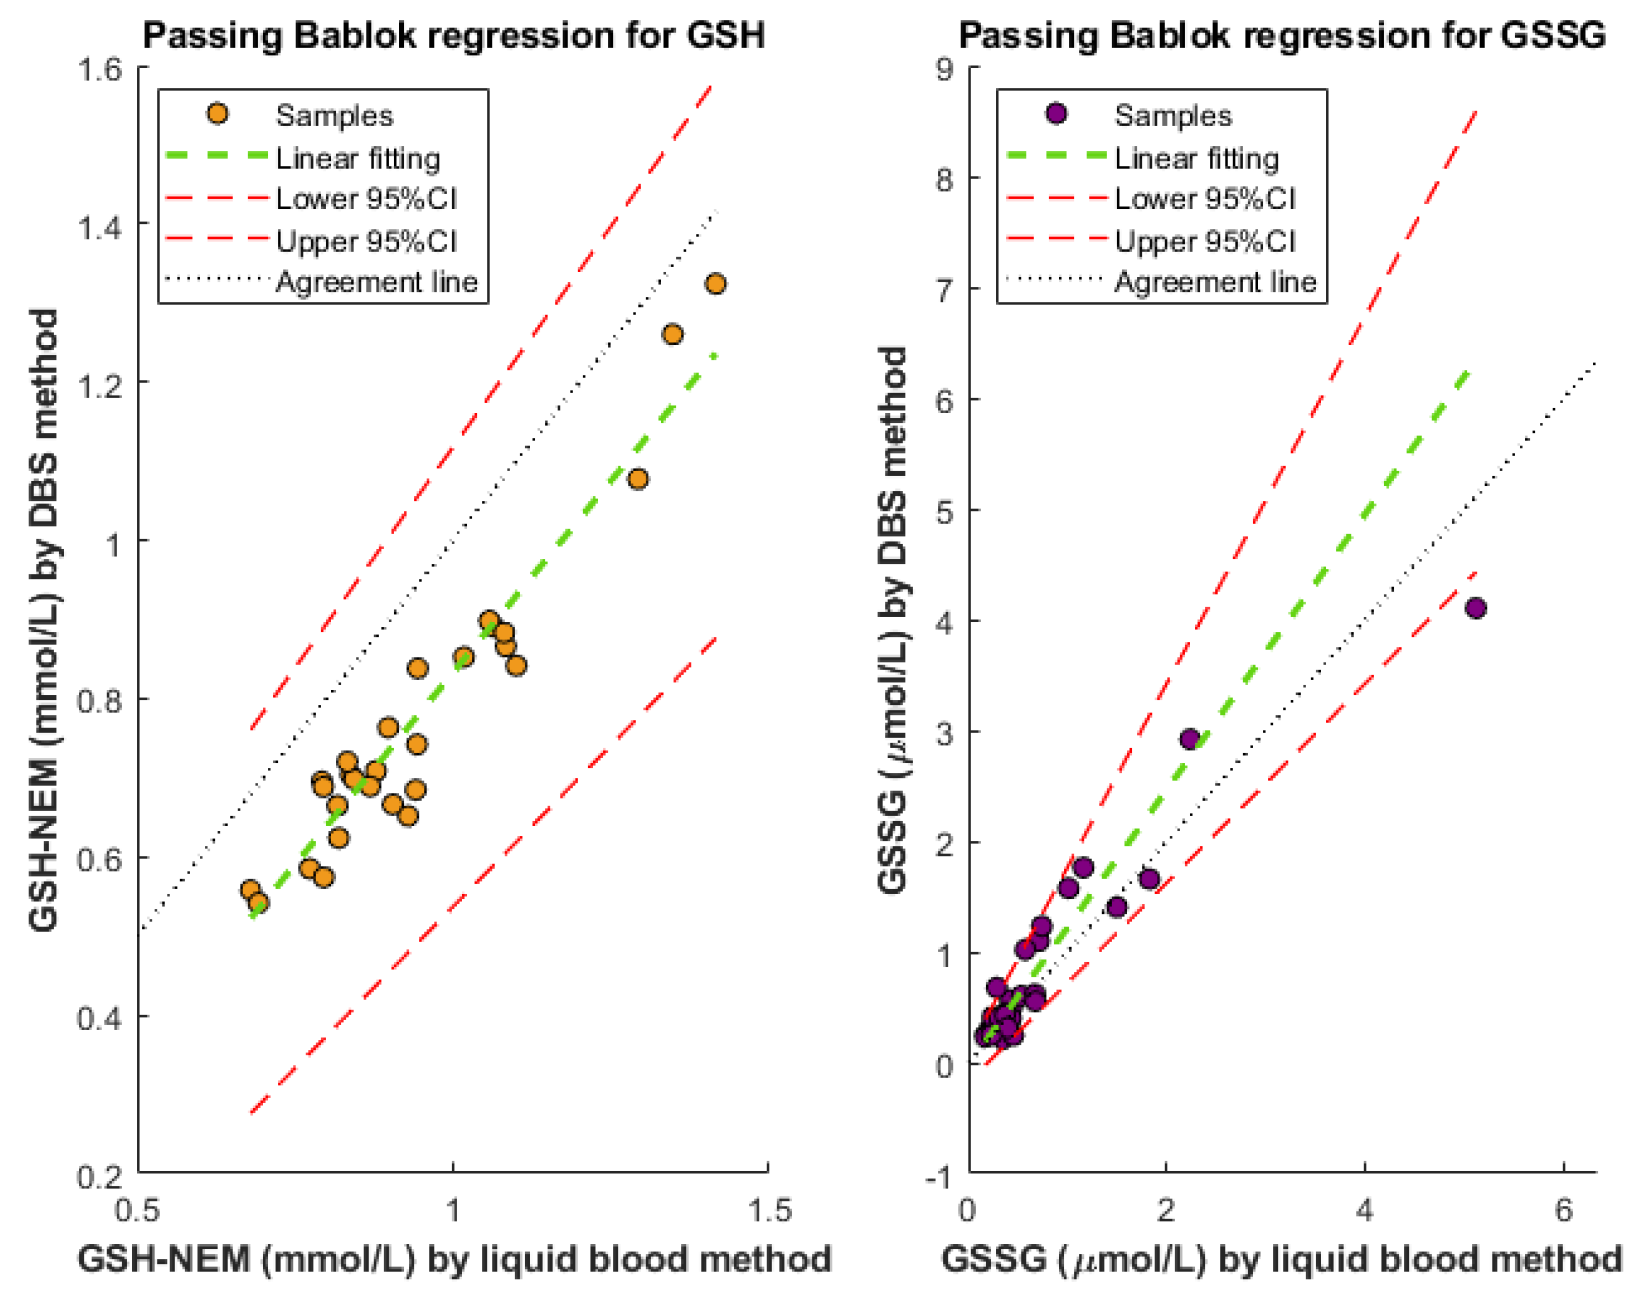
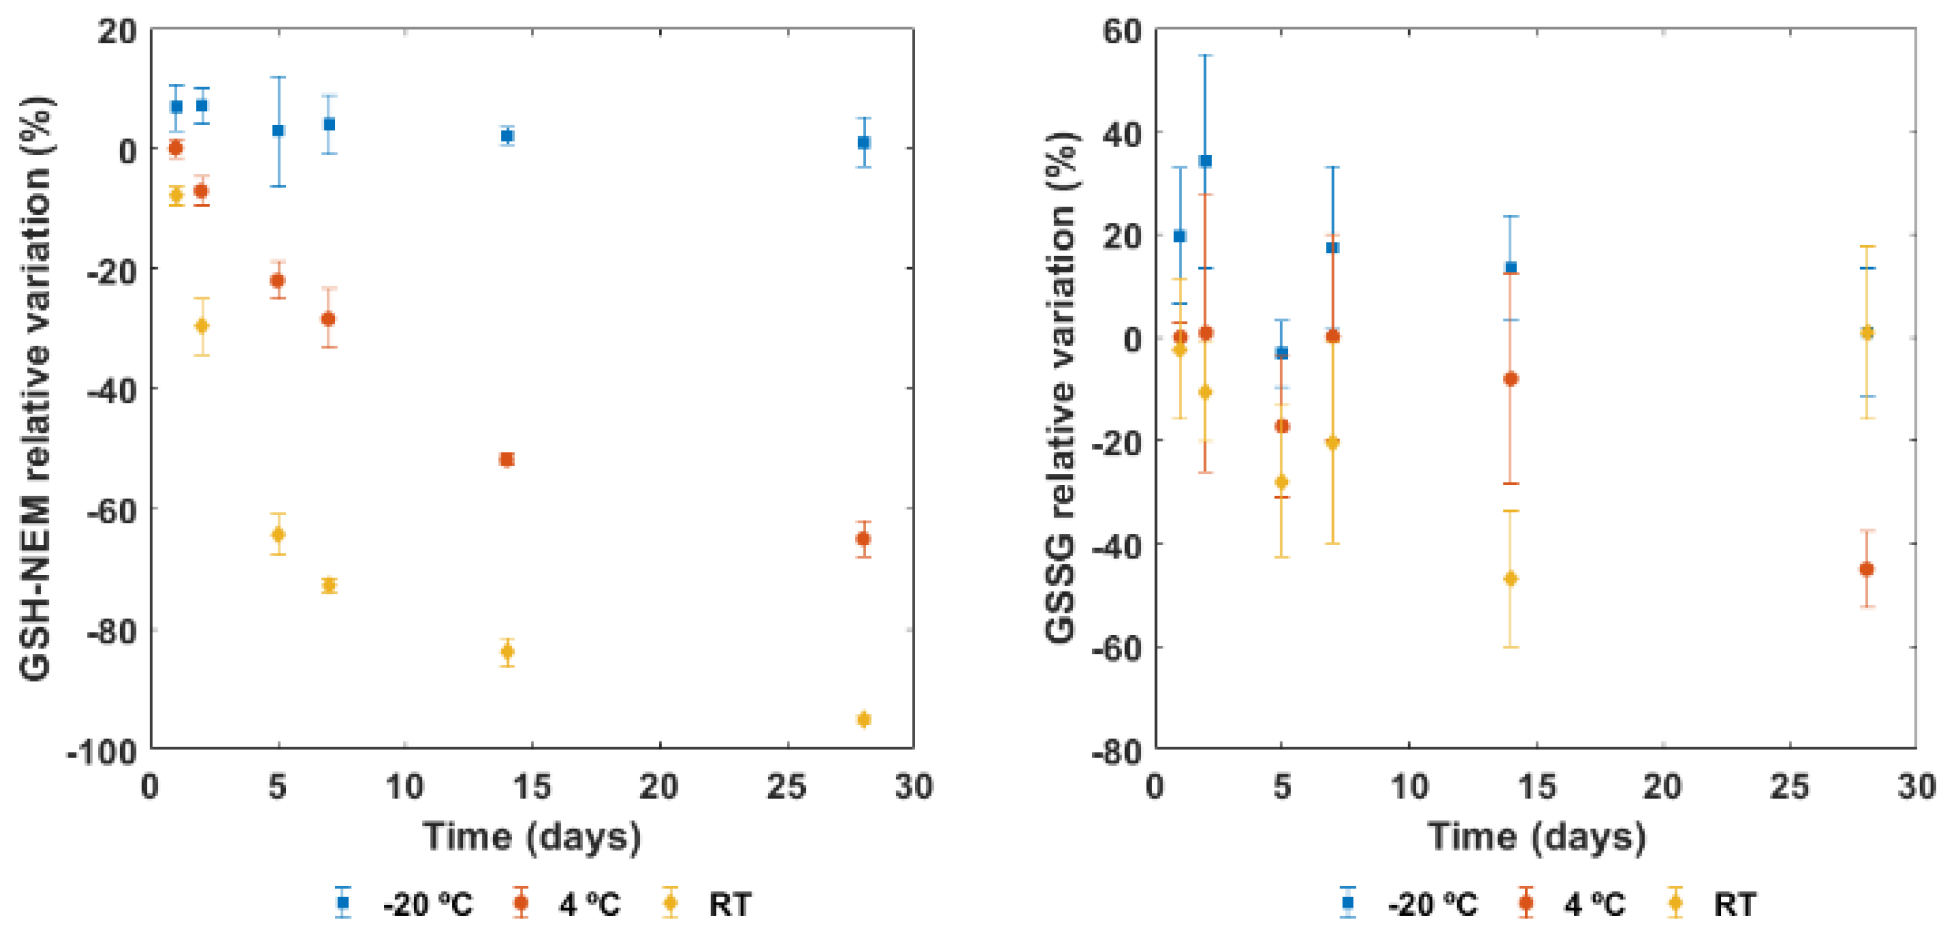
3.2. Method’s Performance
3.3. GSH Reference Ranges in Newborn Infants
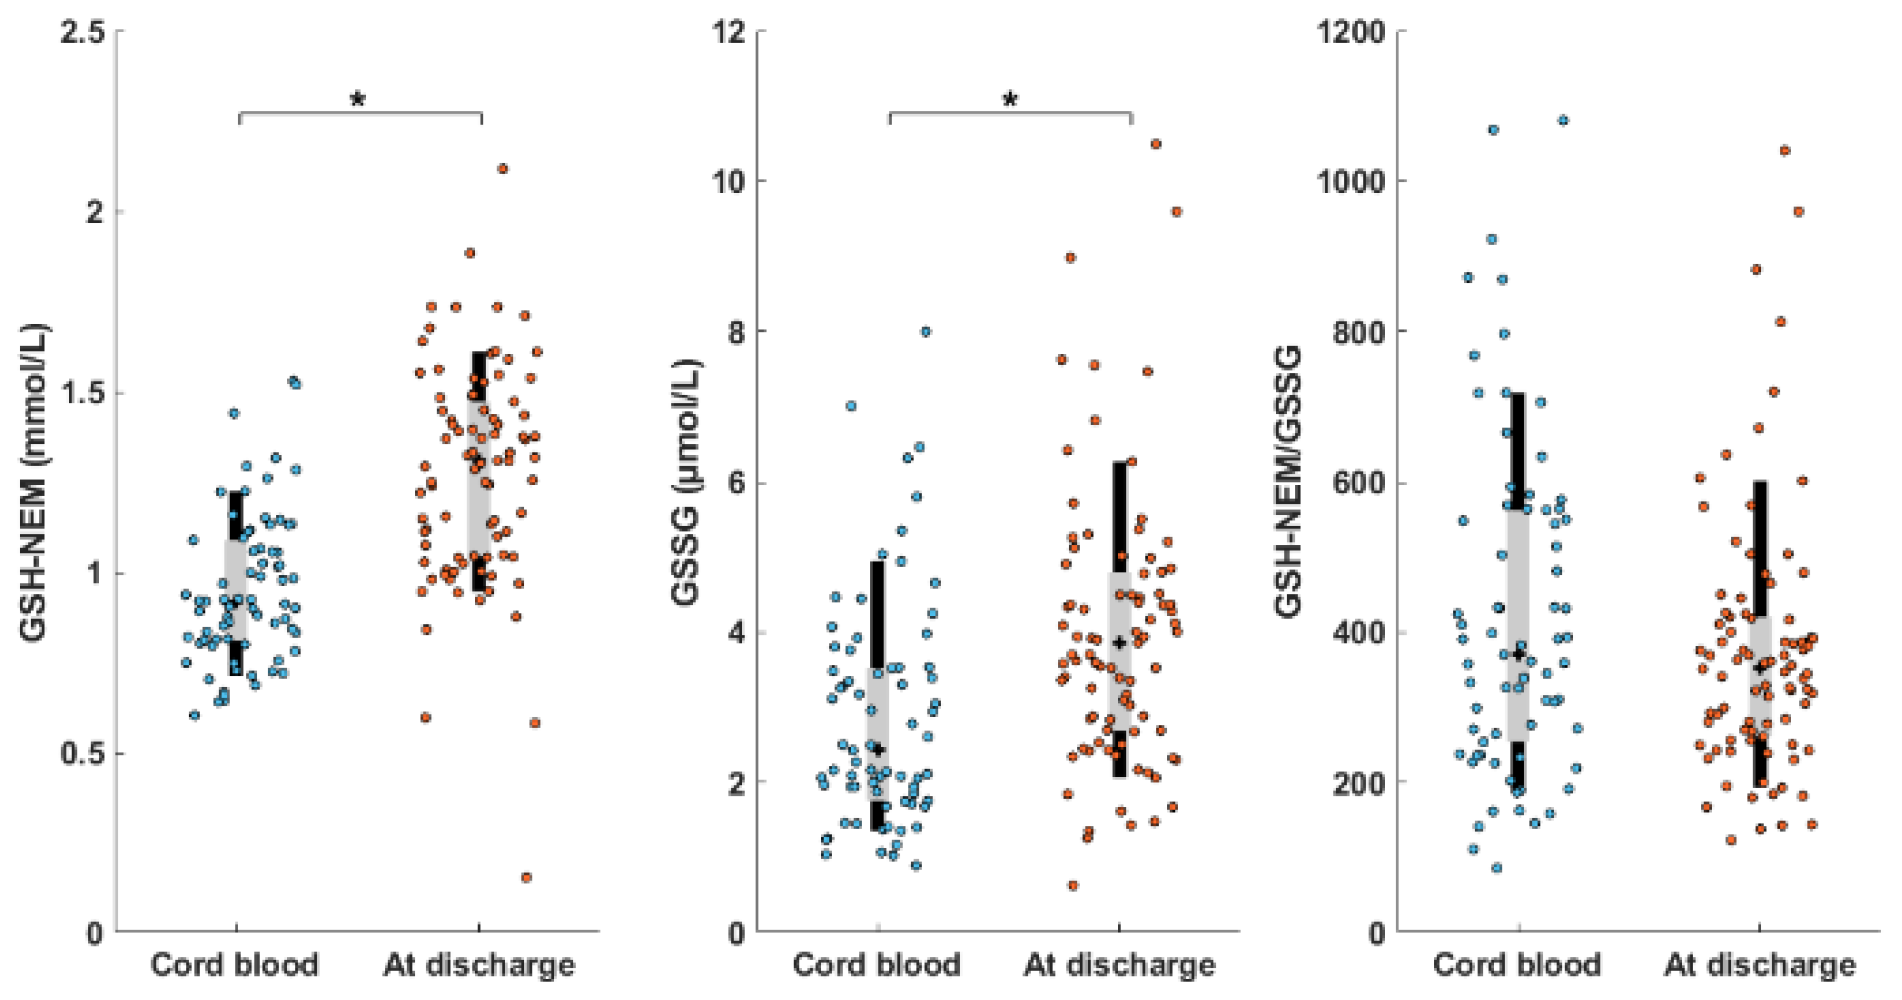
3.4. Assessment of Two Clinical Scenarios
4. Discussion
5. Conclusions
Supplementary Materials
Author Contributions
Funding
Institutional Review Board Statement
Informed Consent Statement
Data Availability Statement
Acknowledgments
Conflicts of Interest
References
- Sánchez-Illana, Á.; Piñeiro-Ramos, J.D.; Ramos-Garcia, V.; Ten-Doménech, I.; Vento, M.; Kuligowski, J. Oxidative Stress Biomarkers in the Preterm Infant. Adv. Clin. Chem. 2021, 102, 127–189. [Google Scholar] [CrossRef]
- Deponte, M. The Incomplete Glutathione Puzzle: Just Guessing at Numbers and Figures? Antioxid. Redox Signal. 2017, 27, 1130–1161. [Google Scholar] [CrossRef] [Green Version]
- Jones, D.P.; Sies, H. The Redox Code. Antioxid. Redox Signal. 2015, 23, 734–746. [Google Scholar] [CrossRef] [Green Version]
- Schafer, F.Q.; Buettner, G.R. Redox Environment of the Cell as Viewed through the Redox State of the Glutathione Disulfide/Glutathione Couple. Free Radic. Biol. Med. 2001, 30, 1191–1212. [Google Scholar] [CrossRef]
- Rook, D.; te Braake, F.W.J.; Schierbeek, H.; Longini, M.; Buonocore, G.; van Goudoever, J.B. Glutathione Synthesis Rates in Early Postnatal Life. Pediatr. Res. 2010, 67, 407–411. [Google Scholar] [CrossRef] [Green Version]
- Davis, J.M.; Auten, R.L. Maturation of the Antioxidant System and the Effects on Preterm Birth. Semin. Fetal Neonatal. Med. 2010, 15, 191–195. [Google Scholar] [CrossRef]
- Rudolph, D.J.-B.N. Sequential Postnatal Changes in Erythrocyte Glutathione and Sulfhydryl Content: A Possible Adaptational Response to the Extrauterine Environment. Biol. Neonate 2003, 84, 142–146. [Google Scholar] [CrossRef]
- Torres-Cuevas, I.; Cernada, M.; Nuñez, A.; Escobar, J.; Kuligowski, J.; Chafer-Pericas, C.; Vento, M. Oxygen Supplementation to Stabilize Preterm Infants in the Fetal to Neonatal Transition: No Satisfactory Answer. Front Pediatr. 2016, 4, 29. [Google Scholar] [CrossRef] [Green Version]
- Torres-Cuevas, I.; Parra-Llorca, A.; Sánchez-Illana, A.; Nuñez-Ramiro, A.; Kuligowski, J.; Cháfer-Pericás, C.; Cernada, M.; Escobar, J.; Vento, M. Oxygen and Oxidative Stress in the Perinatal Period. Redox Biol. 2017, 12, 674–681. [Google Scholar] [CrossRef]
- Vento, M.; Asensi, M.; Sastre, J.; García-Sala, F.; Pallardó, F.V.; Viña, J. Resuscitation with Room Air Instead of 100% Oxygen Prevents Oxidative Stress in Moderately Asphyxiated Term Neonates. Pediatrics 2001, 107, 642–647. [Google Scholar] [CrossRef] [Green Version]
- Wyckoff, M.H.; Wyllie, J.; Aziz, K.; de Almeida, M.F.; Fabres, J.W.; Fawke, J.; Guinsburg, R.; Hosono, S.; Isayama, T.; Kapadia, V.S.; et al. Neonatal Life Support 2020 International Consensus on Cardiopulmonary Resuscitation and Emergency Cardiovascular Care Science With Treatment Recommendations. Resuscitation 2020, 156, A156–A187. [Google Scholar] [CrossRef]
- Asensi, M.; Sastre, J.; Pallardo, F.V.; Delaasuncion, J.G.; Estrela, J.M.; Vina, J. A High-Performance Liquid Chromatography Method for Measurement of Oxidized Glutathione in Biological Samples. Anal. Biochem. 1994, 217, 323–328. [Google Scholar] [CrossRef]
- Rossi, R.; Milzani, A.; Dalle-Donne, I.; Giustarini, D.; Lusini, L.; Colombo, R.; Simplicio, P.D. Blood Glutathione Disulfide: In Vivo Factor or in Vitro Artifact? Clin. Chem. 2002, 48, 742–753. [Google Scholar] [CrossRef] [Green Version]
- Forman, H.J.; Zhang, H.; Rinna, A. Glutathione: Overview of Its Protective Roles, Measurement, and Biosynthesis. Mol. Asp. Med. 2009, 30, 1–12. [Google Scholar] [CrossRef] [Green Version]
- Monostori, P.; Wittmann, G.; Karg, E.; Túri, S. Determination of Glutathione and Glutathione Disulfide in Biological Samples: An in-Depth Review. J. Chromatogr. B 2009, 877, 3331–3346. [Google Scholar] [CrossRef]
- Giustarini, D.; Tsikas, D.; Colombo, G.; Milzani, A.; Dalle-Donne, I.; Fanti, P.; Rossi, R. Pitfalls in the Analysis of the Physiological Antioxidant Glutathione (GSH) and Its Disulfide (GSSG) in Biological Samples: An Elephant in the Room. J. Chromatogr. B 2016, 1019, 21–28. [Google Scholar] [CrossRef] [Green Version]
- Tomin, T.; Bordag, N.; Zügner, E.; Al-Baghdadi, A.; Schinagl, M.; Birner-Gruenberger, R.; Schittmayer, M. Blood Plasma Quality Control by Plasma Glutathione Status. Antioxidants 2021, 10, 864. [Google Scholar] [CrossRef]
- Giustarini, D.; Colombo, G.; Garavaglia, M.L.; Astori, E.; Portinaro, N.M.; Reggiani, F.; Badalamenti, S.; Aloisi, A.M.; Santucci, A.; Rossi, R.; et al. Assessment of Glutathione/Glutathione Disulphide Ratio and S -Glutathionylated Proteins in Human Blood, Solid Tissues, and Cultured Cells. Free Radic. Biol. Med. 2017, 112, 360–375. [Google Scholar] [CrossRef]
- Giustarini, D.; Dalle-Donne, I.; Milzani, A.; Fanti, P.; Rossi, R. Analysis of GSH and GSSG after Derivatization with N-Ethylmaleimide. Nat. Protoc. 2013, 8, 1660–1669. [Google Scholar] [CrossRef]
- Escobar, J.; Sánchez-Illana, Á.; Kuligowski, J.; Torres-Cuevas, I.; Solberg, R.; Garberg, H.T.; Huun, M.U.; Saugstad, O.D.; Vento, M.; Cháfer-Pericás, C. Development of a Reliable Method Based on Ultra-Performance Liquid Chromatography Coupled to Tandem Mass Spectrometry to Measure Thiol-Associated Oxidative Stress in Whole Blood Samples. J. Pharm. Biomed. Anal. 2016, 123, 104–112. [Google Scholar] [CrossRef]
- Tomin, T.; Schittmayer, M.; Birner-Gruenberger, R. Addressing Glutathione Redox Status in Clinical Samples by Two-Step Alkylation with N-Ethylmaleimide Isotopologues. Metabolites 2020, 10, 71. [Google Scholar] [CrossRef] [Green Version]
- Enomoto, A.C.; Schneider, E.; McKinnon, T.; Goldfine, H.; Levy, M.A. Validation of a Simplified Procedure for Convenient and Rapid Quantification of Reduced and Oxidized Glutathione in Human Plasma by Liquid Chromatography Tandem Mass Spectrometry Analysis. Biomed. Chromatogr. 2020, 34, e4854. [Google Scholar] [CrossRef]
- Moore, T.; Le, A.; Niemi, A.-K.; Kwan, T.; Cusmano-Ozog, K.; Enns, G.M.; Cowan, T.M. A New LC–MS/MS Method for the Clinical Determination of Reduced and Oxidized Glutathione from Whole Blood. J. Chromatogr. B 2013, 929, 51–55. [Google Scholar] [CrossRef]
- Sánchez-Illana, Á.; Mayr, F.; Cuesta-García, D.; Piñeiro-Ramos, J.D.; Cantarero, A.; de la Guardia, M.; Vento, M.; Lendl, B.; Quintás, G.; Kuligowski, J. On-Capillary Surface-Enhanced Raman Spectroscopy: Determination of Glutathione in Whole Blood Microsamples. Anal. Chem. 2018, 90, 9093–9100. [Google Scholar] [CrossRef]
- Güntherberg, H.; Rost, J. The True Oxidized Glutathione Content of Red Blood Cells Obtained by New Enzymic and Paper Chromatographic Methods. Anal. Biochem. 1966, 15, 205–210. [Google Scholar] [CrossRef]
- Freeman, J.D.; Rosman, L.M.; Ratcliff, J.D.; Strickland, P.T.; Graham, D.R.; Silbergeld, E.K. State of the Science in Dried Blood Spots. Clin. Chem. 2018, 64, 656–679. [Google Scholar] [CrossRef] [Green Version]
- Haid, M.; Muschet, C.; Wahl, S.; Römisch-Margl, W.; Prehn, C.; Möller, G.; Adamski, J. Long-Term Stability of Human Plasma Metabolites during Storage at −80 °C. Available online: https://pubs.acs.org/doi/pdf/10.1021/acs.jproteome.7b00518 (accessed on 10 June 2021).
- Mess, J.-N.; Taillon, M.-P.; Côté, C.; Garofolo, F. Dried Blood Spot On-Card Derivatization: An Alternative Form of Sample Handling to Overcome the Instability of Thiorphan in Biological Matrix: Dried Blood Spot on-Card Derivatization. Biomed. Chromatogr. 2012, 26, 1617–1624. [Google Scholar] [CrossRef]
- Ingels, A.-S.M.E.; Lambert, W.E.; Stove, C.P. Determination of Gamma-Hydroxybutyric Acid in Dried Blood Spots Using a Simple GC-MS Method with Direct on Spot Derivatization. Anal. Bioanal. Chem. 2010, 398, 2173–2182. [Google Scholar] [CrossRef] [Green Version]
- Nys, G.; Kok, M.G.M.; Servais, A.-C.; Fillet, M. Beyond Dried Blood Spot: Current Microsampling Techniques in the Context of Biomedical Applications. TrAC Trends Anal. Chem. 2017, 97, 326–332. [Google Scholar] [CrossRef]
- Velghe, S.; Capiau, S.; Stove, C.P. Opening the Toolbox of Alternative Sampling Strategies in Clinical Routine: A Key-Role for (LC-)MS/MS. TrAC Trends Anal. Chem. 2016, 84, 61–73. [Google Scholar] [CrossRef] [Green Version]
- Capiau, S.; Veenhof, H.; Koster, R.A.; Bergqvist, Y.; Boettcher, M.; Halmingh, O.; Keevil, B.G.; Koch, B.C.P.; Linden, R.; Pistos, C.; et al. Official International Association for Therapeutic Drug Monitoring and Clinical Toxicology Guideline: Development and Validation of Dried Blood Spot–Based Methods for Therapeutic Drug Monitoring. Ther. Drug Monit. 2019, 41, 409–430. [Google Scholar] [CrossRef]
- Bablok, W.; Passing, H. Application of Statistical Procedures in Analytical Instrument Testing. J. Autom. Chem. 1985, 7, 74–79. [Google Scholar] [CrossRef]
- Bland, J.M.; Altman, D.G. Statistical Methods for Assessing Agreement between Two Methods of Clinical Measurement. Lancet 1986, 1, 307–310. [Google Scholar] [CrossRef]
- Haberhauer-Troyer, C.; Delic, M.; Gasser, B.; Mattanovich, D.; Hann, S.; Koellensperger, G. Accurate Quantification of the Redox-Sensitive GSH/GSSG Ratios in the Yeast Pichia Pastoris by HILIC–MS/MS. Anal. Bioanal. Chem. 2013, 405, 2031–2039. [Google Scholar] [CrossRef]
- Giavarina, D. Understanding Bland Altman Analysis. Biochem. Med. 2015, 25, 141–151. [Google Scholar] [CrossRef] [Green Version]
- Vento, M.; Sastre, J.; Asensi, M.A.; Viña, J. Room-Air Resuscitation Causes Less Damage to Heart and Kidney than 100% Oxygen. Am. J. Respir. Crit. Care Med. 2005, 172, 1393–1398. [Google Scholar] [CrossRef]


Publisher’s Note: MDPI stays neutral with regard to jurisdictional claims in published maps and institutional affiliations. |
© 2022 by the authors. Licensee MDPI, Basel, Switzerland. This article is an open access article distributed under the terms and conditions of the Creative Commons Attribution (CC BY) license (https://creativecommons.org/licenses/by/4.0/).
Share and Cite
Ten-Doménech, I.; Solaz-García, Á.; Lara-Cantón, I.; Pinilla-Gonzalez, A.; Parra-Llorca, A.; Vento, M.; Quintás, G.; Kuligowski, J. Direct Derivatization in Dried Blood Spots for Oxidized and Reduced Glutathione Quantification in Newborns. Antioxidants 2022, 11, 1165. https://doi.org/10.3390/antiox11061165
Ten-Doménech I, Solaz-García Á, Lara-Cantón I, Pinilla-Gonzalez A, Parra-Llorca A, Vento M, Quintás G, Kuligowski J. Direct Derivatization in Dried Blood Spots for Oxidized and Reduced Glutathione Quantification in Newborns. Antioxidants. 2022; 11(6):1165. https://doi.org/10.3390/antiox11061165
Chicago/Turabian StyleTen-Doménech, Isabel, Álvaro Solaz-García, Inmaculada Lara-Cantón, Alejandro Pinilla-Gonzalez, Anna Parra-Llorca, Máximo Vento, Guillermo Quintás, and Julia Kuligowski. 2022. "Direct Derivatization in Dried Blood Spots for Oxidized and Reduced Glutathione Quantification in Newborns" Antioxidants 11, no. 6: 1165. https://doi.org/10.3390/antiox11061165