
TLR4 Signaling and Heme Oxygenase-1/Carbon Monoxide Pathway Crosstalk Induces Resiliency of Myeloma Plasma Cells to Bortezomib Treatment

 , ,
, ,  ,
,  , , , ,
Abstract
:
1. Introduction
2. Materials and Methods
2.1. Cell Culture and Treatments
2.2. Flow Cytometry
2.3. Immunofluorescence
2.4. Western Blot Analysis
2.5. RT-qPCR
2.6. Statistical Analysis
3. Results
3.1. TLR4 Inhibition Improved the Efficacy of BTZ through Increased Oxidative Stress Coupled with Mitophagy
3.2. TLR4 Signaling Induced HO-1 Expression through Nrf2 Activation in Myeloma Plasma Cells (or Promoted Nrf2/HO-1 Pathway in Myeloma Plasma Cells)
3.3. TAK-242/BTZ Cotreatment Decreased the Expression of HO-1 and UPR Survival Pathways
3.4. Inhibition of HO-1 Enzymatic Activity Improved the Pharmacological Response of Myeloma PCs to BTZ by Increasing ER Stress and Mitochondrial Damage
3.5. SnPP Alone Did Not Affect the Mitochondrial Polarization Status
3.6. HO-1 Regulated TLR4 Expression through Carbon Monoxide (CO) Production
4. Discussion
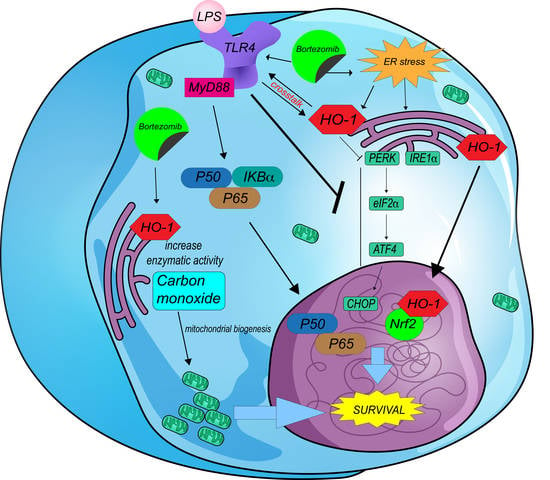
5. Conclusions
Supplementary Materials
Author Contributions
Funding
Institutional Review Board Statement
Informed Consent Statement
Data Availability Statement
Conflicts of Interest
References
- Robak, P.; Drozdz, I.; Szemraj, J.; Robak, T. Drug Resistance in Multiple Myeloma. Cancer Treat. Rev. 2018, 70, 199–208. [Google Scholar] [CrossRef] [PubMed]
- Li, J.; Yang, F.; Wei, F.; Ren, X. The Role of Toll-like Receptor 4 in Tumor Microenvironment. Oncotarget 2017, 8, 66656–66667. [Google Scholar] [CrossRef] [PubMed] [Green Version]
- Fitzgerald, K.A.; Palsson-McDermott, E.M.; Bowie, A.G.; Jefferies, C.A.; Mansell, A.S.; Brady, G.; Brint, E.; Dunne, A.; Gray, P.; Harte, M.T.; et al. Mal (MyD88-adapter-like) is Required for Toll-like Receptor-4 Signal Transduction. Nature 2001, 413, 78–83. [Google Scholar] [CrossRef] [PubMed]
- Giallongo, C.; Tibullo, D.; Puglisi, F.; Barbato, A.; Vicario, N.; Cambria, D.; Parrinello, N.L.; Romano, A.; Conticello, C.; Forte, S.; et al. Inhibition of TLR4 Signaling Affects Mitochondrial Fitness and Overcomes Bortezomib Resistance in Myeloma Plasma Cells. Cancers 2020, 12, 1999. [Google Scholar] [CrossRef] [PubMed]
- Tibullo, D.; Giallongo, C.; Romano, A.; Vicario, N.; Barbato, A.; Puglisi, F.; Parenti, R.; Amorini, A.M.; Saab, M.W.; Tavazzi, B.; et al. Mitochondrial Functions, Energy Metabolism and Protein Glycosylation are Interconnected Processes Mediating Resistance to Bortezomib in Multiple Myeloma Cells. Biomolecules 2020, 10, 696. [Google Scholar] [CrossRef]
- Zhan, X.; Yu, W.; Franqui-Machin, R.; Bates, M.L.; Nadiminti, K.; Cao, H.; Amendt, B.A.; Jethava, Y.; Frech, I.; Zhan, F.; et al. Alteration of Mitochondrial Biogenesis Promotes Disease Progression in Multiple Myeloma. Oncotarget 2017, 8, 111213–111224. [Google Scholar] [CrossRef]
- Barbato, A.; Scandura, G.; Puglisi, F.; Cambria, D.; La Spina, E.; Palumbo, G.A.; Lazzarino, G.; Tibullo, D.; Di Raimondo, F.; Giallongo, C.; et al. Mitochondrial Bioenergetics at the Onset of Drug Resistance in Hematological Malignancies: An Overview. Front. Oncol. 2020, 10, 604143. [Google Scholar] [CrossRef]
- Soriano, G.P.; Besse, L.; Li, N.; Kraus, M.; Besse, A.; Meeuwenoord, N.; Bader, J.; Everts, B.; den Dulk, H.; Overkleeft, H.S.; et al. Proteasome Inhibitor-Adapted Myeloma Cells Are Largely Independent from Proteasome Activity and Show Complex Proteomic Changes, in Particular in Redox and Energy Metabolism. Leukemia 2016, 30, 2198–2207. [Google Scholar] [CrossRef] [Green Version]
- Obeng, E.A.; Carlson, L.M.; Gutman, D.M.; Harrington, W.J., Jr.; Lee, K.P.; Boise, L.H. Proteasome Inhibitors Induce a Terminal Unfolded Protein Response in Multiple Myeloma Cells. Blood 2006, 107, 4907–4916. [Google Scholar] [CrossRef] [Green Version]
- Savic, S.; Ouboussad, L.; Dickie, L.J.; Geiler, J.; Wong, C.; Doody, G.M.; Churchman, S.M.; Ponchel, F.; Emery, P.; Cook, G.P.; et al. TLR Dependent XBP-1 Activation Induces an Autocrine Loop in Rheumatoid Arthritis Synoviocytes. J. Autoimmun. 2014, 50, 59–66. [Google Scholar] [CrossRef] [Green Version]
- Martinon, F.; Chen, X.; Lee, A.-H.; Glimcher, L.H. TLR Activation of the Transcription Factor XBP1 Regulates Innate Immune Responses in Macrophages. Nat. Immunol. 2010, 11, 411–418. [Google Scholar] [CrossRef] [PubMed]
- Bagratuni, T.; Sklirou, A.D.; Kastritis, E.; Liacos, C.I.; Spilioti, C.; Eleutherakis-Papaiakovou, E.; Kanellias, N.; Gavriatopoulou, M.; Terpos, E.; Trougakos, I.P.; et al. Toll-Like Receptor 4 Activation Promotes Multiple Myeloma Cell Growth and Survival Via Suppression of The Endoplasmic Reticulum Stress Factor Chop. Sci. Rep. 2019, 9, 3245. [Google Scholar] [CrossRef] [PubMed]
- Mohan, S.; Gupta, D. Crosstalk of Toll-like Receptors Signaling and Nrf2 Pathway for Regulation of Inflammation. Biomed. Pharmacother. 2018, 108, 1866–1878. [Google Scholar] [CrossRef] [PubMed]
- Chiang, S.-K.; Chen, S.-E.; Chang, L.-C. A Dual Role of Heme Oxygenase-1 in Cancer Cells. Int. J. Mol. Sci. 2018, 20, 39. [Google Scholar] [CrossRef] [Green Version]
- Piantadosi, C.A.; Withers, C.M.; Bartz, R.R.; MacGarvey, N.C.; Fu, P.; Sweeney, T.E.; Welty-Wolf, K.E.; Suliman, H.B. Heme Oxygenase-1 Couples Activation of Mitochondrial Biogenesis to Anti-inflammatory Cytokine Expression. J. Biol. Chem. 2011, 286, 16374–16385. [Google Scholar] [CrossRef] [Green Version]
- Tibullo, D.; Barbagallo, I.; Giallongo, C.; Vanella, L.; Conticello, C.; Romano, A.; Saccone, S.; Godos, J.; Di Raimondo, F.; Volti, G.L. Heme Oxygenase-1 Nuclear Translocation Regulates Bortezomib-Induced Cytotoxicity and Mediates Genomic Instability in Myeloma Cells. Oncotarget 2016, 7, 28868–28880. [Google Scholar] [CrossRef] [Green Version]
- Herroon, M.K.; Rajagurubandara, E.; Diedrich, J.D.; Heath, E.I.; Podgorski, I. Adipocyte-Activated Oxidative and ER Stress Pathways Promote Tumor Survival in Bone via Upregulation of Heme Oxygenase 1 and Survivin. Sci. Rep. 2018, 8, 40. [Google Scholar] [CrossRef] [Green Version]
- Chen, X.; Wang, Y.; Xie, X.; Chen, H.; Zhu, Q.; Ge, Z.; Wei, H.; Deng, J.; Xia, Z.; Lian, Q. Heme Oxygenase-1 Reduces Sepsis-Induced Endoplasmic Reticulum Stress and Acute Lung Injury. Mediat. Inflamm. 2018, 2018, 9413876. [Google Scholar] [CrossRef]
- Cullinan, S.B.; Diehl, J.A. PERK-dependent Activation of Nrf2 Contributes to Redox Homeostasis and Cell Survival following Endoplasmic Reticulum Stress. J. Biol. Chem. 2004, 279, 20108–20117. [Google Scholar] [CrossRef] [Green Version]
- Gáll, T.; Balla, G. Heme, Heme Oxygenase, and Endoplasmic Reticulum Stress—A New Insight into the Pathophysiology of Vascular Diseases. Int. J. Mol. Sci. 2019, 20, 3675. [Google Scholar] [CrossRef] [Green Version]
- Giallongo, C.; Dulcamare, I.; Tibullo, D.; Del Fabro, V.; Vicario, N.; Parrinello, N.; Romano, A.; Scandura, G.; Lazzarino, G.; Conticello, C.; et al. CXCL12/CXCR4 Axis Supports Mitochondrial Trafficking in Tumor Myeloma Microenvironment. Oncogenesis 2022, 11, 6. [Google Scholar] [CrossRef] [PubMed]
- Kubli, D.A.; Gustafsson, Å.B. Mitochondria and mitophagy: The yin and yang of cell death control. Circ. Res. 2012, 111, 1208–1221. [Google Scholar] [CrossRef] [PubMed] [Green Version]
- Lebeau, J.; Saunders, J.M.; Moraes, V.W.; Madhavan, A.; Madrazo, N.; Anthony, M.C.; Wiseman, R.L. The PERK Arm of the Unfolded Protein Response Regulates Mitochondrial Morphology during Acute Endoplasmic Reticulum Stress. Cell Rep. 2018, 22, 2827–2836. [Google Scholar] [CrossRef] [PubMed] [Green Version]
- Gorojod, R.M.; Alaimo, A.; Alcon, S.P.; Martinez, J.H.; Cortina, M.E.; Vazquez, E.S.; Kotler, M.L. Heme Oxygenase-1 Protects Astroglia against Manganese-Induced Oxidative Injury by Regulating Mitochondrial Quality Control. Toxicol. Lett. 2018, 295, 357–368. [Google Scholar] [CrossRef]
- Song, L.; Huang, Y.; Hou, X.; Yang, Y.; Kala, S.; Qiu, Z.; Zhang, R.; Sun, L. PINK1/Parkin-Mediated Mitophagy Promotes Resistance to Sonodynamic Therapy. Cell. Physiol. Biochem. 2018, 49, 1825–1839. [Google Scholar] [CrossRef] [PubMed]
- Twig, G.; Shirihai, O.S. The Interplay Between Mitochondrial Dynamics and Mitophagy. Antioxid. Redox Signal. 2011, 14, 1939–1951. [Google Scholar] [CrossRef] [PubMed] [Green Version]
- Jones, E.; Gaytan, N.; Garcia, I.; Herrera, A.; Ramos, M.; Agarwala, D.; Rana, M.; Innis-Whitehouse, W.; Schuenzel, E.; Gilkerson, R. A Threshold of Transmembrane Potential Is Required for Mitochondrial Dynamic Balance Mediated by DRP1 and OMA1. Cell. Mol. Life Sci. 2017, 74, 1347–1363. [Google Scholar] [CrossRef] [Green Version]
- Liu, J.; Liu, W.; Li, R.; Yang, H. Mitophagy in Parkinson’s Disease: From Pathogenesis to Treatment. Cells 2019, 8, 712. [Google Scholar] [CrossRef] [Green Version]
- Lee, A.S. The ER Chaperone and Signaling Regulator GRP78/BiP as a Monitor of Endoplasmic Reticulum Stress. Methods 2005, 35, 373–381. [Google Scholar] [CrossRef]
- Wang, M.; Wey, S.; Zhang, Y.; Ye, R.; Lee, A.S. Role of the Unfolded Protein Response Regulator GRP78/BiP in Development, Cancer, and Neurological Disorders. Antioxid. Redox Signal. 2009, 11, 2307–2316. [Google Scholar] [CrossRef]
- Nikesitch, N.; Lee, J.M.; Ling, S.; Roberts, T.L. Endoplasmic Reticulum Stress in the Development of Multiple Myeloma and Drug Resistance. Clin. Transl. Immunol. 2018, 7, e1007. [Google Scholar] [CrossRef] [PubMed] [Green Version]
- Vijayan, V.; Baumgart-Vogt, E.; Naidu, S.; Qian, G.; Immenschuh, S. Bruton’s Tyrosine Kinase Is Required for TLR-Dependent Heme Oxygenase-1 Gene Activation via Nrf2 in Macrophages. J. Immunol. 2011, 187, 817–827. [Google Scholar] [CrossRef] [PubMed] [Green Version]
- Tibullo, D.; Barbagallo, I.; Giallongo, C.; La Cava, P.; Parrinello, N.; Vanella, L.; Stagno, F.; Palumbo, G.A.; Li Volti, G.; Di Raimondo, F. Nuclear translocation of heme oxygenase-1 confers resistance to imatinib in chronic myeloid leukemia cells. Curr. Pharm. Des. 2013, 19, 2765–2770. [Google Scholar] [CrossRef]
- Maugeri, G.; D’Amico, A.G.; Giunta, S.; Giallongo, C.; Tibullo, D.; Bucolo, C.; Saccone, S.; Federico, C.; Scollo, D.; Longo, A.; et al. Activity-Dependent Neuroprotective Protein (ADNP)-Derived Peptide (NAP) Counteracts UV-B Radiation-Induced ROS Formation in Corneal Epithelium. Antioxidants 2022, 11, 128. [Google Scholar] [CrossRef] [PubMed]


Publisher’s Note: MDPI stays neutral with regard to jurisdictional claims in published maps and institutional affiliations. |
© 2022 by the authors. Licensee MDPI, Basel, Switzerland. This article is an open access article distributed under the terms and conditions of the Creative Commons Attribution (CC BY) license (https://creativecommons.org/licenses/by/4.0/).
Share and Cite
Scandura, G.; Giallongo, C.; Puglisi, F.; Romano, A.; Parrinello, N.L.; Zuppelli, T.; Longhitano, L.; Giallongo, S.; Di Rosa, M.; Musumeci, G.; et al. TLR4 Signaling and Heme Oxygenase-1/Carbon Monoxide Pathway Crosstalk Induces Resiliency of Myeloma Plasma Cells to Bortezomib Treatment. Antioxidants 2022, 11, 767. https://doi.org/10.3390/antiox11040767
Scandura G, Giallongo C, Puglisi F, Romano A, Parrinello NL, Zuppelli T, Longhitano L, Giallongo S, Di Rosa M, Musumeci G, et al. TLR4 Signaling and Heme Oxygenase-1/Carbon Monoxide Pathway Crosstalk Induces Resiliency of Myeloma Plasma Cells to Bortezomib Treatment. Antioxidants. 2022; 11(4):767. https://doi.org/10.3390/antiox11040767
Chicago/Turabian StyleScandura, Grazia, Cesarina Giallongo, Fabrizio Puglisi, Alessandra Romano, Nunziatina Laura Parrinello, Tatiana Zuppelli, Lucia Longhitano, Sebastiano Giallongo, Michelino Di Rosa, Giuseppe Musumeci, and et al. 2022. "TLR4 Signaling and Heme Oxygenase-1/Carbon Monoxide Pathway Crosstalk Induces Resiliency of Myeloma Plasma Cells to Bortezomib Treatment" Antioxidants 11, no. 4: 767. https://doi.org/10.3390/antiox11040767