1. Introduction
Temperature and salinity are important environmental properties that affect the physiological activities and antioxidant defense systems of fish in aquatic environments; accordingly, they have an important impact on the survival and growth of fish [
1,
2,
3,
4]. When the environmental salinity or temperature changes abnormally, it causes a variety of physiological stress reactions in fish, and the production of reactive oxygen species (ROS) increases accordingly [
3,
4,
5]. ROS not cleared effectively damage the body of the fish, causing adverse effects such as enzyme inactivation, lipid peroxidation, and DNA damage [
6,
7], and also attack their immune and epidemic prevention mechanisms, further damaging the normal growth and survival of the fish. Fish have an antioxidant enzyme system that includes superoxide dismutase (SOD), catalase (CAT), and glutathione peroxidase (GPX) [
8]. The antioxidant enzyme system plays an important role in removing excessive reactive oxygen free radicals, thereby alleviating self-damage and improving the defensive ability of immune cells [
9]. In an environment with unsuitable salinity or temperature, the antioxidant enzyme system is an important immune defense used by fish to resist environmental stress [
10].
The main method of culturing turbot in China is the running water industrialized culture mode of “greenhouse + deep well seawater”, which is inevitably affected by the salinity of groundwater. Although turbot has a wide range of tolerance to salinity [
11], long-term inappropriate salinity will have a great impact on the growth of turbot, which hinders development. In addition, turbot (
Scophthalmus maximus) is a cold water fish, its maximum temperature for growth is 21–22 °C, and its optimum growth temperature is 14–17 °C. The survival rate and growth of turbot are negatively impacted at water temperatures > 23° C [
12,
13]. Obviously, turbot can tolerate only a narrow range of temperatures, which means that temperature has a profound impact on turbot culture and the rearing of young. The natural seawater temperature in northern China is high in summer. Turbot show slow growth and a low survival rate when cultured under high-temperature environments. Therefore, studying the salinity and temperature tolerance of turbot and breeding salt- and heat-tolerant varieties are of great significance to aquaculture and the economy.
Since changes in antioxidant enzyme activity reflect the physiological status of fish under different environmental conditions to a certain extent, they can be used as a physiological index to measure the degree to which fish are under external environmental stress [
14]. Therefore, antioxidant properties can be used as a salt- and heat-tolerance index for turbot breeding. Studies on the effect of fish salinity and temperature on antioxidant enzyme activity have been reported previously [
15,
16,
17,
18,
19]. Wang et al. (2005) showed that the activities of SOD and CAT in the blood of
Sebastes schlegelii increased gradually with a decrease in seawater salinity [
15]. Liu et al. (2013) studied the effects of different salinities on the activities of SOD, CAT, and GPX in the liver of
Trachinotus ovatus at different temperatures. The results show that, at 18 and 21 °C, SOD activity was higher than that in the control group at 1, 3, 6, 12, and 24 h, while CAT activity was significantly higher than that in the control group at 24 h; at 29 °C, the activities of SOD and CAT at the 24 h sampling point were significantly higher than those in the control group; and at 32 °C, the activities of SOD and CAT at the five sampling time points were significantly lower than those in the control group [
16]. Li et al. (2021) [
17] studied the effects of different temperatures on the activity of SOD in black sea bass (
Centropristis striata) and reported that SOD activity decreased first and then increased with increasing temperature on day 1 of the experiment, but increased gradually with increasing temperature on day 60 of the experiment. Liu et al. (2016) [
18] studied the activities of antioxidant enzymes in the liver and intestine of
Larimichthys polyactis at different water temperatures. They found that the activities of SOD in the liver and intestine and CAT in the liver increased first and then decreased with increasing water temperature, but the effect of temperature on CAT activity in the intestine was not significant. Guo et al. (2012) studied the effects of different salinities/temperatures on the activities of antioxidant enzymes in the body surface mucus, blood, gills, and liver of
S. maximus under different salinities/temperatures. The results showed that salinity/temperature had a significant effect on the activities of SOD, CAT, and GPX: when the temperature was constant and the salinity changed, the activities of various enzymes in the liver, gill, serum, and mucus were lower at normal seawater salinity (30‰) and increased with decreasing or increasing salinity; when the salinity was constant and the temperature increased, the changes in enzyme activity in each tissue were not significant [
19]. These studies provide basic data on salinity/temperature tolerance breeding and the disease control of fish.
However, in animal and plant breeding, first, the genetic mechanism of breeding indexes should be studied, and then the breeding plan should be formulated on this basis. The activity of antioxidant properties is different under different salinities/temperatures. This difference may be attributed not only to different salinities/temperatures, but also to the effects of genotype itself and the interaction between genotype and salinity/temperature. Therefore, genetic analysis of the interaction between antioxidant and salinity/temperature is of great significance for an in-depth understanding of the genetic roles of SOD, CAT, and GPX and for determining the tolerance salinity/temperature range of S. maximus. However, for this topic, research on S. maximus has not been reported.
In this study, split-plot (SP) analysis, additive main effects, and multiplicative interaction (AMMI) [
20] and genotype main effects and genotype × environment interaction (GGE) biplots [
21] were used to analyze genotype × salinity/temperature interactions for antioxidant properties in
S. maximus. The purpose of this study was to analyze the genetic mechanism of antioxidant properties in
S. maximus in depth so that a reference could be provided for formulating a breeding plan for salinity/temperature tolerance using antioxidant properties as breeding indexes.
2. Materials and Methods
2.1. Ethics Statement
All experimental treatments for artificially cultivated fish were performed according to the recommendations in the Guide for the Care and Use of Laboratory Animals of the National Institutes of Health, China. The study protocol followed the recommendations of the Experimental Animal Ethics Committee, Yellow Sea Fisheries Research Institute, Chinese Academy of Fishery Sciences, China (decision no: YSFRI-2022021).
2.2. Experimental Materials
The young turbots were raised in Tianyuan Aquatic Limited Corporation in Yantai, China. The individual weight was 80.6 ± 6.3 g. They were all healthy young fish that were artificially bred. Five salinity/temperature levels were set in the experiment (5, 10, 20, 30 and 40‰/17, 20, 23, 25, and 28 °C) and three repetitions were set for each salinity/temperature level. The experiment was carried out in glass tanks, each containing about 300 L of seawater and stocking 30 fish. The experimental fish were kept in a glass tank for a week before the experiment began. Throughout the temporary holding and experiment, the fish were fed bait at 9:00 every day, the tank was aerated continuously, and the water was changed once a day. For the salinity part of the experiment: The normal salinity of seawater is 30‰. Low-salinity seawater was prepared from underground seawater and freshwater, and high-salinity seawater was prepared from underground seawater and sea crystal. The static water method was used to aerate the culture and an automatic heater was used to obtain a constant temperature of 17 °C. For temperature part of the experiment: The water temperature was increased to 17 °C from normal temperature (13 °C) for 24 h and then to each test temperature at a rate of 1 °C every 16 h. Static water aeration culture was used, and the temperature was controlled by automatic thermostatic heaters. The salinity was controlled at 30‰. In addition, under these two experimental conditions, the illumination intensity was 500−1500 lx, the pH was 7.6–8.2, the dissolved oxygen content was 7.8 ± 0.2 mg/L, and the TAN content was <0.1 mg/L. After staying at the set salinity/temperature for 48 h, three fish were randomly taken from each tank and anesthetized with MS-222 (tricaine methane sulfonate) (Maya Reagent Limited Corporation, Jiaxing, China). After disinfection, the liver of each fish was removed using scissors, rinsed gently with precooled distilled water, dried with filter paper, and placed in a 1.5 mL centrifuge tube. The samples were temporarily stored in a freezer at −20 °C for 24 h, and then transferred to a freezer at −80°C for use in the next part of the experiment.
2.3. Experimental Methods
2.3.1. Preparation of Enzyme Solution
To prepare the liver samples for enzyme analysis, we removed each sample from the freezer, moistened it with distilled water at 4 °C, dried it with filter paper, added nine times the volume of normal saline (0.86%) per gram of tissue, and homogenized the mixture in an ice bath using a glass homogenizer. The homogenate was centrifuged at 12,000 rpm at 4 °C for 30 min, and the supernatant was removed to measure enzyme activities.
2.3.2. Enzyme Activity Measurements
The activities of SOD, CAT, and GPX were measured using kits purchased from Nanjing Jiancheng Biological Engineering Research Institute (Jiangsu, China).
SOD
SOD activity was measured using the WST-1 method. The absorbance value was measured by colorimetry at 550 nm to calculate its activity. The unit of activity (U/mg) was defined as the amount of SOD corresponding to the inhibition rate of SOD per milligram of tissue protein in a 1 mL reaction solution that reached 50%.
CAT
CAT activity was measured using the visible light method, and the amount of H2O2 reduction was measured at 450 nm. The amount of H2O2 decomposed by 1 μmol per milligram of tissue protein per second was defined as one unit of activity (U/mg).
GPX
GPX activity was calculated by measuring the consumption of glutathione at 412 nm. The definition of one unit of activity was as follows: for every mg of protein, the effect of non-enzymatic reaction was deducted every minute to reduce the concentration of glutathione in the reaction system. The unit of enzyme activity was defined as the concentration of glutathione (GSH) in the reaction system reduced by 1 μmol/L (U/mg).
2.4. Data Analysis
2.4.1. SP Analysis
This experiment was laid out as a split-plot design; salinity/temperature was set as the main-plot property, with the five salinity/temperature gradients (5, 10, 20, 30, and 40‰/17, 20, 23, 25, and 28 °C) assigned to five main plots in each of three complete replicate blocks, while antioxidant enzyme was set as the sub-plot property, with the three antioxidant enzymes (CAT, SOD, and GPX) assigned to three sub-plots within each main plot. The split-plot analysis model can be written as follows:
where
is the activity of the
m-th salinity/temperature treatment for the
n-th antioxidant enzyme in the
p-th complete block;
,
, and
are the
mn-th treatment effect, the general intercept, and the effect of the
p-th block, respectively;
is the main-plot error associated with the
p-th block and
m-th activity gradient, assumed to be random with a mean of zero and a variance of
; and
is a residual sub-plot error with a mean of zero and a variance of
.
2.4.2. AMMI Analysis
The main feature of the AMMI model integrates the analysis of variance and principal component analysis [
20]. The AMMI model for the
g-th genotype (SOD, CAT, and GPX) in the
e-th salinity/temperature (5, 10, 20, 30, and 40‰/17, 20, 23, 25, and 28 °C) can be written as follows:
where
is the activity of antioxidant enzymes for genotype
g at salinity/temperature
e;
,
, and
are the average deviation of the salinity/temperature, the grand mean, and the average deviation of genotypes, respectively;
is the salinity/temperature principal component score of the
n-th principal component;
is the genotype principal component score of the
n-th principal component;
is the eigenvalue of the
n-th interaction principal component axis;
M is the total number of principal component axes; and
is the residual.
2.4.3. GGE Biplot Analysis
GGE biplot analysis can reveal the complex interaction between different properties [
22,
23,
24]. The antioxidant activity data obtained from fish cultured at different salinities/temperatures were sorted into a two-way table that included salinity/temperature and antioxidant enzyme activity. For each mean value of activity, there was a corresponding antioxidant property at the corresponding salinity/temperature. Singular value decomposition of the first two principal components was used to fit the GGE biplot model [
21] as follows:
where
is the trait mean activity for genotype
g at salinity/temperature
e;
,
, and
are the grand mean, the main effect of salinity/temperature
e, and the mean activity across all genotypes at salinity/temperature
e, respectively;
and
are eigenvectors of salinity/temperature
e for PC1 and PC2, respectively;
and
are eigenvectors for genotype
g for PC1 and PC2, respectively;
and
are the singular values for the first and second principal components (PC1 and PC2), respectively; and
is the residual associated with genotype
g at salinity/temperature
e.
The SP, AMMI, and GGE biplot analyses were conducted using the DPS data processing system [
25].
4. Discussion
Salinity and temperature are important properties that induce oxidative stress in fish. Under salinity/temperature stress, fish accumulate a large amount of ROS, causing oxidative damage, and macromolecular substances such as lipids, nucleic acids, and sugars are oxidized, resulting in metabolic dysfunction in the fish [
26]. Therefore, ROS must be cleared rapidly and effectively. SOD, CAT, and GPX play decisive roles in scavenging ROS free radicals produced in the process of oxidative stress [
27]. SOD can react with free radicals to produce H
2O
2. CAT can reduce H
2O
2 into oxygen molecules and water, or H
2O
2 can be cleared by GPX [
28], thereby preventing oxidative damage by free radicals to biological macromolecules in the body, and maintaining the normal physiological activities of cells and the body. Thus, changes in SOD, CAT, and GPX activities can reflect the physiological conditions of organisms under different stress conditions [
18], and they can be used as an indirect selection index for breeding turbot with salinity/temperature resistance.
The liver is one of the most active metabolic organs in the body. It plays an important role in regulating osmotic pressure and maintaining normal physiological activities in fish. It can decompose metabolites and toxic substances in the body. The content of ROS in the liver is an important index for evaluating the oxidative stress response and antioxidant defense ability of fish [
29]. Therefore, in the current study, we used turbot livers to study the activity of antioxidant enzymes.
Considering the significance of antioxidant enzymes in scavenging free radicals in fish, salt/heat tolerance breeding with antioxidant enzymes as an indirect selection index is a method that is worth exploring. Studies on the breeding of turbot using antioxidant properties as breeding indexes have been reported. Guo et al. (2012) studied the effects of different temperatures and salinities on antioxidant enzyme activities in juvenile turbot. The results showed that salinity and temperature had a significant effect on the activities of SOD, CAT, and GPX. The activities of SOD, CAT, and GPX were lower at a salinity of 30‰ and higher at a salinity of 5 and 40‰. Their activities increased with a decrease or increase in salinity from 30‰; the activities of SOD, CAT, and GPX fluctuated with an increase in temperature, but overall their activities changed significantly with increasing temperature [
19]. These conclusions provide basic data for salt/heat tolerance breeding of turbot. However, the activity of antioxidant properties under different salinities/temperatures is affected not only by the effect of salinity/temperature, but also by genotype and the interaction between salinity/temperature and genotype. Therefore, it is of great significance to analyze the effect of the interaction between genotype and salinity/temperature with antioxidant properties and clarify the genetic mechanism of antioxidant properties for the formulation of salt- and heat-tolerant breeding in turbot.
In the current study, the interactions between antioxidant, genotype, and salinity/temperature in turbot were determined using SP, AMMI, and GGE biplot analyses. The results of the SP analysis showed that the activity of the three antioxidant properties was significantly (p < 0.01) affected by salinity/temperature, antioxidant, and salinity/temperature × antioxidant interaction, which indicates that it is worthwhile to investigate genotype × salinity/temperature interactions for S. maximus antioxidant properties.
The results from AMMI analysis for salinity revealed that the effects of genotype, salinity, and genotype × salinity interaction on antioxidant properties reached a significant level (
p < 0.001) within the current experimental salinity range (5–40‰). The genotype effect accounted for 92.1065% of the total sum of squares for antioxidant activity, while the effect of salinity and genotype × salinity interaction accounted for only 7.0616% of the total sum of squares, which showed that the difference in antioxidant property activity was mainly due to the genotype effect. Genotypes effect play a decisive role in the activity of antioxidants, which may be related to the wide range of salt tolerance in turbot. Studies have shown that adult turbot can grow in a salinity range of 12–40, and even survive in a water environment with salinity as low as 5 [
11,
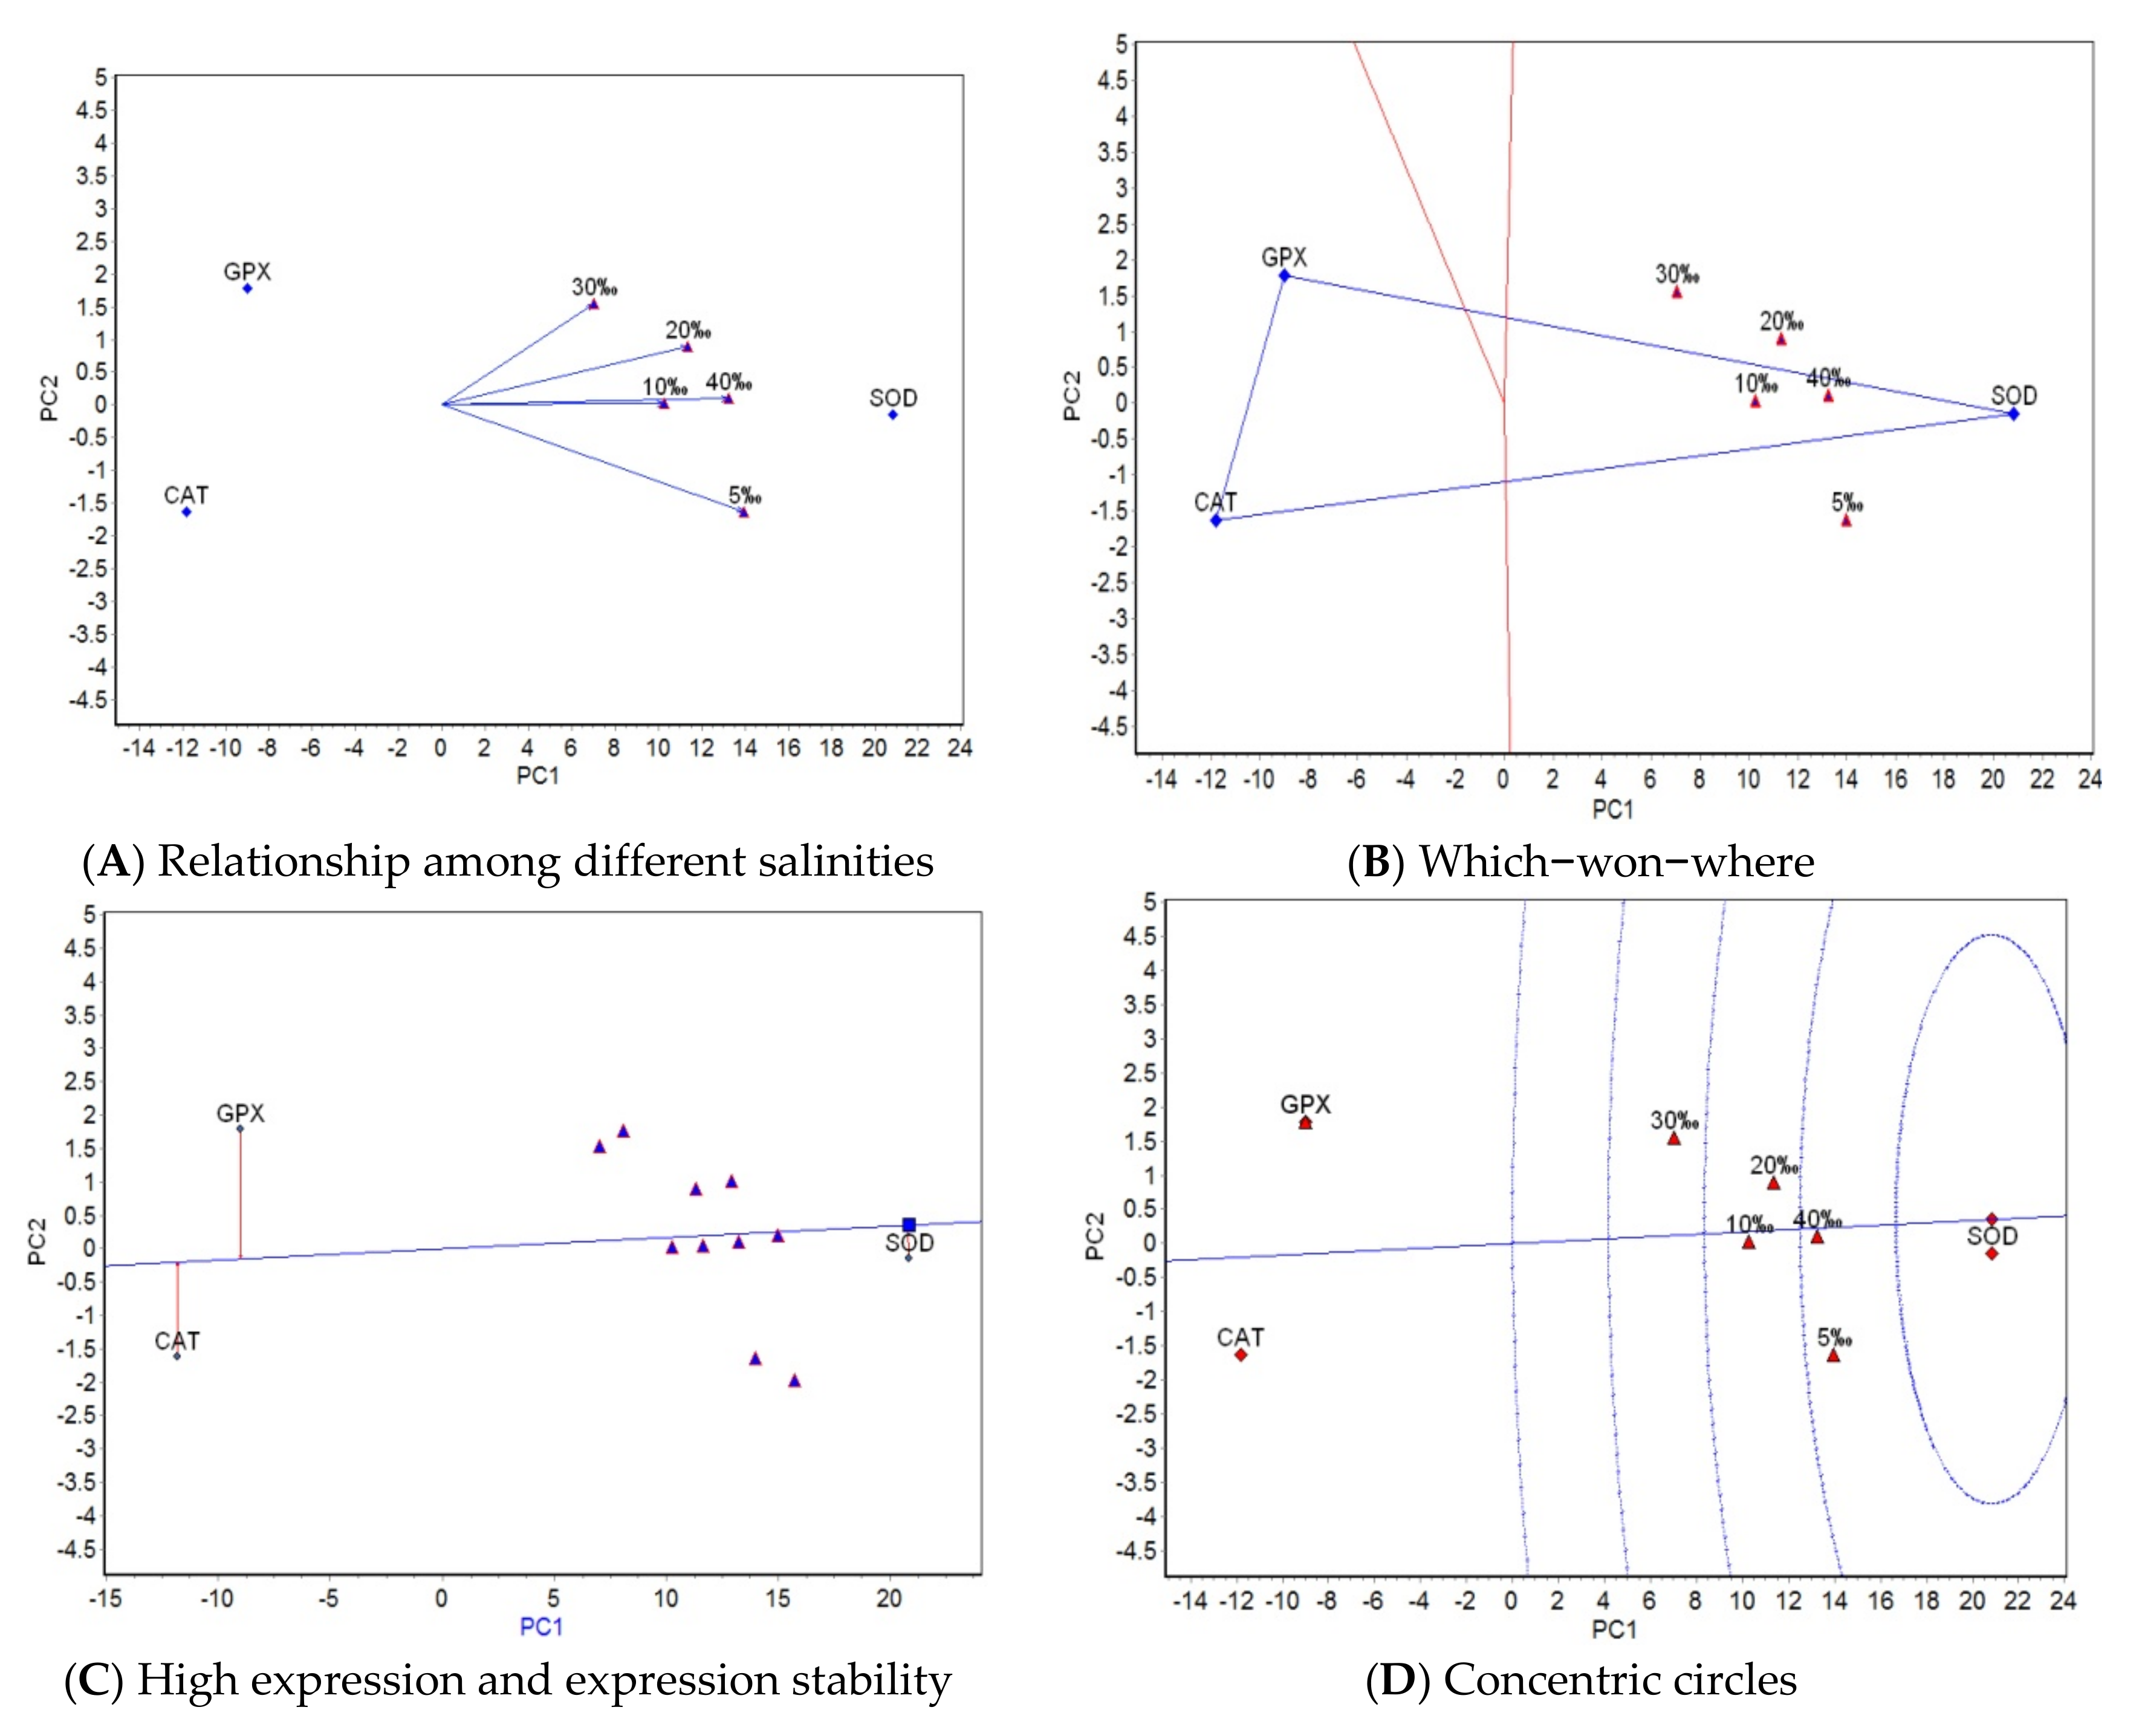
30]. Therefore, it is not ideal to use the current salinity range (5–40‰) for a salt tolerance test. To show the dominant effect of salinity in a salt tolerance test with turbot, it is necessary to further expand the upper and/or lower limits of salinity. The results from the GGE biplot analysis for salinity indicate differences in the activity ranking of the three antioxidant properties under five salinities, except between 10‰ and 40‰ salinity. These differences expand with a decrease or increase in salinity from 30‰ (optimum salinity), which indicates that the greater the difference between stressful salinity and optimum salinity, the greater the difference in the mechanism of the physiological and biochemical reaction of antioxidant properties. The activity rankings of the three antioxidant properties at salinities of 10‰ and 40‰ are almost the same, which shows that the physiological and biochemical reaction mechanism of antioxidant properties is the same under a low salt concentration of 10‰ and a high salt concentration of 40‰. A salinity of 5‰ had the strongest ability to identify the three antioxidant properties. According to the interaction between antioxidant and salinity, the five experimental salinities were divided into one region, and SOD activity was the highest in this region. In a comprehensive analysis of stability and expression, SOD had the best activity and stability. In conclusion, the differences in the activities of antioxidant properties corresponding to SOD, CAT, and GPX under different salinities could be attributed to the different antioxidant response mechanisms under different levels of salinity stress. When the salinity changes, the antioxidant properties that play a leading role in the five salinities are different.
The results from AMMI analysis for temperature reveal that genotype plays a decisive role in antioxidant activity, likely for the following two reasons: (1) even under extreme high-temperature conditions (28 °C), the activity of antioxidant properties still depends mainly on the genotype effect rather than on the effects of temperature and the interaction between temperature and genotype; (2) with increasing stressful temperature, the activity of antioxidant enzymes in turbot increases to deal with the free radicals, and the temperature effect is strong at first; however, when the temperature exceeds the tolerance limit, the body weakens, the enzyme activity decreases, and the temperature effect decreases. When the temperature effects of the two stages are combined, the temperature effect does not dominate the impact on antioxidant properties within the temperature range tested in this study. Turbot have strict requirements for temperature and other environmental indicators. The suitable water temperature for their growth is 14–17 °C; the maximum temperature at which they can grow is 21–22 °C; their upper temperature limit is 25–26 °C (though they cannot stay at this temperature for very long); and 28 °C is their lethal temperature [
11,
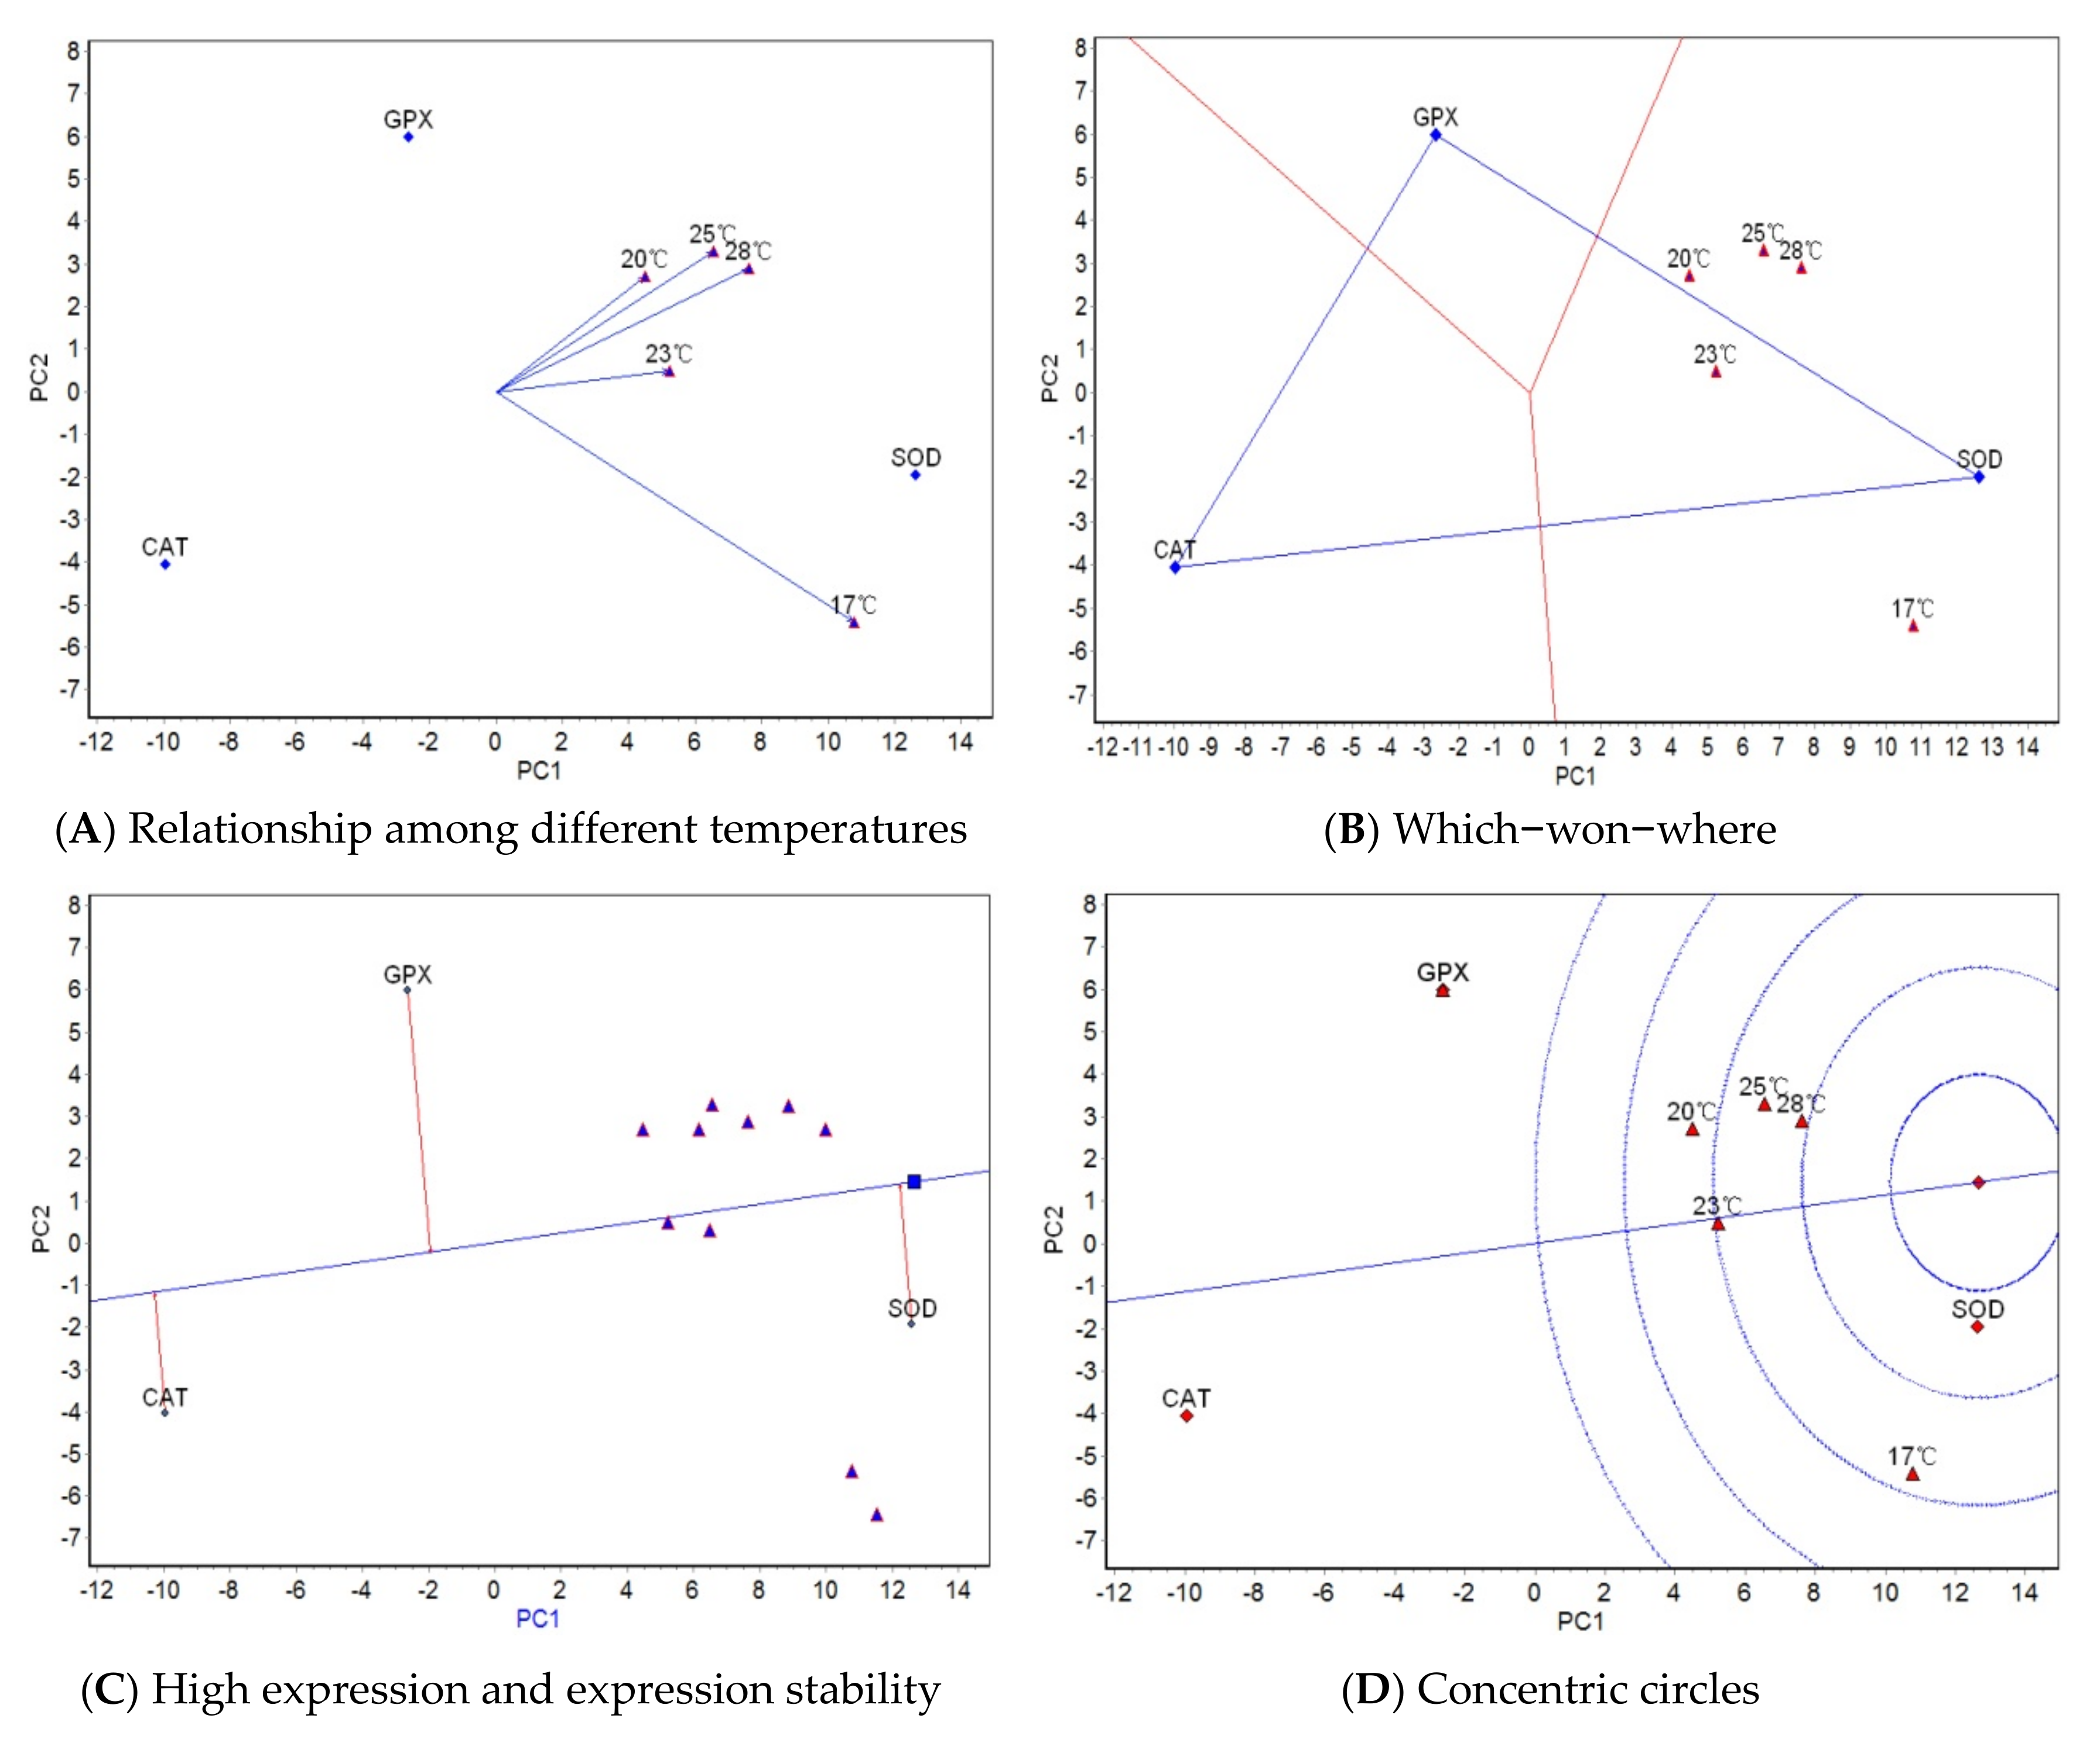
12]. In our study, the temperature effect on turbot was not dominant, and we believe the second reason described above may have been at work. Therefore, using the current temperature range of 17 to 28 °C to carry out high-temperature resistance tests was not ideal; the upper limit of the test temperature needs to be decreased. The GGE biplot analysis for temperature revealed some differences in the activity rankings of the three antioxidant properties under the five temperatures. There was a large difference in the activity rankings of antioxidant properties between 17 °C and the other four temperatures, while the difference among the other four temperatures was small. This is because 17 °C was the upper limit of suitable water temperature for turbot growth, whereas the other four temperatures were stressful temperatures for turbot growth. Obviously, the reaction mechanism of antioxidant properties under an appropriate water temperature was quite different from that under a high temperature, and the reaction mechanisms among the high temperature groups were more similar. The difference in the activity rankings of antioxidant properties between 17 °C and 20 °C was the largest because 20 °C is close to the growth limit temperature of turbot. When the growth limit temperature is exceeded, the body becomes weak and the enzyme activities decrease. A temperature of 17 °C had the strongest ability to distinguish the three antioxidant properties, which showed that the difference in the reaction mechanism among the three antioxidant properties was greatest at the appropriate water temperature for growth. The other GGE biplots show that the five test temperatures can be grouped into one region, and that SOD had the best activity and stability. In conclusion, the observed differences in the activities of SOD, CAT, and GPX under different stressful temperatures were likely due to the different antioxidant response mechanisms at work under different culture temperatures, and the antioxidant properties that played a leading role in the response to temperature change differed at different temperatures.
5. Conclusions
Salinity/temperature and salinity/temperature × antioxidant interaction have a significant effect on the activity of S. maximus antioxidant properties. Despite antioxidant properties reaching a significant level in response to salinity/temperature, the salinity/temperature accounted for only 2.6256%/4.0666% of the total sum of squares. Therefore, salinity/temperature was not the major contributor to the total variation in antioxidant enzyme activity, which indicates that using the current salinity/temperature range (5–40‰/17–28 °C) to carry out salinity and temperature resistance tests is not ideal. The upper and/or lower limits of salinity need to be expanded further, and the upper limit of the test temperature needs to be decreased. In a comprehensive analysis of activity and stability, SOD has the best activity and stability for both salinity and temperature, which indicates that, within the current experimental salinity/temperature range, SOD should be the preferred breeding index for the salinity/temperature-resistant breeding of turbot. Generally, primary and secondary lipid oxidation compounds (LPO and MDA) are also used as important indicators of lipid peroxidation. However, the purpose of this study was to screen breeding indexes for salinity/temperature tolerance breeding based on the genetic mechanism of antioxidant properties. MDA content is the final reaction of the interaction between oxygen free radicals and the redox system in the body under external stress, and it cannot purely reflect the degree of external stress or the antioxidant capacity, but rather the interaction between the two; at the same time, LPO is unstable. Therefore, LPO and MDA were not measured in this study.


