3.1. Disulfiram Augments O2●−/H2O2 Production by Liver Mitochondria Oxidizing UQ-Linked Substrates
We had observed previously that glutathionylation catalyst disulfiram increased O
2●−/H
2O
2 production when UQ pool substrates G3P, Pro, or succinate were used as fuels for liver mitochondria [
25]. We had hypothesized in this previous report that glutathionylation would impede ROS production through inhibition of GPD and PRODH [
25]. This hypothesis was formulated based on our previous discovery that glutathionylation of pyruvate dehydrogenase, α-ketoglutarate dehydrogenase, and complex I (when operating in a forward, NADH fueled direction) inhibits mitochondrial O
2●−/H
2O
2 genesis (reviewed in [
10]). However, in the report using G3P, Pro, and succinate, we found glutathionylation increased ROS production during the oxidation of UQ substrates [
25]. Inhibitor studies suggested this increase in ROS production was due to a blockage of electron flow during RET to complex I. In the present study, we set out to examine if complex I glutathionylation accounted for this increase in RET driven ROS genesis. However, before proceeding, we first repeated the experiments published in our recent report on the glutathionylation-mediated increase in ROS production during UQ substrate oxidation [
25]. Fueling mitochondria with G3P and Pro confirmed increasing doses of disulfiram augmented ROS production by liver mitochondria (
Figure 2). Doses of disulfiram as low as 100 nM induced a significant increase in O
2●−/H
2O
2 production when mitochondria were fueled by G3P (
Figure 2A). Disulfiram also increased ROS production when Pro was the substrate. Treatment of mitochondria with up to 250 nM disulfiram did not induce any significant changes in O
2●−/H
2O
2 production (
Figure 2B). However, 500 and 1000 nM disulfiram induced a more than ~2-fold increase in ROS generation (
Figure 2B).
Figure 4.
Disulfiram dose dependently increases the total number of protein glutathione mixed disulfides (PSSG) in mitochondria but does not alter the activities of (A) GPD and (B) PRODH. The activities of both enzymes were estimated using mitochondria treated with increasing doses of disulfiram and 1 mM GSH. The activity of GPD and PRODH was verified with iGP and TFA, respectively. N = 4, mean ± SEM, 1-way ANOVA with a post-hoc Fisher’s LSD test. * p ≤ 0.05, *** p ≤ 0.001. (C) Isolated mitochondria were subjected to immunoblot analysis for PSSG following treatment with disulfiram and 1 mM GSH. Samples were also electrophoresed under reducing conditions (with β-mercaptoethanol; +βMeOH) to confirm the specificity of the protein glutathione disulfide adduct (PSSG) anti-serum.
Next, we examined the sources of ROS in the electron transport chain using a panel of inhibitors for complex I, III, GPD, and PRODH, respectively. GPD and PRODH can generate high amounts of ROS in certain cells, like flight muscles in insects or brown fat [
27,
28]. However, GPD and PRODH display only modest rates for O
2●−/H
2O
2 production in liver, muscle, and cardiac tissue from rodents [
27,
29,
30]. It has also been estimated most of the ROS produced during G3P and Pro oxidation occurs following RET to complex I and FET to complex III [
20]. We first interrogated the different sites for this ROS production using complex I and III inhibitors, rotenone and myxothiazol (
Figure 3A). Both compounds decrease ROS production by both complexes during RET (complex I; rotenone) and FET (complex III; myxothiazol). Atpenin A5 was included to negate electron transfer to complex II from the UQ pool, eliminating ROS formation by RET to this site (
Figure 3A). The rate for ROS production decreased to control levels when mitochondria fueled with G3P or Pro were exposed to either inhibitors (
Figure 3B,C). Co-treatment with both rotenone and myxothiazol almost abolished ROS production by mitochondria energized with either substrate (
Figure 3B,C). We followed up these experiments using new inhibitors for ROS production by complexes I and III, S1QEL and S3QEL. In contrast to rotenone and myxothiazol, S1QEL and S3QEL reportedly prevent ROS production by complexes I and III without blocking respiration (
Figure 3D) [
31]. Thus, the advantage to using these two inhibitors is the elimination of interference from artificial electron accumulation in sites for ROS production. We also included experiments with GPD and PRODH inhibitors, iGP and TFA (
Figure 3D). Inclusion of S1QEL and S3QEL in the reaction mixtures lowered ROS production in disulfiram-treated mitochondria energized with G3P or Pro (
Figure 3E,F). Inclusion of iGP also significantly decreased O
2●−/H
2O
2 production in mitochondria fueled with G3P (
Figure 3E). We conducted similar experiments in
Figure 3F with PRODH inhibitor, TFA. Incubations in 1 mM TFA did not induce a significant decrease in production, even though a trend for a decrease was observed (
Figure 3F). Taken together, our observations show UQ-linked substrates can fuel high rates for O
2●−/H
2O
2 production by RET to complex I and FET to complex III.
3.2. GPD and PRODH Are not Glutathionylation Targets
So far, the results presented above demonstrate glutathionylation can augment ROS production by the electron transport chain when UQ-linked substrates G3P and Pro serve as substrates for mitochondria. iGP and, to a lesser extent, TFA, inhibitors for GPD and PRODH, respectively, also decreased glutathionylation-induced ROS production. This prompted us to investigate the impact of glutathionylation on the activity of both flavoproteins and determine if both GPD and PRODH are targeted for modification with GSH.
Figure 4A shows that exposing mitochondria to disulfiram concentrations as high as 1000 nM did not significantly alter the activity of GPD. The activity of GPD under the assay conditions was confirmed using 10 µM iGP, a selective and membrane permeable inhibitor for GPD (
Figure 4A). Next, we conducted the same assay except for PRODH. Like GPD, PRODH activity was not affected by disulfiram, even when subjected to doses as high as 1000 nM (
Figure 4B). PRODH activity was verified using TFA (
Figure 4B). To our knowledge there are few commercially available competitive inhibitors for PRODH. TFA did induce a significant decrease in PRODH activity (
Figure 4B). However, even though TFA is structurally analogous to proline, the impact of such a high concentration on PRODH activity was marginal. We followed up these findings by verifying disulfiram was inducing a dose-dependent increase in total number of glutathionylation adducts. As noted in
Figure 4C, there is a dose-dependent increase in the band intensity and number of glutathionyl protein adducts in mitochondria treated with disulfiram. Mitochondria treated with reducing agents confirmed the specificity of the protein glutathione disulfide (PSSG) anti-serum (
Figure 4C).
Figure 5.
Induction of protein S-glutathionylation does not result in the modification of (A) GPD or (B) PRODH with glutathione. Estimation of the glutathionylation status of GPD and PRODH was conducted using disulfiram and the BioGEE switch assay. BioGEE modified proteins were isolated using magnetic streptavidin-coated beads and a magnetic rack as described in the Experimental section. The supernatant and the immunocapture fractions were collected and stored at −80 °C for Western blot analysis. Samples treated with β-mercaptoethanol served as a control to verify antibody specificity. N = 3. (C) Immunoblot analysis of PSSG adducts after incubation of mitochondria in disulfiram (0, 1000, 10000 nM) and BioGEE (1 mM). Samples also included β-mercaptoethanol (+β-MeOH) to confirm the specificity of PSSG antiserum. N = 2.
The results above demonstrate disulfiram is an effective chemical glutathionylation catalyst that increases mitochondrial ROS production by RET and FET to complexes I and III. However, disulfiram did not affect the activity of GPD and PRODH, suggesting both enzymes are not targeted for modification and that the increase in ROS production is not due to the glutathionylation and inhibition of either flavoprotein. Next, we interrogated the glutathionylation state of GPD and PRODH using the BioGEE switch assay. As noted in the Experimental section, mitochondria were isolated in buffers containing NEM to block and protect unmodified thiols from spontaneous oxidation. Samples were then treated with DTT, desalted, and incubated in NEM free buffer containing 1000 nM disulfiram + 1 mM BioGEE. Proteins modified by BioGEE were isolated using magnetic streptavidin beads. Both the eluant and supernatant collected after the immunocapture were then stored at −80 degrees until analysis. Assessment of samples treated with or without β-mercaptoethanol revealed the presence of immunoreactive bands corresponding to GPD and PRODH only in the supernatant and not in the samples collected from the streptavidin immunocapture (
Figure 5A,B). We confirmed the effectiveness of disulfiram in catalyzing the addition of BioGEE to proteins by interrogating the total number of modified targets in mitochondria using PSSG antiserum. Analysis was conducted on mitochondria treated with low (1000 nM) or high (10,000 nM) disulfiram plus BioGEE (
Figure 5C). β-mercaptoethanol was included to confirm the specificity of the PSSG antiserum towards PSSG adducts. Disulfiram induced an increase in the total number of glutathionyl-protein adducts in two separate samples (
Figure 5C). Inclusion of β-mercaptoethanol confirmed these immunoreactive bands were due to disulfide bridge formation between a proteinaceous thiol and BioGEE. Together, these findings demonstrate the increase in ROS production following the chemical induction of glutathionylation is not due to the modification of GPD or PRODH with GSH.
Figure 6.
Modification of NDUFS1 in complex I accounts for the increased production of ROS in liver mitochondria oxidizing G3P and Pro. (A) Diamide and disulfiram treatment results in the glutathionylation of NDUFS1 subunit of complex I. Mitochondria were exposed to (1) control conditions (no glutathionylation catalyst), (2) 1000 µM diamide, (3) 5000 µM diamide, (4) 5000 nM disulfiram, and (5) 10,000 nM disulfiram and then complex I was immunoprecipitated according to the manufacturer’s instructions. (B) Mitochondria treated with β-mercaptoethanol served as a control to verify PSSG anti-serum specificity. NDUFS1 was also detected to demonstrate it was successfully immunocaptured. (C) Reversal of glutathionylation diminishes ROS production in mitochondria oxidizing G3P or Pro. Mitochondria were treated with 1000 nM disulfiram + 1 mM GSH, washed several times, and incubated with DTT. Rotenone was also added to some reactions as a control. N = 4, mean ± SEM, 1-way ANOVA with a post-hoc Fisher’s LSD test. * p ≤ 0.05. (D) DTT treatment restores the activity of complex I after treatment with disulfiram. Mitochondria were incubated in disulfiram + GSH as described in C. and then DTT was added. N = 4, mean ± SEM, 1-way ANOVA with a post-hoc Fisher’s LSD test. * p ≤ 0.05, ** p ≤ 0.01.
![Antioxidants 11 02043 g006]()
3.3. Blocking Electron Flow through Glutathionylation of Complex I Subunit NDUFS1 Increases RET-Driven ROS Production during G3P and Pro Metabolism
Complex I contains 46 subunits in total and several are targeted for glutathionylation [
5]. However, to date, only the glutathionylation of NDUFS1 and NDUFV1 has been found to affect the activity of complex I [
11]. Most work has focused on NDUFS1 due to the relationship between its modification with glutathione and the impact it has on complex I activity and ROS production in several pathologies [
23,
32]. The findings in this report, so far, indicate disulfiram treatment augments RET-driven O
2●−/H
2O
2 production by complex I. Blockage of electron flow to NAD
+ during RET due to NDUFS1 glutathionylation may result in the over-reduction of FMN or the UQ site (both are known sites for production in complex I) resulting in a higher rate of ROS production. Therefore, we conducted an immunocapture assay to examine the glutathionylation state of complex I subunit, NDUFS1. Samples were treated with either disulfiram or diamide, a second catalyst for the chemical induction of glutathionylation. Complex I was immunocaptured and samples were probed with NDUFS1 and protein glutathione mixed disulfide (PSSG; glutathionylation) anti-serum. Samples were also treated with or without β-mercaptoethanol (βMeOH) to confirm the specificity of the PSSG antiserum towards glutathionylated proteins. Immunoblot analyses revealed that we successfully isolated complex I, which was confirmed using anti-NDUSF1 (
Figure 6A,B). Slight shifts in mobility were observed, which we attributed to an artifact associated with the use of this immunocapture kit [
12]. Interrogating blots with PSSG antiserum also revealed the presence of several immunoreactive bands. The high intensity bands were found to correspond with the mobility of NDUFS1 and were only present in mitochondrial samples treated with glutathionylation catalysts (
Figure 6A). Inclusion of β-mercaptoethanol resulted in the reduction of the protein-glutathionyl disulfide bridge, abolishing most immunoreactive bands corresponding to PSSG, confirming NDUFS1 is glutathionylated by disulfiram and diamde (
Figure 6B).
We followed up these findings by performing assays to evaluate the impact of glutathionylation on ROS production by complex I in liver mitochondria fueled with G3P or Pro. To do so, mitochondria were treated with disulfiram to induce glutathionylation and then treated with dithiothreitol (DTT) to reverse the modification. Incubation of mitochondria in rotenone served as a control. Disulfiram increased ROS production in liver mitochondria oxidizing either substrate (
Figure 6C). Incubation of samples in DTT induced a significant decrease in ROS production, indicating blockage of electron flow by reverse transfer from the UQ pool by glutathionylation accounts for the increase in ROS production (
Figure 6C). Rotenone alone did decrease the rate of production back to control levels (
Figure 6C). Surprisingly, inclusion of rotenone in DTT-treated samples did not lower ROS further (
Figure 6C). It was previously shown that DTT can autocatalyze the conversion of Amplex UltraRed to fluorescent resorufin [
33]. We avoided desalting samples, so mitochondria remained intact for our analyses. To do this, we opted to wash our reactions several times prior to conducting assays. However, it is likely small amounts of contaminating DTT remained even after the washes. Therefore, despite several washes prior to conducting the O
2●−/H
2O
2 measurements, contaminating DTT may have interfered with the assay by autocatalyzing resorufin production. However, DTT has also been shown to reactivate complex I and recover mitochondrial ATP production following its inhibition by glutathionylation [
13,
23]. Therefore, we also examined complex I activity in response to disulfiram-induced glutathionylation and its reversal with DTT. Induction of the glutathionylation inhibited the activity of complex I, which could be partially reversed by a DTT incubation (
Figure 6D).
Complex I of the respiratory chain has multiple glutathionylation sites, including NDUFS1, NDUFV1, and NDUFA11 [
22]. Proteomic analyses of exercised rat muscle tissue also identified several other complex I subunits that can be modified by glutathionylation [
5]. To date, only the glutathionylation of NDUFS1 and NDUFV1 have been found to have a functional effect on complex I and NADH-driven respiration [
11,
13]. Furthermore, most work has focused on NDUFS1because it was the first glutathionylation site identified in mitochondria and a target for reversible glutathionylation in response to GSH pool oxidation state. GRX2 drives glutathionylation of complex I in response to GSH pool oxidation which inhibits its activity and deactivates NADH-induced O
2●−/H
2O
2 production [
11,
12]. Restoration of the redox state of the GSH pool by NADPH drives the GRX2-mediated deglutathionylation of complex I, restoring its activity and NADH-dependent respiration. The temporary S-glutathionylation of NDUFS1 has been hypothesized in several articles to serve as a mechanism to prevent oxidative distress and damage by protecting vulnerable thiols from over-oxidation while simultaneously limiting ROS production for antioxidant defense system recovery [
12,
13]. For example, modification of Cys-531 and Cys-704 on NDUFS1 protects the subunit from irreversible oxidation when H
2O
2 levels are high or during nitrosative stress [
13]. Removal of GSH from NDUFS1 restores the activity of the enzyme. Additionally, the temporary deactivation of complex I limits ROS production by the respiratory complex and electron transport chain during NADH oxidation, preventing antioxidant defense depletion and oxidative damage [
12]. Similar observations have been made with α-ketoglutarate dehydrogenase and pyruvate dehydrogenase [
26,
34]. Protein S-glutathionylation limits ROS production by α-keto acid dehydrogenases, which also has the added benefit of protecting the thiols in the lipoamide of the E2 subunit from over-oxidation [
26,
34,
35]. Thus, the reversible modification of mitochondrial ROS generators like the α-keto acid dehydrogenases and complex I plays an integral role in preventing oxidative distress. Moreover, this mechanism is likely required for controlling H
2O
2 availability in mitochondria-to-cell signaling [
10]. Overall, the GRX2-mediated reversible modification of complex I subunit, NDUFS1, and other ROS sources is integral for maintaining mitochondrial and cellular redox balance for cell signaling and the prevention of oxidative distress.
In 2003, Taylor et al. demonstrated glutathionylation increased O
2●−/H
2O
2 production by complex I in bovine heart mitochondria subjected to oxidative distress [
21]. This occurred through the formation of PSSG adducts on 51 and 75 KDa subunits, both of which were identified later as NDUFV1 and NDUFS1, respectively [
21]. NDUFS1 was also identified as a major site for the spontaneous and prolonged modification of complex I by glutathionylation in several pathologies including the development of cataracts, sarcopenia, and heart disease [
23,
32,
36]. This was related to the depletion of GSH pools, over production of mitochondrial ROS, cell damage, and oxidative distress, resulting in dysfunctional oxidative phosphorylation and nutrient metabolism. Recent work has shown that mitochondrial respiration can be restored by reversing complex I glutathionylation and preserving the reductive potential of the GSH pool, which can have a protective effect against metabolic and cardiovascular diseases [
36,
37,
38]. However, the source of ROS following prolonged complex I deactivation by glutathionylation due to GSH pool oxidation has remained elusive. Here, we have demonstrated for the first time that glutathoinylation-mediated blockage of electron flow through complex I during RET can increase ROS production. This is due, in part, to the modification of NDUFS1, a critical subunit required for forward and reverse electron transfer reactions in complex I. These findings are highlighted by the reversibility of the modification of NDUFS1, which was induced by the reducing agents. Furthermore, removal of the glutathionyl moiety with DTT restored the activity of complex I and partially protected from increased RET-induced ROS production. Collectively, these findings provide evidence that glutathionylation of NDUFS1 can result in an increase in ROS production when nutrients that by-pass complex I and donate electrons directly to the UQ pool are being oxidized by mitochondria.
3.4. Disulfiram Treatment Inhibits G3P and Pro Fueled ATP Production
Myxothiazol and S3QEL also lowered disulfiram-induced ROS production during G3P and Pro. Reduction of the UQ pool by GPD and PRODH can also stimulate ROS production by RET to complex II [
27,
39]. However, atpenin A5, which inhibits ROS production by complex II during RET by blocking the UQ binding site, was also included in our experiments. Taken together, the results in
Figure 3 indicate complex III is a potential ROS source following disulfiram-induced glutathionylation, which may be related to the blockage of the chain upstream from complex III. To determine if the ETC was blocked, we assessed the different states of respiration using liver mitochondria oxidizing either G3P or Pro. For this, we used a Seahorse XFe24 method, which relies on attaching mitochondria to the surface of an XFe24 tissue culture plate. This method has been applied to study the impact of reversible S-glutathionylation and the loss of GRX2 on mitochondrial bioenergetics, specifically the capacity to oxidize complex I-linked substrates such as pyruvate or glutamate [
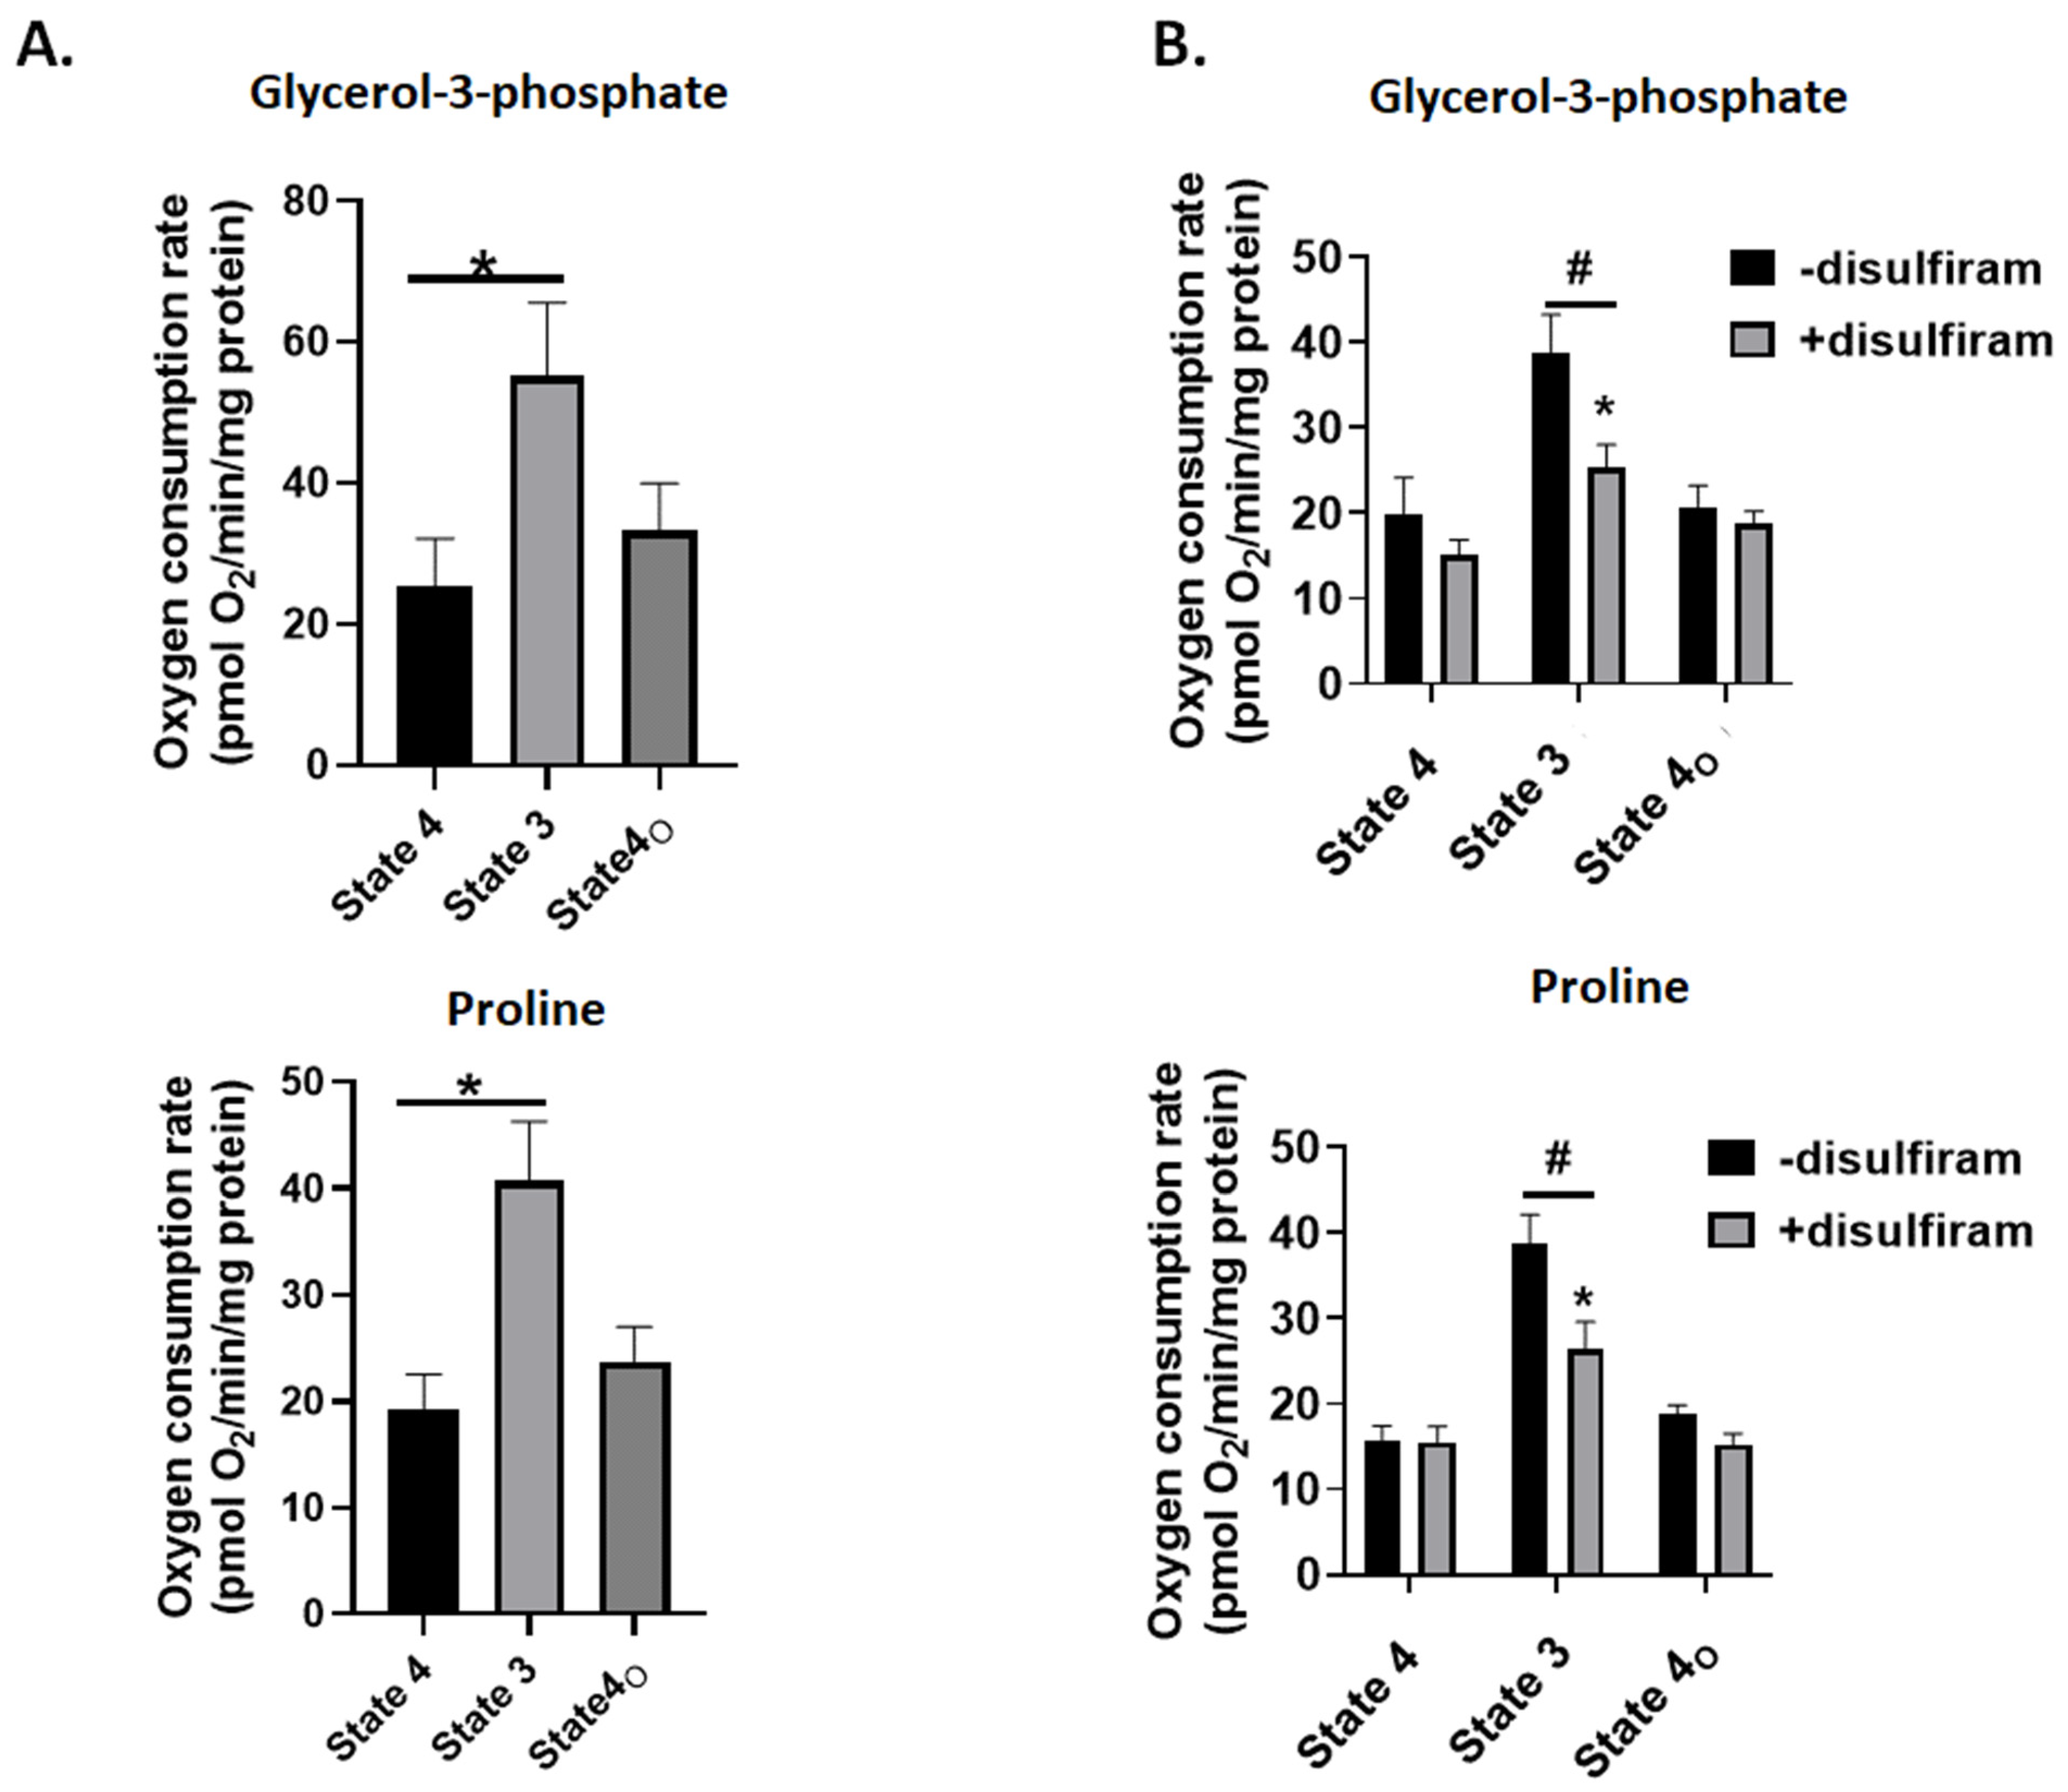
23]. However, to our knowledge, this method has not been used to study the oxidation of UQ linked substrates such as G3P and Pro. As a proof of concept, we first assessed the different states of respiration in liver mitochondria oxidizing G3P or Pro.
Figure 7A shows injection of ADP into individual wells containing mitochondria increased the rate of O
2 consumption (state 3). Additionally, phosphorylating respiration was successfully blocked by injecting oligomycin into each well to induce proton leak-dependent respiration (state 4
O) (
Figure 7A). Taken together, G3P and Pro-fueled O
2 metabolism can be measured in the Seahorse XFe24.
Figure 7.
Treatment of mitochondria with disulfiram inhibits state 3 respiration, indicating it may inhibit complex III. (A) Mitochondria energized with glycerol-3-phosphate or proline exhibit measurable rates of state 4 (substrate alone), state 3 (injection of ADP), and state 4O (treatment with complex V inhibitor, oligomycin). State 4 and state 4O represent measures of non-phosphorylating or proton leak-dependent respiration. n = 4, mean ± SEM, 1-way ANOVA with a post hoc Fisher’s LSD test. * p ≤ 0.05. (B) Mitochondria were seeded in Seahorse TC plates and treated with 1000 nM disulfiram and 1 mM GSH. Assays were then conducted as described in (A) and the Experimental section. n = 4, mean ± SEM, 2-way ANOVA with a post hoc Fisher’s LSD test. * p ≤ 0.05 when conducting statistical comparisons within a group, # p ≤ 0.05 when conducting comparisons between control and disulfiram-treated groups.
Next, we tested if glutathionylation impeded mitochondrial O
2 metabolism during G3P and Pro oxidation. Treatment of liver mitochondria oxidizing either substrate with 1000 nM disulfiram did not significantly change state 4 (substrate alone) or state 4
O respiration (treatment with oligomycin) (
Figure 7B). Measurement of state 3 respiration revealed that disulfiram treatment induced a significant decrease in the rate of O
2 consumption in mitochondria oxidizing either G3P or Pro (
Figure 7B). Complex III is the major oxidant source in mammalian cells and supplies H
2O
2 to activate a myriad of signaling pathways. Complex III has been identified as a glutathionylation target using redoxomics and clickable glutathione analogs in cardiomyocytes [
40]. The findings presented in
Figure 3 and
Figure 7B, as well as in [
25], suggest that induction of glutathionylation also increases ROS production by complex III when UQ substrates serve as fuel. However, it should be noted we did not generate any evidence this increase is due to complex III glutathionylation. Indeed, the increase could be due to the blockage of electron flow further downstream from complex III. For example, complex V glutathionylation results in lowered respiration and oxidative distress [
41]. This could induce an increase in H
2O
2 generation since complex V inhibitors like oligomycinaugment mitochondrial oxidant production due to blockage of the proton circuit. Complex IV is also a potential glutathionylation site, which would also increase ROS genesis by mitigating electron flow to the O
2 binding site [
42]. In aggregate, the induction of glutathionylation does increase ROS production by complex III following oxidation of UQ-linked substrates. Whether this is due to complex III modification or glutathionylation of complexes upstream from the UQ-cytochrome C oxidoreductase needs to be elucidated.


