
Long-Term Effects of Biliverdin Reductase a Deficiency in Ugt1−/− Mice: Impact on Redox Status and Metabolism

 , , and
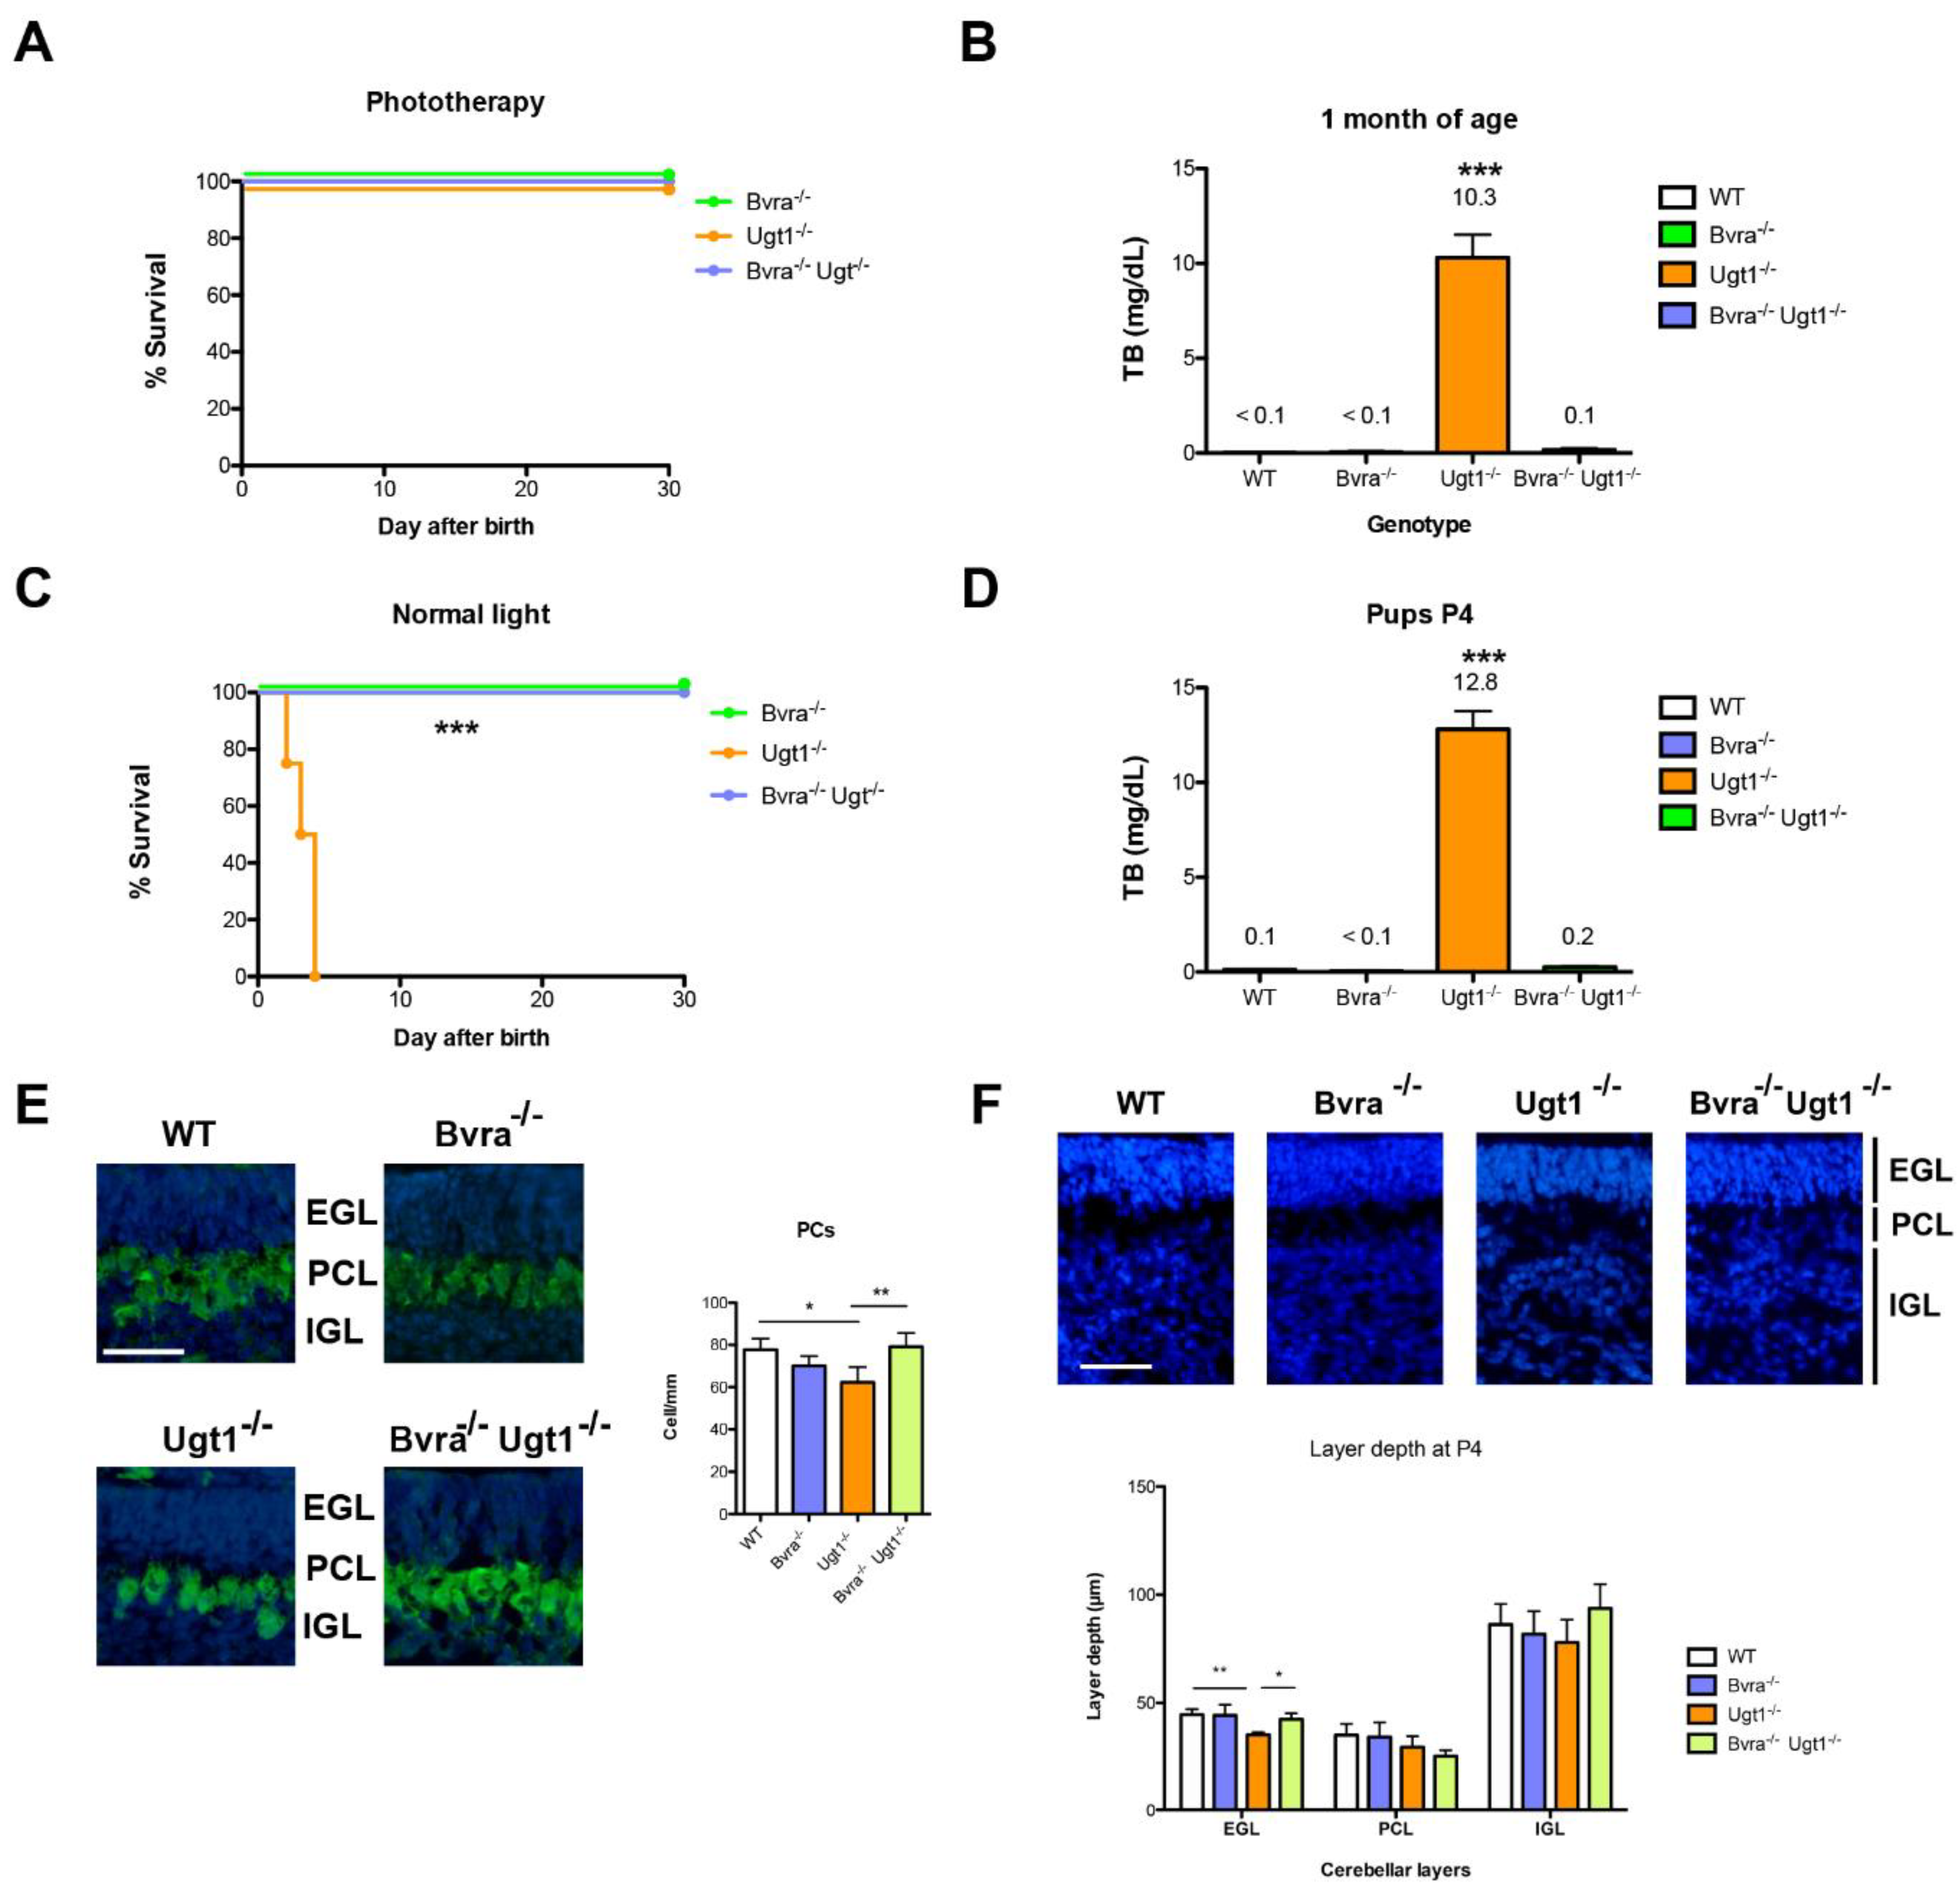
Abstract
:1. Introduction
2. Materials and Methods
2.1. Animals
2.2. Phototherapy Treatment
2.3. Preparation of mRNA Extraction and qPCR Analysis
2.4. Blood Test Analysis
2.5. Preparation of Protein Extracts and Western Blot Analysis
2.6. Peroxiredoxin 2 (Prdx2) Oxidized Forms in Freshly Isolated Erythrocytes
2.7. Triglyceride Quantification
2.8. Iron Quantification
2.9. Histology
2.10. Statistics
2.11. Study Approval/Ethic Statement
3. Results
3.1. Deleting Bvra Prevents Lethal UCB Accumulation in Neonatal Ugt1−/− Mice
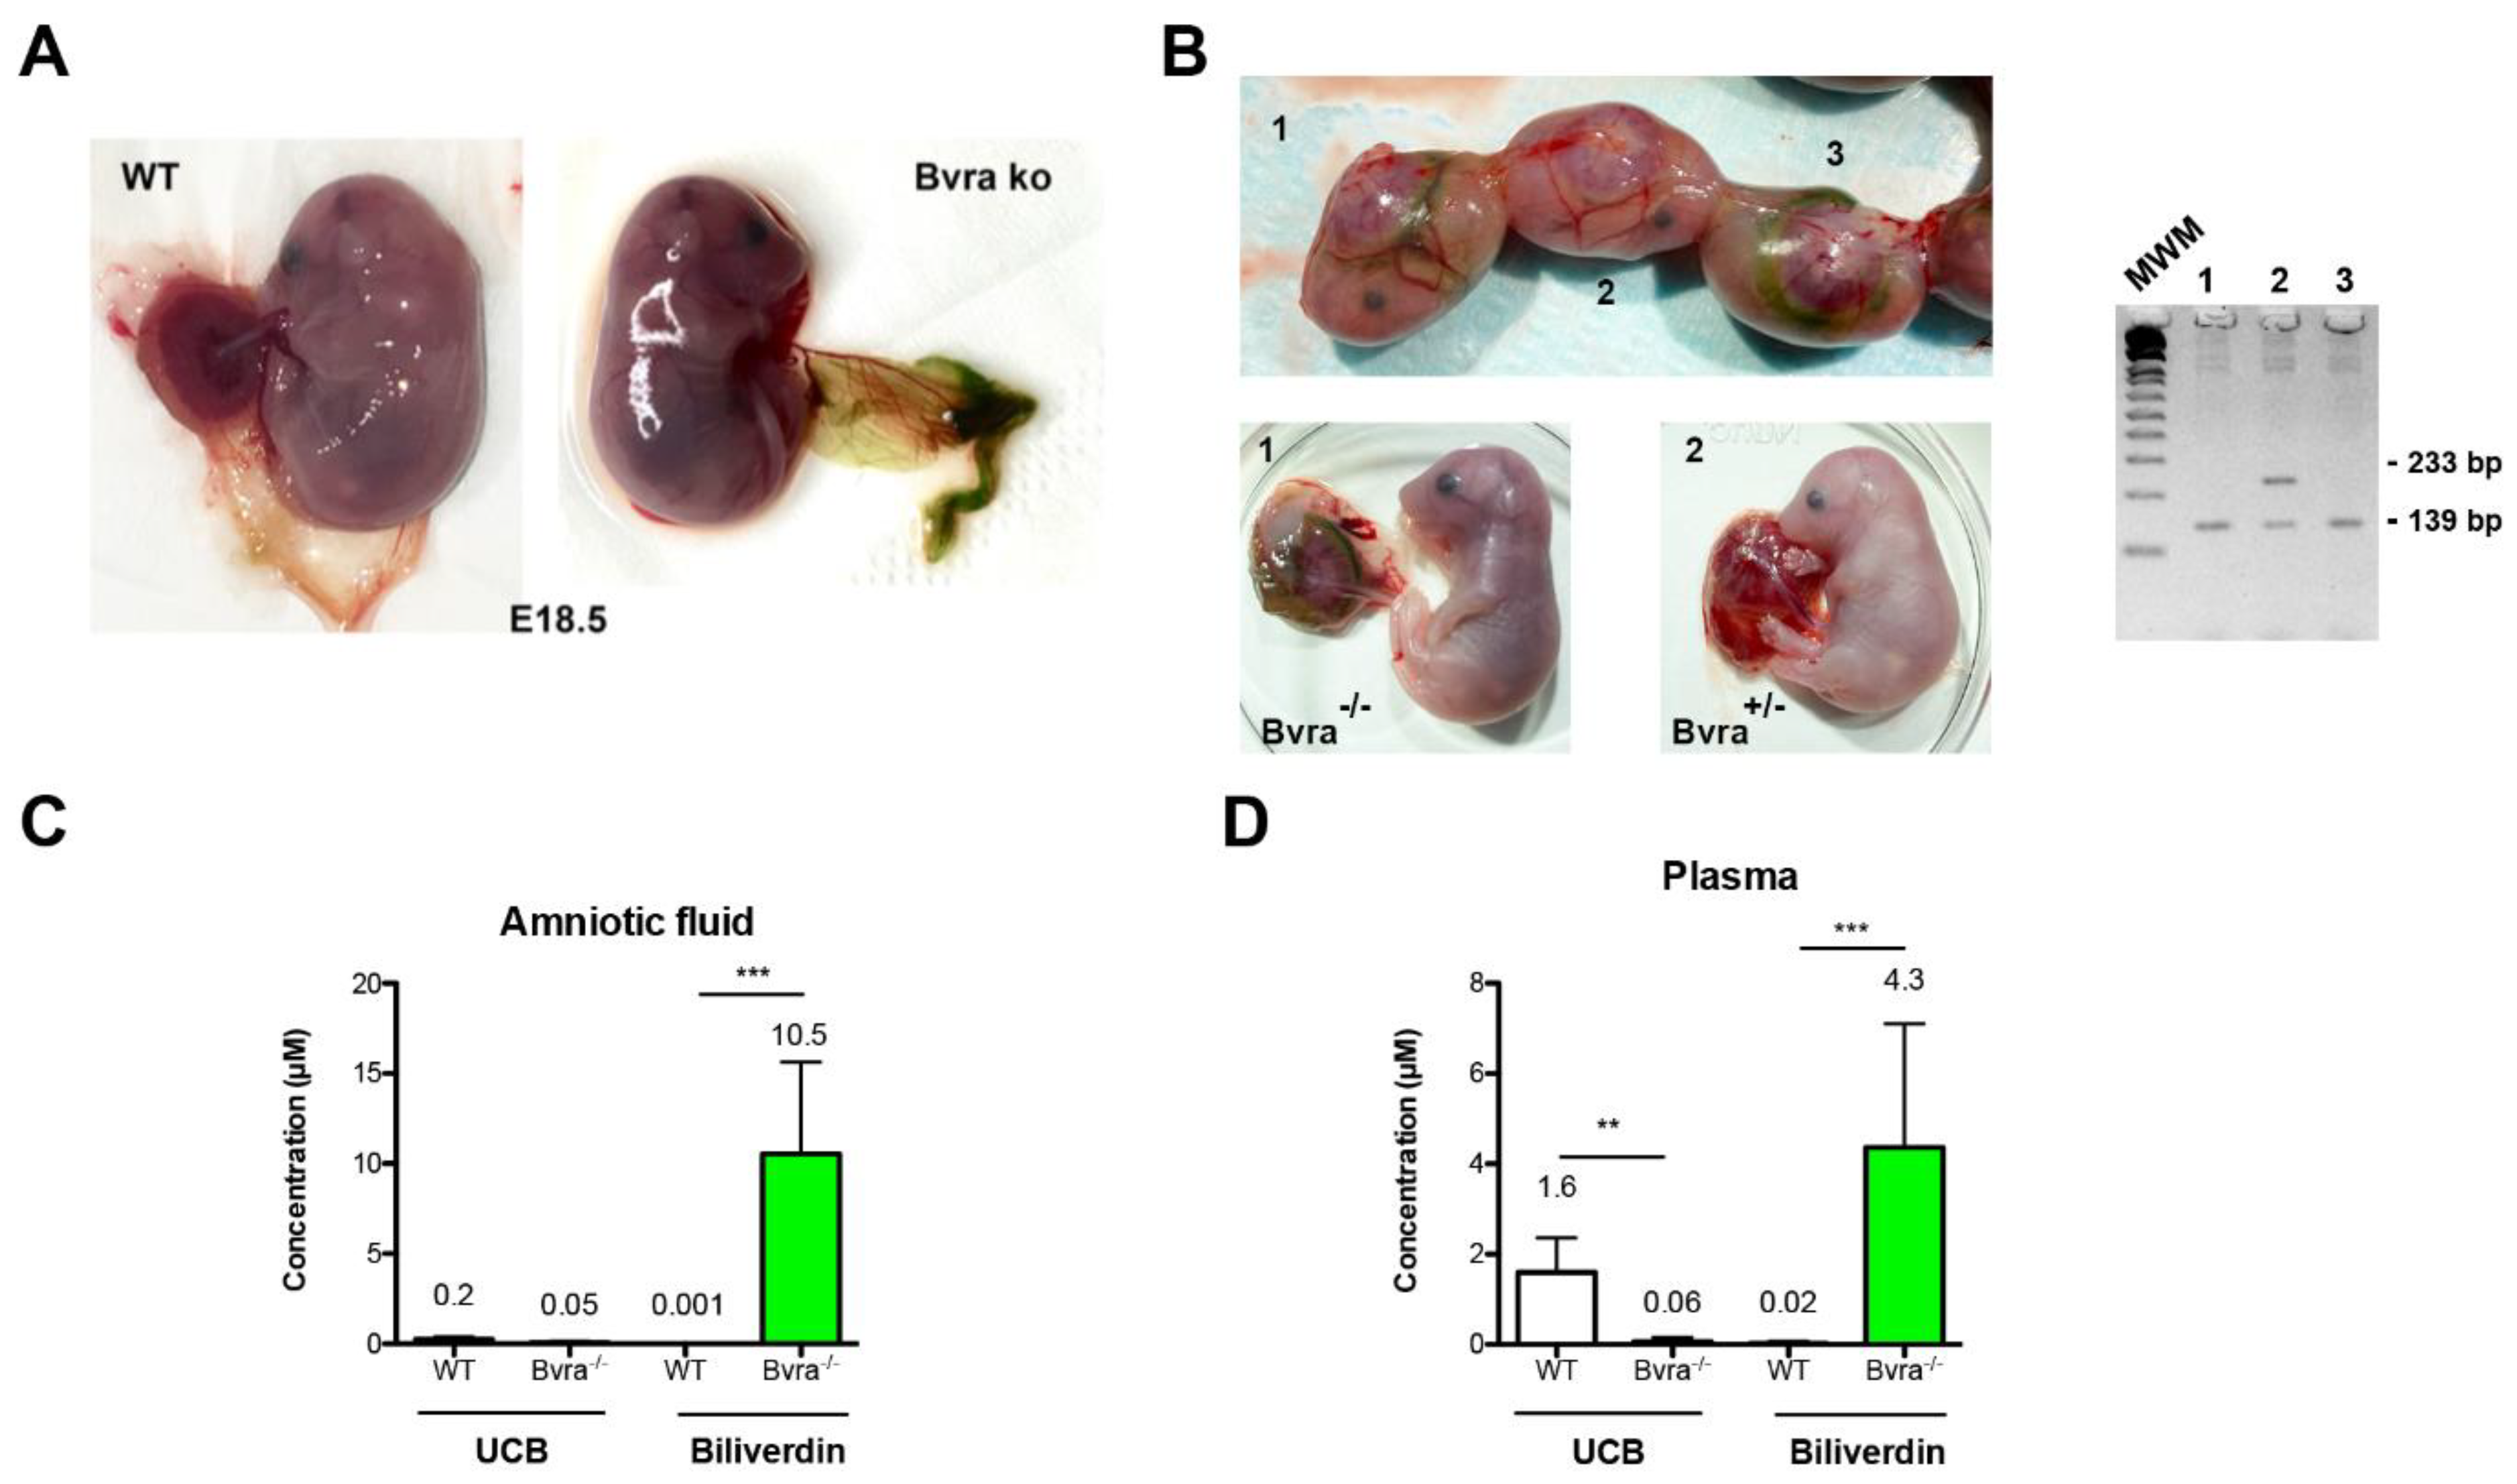
3.2. Biliverdin Accumulation in Bvra Deficient Embryos Does Not Affect Viability
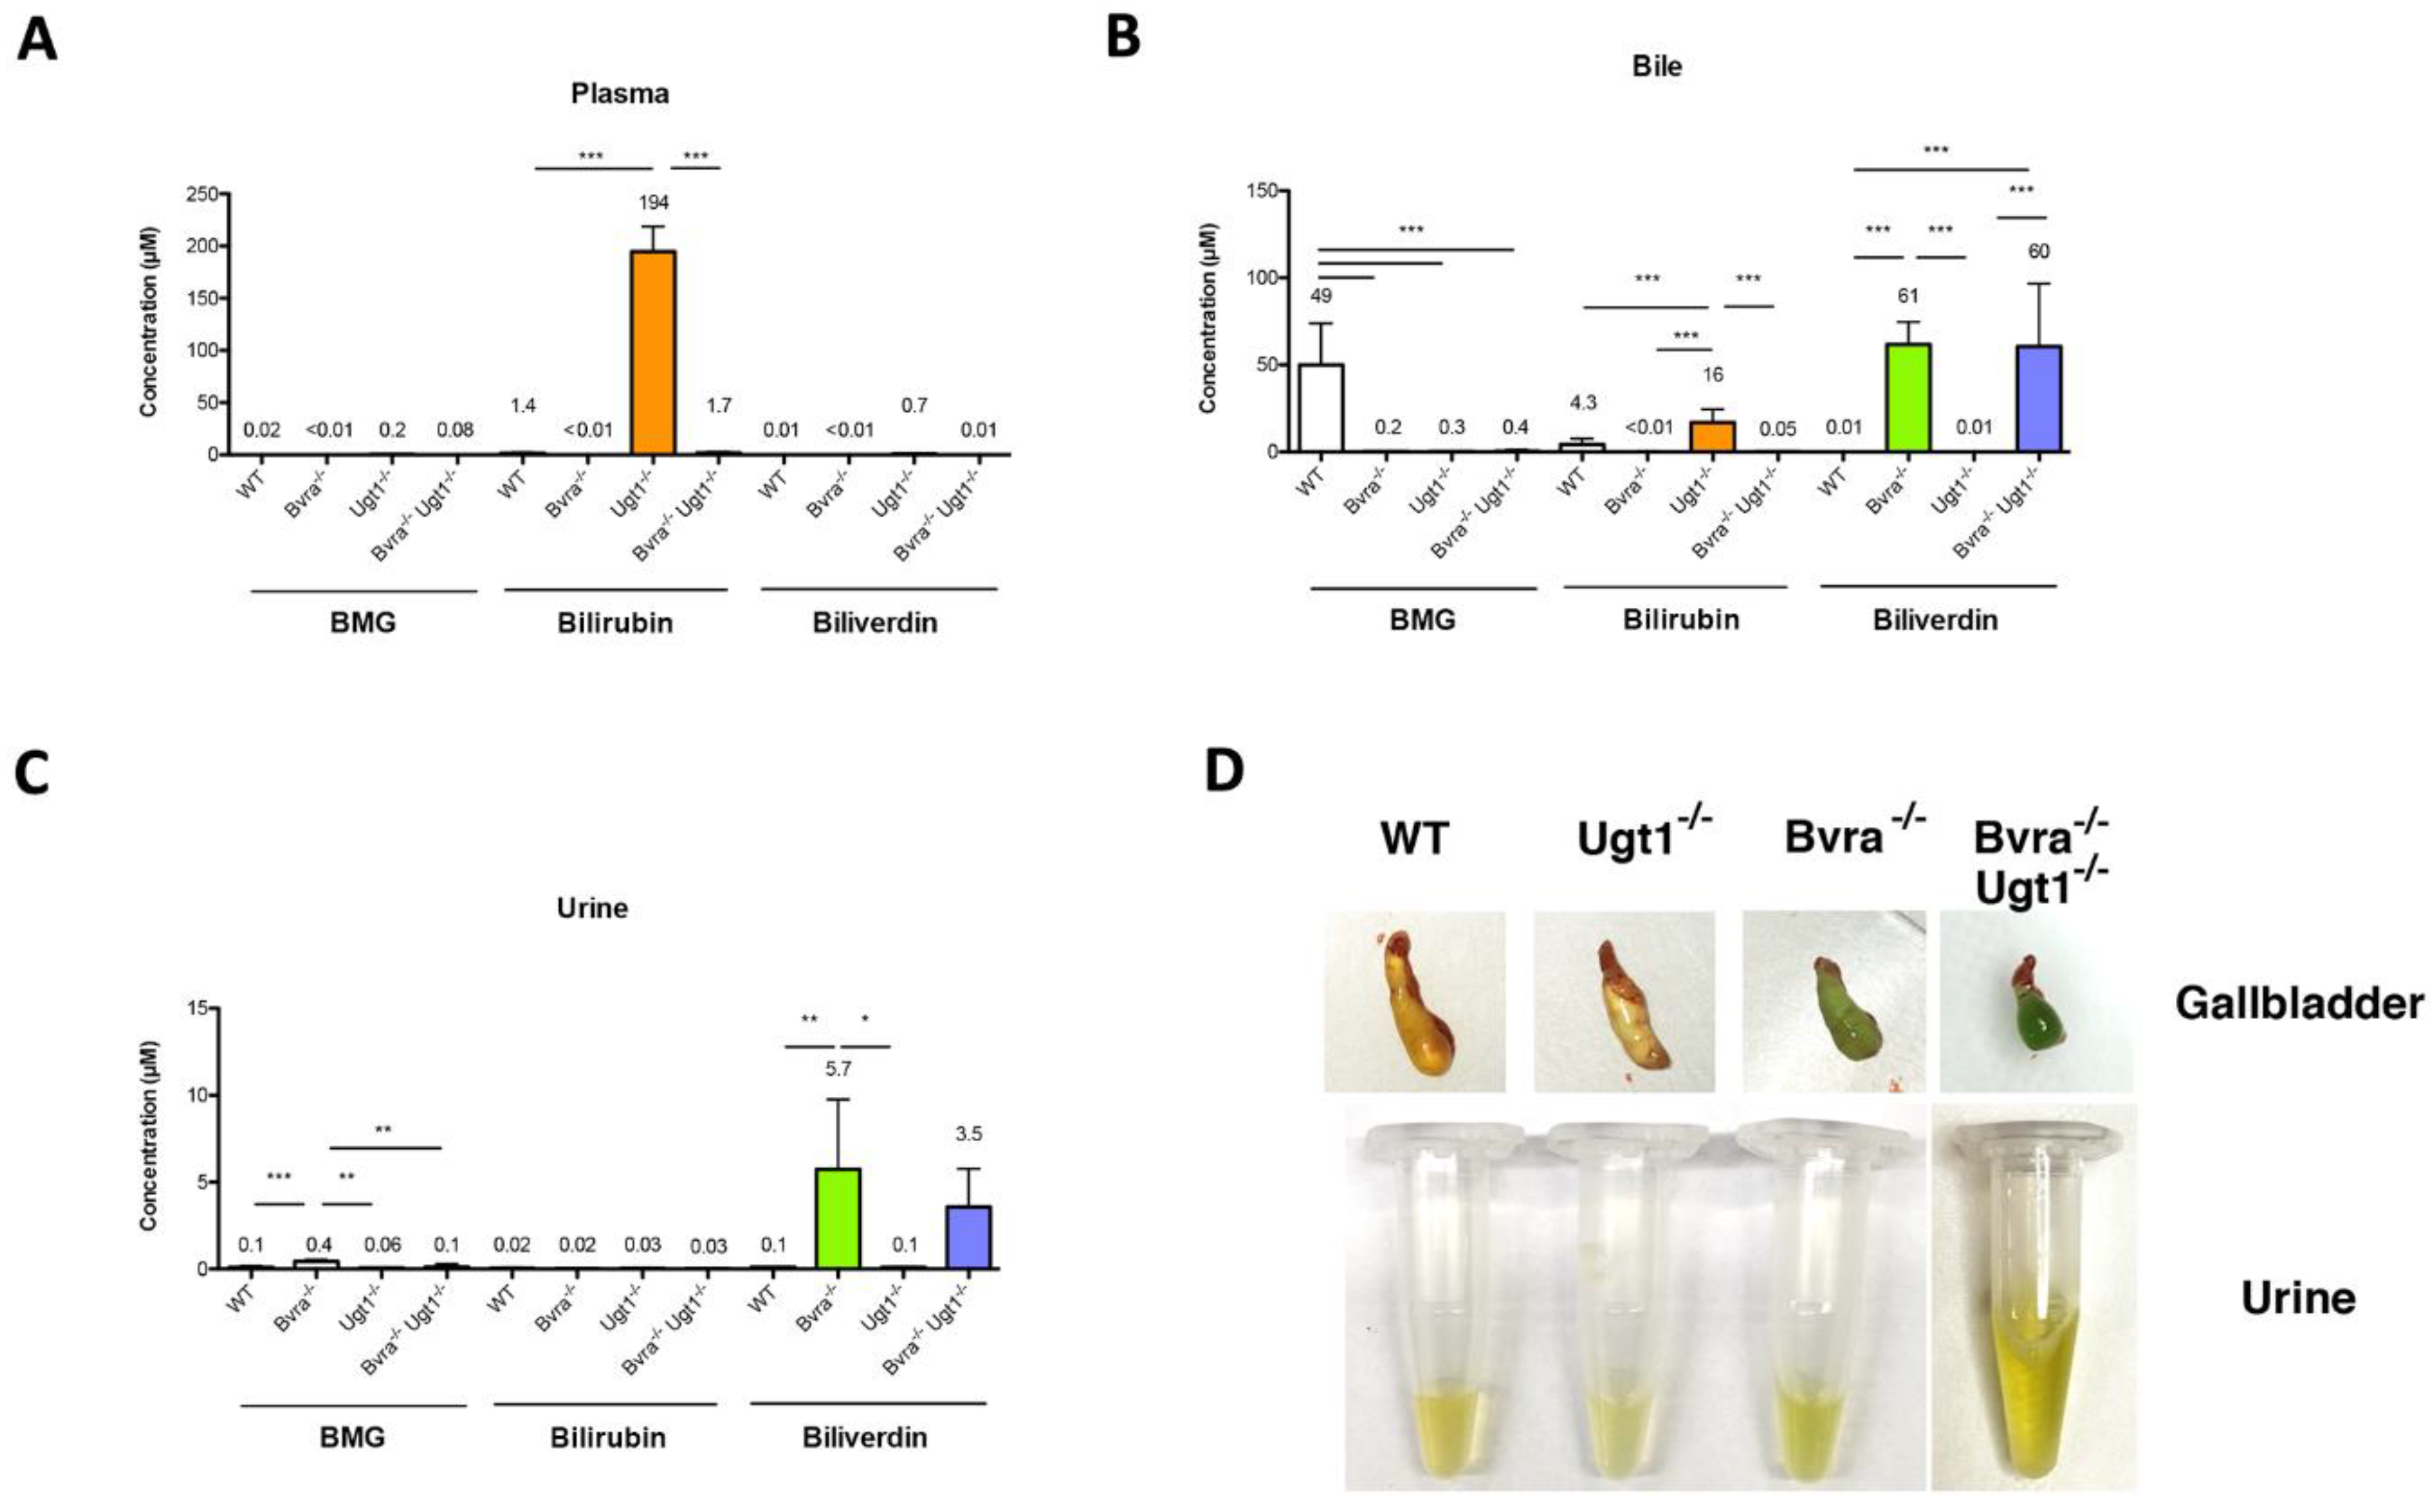
3.3. Biliverdin and Bilirubin Accumulation in Bvra Deficient Mice during Aging
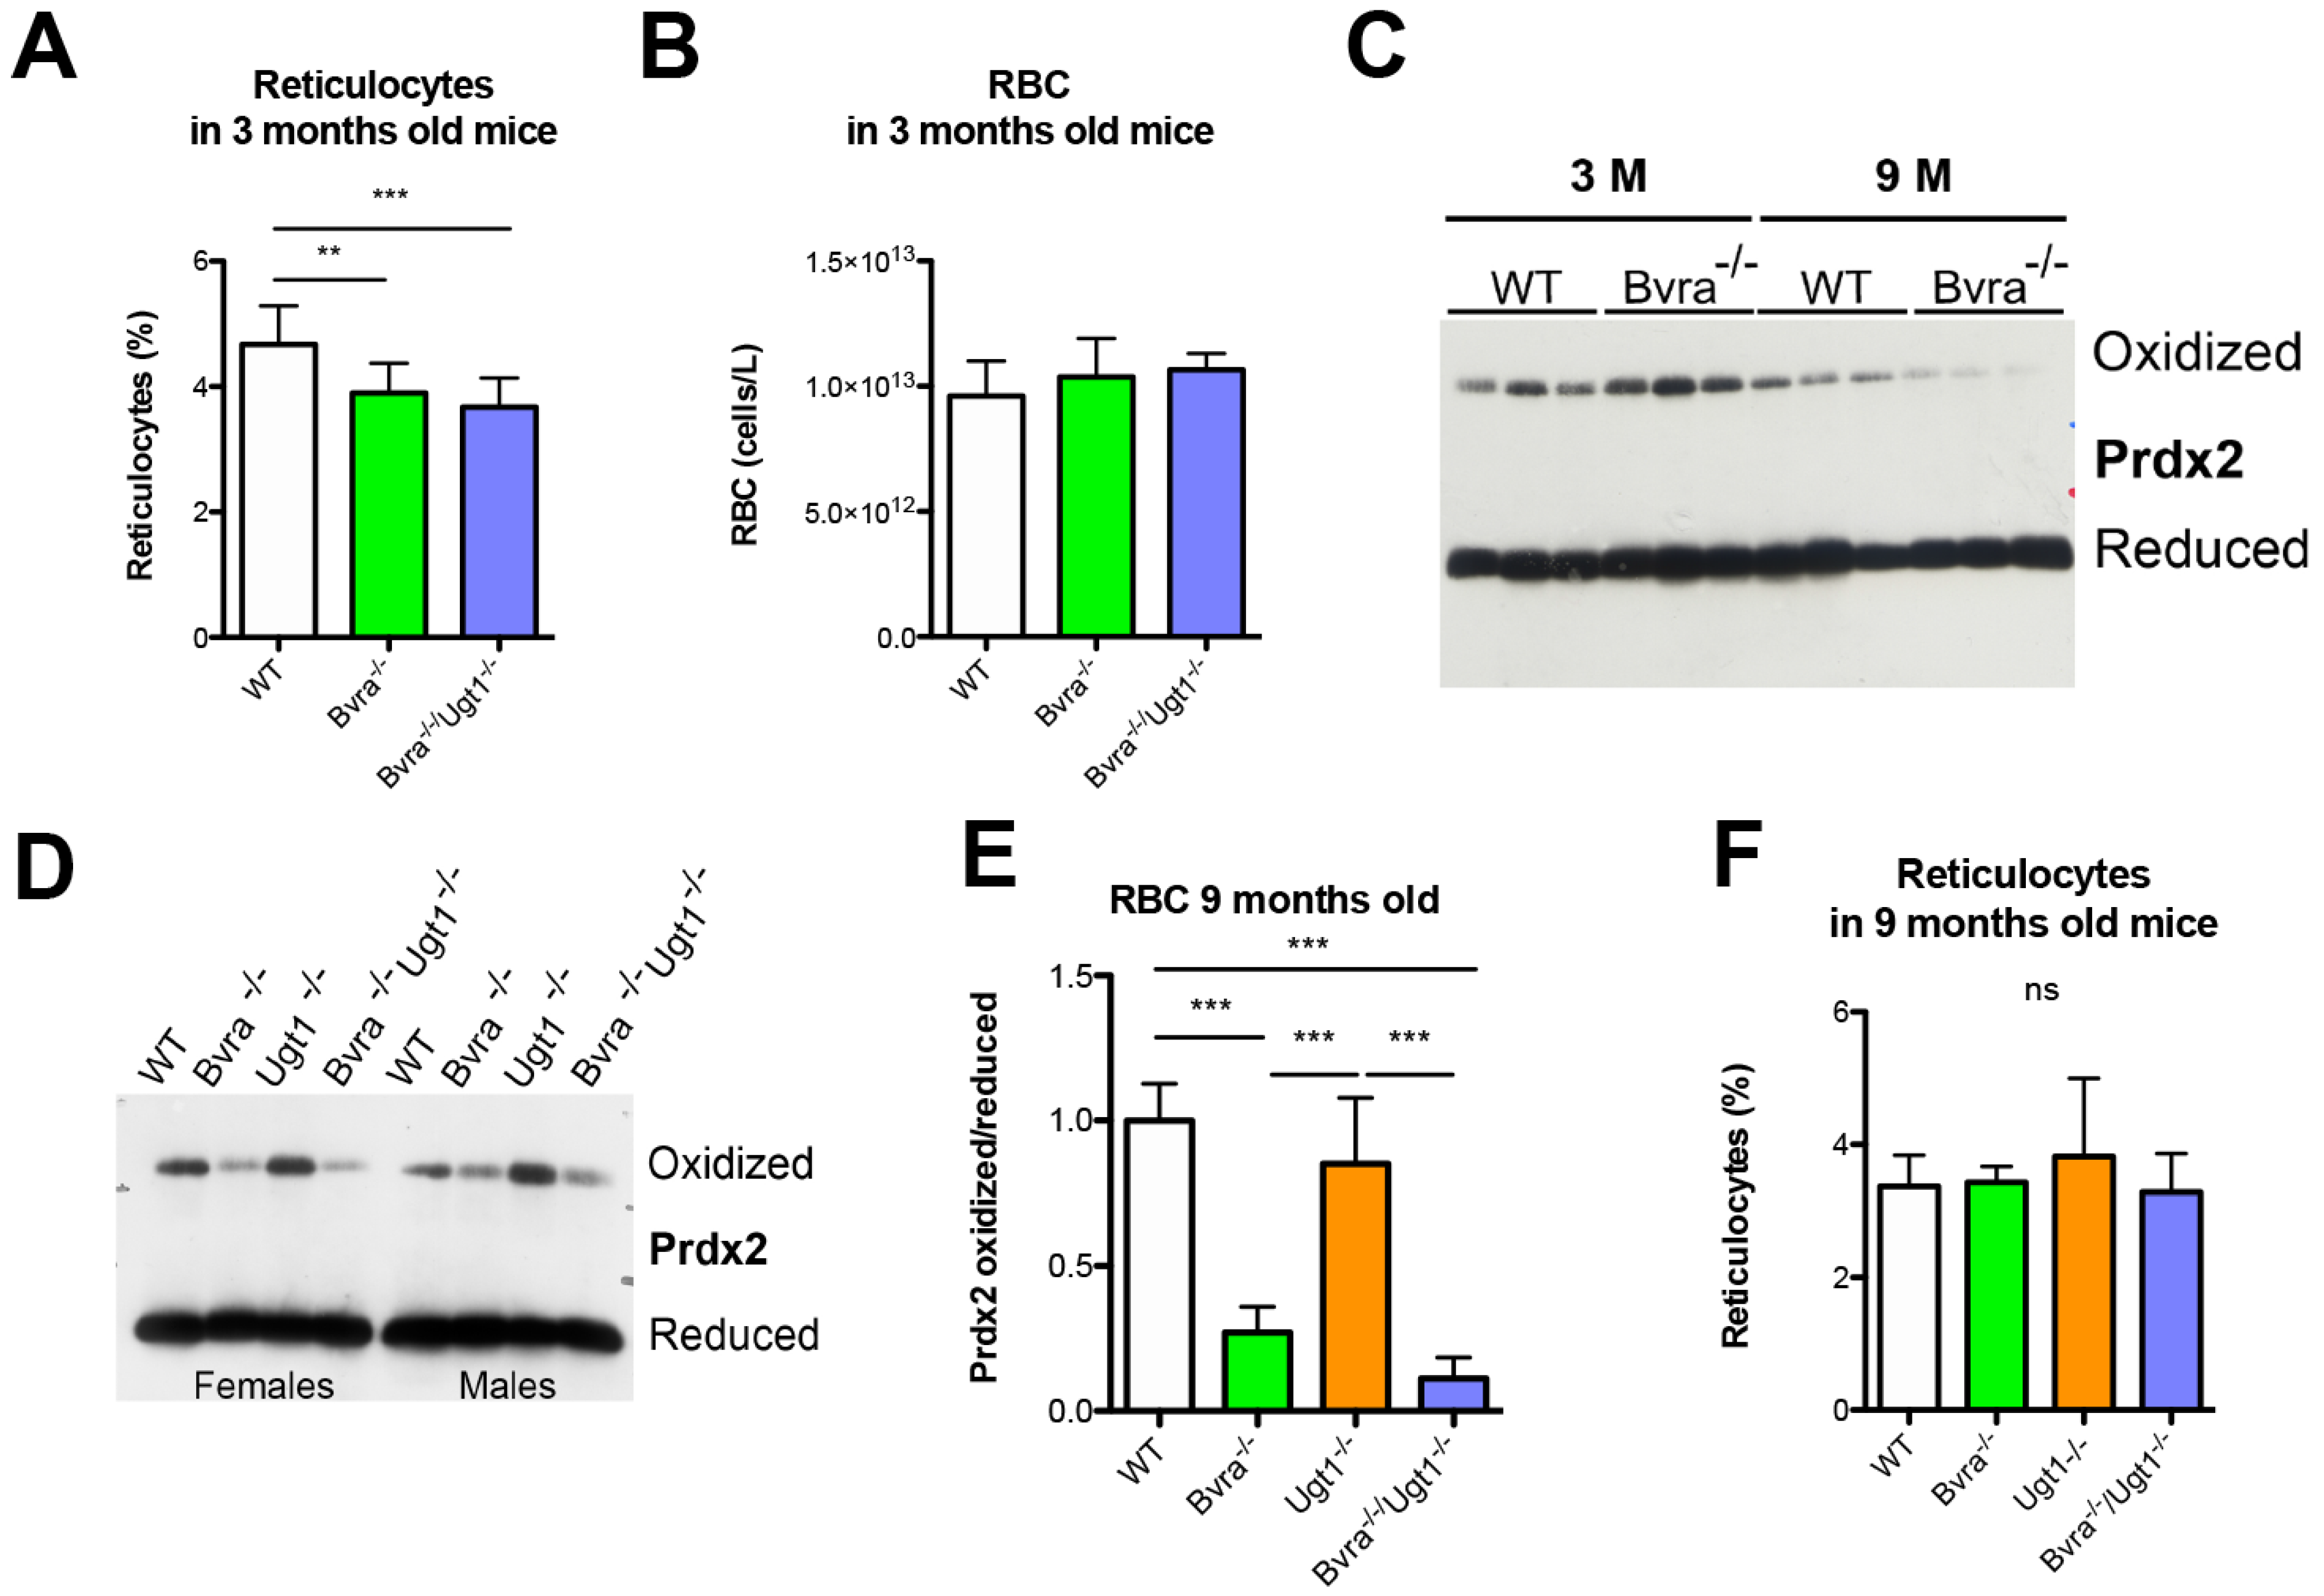
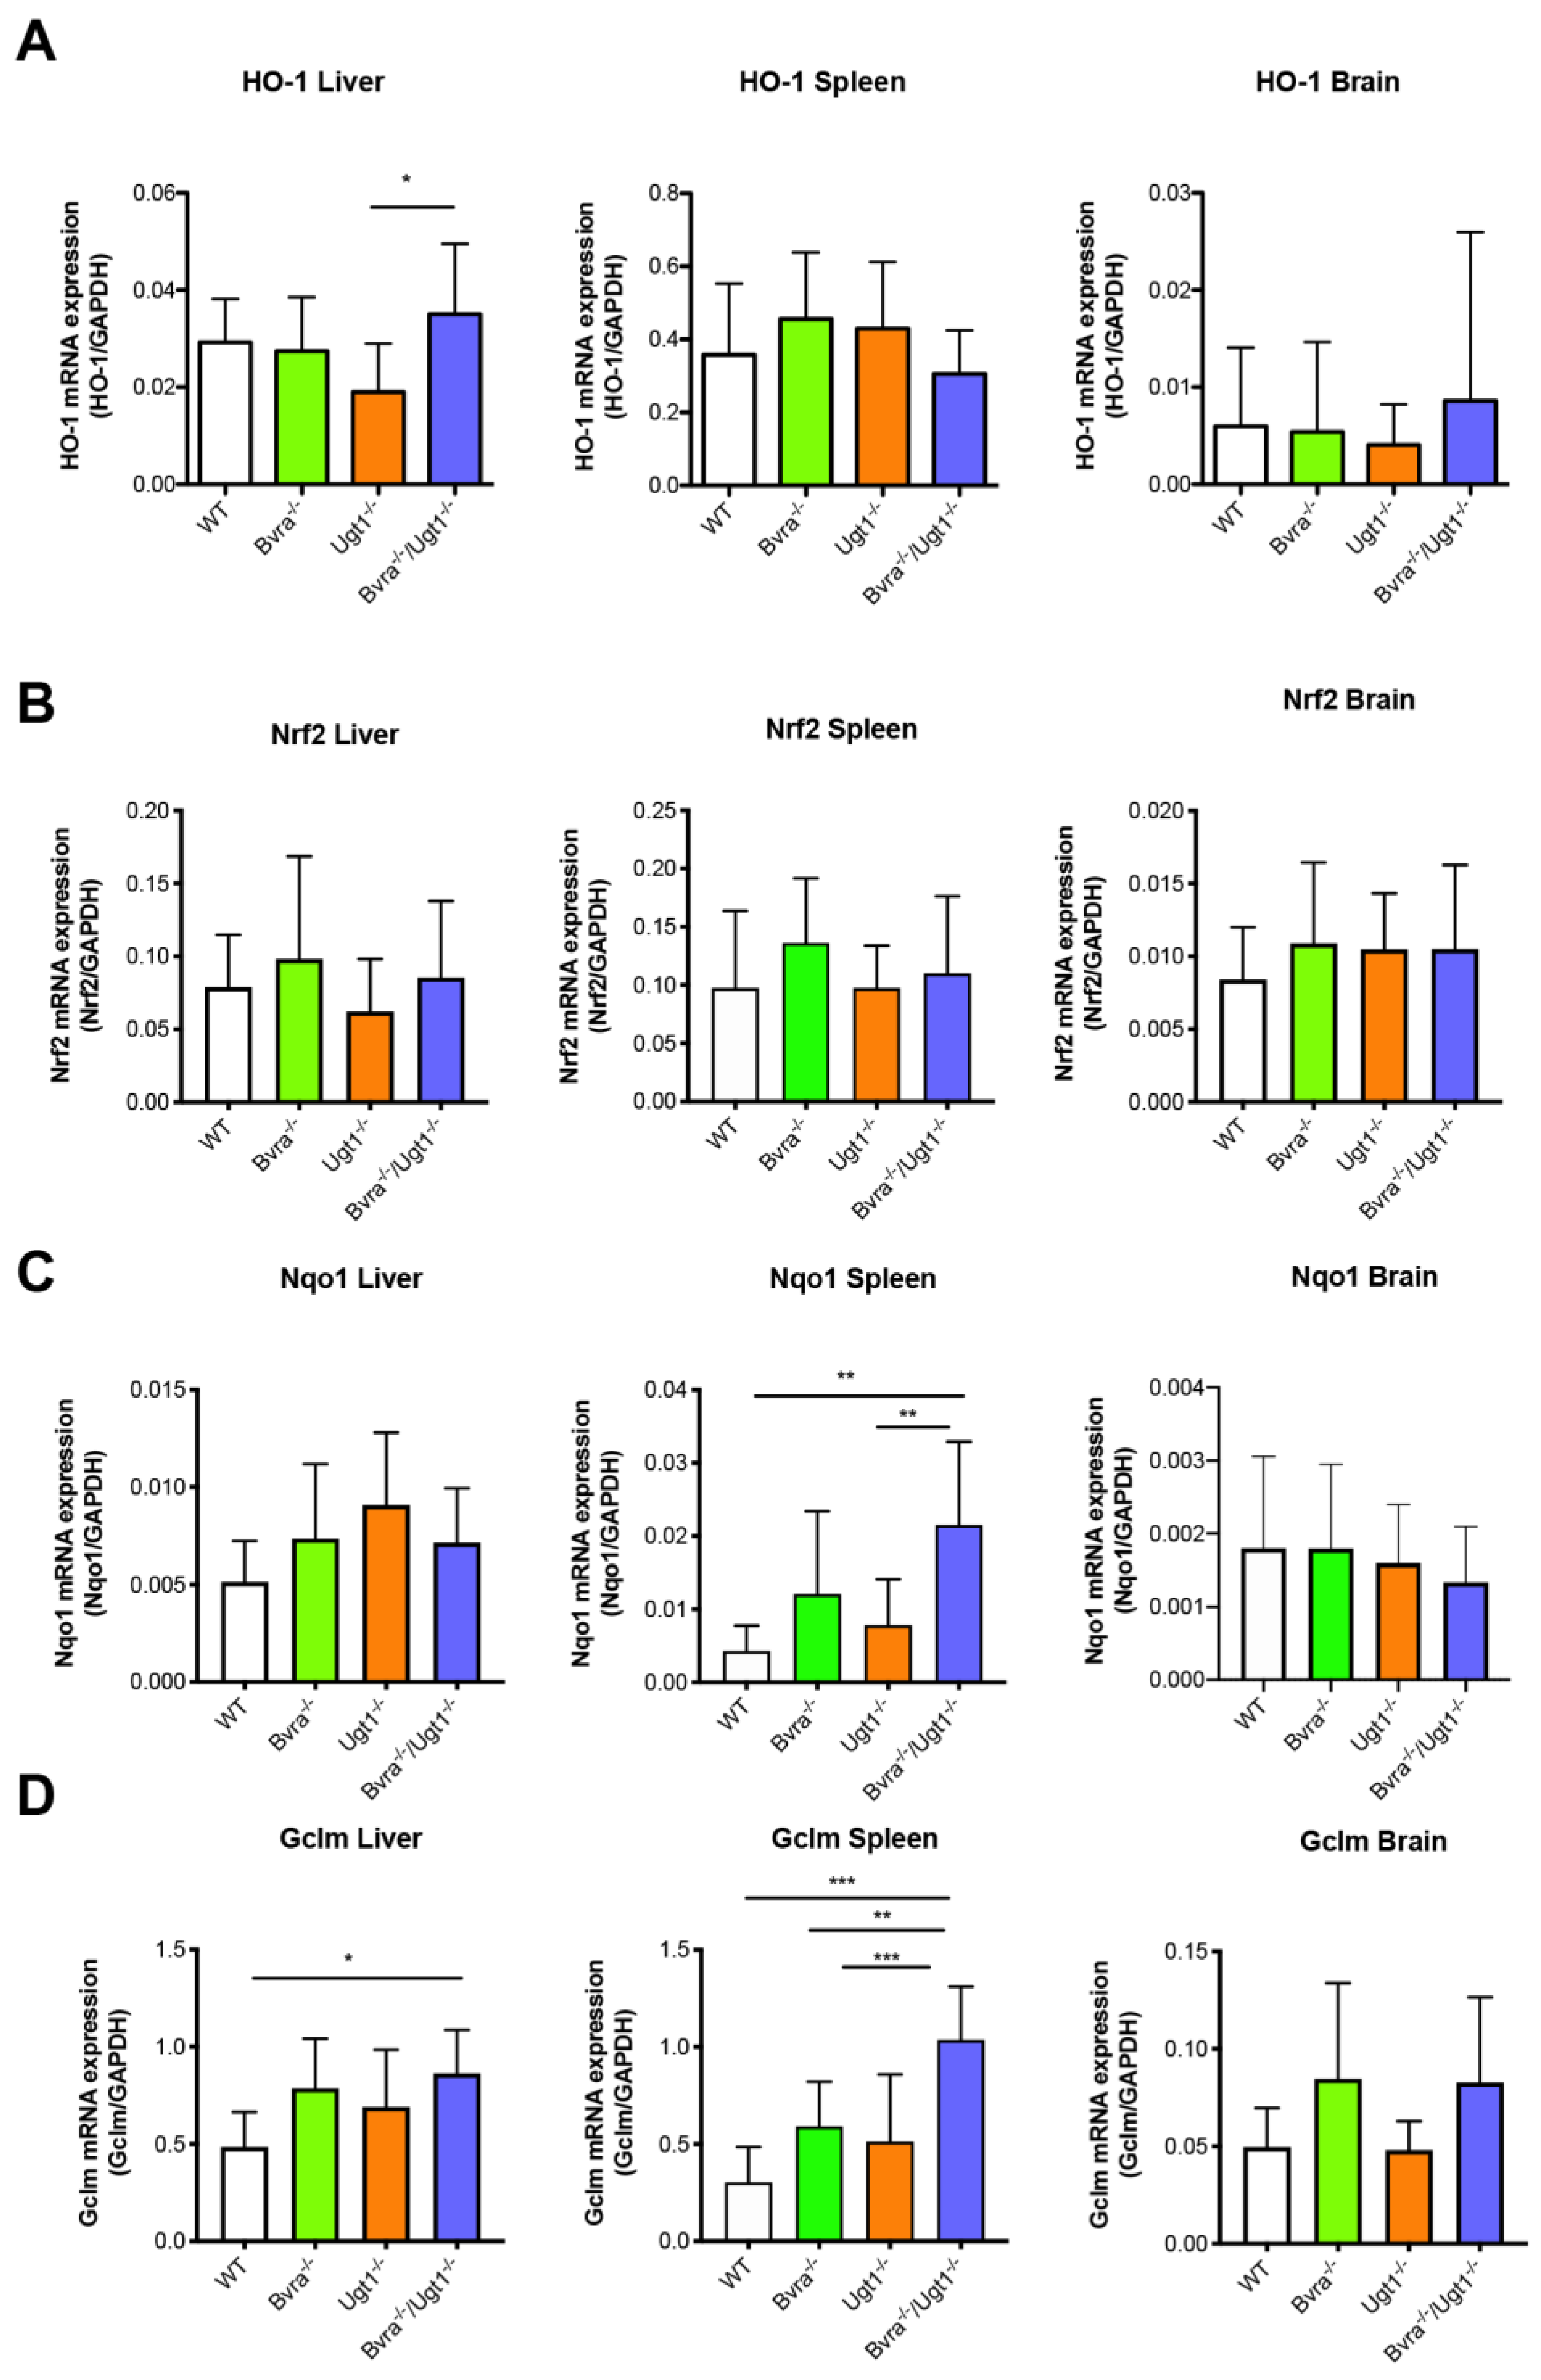
3.4. Aging-Related Systemic Oxidative Stress in Bvra Deficient Mice
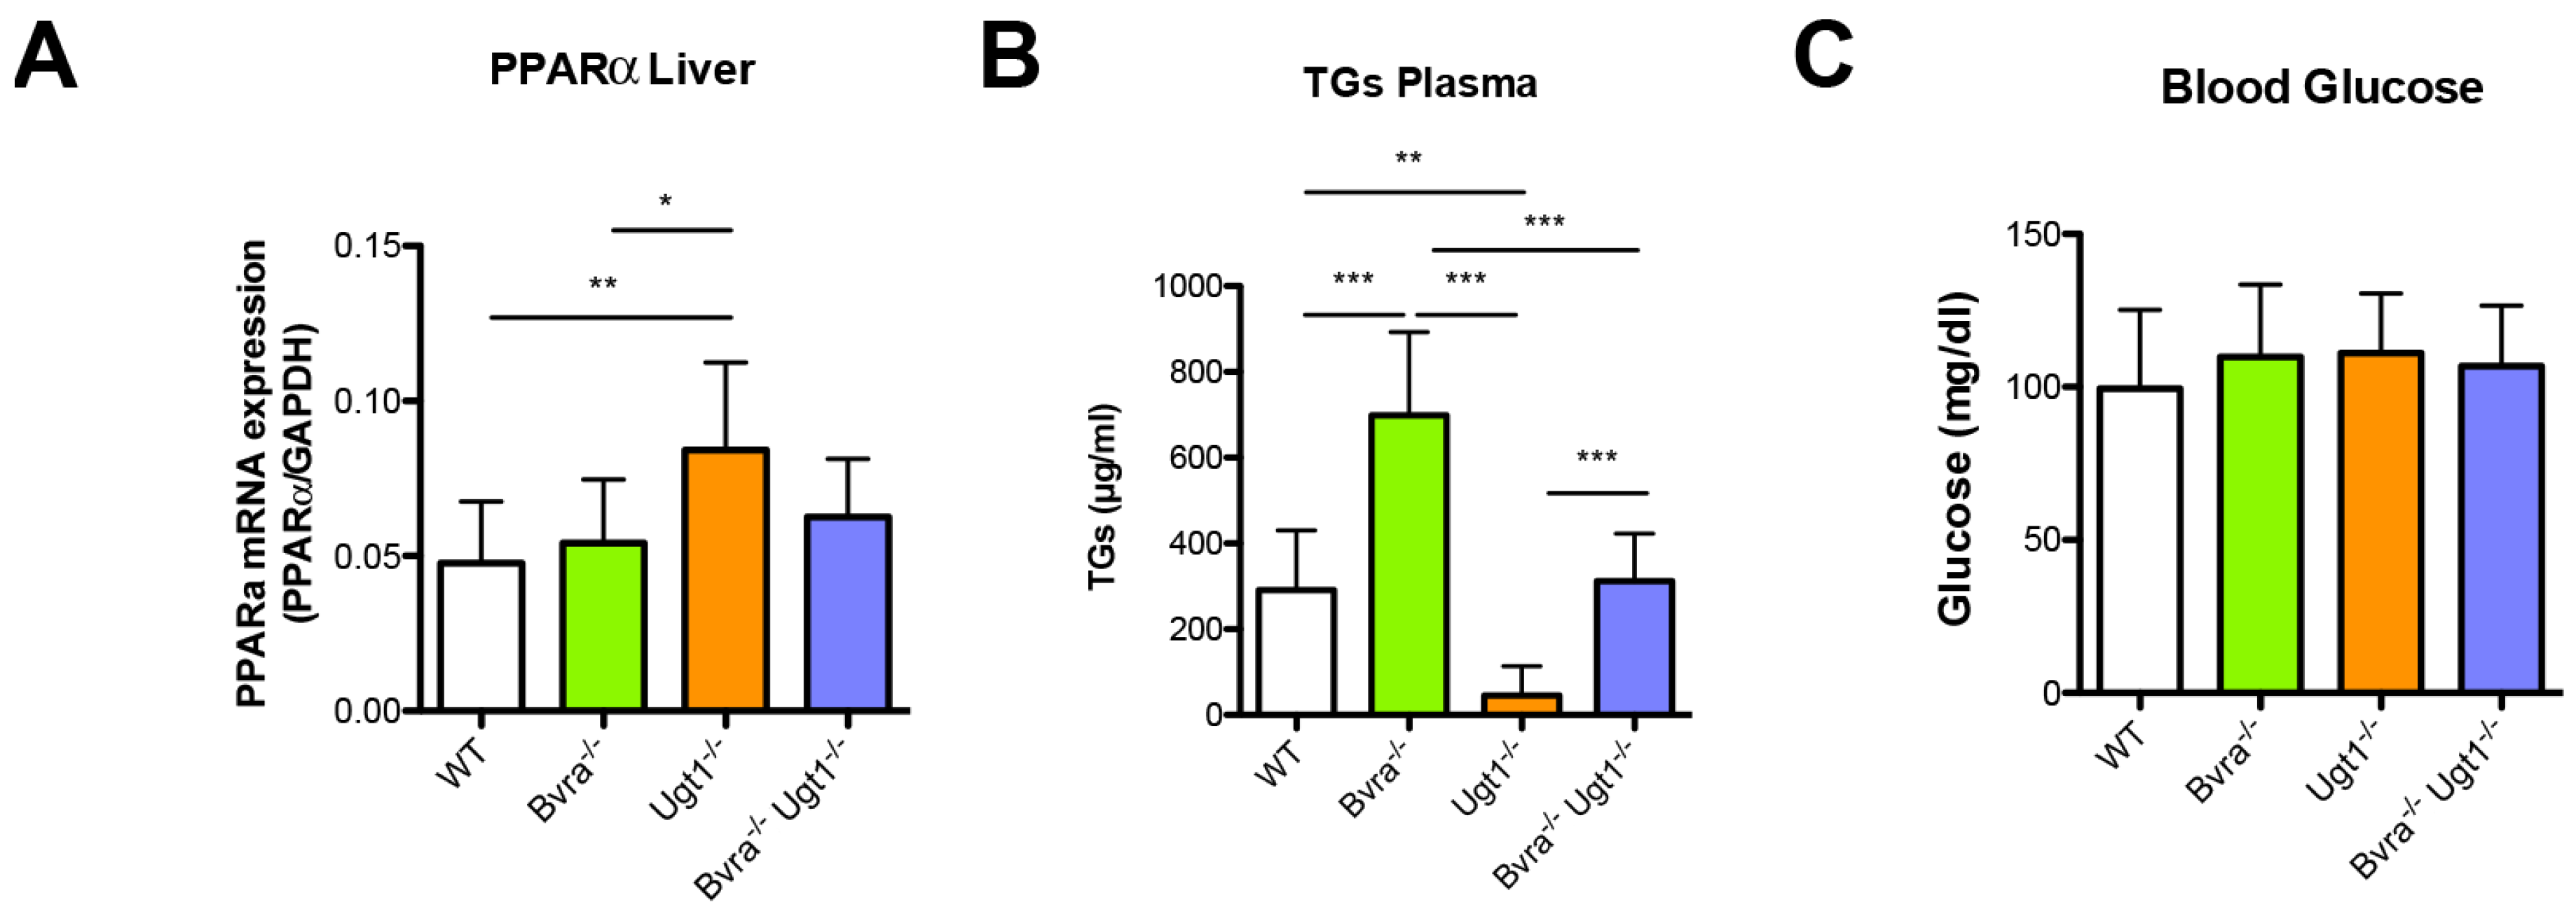
3.5. Metabolic Effects of Bvra and/or Ugt1 Deficiency in Aged Mice
4. Discussion
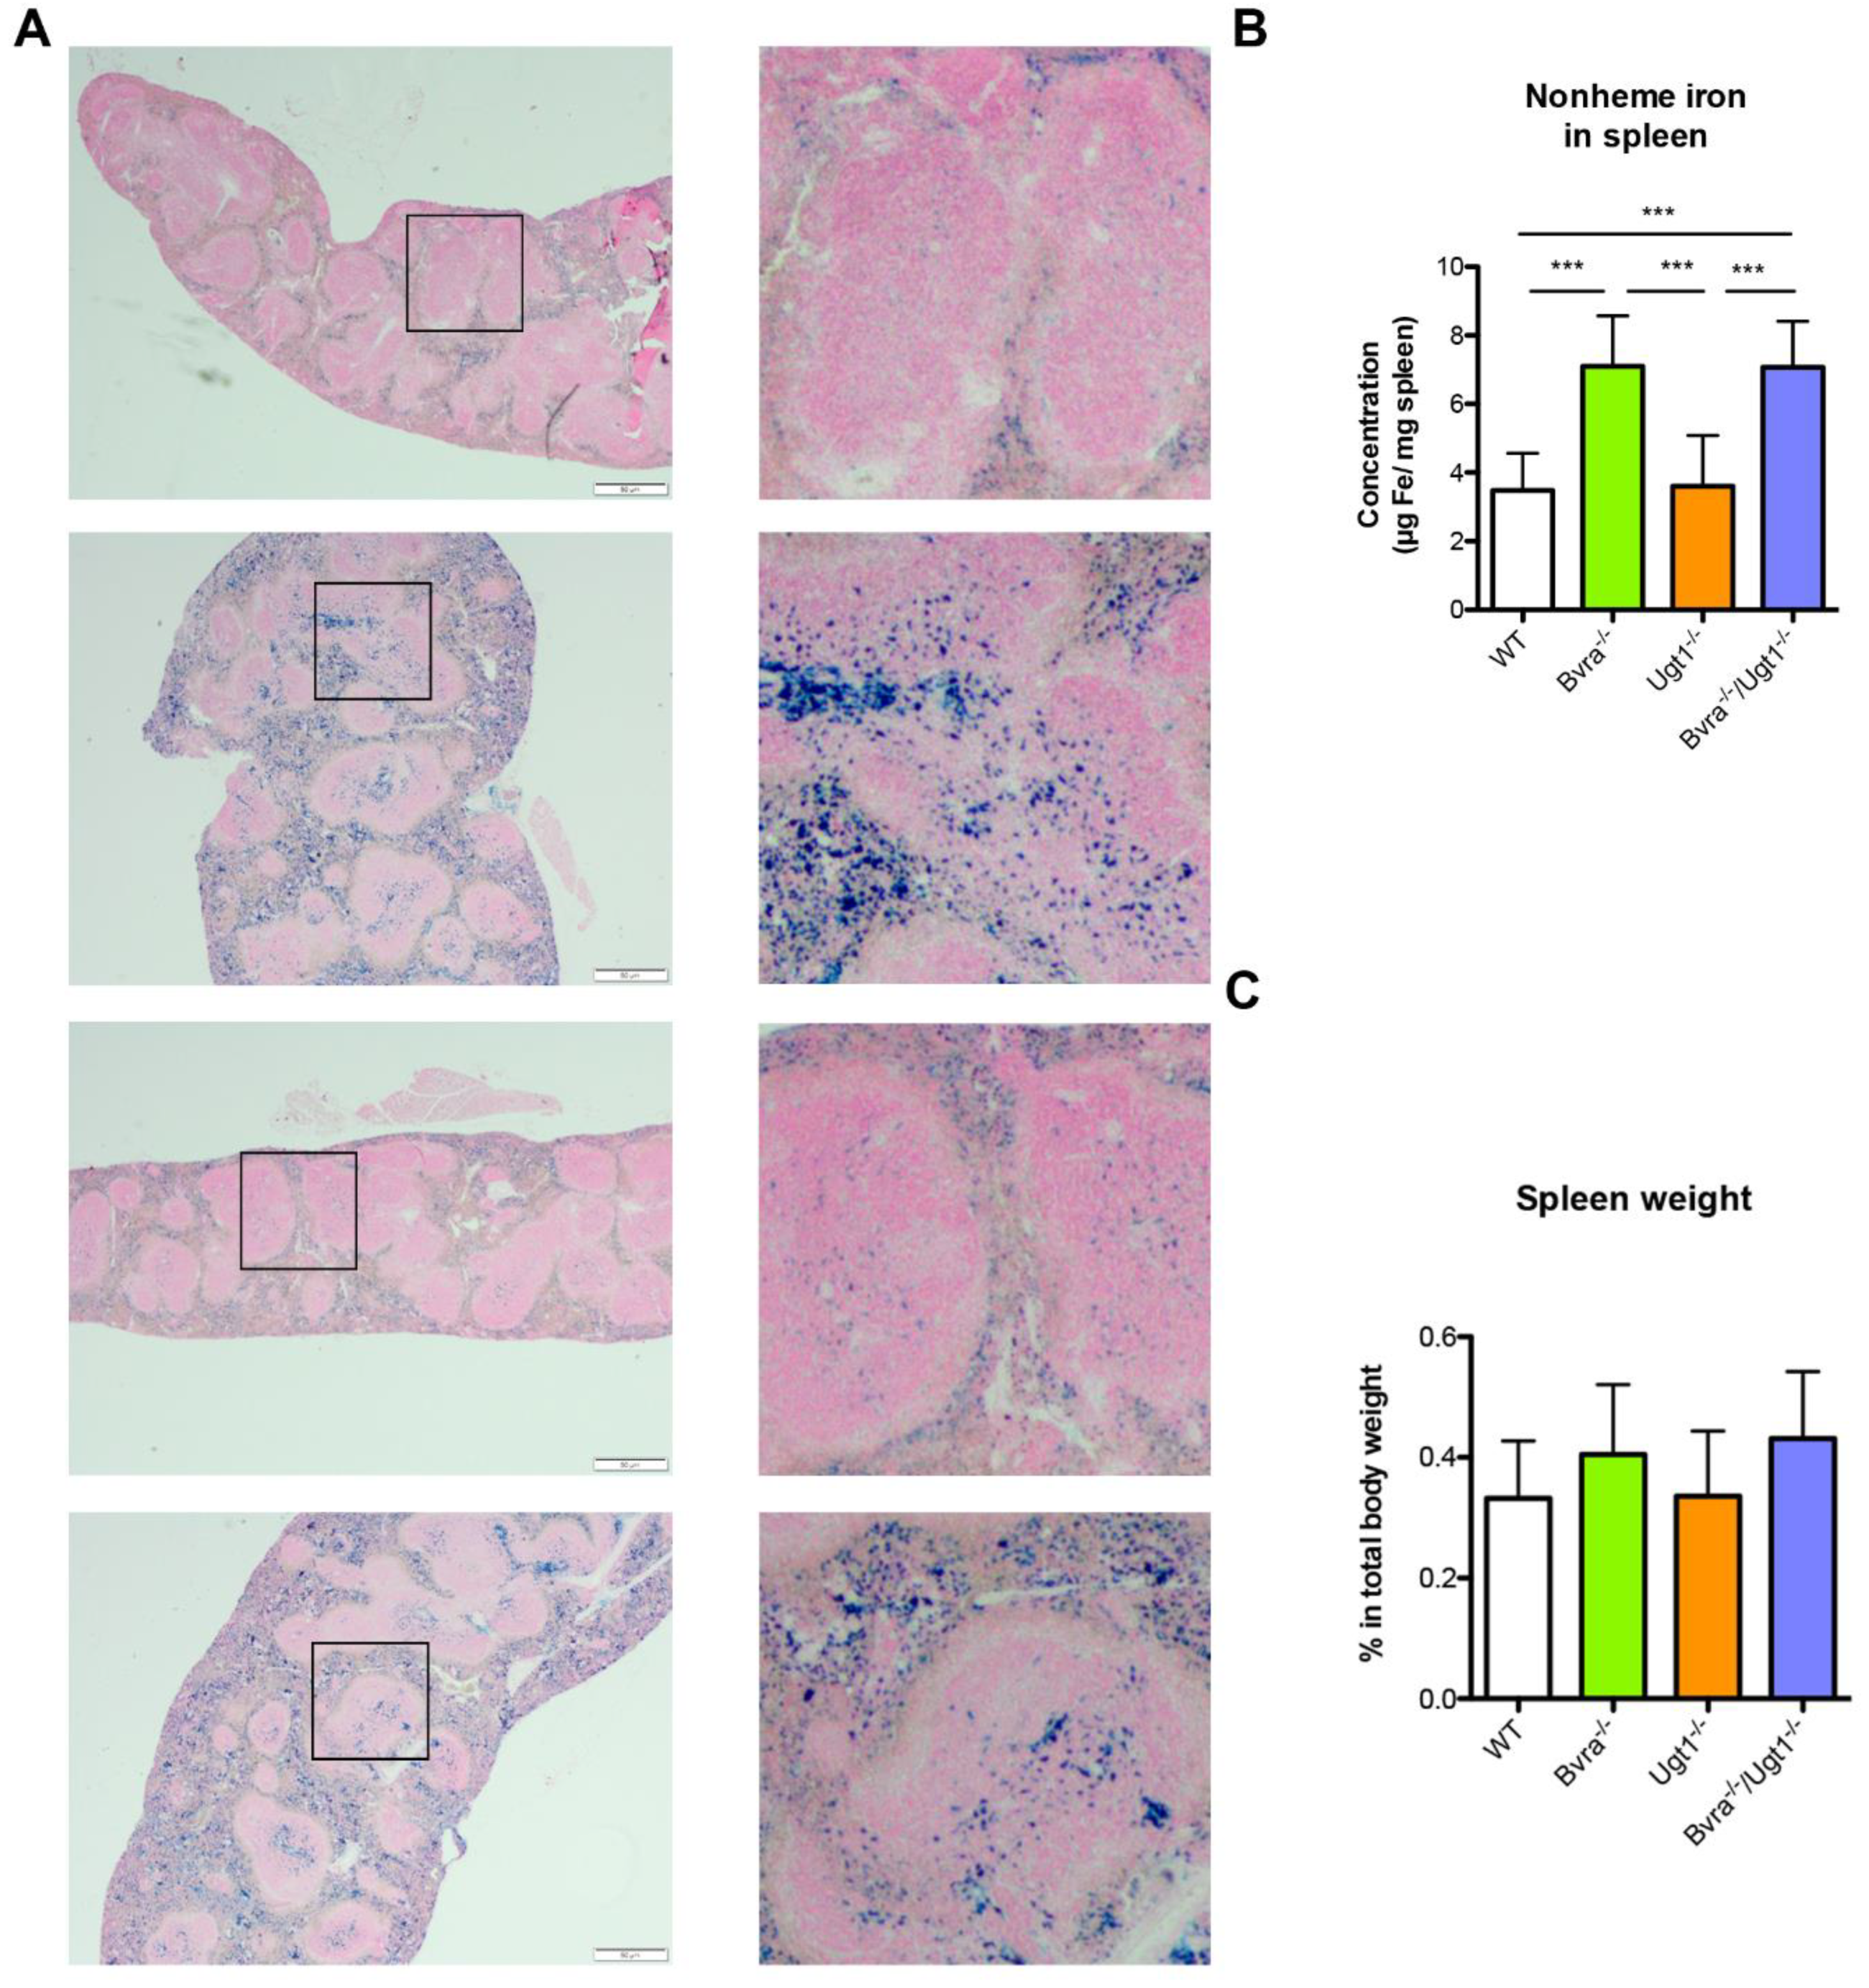
4.1. Bvra Deficiency, Oxidative Stress, and Iron Accumulation
4.2. Biliverdin and Bilirubin in Triglyceride and Glucose Metabolism
5. Conclusions
Supplementary Materials
Author Contributions
Funding
Institutional Review Board Statement
Informed Consent Statement
Data Availability Statement
Acknowledgments
Conflicts of Interest
References
- Beale, I.S.; Yeh, I.J. Deconstructing heme. Nat. Genet. 1999, 6, 903–905. [Google Scholar]
- Bissell, D. Bile Pigments and Jaundice; Marcel Dekker, Inc.: New York, NY, USA; Basel, Switzland, 1986; pp. 133–156. [Google Scholar]
- McDonagh, A.F. Turning green to gold. Nat. Genet. 2001, 8, 198–200. [Google Scholar] [CrossRef]
- Yamaguchi, T.; Nakajima, H. Changes in the Composition of Bilirubin-IX Isomers During Human Prenatal Development. J. Biol. Inorg. Chem. 1995, 233, 467–472. [Google Scholar] [CrossRef]
- Wang, X.; Chowdhury, J.R.; Chowdhury, N.R. Bilirubin metabolism: Applied physiology. Curr. Paediatr. 2006, 16, 70–74. [Google Scholar] [CrossRef]
- Ostrow, J.D.; Pascolo, L.; Brites, D.; Tiribelli, C. Molecular basis of bilirubin-induced neurotoxicity. Trends Mol. Med. 2004, 10, 65–70. [Google Scholar] [CrossRef]
- Schmid, R.; Hammaker, L. Metabolism and disposition of C 14-bilirubin in congenital nonhemolytic jaun-dice. J. Clin. Investig. 1963, 42, 1720–1734. [Google Scholar] [CrossRef]
- Bosma, P.J. Inherited disorders of bilirubin metabolism. J. Hepatol. 2003, 38, 107–117. [Google Scholar] [CrossRef]
- Sedlak, T.W.; Snyder, S.H. Bilirubin Benefits: Cellular Protection by a Biliverdin Reductase Antioxidant Cycle. Pediatrics 2004, 113, 1776–1782. [Google Scholar] [CrossRef]
- Stocker, R.; Yamamoto, Y.; McDonagh, A.F.; Glazer, A.N.; Ames, B.N. Bilirubin Is an Antioxidant of Possible Physiological Importance. Science 1987, 235, 1043–1046. [Google Scholar] [CrossRef]
- Dennery, P.A.; Seidman, D.S.; Stevenson, D.K. Neonatal hyperbilirubinemia. N. Engl. J. Med. 2001, 344, 581–590. [Google Scholar] [CrossRef]
- Kaplan, M.; Bromiker, R.; Hammerman, C. Severe Neonatal Hyperbilirubinemia and Kernicterus: Are These Still Problems in the Third Millennium? Neonatology 2011, 100, 354–362. [Google Scholar] [CrossRef]
- Burgos, A.E.; Flaherman, V.J.; Newman, T.B. Screening and Follow-Up for Neonatal Hyperbilirubinemia. Clin. Pediatr. 2011, 51, 7–16. [Google Scholar] [CrossRef]
- Morioka, I.; Nakamura, H.; Koda, T.; Yokota, T.; Okada, H.; Katayama, Y.; Kunikata, T.; Kondo, M.; Nakamura, M.; Hosono, S.; et al. Current incidence of clinical kernicterus in preterm infants in Japan. Pediatr. Int. 2015, 57, 494–497. [Google Scholar] [CrossRef]
- Greco, C.; Arnolda, G.; Boo, N.-Y.; Iskander, I.F.; Okolo, A.A.; Rohsiswatmo, R.; Shapiro, S.M.; Watchko, J.; Wennberg, R.P.; Tiribelli, C.; et al. Neonatal Jaundice in Low- and Middle-Income Countries: Lessons and Future Directions from the 2015 Don Ostrow Trieste Yellow Retreat. Neonatology 2016, 110, 172–180. [Google Scholar] [CrossRef]
- Diala, U.M.; Wennberg, R.P.; Abdulkadir, I.; Farouk, Z.L.; Zabetta, C.D.C.; Omoyibo, E.; Emokpae, A.; Aravkin, A.; Toma, B.; On behalf of the Stop Kernicterus In Nigeria (SKIN) study group; et al. Patterns of acute bilirubin encephalopathy in Nigeria: A multicenter pre-intervention study. J. Perinatol. 2018, 38, 873–880. [Google Scholar] [CrossRef]
- Bhutani, V.K.; Wong, R.J. Bilirubin neurotoxicity in preterm infants: Risk and prevention. J. Clin. Neonatol. 2013, 2, 61–69. [Google Scholar] [CrossRef] [Green Version]
- Olusanya, B.; Ogunlesi, T.A.; Slusher, T.M. Why is kernicterus still a major cause of death and disability in low-income and middle-income countries? Arch. Dis. Child. 2014, 99, 1117–1121. [Google Scholar] [CrossRef]
- Nytofte, N.S.; Serrano, M.A.; Monte, M.J.; Sanchez, O.B.; Tumer, Z.; Ladefoged, K.; Briz, O.; Marin, J. A homozygous nonsense mutation (c.214C- > A) in the biliverdin reductase alpha gene (BLVRA) results in accumulation of biliverdin during episodes of cholestasis. J. Med. Genet. 2011, 48, 219–225. [Google Scholar] [CrossRef] [Green Version]
- Gåfvels, M.; Holmström, P.; Somell, A.; Sjövall, F.; Svensson, J.-O.; Ståhle, L.; Broomé, U.; Stål, P. A novel mutation in the biliverdin reductase—A gene combined with liver cirrhosis results in hyperbiliverdinaemia (green jaundice). Liver Int. 2009, 29, 1116–1124. [Google Scholar] [CrossRef]
- Gonzalez-Sanchez, E.; Perez, M.J.; Nytofte, N.S.; Briz, O.; Monte, M.J.; Lozano, E.; Serrano, M.A.; Marin, J.J. Protective role of biliverdin against bile acid-induced oxidative stress in liver cells. Free Radic. Biol. Med. 2016, 97, 466–477. [Google Scholar] [CrossRef]
- McDonagh, A.F. Movement of bilirubin and bilirubin conjugates across the placenta. Pediatrics 2007, 119, 1032–1033. [Google Scholar] [CrossRef]
- Chen, W.; Maghzal, G.J.; Ayer, A.; Suarna, C.; Dunn, L.L.; Stocker, R. Absence of the biliverdin reductase-a gene is associated with increased endogenous oxidative stress. Free Radic. Biol. Med. 2018, 115, 156–165. [Google Scholar] [CrossRef]
- Bortolussi, G.; Zentilin, L.; Baj, G.; Giraudi, P.; Bellarosa, C.; Giacca, M.; Tiribelli, C.; Muro, A.F. Rescue of bilirubin-induced neonatal lethality in a mouse model of Crigler-Najjar syndrome type I by AAV9-mediated gene transfer. FASEB J. 2012, 26, 1052–1063. [Google Scholar] [CrossRef]
- Bortolussi, G.; Baj, G.; Vodret, S.; Viviani, G.; Bittolo, T.; Muro, A.F. Age-dependent pattern of cerebellar susceptibility to bilirubin neurotoxicity in vivo in mice. Dis. Models Mech. 2014, 7, 1057–1068. [Google Scholar]
- Ruijter, J.M.; Pfaffl, M.; Zhao, S.; Spiess, A.N.; Boggy, G.; Blom, J.; Rutledge, R.G.; Sisti, D.; Lievens, A.; De Preter, K.; et al. Evaluation of qPCR curve analysis methods for reliable biomarker discovery: Bias, resolution, precision, and implications. Methods 2013, 59, 32–46. [Google Scholar] [CrossRef]
- Van Dijk, R.; Aronson, S.J.; De Waart, D.R.; Van De Graaf, S.F.; Duijst, S.; Seppen, J.; Elferink, R.O.; Beuers, U.; Bosma, P.J. Biliverdin Reductase inhibitors did not improve severe unconjugated hyperbilirubinemia in vivo. Sci. Rep. 2017, 7, 1646. [Google Scholar] [CrossRef]
- Viana, K.A.; Filho, O.A.M.; Dusse, L.M.S.; Avelar, R.S.; Avelar, D.M.V.; Carvalho, B.; Ribeiro, C.M.F.; Antonelli, L.R.D.V.; Teixeira, A.; Carvalho, M.D.G. Reticulocyte count: Comparison among methods. J. Bras. Patol. Med. Lab. 2014, 50, 339–345. [Google Scholar] [CrossRef] [Green Version]
- Viana, K.A.; Carvalho, M.D.G.; Dusse, L.; Fernandes, A.C.; Avelar, R.S.; Avelar, D.M.V.; Carvalho, B.; Ribeiro, C.M.F.; Antonelli, L.R.D.V.; Teixeira, A.; et al. Flow cytometry reticulocyte counting using acridine orange: Validation of a new protocol. J. Bras. Patol. Med. Lab. 2014, 50, 189–199. [Google Scholar] [CrossRef] [Green Version]
- Srivastava, N.K.; Pradhan, S.; Mittal, B.; Kumar, R.; Gowda, G.A.N. An Improved, Single Step Standardized Method of Lipid Extraction from Human Skeletal Muscle Tissue. Anal. Lett. 2006, 39, 297–315. [Google Scholar] [CrossRef]
- Whittaker, P.; Hines, F.A.; Robl, M.G.; Dunkel, V.C. Histopathological Evaluation of Liver, Pancreas, Spleen, and Heart from Iron-Overloaded Sprague-Dawley Rats*1,2. Toxicol. Pathol. 1996, 24, 558–563. [Google Scholar] [CrossRef] [PubMed]
- James, J.; Bosch, K.; Aronson, D.; Houtkooper, J. Sirius red histophotometry and spectrophotometry of sections in the assessment of the collagen content of liver tissue and its application in growing rat liver. Liver 1990, 10, 1–5. [Google Scholar] [CrossRef]
- Drury, R.A.B.; Wallington, E.A. Carleton’s Histological Technique; Oxford University Press: Oxford, UK, 1980. [Google Scholar]
- McDonagh, A.F.; Palma, L.A.; Schmid, R. Reduction of biliverdin and placental transfer of bilirubin and biliverdin in the pregnant guinea pig. Biochem. J. 1981, 194, 273–282. [Google Scholar] [CrossRef] [Green Version]
- O’Brien, L.; Hosick, P.A.; John, K.; Stec, D.E.; Hinds, T.D. Biliverdin reductase isozymes in metabolism. Trends Endocrinol. Metab. 2015, 26, 212–220. [Google Scholar] [CrossRef] [Green Version]
- Wang, Y.; Lv, J.; Ma, X.; Wang, D.; Ma, H.; Chang, Y.; Nie, G.; Jia, L.; Duan, X.; Liang, X.-J. Specific Hemosiderin Deposition in Spleen Induced by a Low Dose of Cisplatin: Altered Iron Metabolism and Its Implication as an Acute Hemosiderin Formation Model. Curr. Drug Metab. 2010, 11, 507–515. [Google Scholar] [CrossRef] [Green Version]
- Wang, C.-Y.; Babitt, J.L. Hepcidin regulation in the anemia of inflammation. Curr. Opin. Hematol. 2016, 23, 189–197. [Google Scholar] [CrossRef]
- Kapitulnik, J.; Maines, M.D. Pleiotropic functions of biliverdin reductase: Cellular signaling and generation of cytoprotective and cytotoxic bilirubin. Trends Pharmacol. Sci. 2009, 30, 129–137. [Google Scholar] [CrossRef]
- Hinds, T.D., Jr.; Burns, K.A.; Hosick, P.A.; McBeth, L.; Nestor-Kalinoski, A.; Drummond, H.A.; AlAmodi, A.A.; Hankins, M.W.; Heuvel, J.P.V.; Stec, D.E. Biliverdin Reductase A Attenuates Hepatic Steatosis by Inhibition of Glycogen Synthase Kinase (GSK) 3β Phosphorylation of Serine 73 of Peroxisome Proliferator-activated Receptor (PPAR) α. J. Biol. Chem. 2016, 291, 25179–25191. [Google Scholar] [CrossRef] [Green Version]
- Khoei, N.S.; Grindel, A.; Wallner, M.; Mölzer, C.; Doberer, D.; Marculescu, R.; Bulmer, A.; Wagner, K.-H. Mild hyperbilirubinaemia as an endogenous mitigator of overweight and obesity: Implications for improved metabolic health. Atherosclerosis 2018, 269, 306–311. [Google Scholar] [CrossRef] [Green Version]
- DiNicolantonio, J.J.; Mccarty, M.; Okeefe, J. Does elevated bilirubin aid weight control by preventing development of hypothalamic leptin resistance? Open Heart 2019, 6, e000897. [Google Scholar] [CrossRef] [Green Version]
- Andersson, C.; Weeke, P.; Fosbøl, E.; Brendorp, B.; Køber, L.; Coutinho, W.; Sharma, A.M.; Van Gaal, L.; Finer, N.; James, W.P.T.; et al. Acute effect of weight loss on levels of total bilirubin in obese, cardiovascular high-risk patients: An analysis from the lead-in period of the Sibutramine Cardiovascular Outcome trial. Metabolism 2009, 58, 1109–1115. [Google Scholar] [CrossRef]
- Vítek, L. The Role of Bilirubin in Diabetes, Metabolic Syndrome, and Cardiovascular Diseases. Front. Pharmacol. 2012, 3, 55. [Google Scholar] [CrossRef] [Green Version]
- Vidimce, J.; Pillay, J.; Shrestha, N.; Dong, L.-F.; Neuzil, J.; Wagner, K.-H.; Holland, O.J.; Bulmer, A.C. Mitochondrial Function, Fatty Acid Metabolism, and Body Composition in the Hyperbilirubinemic Gunn Rat. Front. Pharmacol. 2021, 12, 73. [Google Scholar] [CrossRef]
- Galmés-Pascual, B.M.; Nadal-Casellas, A.; Thorbrügge, M.B.; Sbert-Roig, M.; García-Palmer, F.J.; Proenza, A.M.; Gianotti, M.; Lladó, I. 17β-estradiol improves hepatic mitochondrial biogenesis and function through PGC1B. J. Endocrinol. 2017, 232, 297–308. [Google Scholar] [CrossRef] [Green Version]
- Abbasi, A.; Deetman, P.E.; Corpeleijn, E.; Gansevoort, R.T.; Gans, R.O.; Hillege, H.L.; van der Harst, P.; Stolk, R.P.; Navis, G.; Alizadeh, B.Z.; et al. Bilirubin as a Potential Causal Factor in Type 2 Diabetes Risk: A Mendelian Randomization Study. Diabetes 2014, 64, 1459–1469. [Google Scholar] [CrossRef] [PubMed] [Green Version]
- Zhong, P.; Sun, D.; Wu, D.; Liu, X. Total bilirubin is negatively related to diabetes mellitus in Chinese elderly: A community study. Ann. Transl. Med. 2019, 7, 474. [Google Scholar] [CrossRef]
- Yang, M.; Ni, C.; Chang, B.; Jiang, Z.; Zhu, Y.; Tang, Y.; Li, Z.; Li, C.; Li, B. Association between serum total bilirubin levels and the risk of type 2 diabetes mellitus. Diabetes Res. Clin. Pract. 2019, 152, 23–28. [Google Scholar] [CrossRef] [Green Version]
- Dong, H.; Huang, H.; Yun, X.; Kim, D.-S.; Yue, Y.; Wu, H.; Sutter, A.; Chavin, K.D.; Otterbein, L.E.; Adams, D.B.; et al. Bilirubin Increases Insulin Sensitivity in Leptin-Receptor Deficient and Diet-Induced Obese Mice Through Suppression of ER Stress and Chronic Inflammation. Endocrinology 2014, 155, 818–828. [Google Scholar] [CrossRef]
- Fujiwara, R.; Mitsugi, R.; Uemura, A.; Itoh, T.; Tukey, R.H. Severe neonatal hyperbilirubinemia in Crigler-Najjar syndrome model mice can be reversed with zinc protoporphyrin. Hepatol. Commun. 2017, 1, 792–802. [Google Scholar] [CrossRef]
- Kappas, A.; Drummond, G.S.; Valaes, T. A single dose of Sn-mesoporphyrin prevents development of severe hyperbilirubinemia in glucose-6-phosphate dehydrogenase-deficient newborns. Pediatrics 2001, 108, 25–30. [Google Scholar] [CrossRef] [PubMed]
- Drummond, G.S.; Kappas, A. Prevention of neonatal hyperbilirubinemia by tin protoporphyrin IX, a potent competitive inhibitor of heme oxidation. Proc. Natl. Acad. Sci. USA 1981, 78, 6466–6470. [Google Scholar] [CrossRef] [Green Version]
- Schulz, S.; Wong, R.J.; Vreman, H.J.; Strevenson, D.K. Metalloporphyrins—An update. Front. Pharmacol. 2012, 3, 68. [Google Scholar] [CrossRef] [Green Version]
- Suresh, G.; Martin, C.L.; Soll, R. Metalloporphyrins for treatment of unconjugated hyperbilirubinemia in neonates. Cochrane Database Syst. Rev. 2003, 1. [Google Scholar] [CrossRef]
- Galbraith, R.A.; Drummond, G.S.; Kappas, A. Suppression of Bilirubin Production in the Crigler-Najjar Type I Syndrome: Studies with the Heme Oxygenase Inhibitor Tin-Mesoporphyrin. Pediatrics 1992, 89, 175–182. [Google Scholar] [CrossRef]
- Cornelius, C.E. Bile Pigments in Fishes: A Review. Vet. Clin. Pathol. 1991, 20, 106–116. [Google Scholar] [CrossRef]
- Cornelius, C.E.; Bruss, M.L. Hepatic Bile Pigment Excretion and Erythrocyte Turnover in Various Species. Veter-Clin. Pathol. 1980, 9, 15–20. [Google Scholar] [CrossRef]
- Austin, C.C.; Jessing, K.W. Green-blood pigmentation in lizards. Comp. Biochem. Physiol. Part A Physiol. 1994, 109, 619–626. [Google Scholar] [CrossRef]
- Briz, O.; Macias, R.I.; Perez, M.J.; Serrano, M.A.; Marin, J.J. Excretion of fetal biliverdin by the rat placentamaternal liver tandem. Am. J. Physiol. Regul. Integr. Comp. Physiol. 2006, 290, R749–R756. [Google Scholar] [CrossRef] [Green Version]
- Pereira, P.; Macedo-Ribeiro, S.; Párraga, A.; Pérez-Luque, R.; Cunningham, O.; Darcy, K.; Mantle, T.J.; Coll, M. Structure of human biliverdin IXbeta reductase, an early fetal bilirubin IXbeta producing enzyme. Nat. Genet. 2001, 8, 215–220. [Google Scholar] [CrossRef] [Green Version]
- Vítek, L.; Jirsa, M.; Brodanová, M.; Kaláb, M.; Mareček, Z.; Danzig, V.; Novotný, L.; Kotal, P. Gilbert syndrome and ischemic heart disease: A protective effect of elevated bilirubin levels. Atherosclerosis 2002, 160, 449–456. [Google Scholar] [CrossRef]
- Lin, J.; O’Donnell, C.; Schwaiger, J.; Cupples, A.; Lingenhel, A.; Hunt, S.; Yang, S.; Kronenberg, F. Cir-Culation; Lippincott Williams & Wilkins: Philadelphia, PA, USA, 2006; Volume 113, p. E321. [Google Scholar]
- Mayer, M. Association of Serum Bilirubin Concentration with Risk of Coronary Artery Disease. Clin. Chem. 2000, 46, 1723–1727. [Google Scholar] [CrossRef] [Green Version]
- Vítek, L. Bilirubin and Atherosclerotic Diseases. Physiol. Res. 2017, 66, S11–S20. [Google Scholar] [CrossRef]
- Translator Vasavda, C.; Kothari, R.; Malla, A.P.; Tokhunts, R.; Lin, A.; Ji, M.; Ricco, C.; Xu, R.; Saavedra, H.G.; Sbodio, J.I.; et al. Bilirubin Links Heme Metabolism to Neuroprotection by Scavenging Superoxide. Cell Chem. Biol. 2019, 26, 1450–1460.e7. [Google Scholar] [CrossRef]
- Maghzal, G.J.; Leck, M.-C.; Collinson, E.; Li, C.; Stocker, R. Limited Role for the Bilirubin-Biliverdin Redox Amplification Cycle in the Cellular Antioxidant Protection by Biliverdin Reductase. J. Biol. Chem. 2009, 284, 29251–29259. [Google Scholar] [CrossRef] [Green Version]
- McDonagh, A.F. The biliverdin–bilirubin antioxidant cycle of cellular protection: Missing a wheel? Free Radic. Biol. Med. 2010, 49, 814–820. [Google Scholar] [CrossRef]
- Baranano, D.E.; Rao, M.; Ferris, C.D.; Snyder, S.H. Biliverdin reductase: A major physiologic cytoprotectant. Proc. Natl. Acad. Sci. USA 2002, 99, 16093–16098. [Google Scholar] [CrossRef] [Green Version]
- Neuzil, J.; Stocker, R. Free and albumin-bound bilirubin are efficient co-antioxidants for alpha-tocopherol, inhibiting plasma and low density lipoprotein lipid peroxidation. J. Biol. Chem. 1994, 269, 16712–16719. [Google Scholar] [CrossRef]
- Jiang, L.; Wang, X.; Wang, Y.; Chen, X. Quantitative proteomics reveals that miR-222 inhibits erythroid differentiation by targeting BLVRA and CRKL. Cell Biochem. Funct. 2018, 36, 95–105. [Google Scholar] [CrossRef] [PubMed]
- Camaschella, C.; Nai, A.; Silvestri, L. Iron metabolism and iron disorders revisited in the hepcidin era. Haematologica 2020, 105, 260–272. [Google Scholar] [CrossRef] [Green Version]
- Liu, Y.; de Montellano, P.R.O. Reaction Intermediates and Single Turnover Rate Constants for the Oxidation of Heme by Human Heme Oxygenase-1. J. Biol. Chem. 2000, 275, 5297–5307. [Google Scholar] [CrossRef] [Green Version]
- Ito, T.; Chen, D.; Chang, C.-W.T.; Kenmochi, T.; Saito, T.; Suzuki, S.; Takemoto, J.Y. Mesobiliverdin IXα Enhances Rat Pancreatic Islet Yield and Function. Front. Pharmacol. 2013, 4, 50. [Google Scholar] [CrossRef] [Green Version]
- Chen, W.; Tumanov, S.; Fazarkeley, D.; Cantley, J.; James, D.E.; Dunn, L.L.; Shaik, T.; Suarna, C.; Stocker, R. Bilirubin deficiency renders mice susceptible to hepatic steatosis in the absence of insulin resistance. Redox Biol. 2021, 47, 102152. [Google Scholar] [CrossRef] [PubMed]


Publisher’s Note: MDPI stays neutral with regard to jurisdictional claims in published maps and institutional affiliations. |
© 2021 by the authors. Licensee MDPI, Basel, Switzerland. This article is an open access article distributed under the terms and conditions of the Creative Commons Attribution (CC BY) license (https://creativecommons.org/licenses/by/4.0/).
Share and Cite
Bortolussi, G.; Shi, X.; ten Bloemendaal, L.; Banerjee, B.; De Waart, D.R.; Baj, G.; Chen, W.; Oude Elferink, R.P.; Beuers, U.; Paulusma, C.C.; et al. Long-Term Effects of Biliverdin Reductase a Deficiency in Ugt1−/− Mice: Impact on Redox Status and Metabolism. Antioxidants 2021, 10, 2029. https://doi.org/10.3390/antiox10122029
Bortolussi G, Shi X, ten Bloemendaal L, Banerjee B, De Waart DR, Baj G, Chen W, Oude Elferink RP, Beuers U, Paulusma CC, et al. Long-Term Effects of Biliverdin Reductase a Deficiency in Ugt1−/− Mice: Impact on Redox Status and Metabolism. Antioxidants. 2021; 10(12):2029. https://doi.org/10.3390/antiox10122029
Chicago/Turabian StyleBortolussi, Giulia, Xiaoxia Shi, Lysbeth ten Bloemendaal, Bhaswati Banerjee, Dirk R. De Waart, Gabriele Baj, Weiyu Chen, Ronald P. Oude Elferink, Ulrich Beuers, Coen C. Paulusma, and et al. 2021. "Long-Term Effects of Biliverdin Reductase a Deficiency in Ugt1−/− Mice: Impact on Redox Status and Metabolism" Antioxidants 10, no. 12: 2029. https://doi.org/10.3390/antiox10122029