Article

LC-MS Identification and Quantification of Phenolic Compounds in Solid Residues from the Essential Oil Industry

by
Maria Irakli
1,*,
Adriana Skendi
1,2,
Elisavet Bouloumpasi
1,
Paschalina Chatzopoulou
1 and
Costas G. Biliaderis
3
1
Hellenic Agricultural Organization, Demeter, Plant Breeding and Genetic Resources Institute, P.O. Box 60458, Thermi, 57001 Thessaloniki, Greece
2
Department of Food Science and Technology, International Hellenic University, P.O. Box 141, 57400 Thessaloniki, Greece
3
Department of Food Science and Technology, Aristotle University of Thessaloniki, P.O. Box 235, 54124 Thessaloniki, Greece
*
Author to whom correspondence should be addressed.
Antioxidants 2021, 10(12), 2016; https://doi.org/10.3390/antiox10122016
Submission received: 6 December 2021 / Revised: 16 December 2021 / Accepted: 17 December 2021 / Published: 19 December 2021

Abstract

:
Plant solid residues obtained from the essential oil industry represent a rich source of phenolic compounds with bioactive properties to be used in the food and pharmaceutical industries. A selective and sensitive liquid chromatography-mass spectrometry (LC-MS) method was developed for the simultaneous determination of phenolic compounds in solid residues of the Lamiaceae family plants. A total of 48 compounds can be separated within 35 min by using the Poroshell-120 EC-C18 column, and a gradient mobile phase of 0.1% formic acid and acetonitrile with flow rate of 0.5 mL/min; salicylic acid was used as internal standard. The calibration curves showed good linearity in the tested concentration range for each analyte (R2 > 0.9921), while recoveries ranged from 70.1% to 115.0% with an intra-day and inter-day precision of less than 6.63% and 15.00%, respectively. Based on the retention behavior, as well as absorption and mass spectra, 17 phenolic acids, 19 flavonoids and 2 phenolic diterpenes were identified and quantified in the solid residues obtained by distillation of six aromatic plants: oregano, rosemary, sage, satureja, lemon balm, and spearmint. The method constitutes an accurate analytical and quality control tool for the simultaneous quantitation of phenolics present in solid waste residues from the essential oil industry.

1. Introduction

Aromatic plants of the Lamiaceae family are rich in phytochemicals, especially in phenolic compounds [1]. Moreover, phenolic compounds present in these plants are widely recognized for their high biological activity, such as antioxidant [1,2,3], anti-inflammatory, and antimicrobial as well as antifungal properties [3,4,5]. Additionally, the essential oils from plants of the Lamiaceae family, produced mainly by steam distillation, are rich in aromatic compounds with distinct flavoring and bioactive properties, for which there is an increasing demand nowadays in many industries (food and beverages, cosmetics, pharmaceuticals, perfumes, food and feed additives—supplements industry).
The production of essential oils from plants of the Lamiaceae family and especially from oregano (Origanum vulgare L.), rosemary (Rosmarinus officinalis L.), sage (Salvia fruticosa Mill), satureja (Satureja thymbra L.), lemon balm (Melissa officinalis L.), and spearmint (Mentha spicata) can be a profitable activity of the agricultural sector, contributing to the economic development in the Mediterranean region where these plants are well adopted and mainly grown. Nevertheless, the increased production of essential oils results in a great waste disposal of solid plant residues that remain after the extraction of essential oil, thus causing significant environmental concern. The extraction of phenolics from such waste represents an interesting and innovative valorization scheme as an opportunity to obtain high-added value products from these low-cost raw materials [6]. Until now, studies have dealt mainly with different extraction processes applied to waste residues, in order to obtain extracts with high antioxidant properties [7,8,9,10]. In these studies, the phenolic compounds present in the extracts are quantified in bulk utilizing mainly spectroscopic methods or antioxidant assays. Some of them involve quantification approaches using High-Performance Liquid Chromatography (HPLC) methods alone, or coupled with mass spectrometry (MS) or MS/MS. These methods aim mainly to identify the compounds present in the extracts. In the case, when quantification is performed, the external standard method is employed with the calibration curve for only a few main phenolic compounds supposedly present in the residues. Thus, these methods are not tailored for quantification of a great number of phenolics or even when developed for testing a great number of compounds, they are not validated to be applicable for routine analysis of this type of analytes remaining in the solid residue matrix, after the distillation of essential oils.
It is generally accepted that isolation and quantification of target analytes from different plant matrices require the development of appropriate methods that are characterized by high selectivity and sensitivity. Moreover, prior to the application of an optimized chromatographic method, appropriate extraction and purification techniques should be developed, in order to extract quantitatively all the analytes from the composite plant matrix.
The literature reports different extraction procedures for phenolics utilizing conventional liquid extraction involving organic solvents, such as methanol, ethanol, acetone, ethyl acetate, butanone, hexane as well as mixtures of them with or without water [11]. Conventional extraction of phenolics may be also coupled with Soxhlet extraction or without it [12,13,14] as well as with the application of new technologies such as microwave [15,16,17] or ultrasound [1,16,17], in order to reduce the time and energy required to obtain phenolic extracts. Moreover, supercritical fluid extraction (SFE) is used to extract phenolics utilizing CO2 as supercritical fluid alone or with ethanol as an entrainer to modify polarity and to enhance the yield of extracted phenolics [14,18,19,20,21].
Although a variety of techniques and analytical protocols are being applied in different laboratories for extraction, identification, and quantification of phenolics from individual aromatic plants, there is a need for a validated method to be used, according to internationally agreed standards. This method will not only be applied to identify individual compounds, but also to quantify a great number of phenolic constituents present in solid residues remaining after the essential oil distillation. On the other hand, a comprehensive profiling of the residual biomass that remains after the production of some important essential oils is still missing, due to their complex nature, the variability of cultivars or the chemical constitution of aromatic plants, the origin of plant material, etc., as well as the unavailability of commercial standards for proper identification and validation of these phenolic compounds. This work can contribute to the development of an alternative valorization scheme for these residual biomasses, in the content of circular economy to effectively address the problems of their disposal in an economically viable and environmentally sustainable manner. The potential exploitation of bioactive compounds, present in distillation residuals, by extraction of phytochemicals and further conversion into value added products, could find many applications in the food, pharmaceutical and cosmetic industries.
Thus, the main aim of the present study was to develop and validate an LC-MS method that will help to identify and quantify a total of 48 phenolic compounds recovered from solid residues after the extraction of essential oils of six plants of the Lamiaceae family. In this context, the objective was to establish and validate a simple method for analysis of phenolics at ng/mL levels and to apply this to real samples. The use of the MS detector permitted higher accuracy and confidence in the identification of analytes. Moreover, this study presents the application of the developed method for quantification of phenolic compounds in solid waste materials obtained from essential oil production of six different, commercially important aromatic plants of the Lamiaceae family (rosemary, sage, oregano, satureja, spearmint, and lemon balm). Since phenolics are linked with the antioxidant activity of plant extracts, the antioxidant potential of the obtained extracts was evaluated by three separate assays (DPPH, ABTS and FRAP) and related with the amount of phenolics determined by LC-MS and spectroscopic methods (Folin-Ciocalteu’s and aluminum complexation methods).

2. Materials and Methods

2.1. Chemicals and Reagents

Analytical standards of caffeic acid (CA), syringic acid (SRA), p-coumaric acid (pCA), ferulic acid (FA), sinapic acid (SA), 4-hydroxybenzoic acid (4HBA), salicylic acid (SLA), myricetin (MYR), quercetin (QUE), naringenin (NAR), chrysin (CRY), and verbascoside (VER) were obtained from Sigma-Aldrich (Steinheim, Germany). Quinic acid (QA), rosmarinic acid (RMA), neochlorogenic acid (nCLA), chlorogenic acid (CLA), cryptochlorogenic acid (cCLA), eriodictyol (ERY), apigenin-7-O-glucoside (APIGLU), galangin (GAL), rutin (RUT), apigenin (API), kaempferol (KAE), catechin (CAT), epicatechin (EPI), querce-tin-3-O-glucopyranoside (QUEGLU), hyperoside (HYP), epigallocatechin (EGCAT), and luteolin-7-O-glucoside (LUTGLU) were purchased from Extrasynthese (Genay Cedex, France).
Luteolin-7-O-rutinoside (LUTRUT), vicenin-2 (VIC), gallocatechin (GCAT), 1-caffeoylquinic acid (1-CQA), 3,5-dicaffeoylquinic acid (3,5-DCQA), 3,4-dicaffeoylquinic acid (3,4-DCQA), 4,5-dicaffeoylquinic acid (4,5-DCQA), isorhamnetin-3-rutinoside (ISRUT), isorhamnetin-3-O-d-glucoside (ISGLU), dihydrokaempferol (DHKAE), carnosol (CARO), and carnosic acid (CARA) were obtained from Carbosynth (Berkshire, United Kingdom). Vanillic acid (VA) was from Fluka (Buchs, Germany), naringin (NARI), and gentisic acid (GNA) were from Supelco (Bellefonte, PA, USA), whereas protocatechuic acid (PRCA), gallic acid (GA), and luteolin (LUT) were purchased from Alfa Aesar (Karlsruhe, German). Hesperidin (HESP) and trans-cinnamic acid (CNA) were obtained from TCI (Zwijndrecht, Belgium). Formic acid, methanol, acetonitrile and water of LC-MS grade were purchased from Sigma-Aldrich (Steinheim, Germany).

2.2. Standard Solutions

The standard stock solutions (1 mg/mL) of the phenolic compounds were prepared using methanol as a solvent and stored at −20 °C. Aliquots of each stock solution were mixed in order to prepare standard mixtures at concentration level of 100 μg/mL and stored at −20 °C. Mixed working solutions of phenolics were prepared freshly in methanol as a dilution series at approximate concentration of 0.01, 0.05, 0.1, 1, 2, 4, 5, 10 and 20 μg/mL or 25, 50, 75, 100, 200 μg/mL for carnosol and carnosic acid, and each contained 1 μg/mL of salicylic acid as internal standard (IS).

2.3. Plant Material

Aerial parts of six plant species belonging to the Lamiaceae family, i.e., Greek oregano (Origanum vulgare ssp. Hirtum L.), rosemary (Rosmarinus officinalis L.), sage (Salvia fruticosa Mill), satureja (Satureja thymbra L.), lemon balm (Melissa officinalis L.), and spearmint (Mentha spicata), were collected from cultivated accessions of Hellenic Agricultural Organization—Demeter, Institute of Plant Breeding and Genetic Resources (Thessaloniki, Greece). Based on the nature of the specific plants’ tissue, and the commonly applied essential oil distillation protocol, air-dried plant parts of oregano, rosemary, and sage, and fresh lemon balm and spearmint were subjected to steam distillation in a pilot scale essential oil distillation apparatus, i.e., ~2.5 Kg of each plant material was loaded in distillation still and the duration of distillation was approximately 2 h. The wet solid residue of each plant was collected after the steam distillation and was then sun-dried for 48 h. The dried material (~10% moisture content) was ground to pass through a 0.5 mm sieve in a laboratory mill (Retsch, Model ZM1000, Haan, Germany) and stored at 4 °C until further analysis.

2.4. Extraction Procedure

Samples of dried and ground solid residues samples (0.05 g) were extracted with 10 mL 70% methanol for 15 min at 30 °C using an ultrasonic bath (frequency 37 kHz, model FB 15051, Thermo Fisher Scientific Inc., Loughborough, England). The extract was then centrifuged at 10,000× g for 10 min at 4 °C and the extraction was repeated one more time. The clear supernatants were mixed, filtered through membrane filter with porosity of 0.45 µm, diluted with the standard solution of IS and either subjected directly to LC–MS analysis or stored at –20 °C until analysis.

2.5. LC-MS Analysis

Separation and detection of different phenolics present in the aforementioned extracts was performed by a Shimadzu Nexera HPLC system (Kyoto, Japan), which consists of two LC-30AD pumps, DGU-20A5 degasser, CTO-20AC column oven, SIL-30AC auto injector, SPD-M40 diode array detector (DAD) and a triple quadrupole mass spectrometer (model LCMS-2020), which was operated with an electrospray ionization (ESI) interface.
Each sample was eluted through a Poroshell 120 EC-C18 column (4.6 × 150 mm, 4 μm) with a column temperature of 35 °C and a flow rate of 0.5 mL/min. The injection volume was 10 μL and the mobile phase consisted of (solvent A) aqueous formic acid (0.1%, v/v) and (solvent B) acetonitrile. The adopted gradient program was as follows: 0–5 min, 15–25% B; 5–10 min, 25–35% B; 10–28 min, 35–60% B; 28–28.01 min, 60–15% B; and an isocratic elution until 35 min. The DAD acquisition ranged from 190 to 400 nm in steps of 1.2 nm. The mass spectrometer was equipped with an ESI source recorded on a negative ionization mode with +4.5 kV and 20 V interface and curved desolvation line (CDL) voltages, respectively. High-purity nitrogen (N2) was used as the nebulizing gas at a flow rate of 1.5 L/min and nitrogen (N2) was used as drying gas at a flow rate of 15 L/min. The block heater temperature and CDL temperature were maintained at 200 °C and 250 °C, respectively. Mass acquisitions were performed in full scan mode (100–1000 m/z) and selective ion monitoring mode (SIM). Data acquisition and processing was carried out using Lab Solutions LC-MS software (Shimadzu, Kyoto, Japan).
Samples were subjected to MS scanning for compound identification. The main phenolic compounds of samples were identified by comparing their retention time, UV profile and mass spectra of unknown peaks with those of authentic standards or with literature data. The majority of the phenolics detected were quantified using the calibration curves of corresponding standard solutions. When standards were unavailable, compounds with similar structure were used instead to perform quantification of the phenolic compounds. Specifically, lithospermic acid isomers, as well as sulphated RMA (rosmarinic acid), were quantified as RMA equivalents, whereas gallocatechin (GCAT) isomer and medioresinol were reported as GCAT equivalents.

2.6. Method Validation

The LC-MS method was validated in terms of linearity, limit of detection (LOD) and quantification (LOQ), accuracy, precision and recovery, according to the guidelines of the International Conference on Harmonization [22]. Linearity was assessed using internal standard calibration curves with six concentration levels for each analyte, and each concentration level was assayed in triplicate. Calibration curves were obtained by dividing the chromatographic peak area of the analyte by the corresponding peak area of the internal standard (1 μg/mL). Linear regression analysis was used to determine the slope, intercept and the correlation coefficient of each calibration line. The calculations for limit of detection (LOD) and limit of quantification (LOQ) were based on the standard deviation (SD) of y-intercepts of regression analysis (r) and the slope (S), using the equations LOD = 3.3 r/S, LOQ = 10 r/S, respectively, where r is SD of the intercept and S is the slope.
The precision and accuracy were determined by using three replicates of mixed standard solution at three levels on the same day (intra-day) and between 4 different days (inter-day) and finally assessed using the calibration curve. The precision of intra-day and inter-day were expressed as RSD (relative standard deviation) and accuracy was evaluated by comparing the calculated concentration with the standard concentration. The RSD values should not be more than 15% and accuracy should be in the range of 85% to 115%.
In addition, to evaluate the recovery values, known amounts of the analytes were added to the oregano, rosemary, and a mixture sample consisting of equivalent quantities of the six samples tested (oregano, rosemary, sage, lemon balm, satureja, and spearmint), using a mixed standard solution at high, medium and low concentration levels for each phenolic compound, according to their calibration curves. The recovery was calculated as the difference between the concentrations of analytes measured for spiked (Cs) and blank sample (Cb) divided by the theoretical spiked concentration (Ct) of the sample, and multiplied by 100, where Cs and Cb were calculated, according to the calibration curves [Recovery (%) = (Cs − Cb)/Ct × 100].

2.7. Determination of Total Phenolic and Flavonoid Content

Total phenolic contents (TPC) were analyzed with the Folin-Ciocalteu’s phenol reagent method, using gallic acid as the standard as reported in Skendi et al. [1]. The results were expressed as milligrams of gallic acid equivalents per g sample on a dry weight basis (mg GAE/g dw). The total flavonoid content (TFC) was determined by the aluminum complexation method as explained in Skendi et al. [23]. The results were expressed as milligrams of catechin equivalents per g of sample on a dry weight basis (mg CATE/g dw). Each determination was performed at least in triplicate.

2.8. Determination of Antioxidant Activity

The antioxidant activity of the extracts against 2,2-diphenyl-1-picrylhydrazyl (DPPH) radical, 2′-azino-bis-3-ethylbenzthiazoline-6-sulphonic acid (ABTS) reagent and FRAP (Ferric Reducing Antioxidant Power) solution was measured as described by Irakli et al. [24]. Antioxidant activity (DPPH, ABTS and FRAP tests) was expressed as mg Trolox ((S)-(-)-6-hydroxy-2,5,7,8-tetramethylchroman-2-carboxylic acid) equivalents per g of sample on a dry weight basis (mg TE/g dw). Measurements were performed at least in triplicate.

2.9. Statistical Analysis

The values presented in tables or figures refer to mean ± standard deviations of three parallel measurements. One-way analysis of variance (ANOVA) was used to test for differences among the means for different extracts, according to the Duncan’s multiple range test. Possible correlations between different groups of phenolics as measured with LC-MS and spectrophotometric methods and antioxidant activity were evaluated by Pearson’s and two-tailed significance coefficients. Data were tested using SPSS Statistics software version 19 (IBM SPSS Inc., Chicago, IL, USA); differences at p ≤ 0.05 were considered significant.

3. Results and Discussion

3.1. Method Validation Parameters

Extraction and purification of plant phytochemicals are considered crucial for the analysis of samples derived from complex matrices, especially when the aim is the simultaneous detection and quantification of multiple compounds. Factors such as ultrasound frequency, type of organic solvent, solvent concentration, extraction time, extraction temperature and solid-to-liquid ratio were considered in the present study in order to optimize the extraction procedure. The developed extraction procedure for LC-MS analysis of 48 phenolic compounds from the solid residue of the six aromatic plants after the essential oil distillation involved the use of ultrasonic extraction at 37 kHz with 70% aqueous methanol for 15 min and solid–liquid ratio of 1:250, as it was shown to be more efficient in analytes recoveries and thus was chosen throughout the experimentation.
To optimize the chromatographic analysis, the LC-MS conditions were initially established. First, two mobile phases consisting of acetonitrile, methanol and water, as acidified with various acids (formic acid and acetic acid), were tested. A combination of acetonitrile and 0.1% (v/v) aqueous formic acid was chosen, since acetonitrile gave better peak definition and resolutions. The amount of 0.1% (v/v) aqueous formic acid is also suggested by other authors [25] for compound detection in the negative ion mode, since it increases the ESI efficiency.
The developed LC-MS analytical method was efficient for the identification and quantification of 48 phenolic compounds. The method was validated according to International Conference on Harmonization (ICH) guidelines [22]. Thus, the linearity, the limit of detection (LOD), the limit of quantification (LOQ), intra- and inter-day precisions and accuracy, as well as the recovery were investigated.
Linearity represented by coefficients of correlation (R2) listed along with the calibration curve equations, the linear ranges, the LOD, and the LOQ are shown in Table 1. Within the investigated concentration ranges, all compounds showed good linearity with R2 values ranging between 0.9921 (VER) and 0.9999 (CLA and 3,4-DCQA). On the other hand, the LOD values ranged from 6.1 (ERY) to 718.3 ng/mL (CARA), while the LOQ values ranged from 18.5 to 2176.7 ng/mL for the studied 48 analytes. This fact reflects the high sensitivity of the developed method. Values of correlation coefficients were higher, whereas the LODs and LOQs observed in the present study were lower than those reported in another study, where 27 phenolic compounds were taken into consideration for LC-MS/MS detection and quantification in methanolic extracts of three Salvia L. species [26]. The linearity values observed in the study of Tohma et al. [26] varied from 0.9901 (for GA) to 0.9995 (for vanillin and quercetin), whereas LODs and LOQs, ranged between 0.05 and 25.8 and from 0.17 to 74.5 µg/mL, respectively.
The intra- and inter-day variability for all the studied analytes was also measured to assess the precision and accuracy of the developed method. For the precision, the percent relative standard deviations (RSD %) were within the range of 1.02–6.63% and 2.48–15.00% for intra and inter-day, respectively. On the other hand, the intra-day and inter-day accuracy of various phenolic compounds varied from 80.3 to 105.7% and 89.6 to 108.1%, respectively. These results clearly indicate that high reproducibility and accuracy can be achieved by employing the aforementioned analytical method.
In Table 2, the recovery of the standard phenolic compounds added at three different matrices is shown, i.e., oregano, rosemary, and a mixed sample that consists of an equal mixture of each of the solid material remaining after the distillation of the six plants under investigation. The data revealed that recovery values were satisfactorily varying within the same range (70.0–115.0%). The lowest recovery was noticed for LUTGLU in the oregano matrix and VA for rosemary and mixed mixture. The recovery data were found to vary from 48.9–97.2% in the study of Bajkacz et al. [27], who determined 30 major active polyphenols in different plants and plant parts (lucerne, gordenrod, phacelia, buckwheat, licorice, lavender). Moreover, Baranowska and Bajkacz [28] reported recoveries of higher than 64.6% for flavonoids in dietary supplements. In general, the results obtained in the present study revealed that the developed LC-MS method was adequately precise, accurate, and reliable for the simultaneous quantitative analysis of 48 analytes present in six different aromatic plants (oregano, rosemary, sage, lemon balm, satureja, and spearmint).

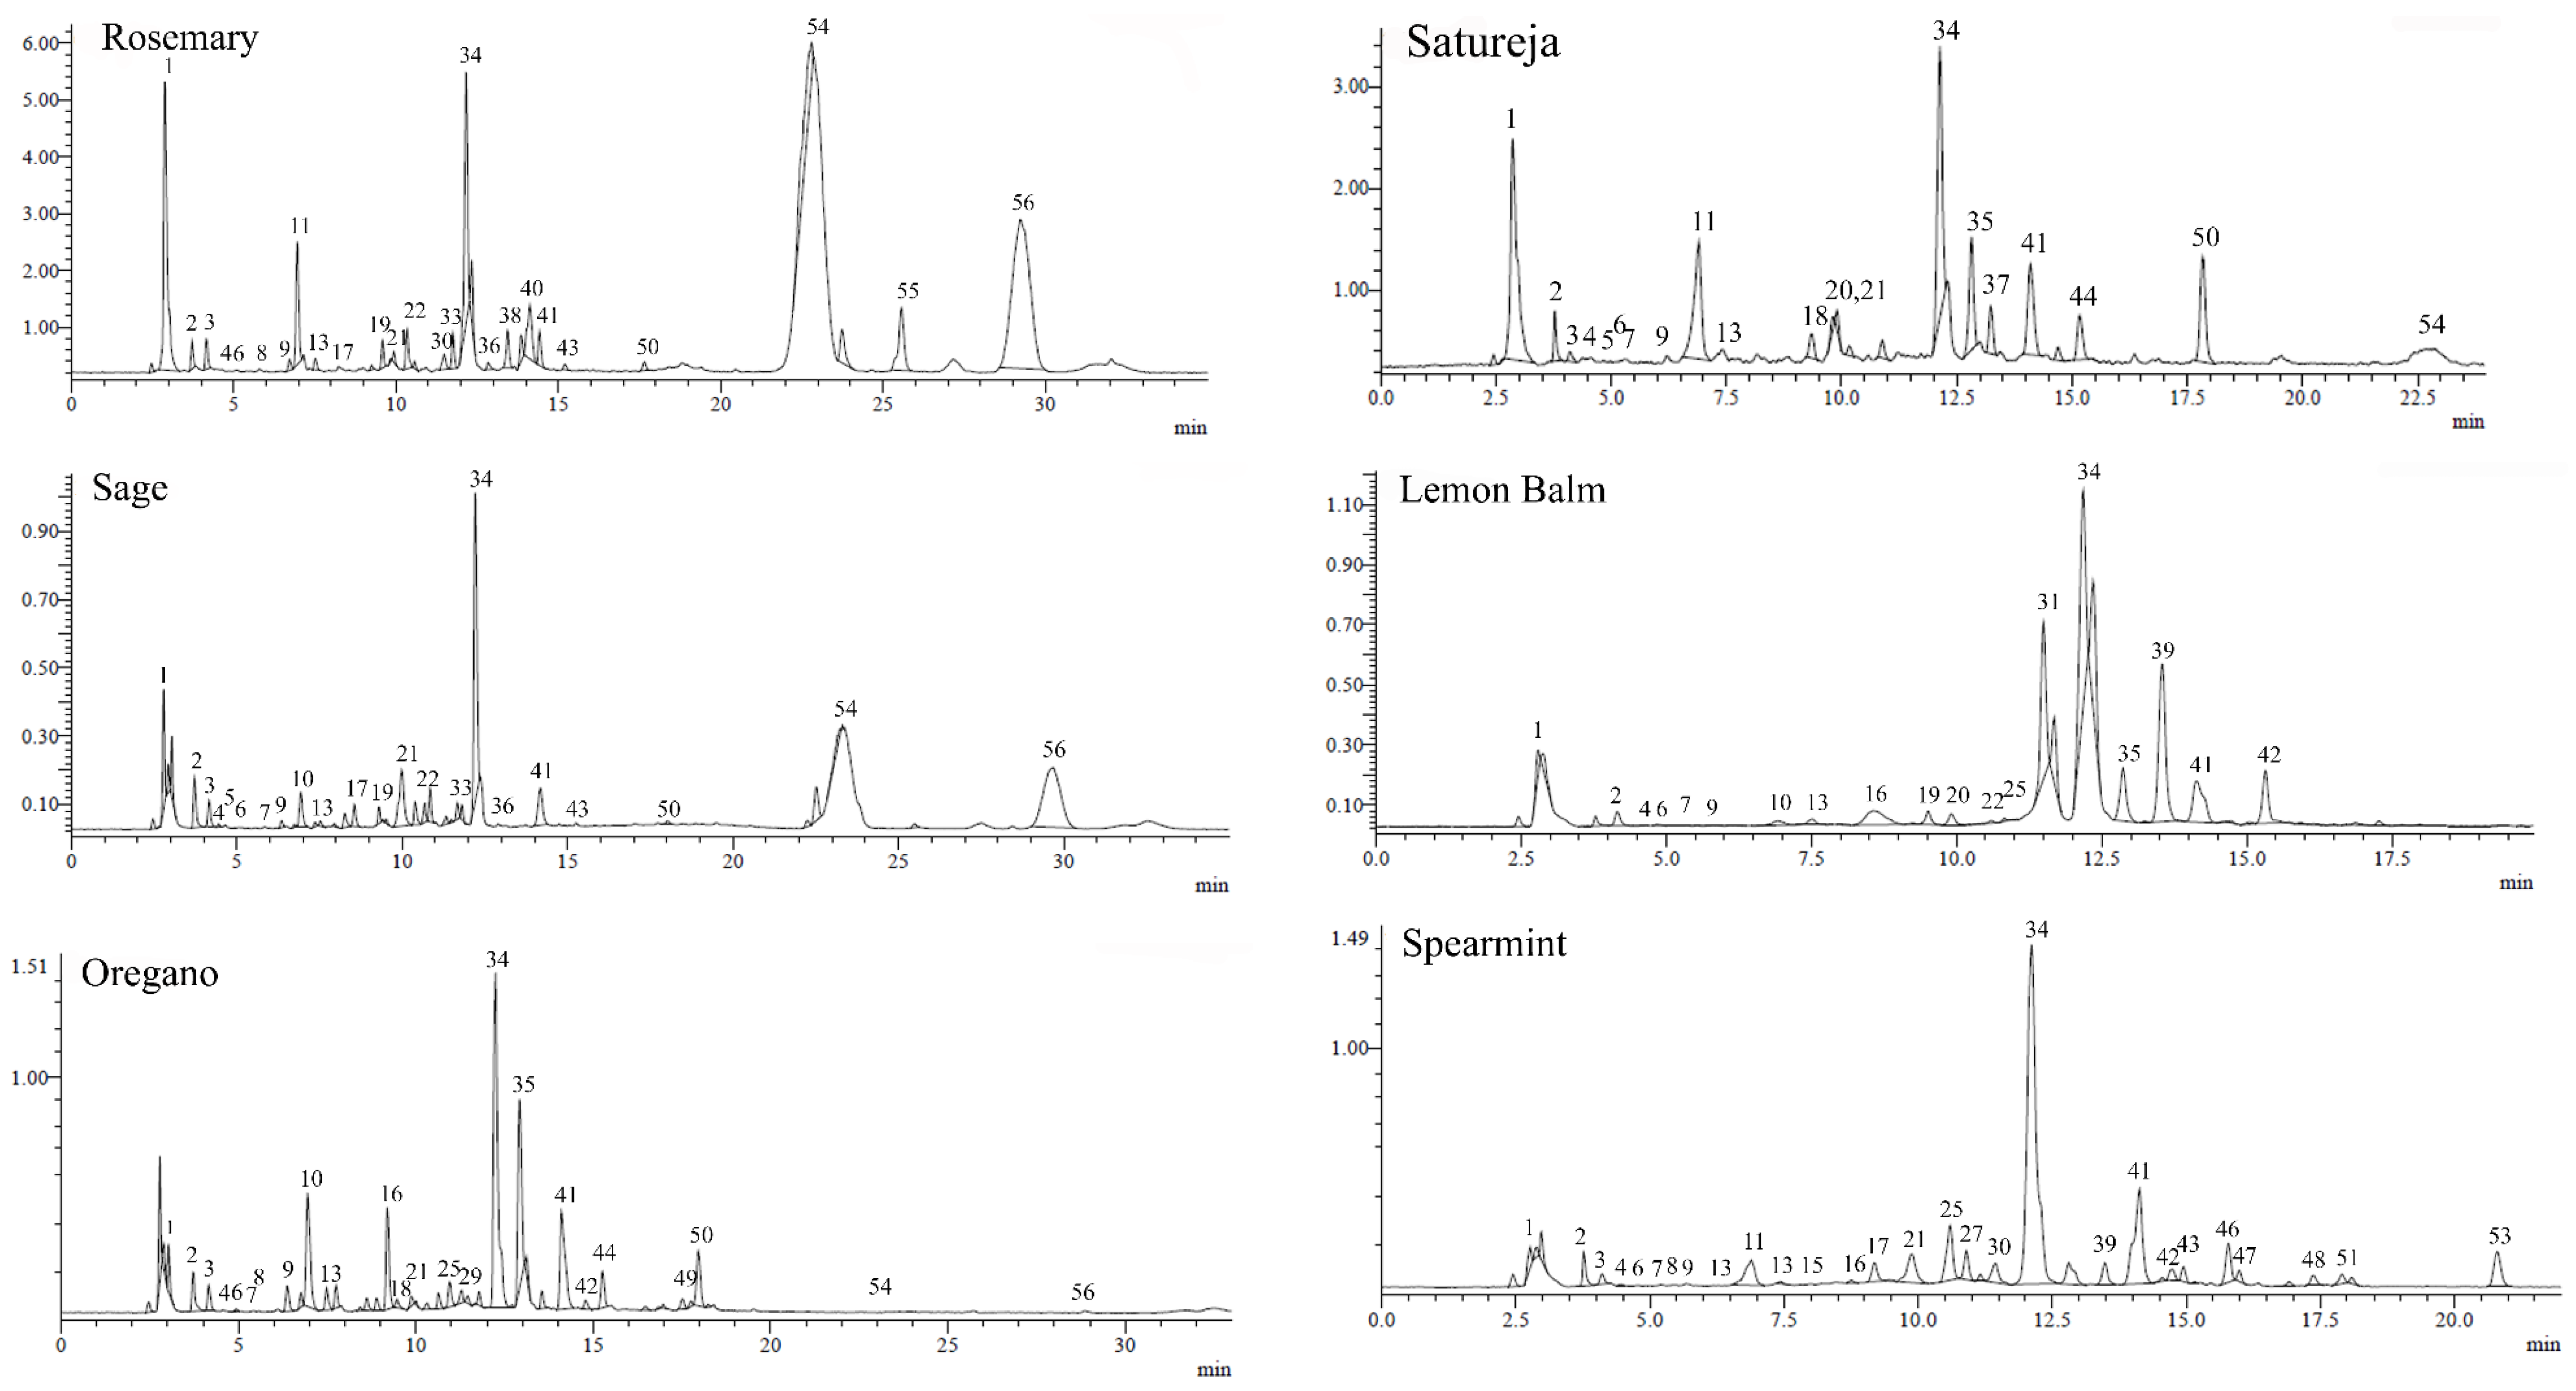
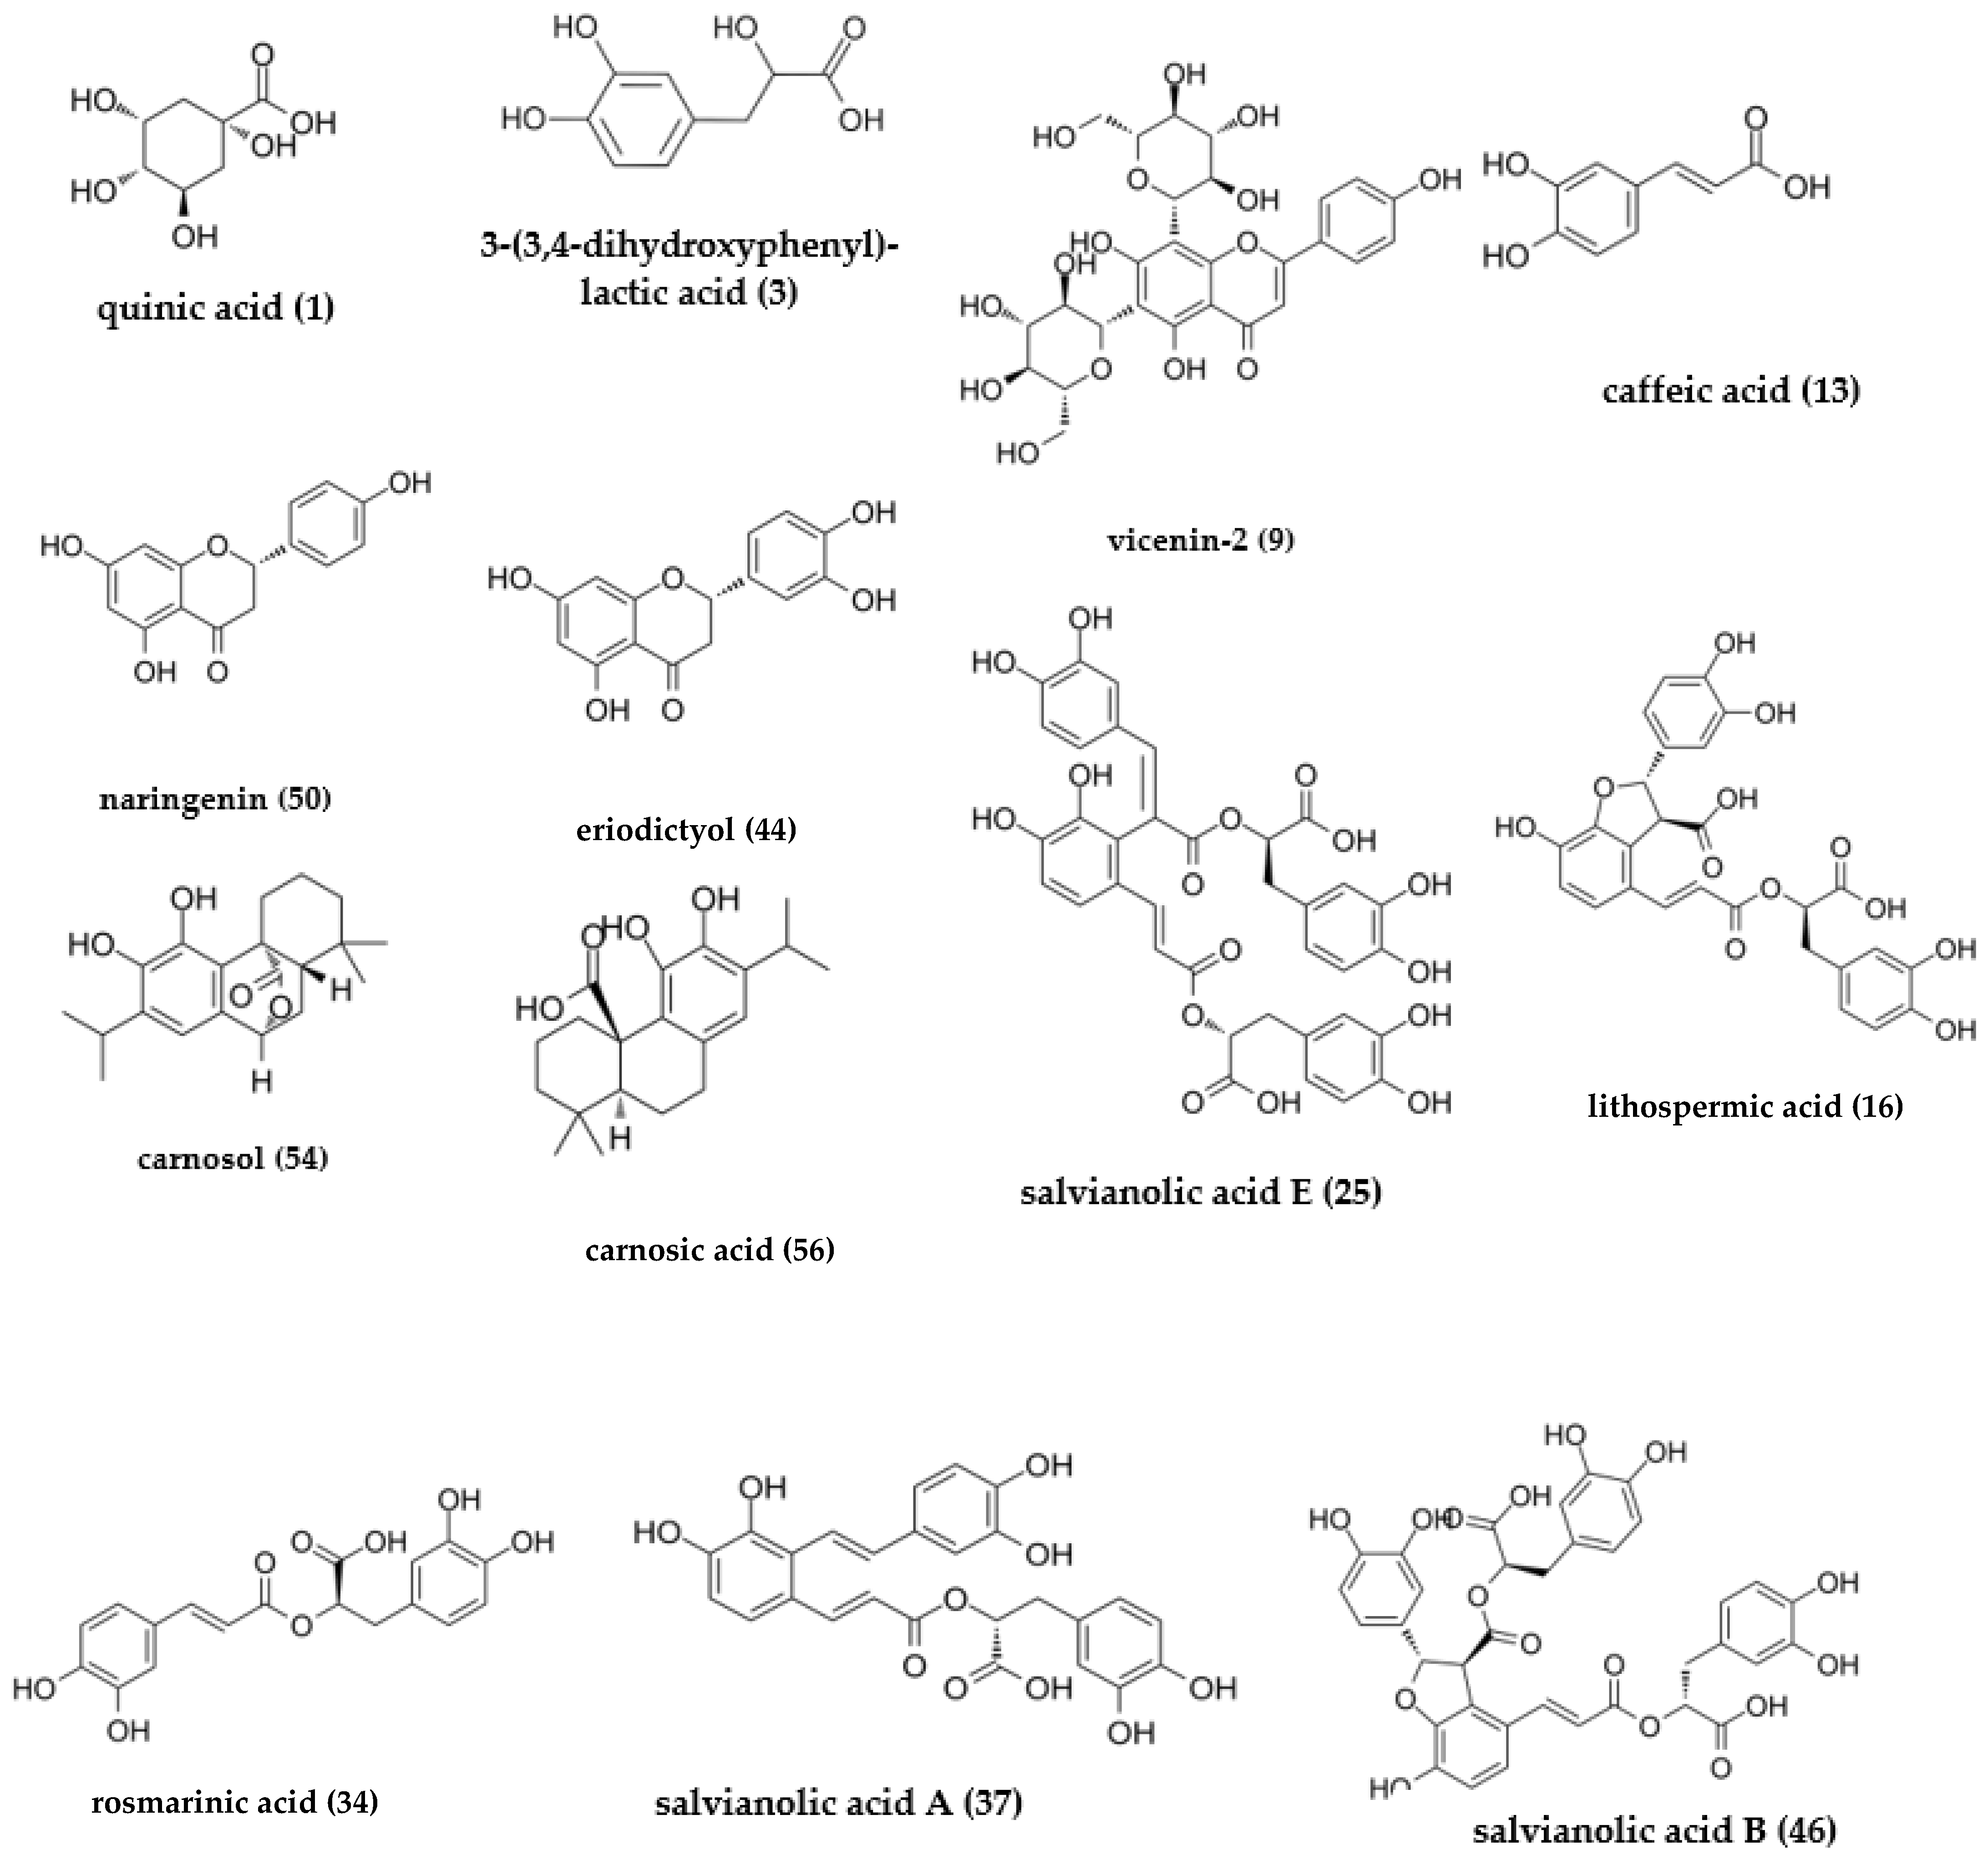
3.2. Identification Analysis

Total ion chromatograms (TIC) of oregano, rosemary, sage, satureja, lemon balm, and spearmint extracts are shown in Figure 1, while the major peaks identified by LC-MS analysis are presented in Table 3. As polyphenols contain one or more hydroxyl, carboxylic acid groups, or both, MS data were acquired in the negative ionization mode. Each assignment was made after comparing retention time, UV and MS spectra data of detected compounds with reference standards or based on MS data reported in the literature and relevant databases. LC-MS analysis of the six plant extracts allowed us to identify a total of 52 different phenolic compounds (33 in rosemary, 30 in oregano, 29 in sage, 27 in satureja, 34 in lemon balm, and 35 in spearmint extracts). A total of31 of the 52 phenolic compounds were identified by comparison with reference standards. For the remaining 21 compounds, for which no standards were available, identification was based on mass measurements of the pseudomolecular [M–H] ions, the UV spectra data and by comparison with available data from the literature. Nevertheless, three compounds were not identified. Most of the compounds identified in the extracts of the six plant distillation residues were derivatives of phenolic acids, the rest were flavonoids, while two were classified as phenolic diterpenes. The chemical structures of the most abundant phenolic derivatives are presented in Figure 2. Fourteen detected compounds, such as QA, citric acid, PRCA, CLA, VIC, 4HBA, CA, APIGLU, RMA, LUT, ERY, QUE, API and NAR were found to occur in all six extracts examined. On the other hand, the phenolic diterpene ‘CARO’ ([M − H] at m/z 329), was detected in rosemary, oregano, sage, and satureja, whereas CARA ([M − H] at m/z 331), was found in rosemary, oregano, and sage.
Peak 2 (m/z 191, UVmax 279 nm) was characterized as citric acid, according to MS data of previous studies for similar samples [29]. Peak 3 (m/z 197, UVmax 280 nm) was tentatively identified [30,31] as dihydroxyphenyllactic acid (Danshensu) and was present in five of the six extracts (except lemon balm). This compound however, has been detected in lemon balm infusions [30] and dry spearmint as well [29,31]. Peaks 10 and 11 with precursor ion at m/z 387 and 305, respectively, in the negative mode, were tentatively characterized as medioresinol and gallocatechin isomer. Compound 10 was present in oregano and lemon balm, whereas compound 11 was detected in all extracts except oregano and sage. Medioresinol was also reported by other authors in spearmint [29] and in rosemary [32]. Peaks 16, 35, 39 and 42 at m/z 537 with characteristic fragment ion at m/z = 493 implied the presence of lithospermic acid isomers, according to other studies [30,33].
The peaks 38 and 40 with [M-H] at m/z 503 were characterized as caffeoyl-hexosyl-hexoses, according to Celano et al. [34]. Peaks 25, 29, 46 and 47 with m/z 717 and peaks 37, 51 with m/z 493 were named isomers of salvianolic acid (E, B and A, respectively) [30,31,33,34,35,36]. Peaks 31, 33 and 53 with a pseudomolecular ion [M − H] at m/z 439, 461, and 359, respectively, are tentatively identified as sulphated rosmarinic acid [30], hispidulin-7-O-glucoside [37], and cyclolariciresinol [31], respectively. Peak 18 occurred in oregano and satureja, peak 48 was present in spearmint and peak 55 in rosemary extracts; for these compounds, identification was not feasible.
Table 3. List of tentative major phenolic compounds identified by LC-MS in negative mode in rosemary (R), oregano (O), sage (S), satureja (T), lemon balm (L), and spearmint (M) distillation solid residues’ extracts, using standards or literature data as reference.
PeakRt (min)UVλmax (nm)[Μ − H]m/z Main FragmentsTentativeReferenceExtract
12.85330191163quinic acidstandardR, O, S, T, L, M
23.72279191147citric acid[31]R, O, S, T, L, M
34.16280197179dihydroxyphenyllactic acid[30,31]R, O, S, T, M
44.33327353191, 179 neochlorogenic acidstandardR, O, S, L, M
54.75270305191epigallocatechinstandardS, T
65.03260, 290153-protocatechuic acidstandardR, O, S, T, L, M
75.42330353 191, 179chlorogenic acidstandardR, O, S, T, L, M
85.77330353191, 179cryptochlorogenic acidstandardR, O, L, M
96.34270, 335593179vicenin-2standardR, O, S, T, L, M
106.91285387305medioresinol[38]O, L
116.96283305283gallocatechin isomer[36]R, T, L, M
127.08260137-4-hydroxybenzoic acidstandardR, O, S, T, L, M
137.49322179153caffeic acidstandardR, O, S, T, L, M
147.77260167-vanillic acidstandardR, O, S, T, L
157.80274197-syringic acidstandardL, M
169.20253, 344537493lithospermic acid [30]O, L, M
179.23260, 360593287luteolin-7-O-rutinosidestandardR, S, T, M
189.35266, 337431329n.i. O, T
199.58274597493, 345, 179yunnaneic acid F[30]R, S, L
209.90253, 366447285, 329luteolin-7-O-glucosidestandardR, S, T, L
219.94254, 346461285luteolin-7-O-glucuronide[2,30,35,37,39]R, O, S, T, M
2210.33272,345477289isorhamnetin-3-O-D-glucosidestandardR, S, L
2310.35280623-verbascosidestandardR, O, S, T, L
2410.41327515353, 1793,4-dicaffeoylquinic acidstandardL, M
2510.64283,345717519salvianolic acid E[30,34,35]O, L, M
2610.65323193163ferulic acidstandardL, M
2710.90327515353, 1793,5-dicaffeoylquinic acidstandardM
2811.39260, 360431359, 193apigenin-7-O-glucosidestandardR, O, S, T, L, M
2911.49289, 330717431salvianolic acid E isomer[34,36]O, M
3011.50283609301hesperidinstandardR, M
3111.51326439285, 403, 345 sulphated rosmarinic acid[30]L
3211.60327515353, 1794,5-dicaffeoylquinic acidstandardL, M
3311.76332461283hispidulin-7-O-glucoside[37]R, S
3412.15330359197rosmarinic acidstandardR, O, S, T, L, M
3512.72321537493lithospermic acid isomer[33]O, T, L, M
3613.00291287169dihydrokaempferolstandardR, O, S, T
3713.24286, 329493359salvianolic acid A[30,33]L
3813.44269, 337503285caffeoyl-hexosyl-hexose[34]R
3913.53293, 326537493, 359lithospermic acid isomer [30]L
4013.86269, 337503285caffeoyl-hexosyl-hexose[34]R
4114.12240137-salicylic acid (IS)standardIS
4214.79287, 325537493, 359lithospermic acid isomer [33]O, T, M
4315.15282285-luteolinstandardR, O, S, T, L, M
4415.20287287269, 169eriodictyolstandardR, O, S, T, L, M
4515.38256, 370301285quercetinstandardR, O, S, T, L, M
4615.79286, 322717519salvianolic acid B [14]M
4715.99286, 322717519salvianolic acid B isomer[31]M
4817.37294, 333329283n.i. M
4917.63268, 337269191apigeninstandardR, O, S, T, L, M
5017.83288271253, 193, 153naringeninstandardR, O, S, T, L, M
5117.91274, 328493271salvianolic acid A isomer[31]M
5218.26264, 360285169kaempferolstandardR, O, S, T, L
5320.80278, 346359329cyclolariciresinol[31]M
5422.80280329285carnosolstandardR, O, S, T
5525.57266, 340283269n.i. R
5629.07280331287carnosic acidstandardR, O, S
n.i.—not identified; IS—internal standard.

3.3. Quantitative Analysis

Validation was performed by applying the developed LC-MS method for the simultaneous determination of 48 targeted analytes including 20 phenolic acids, 26 flavonoids, and 2 phenolic diterpenes in the methanolic extracts of plant residues from six different aromatic plants of the Lamiaceae family obtained after removal of the essential oils as reported in Section 2.3 and Section 2.4, respectively.
The results from quantitative measurements are presented in Table 4. The content in phenolic compounds in the six samples decreased in the following range: spearmint > oregano > lemon balm = rosemary > sage > satureja. Not all the 48 compounds were detected and quantified in the extracts of the six distillation solid residues of the aromatic plants, whereas the concentrations of the analytes studied varied among the solid residues of the six plants. In general, the percentage of phenolic acids in the total content of phenolic compounds detected was higher than that of flavonoids and phenolic diterpenes, except for the rosemary solid residues, where the content of phenolic diterpenes surpassed that of phenolic acids. Among the studied extracts, the highest amount of phenolic acids appeared in spearmint followed by lemon balm, oregano, sage, and finally satureja and rosemary, between which no statistical difference was found. From the group of total diterpenes, in spearmint and lemon balm, both CARO and CARA are missing, whereas CARA was not detected in Satureja. On the other hand, rosemary had the highest amount of phenolic diterpenes (6175.2 ± 11.7 mg/100 g) among the plant solid residues studied. The results showed that satureja contains the highest amount of total flavonoids (3112.9 ± 90.9 mg/100 g) among all six samples examined, whereas sage has the lowest (747.6 ± 13.6 mg/100 g).
Among the derivatives of phenolic acids, RMA was the dominant compound in the six samples, ranging from 2469.6 mg/100 g in rosemary to 9660.0 mg/100 g in spearmint, with the latter containing, in addition, a total of 3891.9 mg/100 g of RMA derivatives (Sulphated RMA, LITHI and LITHII). Similarly, oregano, satureja, and lemon balm contained a high amount of RMA derivatives (4033.5, 585.2, and 1415.7 mg/100 g, respectively).
In their study, Celano et al. [34] reported that residual wastewaters obtained after essential oil distillation of rosemary and sage, contained large amounts of RMA (46.8 ± 9.4 mg/100 mL and 135.3 ± 12.3 mg/100 mL, respectively) and other phenolic compounds (mainly caffeic acid derivatives and flavonoid glycosides). The amount of RMA present in the solid extract of the plants after essential oil extraction is dependent on the degree of partial degradation of RMA, due to the high process temperatures applied, as well as the solubilization in distillation water and its subsequent removal with the waste water stream. The same conclusion could be drawn in general for the phenolics, suggesting the importance of applying a multistep biorefining scheme for recovery of these valuable compounds.
The second highest in concentration compound within the group of phenolic acids derivatives, present in all the six plant residues, was QA, showing the highest level in rosemary (1056.4 ± 26.8 mg/100 g) and the lowest in lemon balm (262.0 ± 22.0 mg/100 g). CLA was detected in all samples, but it was not quantified in satureja, whereas the spearmint appeared to have the highest CLA content, followed by oregano, sage, and rosemary. Similarly, spearmint extracts had the greatest contents of nCLA and cCLA, followed by rosemary and oregano, whereas cCLA was not detected in sage, satureja, and lemon balm. Most of the extracts studied were also found to contain CA and 4HBA in significant amounts. On the other hand, FA was present only in spearmint and lemon balm, with the former showing a relatively high amount of 152.5 ± 2.5 mg/100 g.
Total flavonoids content decreased in the following order: satureja > oregano > spearmint > rosemary > lemon balm > sage. Flavonoid compounds detected in the six extracts varied largely in their amount among the extracts. Derivatives of GCAT were the most abundant compounds in all extracts, except for sage, where they were not detected. The GCAT isomer was found in rosemary (2111.9 ± 97.5 mg/100 g), satureja (2805.8 ± 74.2 mg/100 g), and spearmint (2332.8 ± 63.2 mg/100 g), representing 81.2%, 90.1% and 82.2% of the total flavonoids in the respective extracts. On the other hand, medioresinol, the other derivative of GCAT, was the most abundant flavonoid in oregano (1708.4 ± 110.4 mg/100g) and lemon balm (800.0 ± 20.0 mg/100 g) reaching 57.5% and 71.2% of the total flavonoids, respectively. In contrast, sage which contained the lowest amount of total flavonoids among the studied extracts, showed a more even distribution in the amount among different flavonoids. Flavonoid compounds such as VIC (252.0 ± 11.7 mg/100 g), LUTGLU (207.2 ± 3.2 mg/100 g) and LUTRUT (132.6 ± 1.4 mg/100 g) represented 79.2% of the total flavonoid present in the sage extract (33.7%, 27.7% and 17.7%, respectively). LUTRUT was also present in rosemary (199.7 ± 9.3 mg/100 g) and spearmint (284.4 ± 8.4 mg/100 g), whereas LUTGLU was found only in lemon balm (186.6 ± 2.2 mg/100 g). VIC was present in high concentrations in oregano (888.4 ± 24.4 mg/100 g). From the total of 48 phenolics detected by the developed analytical method, none of the following compounds were detected in the six studied extracts: GA, GNA, SRA, pCA, SA, can, EPI, CAT, NARI, MYR, CRY, and GAL.

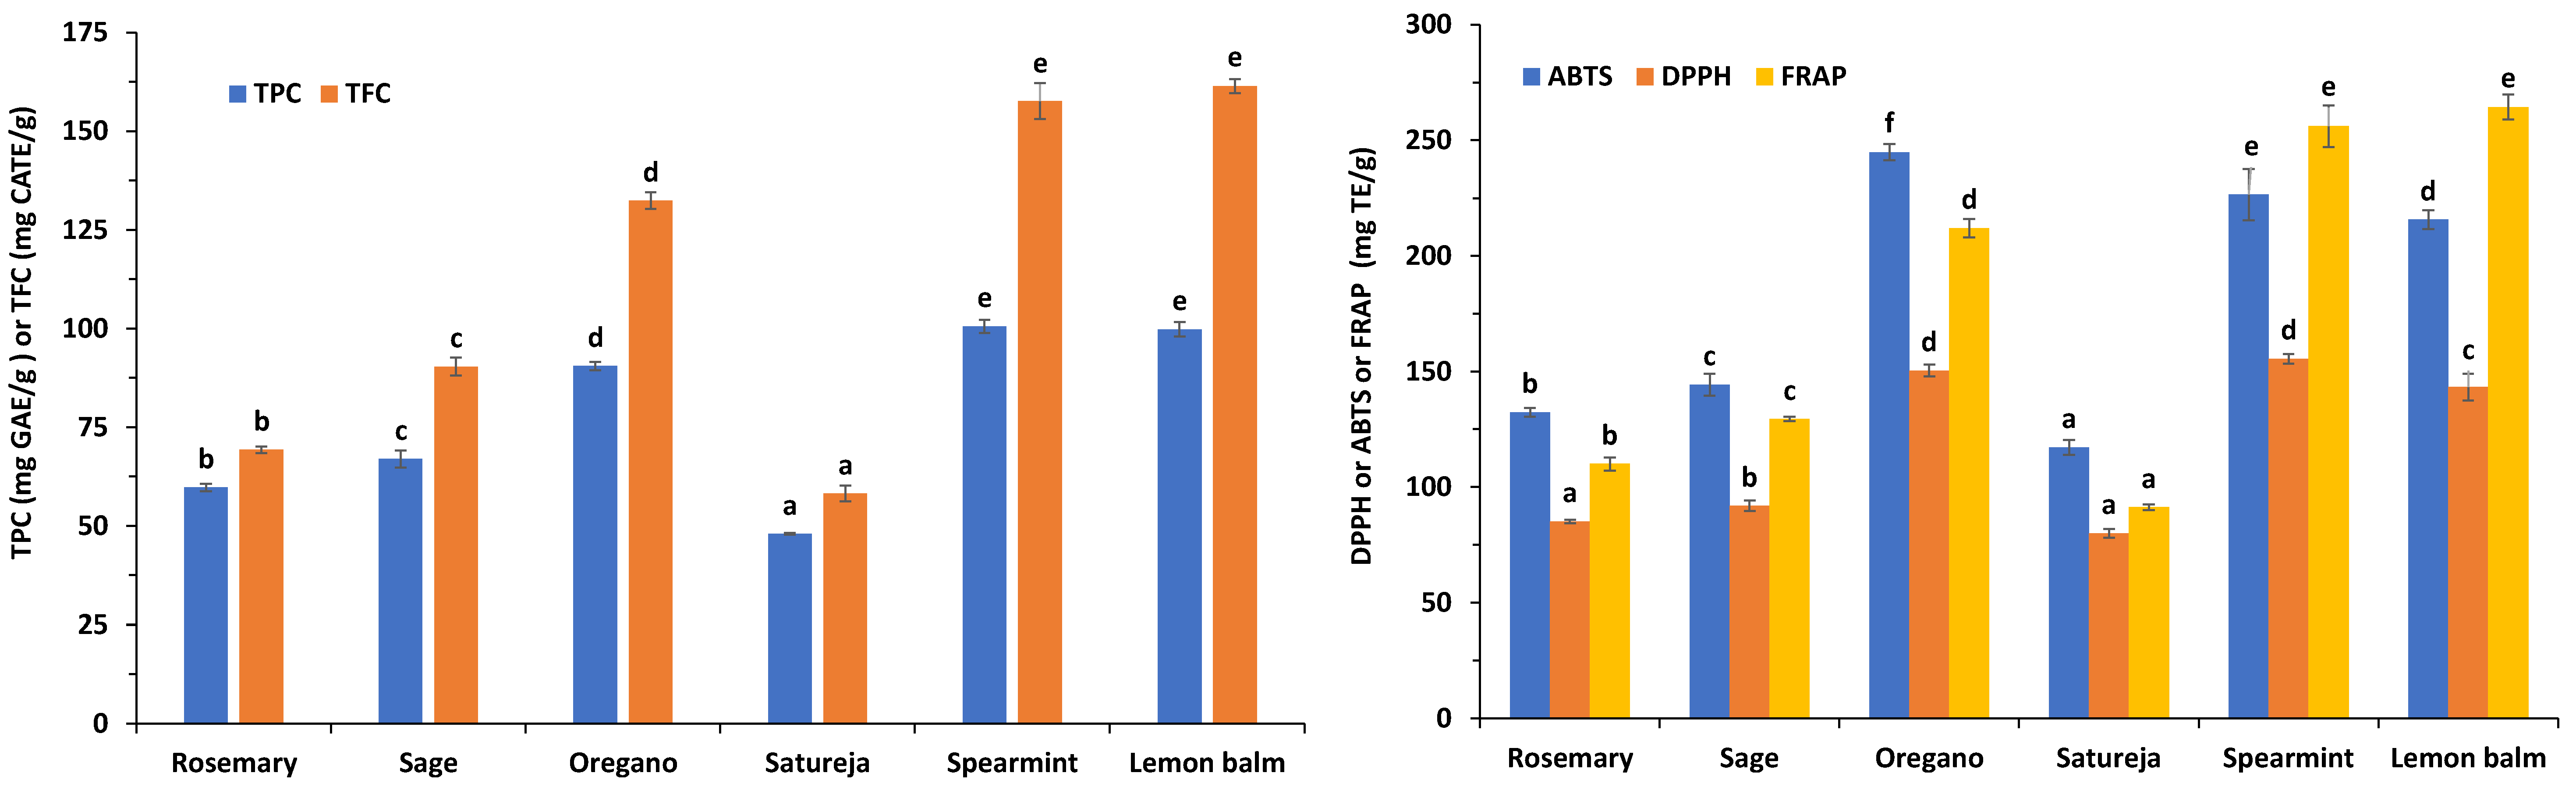
3.4. Phenolic and Flavonoid Content—Antioxidant Activity

The amount of total phenolics content (TPC) as well as total flavonoids content (TFC) in the six extracts was determined spectrophotometrically by the Folin-Ciocalteu’s phenol reagent method and aluminum complexation assay, respectively. Figure 3 reveals that the TPC and TFC values in lemon balm were similar to that of spearmint and decreased significantly in the following order: lemon balm = spearmint > oregano > sage > rosemary > satureja. The TPC and TFC values ranged from 47.91 to 100.53 mg GAE/g and 58.17 to 161.42 mg CATE/g, respectively. TPC values of spearmint (100.53 mg GAE/g), lemon balm (99.76 mg GAE/g), oregano (90.49 mg GAE/g), sage (66.92 mg GAE/g), rosemary (59.74 mg GAE/g), and satureja (47.91 mg GAE/g) recorded in the present study are in agreement with the data available in scientific literature [9,10,33,34]. The same trend was also noted for the TFC values.
Determination of antioxidant potential of plant extracts is of great importance for the estimation of the protective role their components can be play in foods and biological systems. The antioxidant capacities of extracts were evaluated by DPPH, FRAP, and ABTS assays and the results are also presented in Figure 3. It was noted that the hydrogen-donating ability of the spearmint extract to oxidize DPPH was similar to that of oregano, and significantly higher than the other extracts. Specifically, the antioxidant activity of samples, based on the DPPH assay, decreased significantly in the following order: spearmint > oregano > lemon balm > sage > rosemary > satureja. A similar trend was observed for the data derived by the ABTS test. Oregano exhibited the highest hydrogen-donating ability against ABTS+ radical followed by spearmint and lemon balm, sage, rosemary, and satureja. Lemon balm and spearmint showed the highest ability to donate electrons and reduce Fe3+ to Fe2+, thus increasing FRAP values followed by oregano, sage, rosemary, and finally satureja.

3.5. Correlation Analysis

TPC and TFC correlated very well with antioxidant activity of extracts, as determined by the ABTS, DPPH and FRAP assays, showing very high positive correlation coefficients (0.939, 0.961, and 0.984 for TPC, and 0.919, 0.952, and 0.994 for TFC, respectively, at p ≤ 0.01 level of significance (2-tailed)) (Table 5). These correlation values are similar to those previously reported by Skendi et al. [1]. TPC correlated positively (0.795 at p ≤ 0.01, (2-tailed)) with values of total phenolics obtained by LC-MS. In contrast, the TFC does not show a significant correlation with the total flavonoids obtained from LC-MS. Instead, it correlated negatively with diterpenes and positively with total phenolics measured by LC-MS (−0.611 and 0.736, respectively at p ≤ 0.01, (2-tailed)). It was also observed that total phenolics obtained from LC-MS showed a slightly weaker correlation with ABTS, DPPH, and FRAP compared to the total phenolic acids (0.809 vs. 0.925; 0.823 vs. 0.974; 0.745 vs. 0.956 p ≤ 0.01, respectively). In general, the antioxidant assays showed no correlation with total flavonoids obtained by the LC-MS method, whereas the phenolic diterpenes showed significant but much lower negative correlation coefficients (−0.563, −0.633, and −0.629 for ABTS, DPPH, and FRAP, respectively). In our previous study, we have noted no correlation between the antioxidant activity measured by ABTS, DPPH, and FRAP assays and the total phenolics content as determined by HPLC analysis [1]. This could be due to the lower number of analytes quantified (24 vs. 48) with the abovementioned method compared to the present work.
It seems that is mainly the group of phenolic acid derivatives that contributes positively to increase in the antioxidant activity evaluated by the ABTS and DPPH assays. On the other hand, the FRAP assay could be linked with the presence of flavonoids in the dried residues of the aromatic plants of Lamiaceae family, following the essential oil extraction.

4. Conclusions

In the present study, we developed and validated an analytical method for the detection and quantification of 48 phenolic compounds in the dry residues obtained after steam distillation of six common aromatic plants of the Lamiaceae family (oregano, rosemary, sage, satureja, lemon balm, and spearmint). The applied extraction procedure for obtaining the phenolics from the dried solid residuals after steam distillation is simple and efficient, followed by a sensitive and accurate LC-MS method for the qualitative and quantitative determination. In general, a total of 55 different compounds were detected in the extracts of the six essential oils’ solid residues and 52 of these were identified. Application of the method on residues of the aforementioned plants revealed the presence and allowed the quantification a total of 38 compounds, including 17 phenolic acids, 19 flavonoids, and 2 phenolic diterpenes. The total amount of phenolics decreased in the following order: spearmint, oregano, rosemary, lemon balm, sage, satureja. Correlation analysis showed that a higher contents of phenolics indicated higher antioxidant activity. The research findings also suggest that the variation in antioxidant activity of the extracts was mostly due to the presence of phenolic acid derivatives, rather than flavonoids. Among the three assays employed to assess antioxidant activity, the ABTS, DPPH, and FRAP mainly reflect the content of phenolic acid derivatives and total phenolics present in the solid residues, whereas no correlation was noted with total flavonoid content.
Overall, the results of our study disclosed that waste residues of the essential oil industry would be a potential source of valuable polyphenolic compounds with potential applications in several industrial sectors, such as food, cosmetics, and pharmaceuticals, as bioactive ingredients in different formulations. The valorization of distillation wastes, through the recovery of valuable phytochemicals, will assist sustainable development, providing environmental benefits and promoting the bioeconomy.

Author Contributions

Conceptualization, M.I.; methodology, M.I.; validation, M.I. and A.S.; formal analysis, E.B.; investigation, M.I. and A.S.; data curation, M.I. and A.S.; writing—original draft preparation, M.I. and A.S.; writing—review and editing, E.B., P.C. and C.G.B.; visualization, P.C.; supervision, C.G.B.; project administration, M.I. All authors have read and agreed to the published version of the manuscript.

Funding

This research received no external funding.

Institutional Review Board Statement

Not applicable.

Informed Consent Statement

Not applicable.

Data Availability Statement

Data is contained within the article.

Acknowledgments

This research has been co-financed by the European Regional Development Fund of the European Union and Greek national funds through the Operational Program Competitiveness, Entrepreneurship and Innovation, under the call RESEARCH—CREATE—INNOVATE (project code: T2EDK-00946). We are also thankful to Eleni Maloupa for providing the pilot scale essential oil distillation apparatus.

Conflicts of Interest

The authors declare no conflict of interest.

References

  1. Skendi, A.; Irakli, M.; Chatzopoulou, P. Analysis of phenolic compounds in Greek plants of Lamiaceae family by HPLC. J. Appl. Res. Med. Aromat. Plants 2017, 6, 62–69. [Google Scholar] [CrossRef]
  2. Miron, T.L.; Plaza, M.; Bahrim, G.; Ibáñez, E.; Herrero, M. Chemical composition of bioactive pressurized extracts of Romanian aromatic plants. J. Chromatogr. A 2011, 1218, 4918–4927. [Google Scholar] [CrossRef] [Green Version]
  3. Nieto, G. Biological activities of three essential oils of the Lamiaceae family. Medicines 2017, 4, 63. [Google Scholar] [CrossRef] [PubMed] [Green Version]
  4. Skendi, A.; Katsantonis, D.Ν.; Chatzopoulou, P.; Irakli, M.; Papageorgiou, M. Antifungal activity of aromatic plants of the lamiaceae family in bread. Foods 2020, 9, 1642. [Google Scholar] [CrossRef]
  5. Perczak, A.; Gwiazdowska, D.; Marchwińska, K.; Juś, K.; Gwiazdowski, R.; Waśkiewicz, A. Antifungal activity of selected essential oils against Fusarium culmorum and F. graminearum and their secondary metabolites in wheat seeds. Arch. Microbiol. 2019, 201, 1085–1097. [Google Scholar] [CrossRef] [PubMed] [Green Version]
  6. Balasundram, N.; Sundram, K.; Samman, S. Phenolic compounds in plants and agri-industrial by-products: Antioxidant activity, occurrence, and potential uses. Food Chem. 2006, 99, 191–203. [Google Scholar] [CrossRef]
  7. Navarrete, A.; Herrero, M.; Martín, A.; Cocero, M.J.; Ibáñez, E. Valorization of solid wastes from essential oil industry. J. Food Eng. 2011, 104, 196–201. [Google Scholar] [CrossRef]
  8. Méndez-Tovar, I.; Herrero, B.; Pérez-Magariño, S.; Pereira, J.A.; Asensio-S-Manzanera, M.C. By-product of Lavandula latifolia essential oil distillation as source of antioxidants. J. Food Drug Anal. 2015, 23, 225–233. [Google Scholar] [CrossRef] [Green Version]
  9. Gavarić, N.; Kladar, N.; Mišan, A.; Nikolić, A.; Samojlik, I.; Mimica-Dukić, N.; Božin, B. Postdistillation waste material of Thyme (Thymus vulgaris L., Lamiaceae) as a potential source of biologically active compounds. Ind. Crops Prod. 2015, 74, 457–464. [Google Scholar] [CrossRef]
  10. Oreopoulou, A.; Papavassilopoulou, E.; Bardouki, H.; Vamvakias, M.; Bimpilas, A.; Oreopoulou, V. Antioxidant recovery from hydrodistillation residues of selected Lamiaceae species by alkaline extraction. J. Appl. Res. Med. Aromat. Plants 2018, 8, 83–89. [Google Scholar] [CrossRef]
  11. Oreopoulou, A.; Choulitoudi, E.; Tsimogiannis, D.; Oreopoulou, V. Six common herbs with distinctive bioactive, antioxidant components. A review of their separation techniques. Molecules 2021, 26, 2920. [Google Scholar] [CrossRef] [PubMed]
  12. Bicchi, C.; Binello, A.; Rubiolo, P. Determination of phenolic diterpene antioxidants in Rosemary (Rosmarinus officinalis L.) with different methods of extraction and analysis. Phytochem. Anal. 2000, 11, 236–242. [Google Scholar] [CrossRef]
  13. Exarchou, V.; Nenadis, N.; Tsimidou, M.; Gerothanassis, I.P.; Troganis, A.; Boskou, D. Antioxidant activities and phenolic composition of extracts from Greek oregano, Greek sage, and summer savory. J. Agric. Food Chem. 2002, 50, 5294–5299. [Google Scholar] [CrossRef]
  14. Rodríguez-Solana, R.; Salgado, J.M.; Domínguez, J.M.; Cortés-Diéguez, S. Comparison of Soxhlet, accelerated solvent and supercritical fluid extraction techniques for volatile (GC–MS and GC/FID) and phenolic compounds (HPLC–ESI/MS/MS) from Lamiaceae species. Phytochem. Anal. 2015, 26, 61–71. [Google Scholar] [CrossRef]
  15. Bellumori, M.; Innocenti, M.; Binello, A.; Boffa, L.; Mulinacci, N.; Cravotto, G. Selective recovery of rosmarinic and carnosic acids from rosemary leaves under ultrasound-and microwave-assisted extraction procedures. C. R. Chim. 2016, 19, 699–706. [Google Scholar] [CrossRef]
  16. Binello, A.; Cravotto, G.; Boffa, L.; Stevanato, L.; Bellumori, M.; Innocenti, M.; Mulinacci, N. Efficient and selective green extraction of polyphenols from lemon balm. C. R. Chim. 2017, 20, 921–926. [Google Scholar] [CrossRef]
  17. Rodríguez-Rojo, S.; Visentin, A.; Maestri, D.; Cocero, M.J. Assisted extraction of rosemary antioxidants with green solvents. J. Food Eng. 2012, 109, 98–103. [Google Scholar] [CrossRef] [Green Version]
  18. Carvalho, R.N., Jr.; Moura, L.S.; Rosa, P.T.V.; Meireles, M.A.A. Supercritical fluid extraction from Rosemary (Rosmarinus officinalis): Kinetic data, extract’s global yield, composition, and antioxidant activity. J. Supercrit. Fluids 2005, 35, 197–204. [Google Scholar] [CrossRef]
  19. Cavero, S.; García-Risco, M.R.; Marín, F.R.; Jaime, L.; Santoyo, S.; Señoráns, F.J.; Reglero, G.; Ibañez, E. Supercritical fluid extraction of antioxidant compounds from Oregano: Chemical and functional characterization via LC–MS and in vitro assays. J. Supercrit. Fluids 2006, 38, 62–69. [Google Scholar] [CrossRef]
  20. Omar, J.; Alonso, I.; Garaikoetxea, A.; Etxebarria, N. Optimization of focused ultrasound extraction and supercritical fluid extraction of volatile compounds and antioxidants from aromatic plants. Food Anal. Methods 2013, 6, 1611–1620. [Google Scholar] [CrossRef]
  21. Babovic, N.; Djilas, S.; Jadranin, M.; Vajs, V.; Ivanovic, J.; Petrovic, S.; Zizovic, I. Supercritical carbon dioxide extraction of antioxidant fractions from selected Lamiaceae herbs and their antioxidant capacity. Innov. Food Sci. Emerg. Technol. 2010, 11, 98–107. [Google Scholar] [CrossRef]
  22. Guideline IHT. Validation of analytical procedures: Text and methodology. Q2 R1 2005, 1, 5. [Google Scholar]
  23. Skendi, A.; Irakli, M.; Chatzopoulou, P.; Papageorgiou, M. Aromatic plants of Lamiaceae family in a traditional bread recipe: Effects on quality and phytochemical content. J. Food Biochem. 2019, 43, e13020. [Google Scholar] [CrossRef] [PubMed]
  24. Irakli, M.; Tsifodimou, K.; Sarrou, E.; Chatzopoulou, P. Optimization infusions conditions for improving phenolic content and antioxidant activity in Sideritis Scardica tea using response surface methodology. J. Appl. Res. Med. Aromat. Plants 2018, 8, 67–74. [Google Scholar] [CrossRef]
  25. Cuyckens, F.; Claeys, M. Optimization of a liquid chromatography method based on simultaneous electrospray ionization mass spectrometric and ultraviolet photodiode array detection for analysis of flavonoid glycosides. Rapid Commun. Mass Spectrom. 2002, 16, 2341–2348. [Google Scholar] [CrossRef] [PubMed]
  26. Tohma, H.; Köksal, E.; Kılıç, Ö.; Alan, Y.; Yılmaz, M.A.; Gülçin, İ.; Bursal, E.; Alwasel, S.H. RP-HPLC/MS/MS analysis of the phenolic compounds, antioxidant and antimicrobial activities of Salvia L. species. Antioxidants 2016, 5, 38. [Google Scholar] [CrossRef] [PubMed] [Green Version]
  27. Bajkacz, S.; Baranowska, I.; Buszewski, B.; Kowalski, B.; Ligor, M. Determination of flavonoids and phenolic acids in plant materials using SLE-SPE-UHPLC-MS/MS method. Food Anal. Methods 2018, 11, 3563–3575. [Google Scholar] [CrossRef] [Green Version]
  28. Baranowska, I.; Bajkacz, S. A new UHPLC-MS/MS method for the determination of flavonoids in supplements and DPPH-UHPLC-UV method for the evaluation of the radical scavenging activity of flavonoids. Food Chem. 2018, 256, 333–341. [Google Scholar] [CrossRef]
  29. Kapp, K.; Püssa, T.; Orav, A.; Roasto, M.; Raal, A.; Vuorela, P.; Vuorela, H.; Tammela, P. Chemical composition and antibacterial effect of Mentha spp. grown in Estonia. Nat. Prod. Commun. 2020, 15, 1–14. [Google Scholar] [CrossRef]
  30. Barros, L.; Dueñas, M.; Dias, M.I.; Sousa, M.J.; Santos-Buelga, C.; Ferreira, I.C.F.R. Phenolic profiles of cultivated, in vitro cultured and commercial samples of Melissa officinalis L. infusions. Food Chem. 2013, 136, 1–8. [Google Scholar] [CrossRef]
  31. Cirlini, M.; Mena, P.; Tassotti, M.; Herrlinger, K.A.; Nieman, K.M.; Dall’Asta, C.; Del Rio, D. Phenolic and volatile composition of a dry spearmint (Mentha spicata L.) extract. Molecules 2016, 21, 1007. [Google Scholar] [CrossRef] [PubMed] [Green Version]
  32. Mena, P.; Cirlini, M.; Tassotti, M.; Herrlinger, K.A.; Dall’Asta, C.; Del Rio, D. Phytochemical profiling of flavonoids, phenolic acids, terpenoids, and volatile fraction of a rosemary (Rosmarinus officinalis L.) extract. Molecules 2016, 21, 1576. [Google Scholar] [CrossRef] [PubMed]
  33. Tsimogiannis, D.; Choulitoudi, E.; Bimpilas, A.; Mitropoulou, G.; Kourkoutas, Y.; Oreopoulou, V. Exploitation of the biological potential of Satureja thymbra essential oil and distillation by-products. J. Appl. Res. Med. Aromat. Plants 2017, 4, 12–20. [Google Scholar] [CrossRef]
  34. Celano, R.; Piccinelli, A.L.; Pagano, I.; Roscigno, G.; Campone, L.; De Falco, E.; Russo, M.; Rastrelli, L. Oil distillation wastewaters from aromatic herbs as new natural source of antioxidant compounds. Int. Food Res. J. 2017, 99, 298–307. [Google Scholar] [CrossRef] [PubMed]
  35. Marzouk, M.M.; Hussein, S.R.; Elkhateeb, A.; El-shabrawy, M.; Abdel-Hameed, E.-S.S.; Kawashty, S.A. Comparative study of Mentha species growing wild in Egypt: LC-ESI-MS analysis and chemosystematic significance. J. Appl. Pharm. Sci. 2018, 8, 116–122. [Google Scholar]
  36. Taamalli, A.; Arráez-Román, D.; Abaza, L.; Iswaldi, I.; Fernández-Gutiérrez, A.; Zarrouk, M.; Segura-Carretero, A. LC-MS-based metabolite profiling of methanolic extracts from the medicinal and aromatic species Mentha pulegium and Origanum majorana. Phytochem. Anal. 2015, 26, 320–330. [Google Scholar] [CrossRef] [PubMed]
  37. Shojaeifard, Z.; Hemmateenejad, B.; Jassbi, A.R. Chemometrics-based LC-UV-ESIMS analyses of 50 Salvia species for detecting their antioxidant constituents. J. Pharm. Biomed. 2021, 193, 113745–113758. [Google Scholar] [CrossRef]
  38. Hossain, M.B.; Rai, D.K.; Brunton, N.P.; Martin-Diana, A.B.; Barry-Ryan, C. Characterization of phenolic composition in Lamiaceae spices by LC-ESI-MS/MS. J. Agric. Food Chem. 2010, 58, 10576–10581. [Google Scholar] [CrossRef]
  39. Koutsoulas, A.; Čarnecká, M.; Slanina, J.; Tóth, J.; Slaninová, I. Characterization of phenolic compounds and antiproliferative effects of salvia pomifera and salvia fruticosa extracts. Molecules 2019, 24, 2921. [Google Scholar] [CrossRef] [PubMed] [Green Version]
Figure 1. Total ion chromatogram (TIC) of the phenolic compounds identified in rosemary, oregano, sage, satureja, lemon balm, and spearmint methanol extracts by LC-ESI-DAD-MS method in negative mode. Peak numbers are as those specified in Table 3.
Antioxidants 10 02016 g001
Figure 2. Chemical structures of the most abundant phenolic derivatives identified in the extracts of essential oil solid residues of the six plants under investigation.
Antioxidants 10 02016 g002
Figure 3. Total phenolics content (TPC), total flavonoids content (TFC) and antioxidant activity as evaluated by DPPH, ABTS and FRAP tests in oregano, rosemary, sage, satureja, lemon balm, and spearmint methanol extracts of the plant residues, following extraction of the respective essential oil. Different superscripts letters above the error bars for each reported parameter indicate significant differences (p ≤ 0.05) among the means, as determined by the Duncan’s multiple range test.
Antioxidants 10 02016 g003
Table 1. Main validation data for the targeted phenolic compounds determined by LC-MS method.
AnalytesRt (min)[Μ − H] (m/z)UVmax (nm)EquationR2Linearity Range (ng/mL)LOD (ng/mL)LOQ (ng/mL)Precision (RSD%)Accuracy (%)
Intra-DayInter-DayIntra-DayInter-Day
QA2.85191330y = 0.2493 x + 0.00180.998110–400021.665.42.146.10102.2102.3
GA3.80169272y = 0.1508x + 0.00020.997910–400025.075.73.106.81100.2101.5
1-CQA4.00353327y = 0.0412x − 0.00160.998710–40008.927.03.056.5289.595.3
GCAT4.08305270y = 0.0437x − 0.00210.998510–400021.164.23.1713.41104.1105.2
nCLA4.33353325y = 0.0614x − 0.00030.999510–400029.489.22.913.9197.496.8
EGCAT4.75305270y = 0.0355x − 0.00120.997810–400029.790.02.189.47103.2105.0
PRCA5.03153260y = 0.2319x + 0.02410.999010–10,00051.1155.12.565.4194.994.3
CLA5.42353330y = 0.0848x + 0.00470.999950–10,00018.656.33.023.85100.6101.5
cCLA5.77353330y = 0.0444x + 0.00690.999350–10,00027.984.53.068.8299.2101.0
CAT5.95289280y = 0.0588x + 0.00110.995710–400025.276.42.295.26101.7102.7
VIC6.34593270, 335y = 0.0537x − 0.00320.998150–400033.4101.21.457.57100.5100.7
4HBA7.08137260y = 0.0109x + 0.01570.9953500–50,000164.8499.53.027.80100.6104.5
GNA7.10153327y = 0.3942x + 0.01220.999750–400054.0163.73.253.42101.8100.5
EPI7.24289280y = 0.0714x + 0.00640.999350–500050.7153.85.369.07101.2102.1
CA7.49179322y = 0.3171x + 0.07890.997710–10,00051.6156.42.085.47102.6104.4
VA7.77167260y = 0.0033x − 0.00710.9985500–50,000164.3497.95.6010.4795.390.3
SRA7.80197274y = 0.0017x − 0.00240.9981500–50,00074.9227.05.5911.71101.394.8
RUT9.11609256, 354y = 0.1427x + 0.0087 0.998910–400030.692.72.433.32100.6101.5
LUTRUT9.23593260, 360y = 0.1678x + 0.00980.996110–400010.030.33.774.8199.6102.5
QUEGLU9.63463260, 360y = 0.1408x + 0.00370.999510–400092.9281.62.973.3497.196.1
HYP9.77463260, 360y = 0.0487x + 0.00320.996910–400017.854.06.078.61101.0103.1
pCA9.80163309y = 0.1153x − 0.04690.994150–10,000168.5510.73.709.8195.296.7
LUTGLU9.87447253, 366y = 0.0570x + 0.00320.996250–500025.878.34.897.57101.2102.0
ISRUT10.33623254, 353y = 0.1333x − 0.00150.996050–400061.7187.12.264.85105.6108.1
VER10.35623280y = 0.0382x − 0.00290.992110–400057.5174.31.467.6693.295.9
3,4-DCQA10.41515327y = 0.2283x − 0.00220.999950–500036.1109.34.387.68104.3108.0
FA10.65193323y = 0.0024x − 0.00040.99941000–40,000208.1630.74.6511.9296.099.5
3,5-DCQA10.90515327y = 0.1035x − 0.03620.999050–40009.729.43.616.5189.292.6
ISGLU11.01477254, 333y = 0.5449x − 0.05580.998150–400015.145.65.578.5290.395.3
SA11.04223323y = 0.0051x + 0.00690.99511000–40,000132.2400.73.5710.6197.199.3
NARI11.10579284y = 0.1434x − 0.00170.996010–400064.5195.52.047.73100.699.7
APIGLU11.39431260, 360y = 0.2912x + 0.01250.998410–400049.0148.71.457.7399.999.6
HESP11.50609283y = 0.2518x + 0.02490.9995500–400061.2185.44.029.0291.695.0
4,5-DCQA11.60515327y = 0.1923x − 0.00660.9996500–40006.920.82.015.3280.389.6
RMA12.15359330y = 0.1179x + 0.01330.998710–10,00016.449.82.924.58104.9105.7
MYR12.53317253, 372y = 0.4649x + 0.04590.996310–500020.261.44.769.5499.3106.1
DHKAE12.88287291y = 0.9467x + 0.02670.998610–400010.732.45.638.65100.5106.3
ERY15.15287287y = 0.3298x + 0.02470.993510–40006.118.52.887.5298.9100.2
LUT15.17285253, 366y = 0.7956x + 0.02730.996110–50007.723.42.952.4899.199.2
QUE15.38301256, 370y = 0.7646x + 0.00530.996210–200012.036.31.023.8192.194.1
CNA17.11147276y = 0.0007x + 0.00370.99661000–40,00024.172.96.117.45101.593.6
API17.63269268, 337y = 1.0850x + 0.06190.997810–400033.9102.33.113.8198.194.6
NAR17.83271288y = 0.9427x − 0.02090.998710–400045.6138.35.115.95101.697.4
KAE18.26285264, 360y = 1.3159x + 0.22580.995610–5000168.4510.31.433.81100.9103.0
CARO22.50329280y = 0.3152x − 0.55000.997450,000–200,000421.91278.72.2012.1193.093.8
CRY24.90253287y = 1.0394x + 0.00800.994410–400029.990.84.535.9197.8104.4
GAL26.00272265, 358y = 1.1780x + 0.12370.995310–500080.9245.23.384.46104.9100.5
CARA29.07331280y = 0.1733x + 0.37440.999225,000–200,000718.32176.76.6315.00105.7106.7
Table 2. Recovery results of 48 phenolic compounds in oregano, rosemary and a mixture sample (equal quantities of oregano, rosemary, sage, satureja, lemon balm, and spearmint) applying the developed LC-MS method.
AnalytesRecovery (%)AnalytesRecovery (%)
OreganoRosemaryMixedOreganoRosemaryMixed
QA101.996.085.0CAT115.0108.2112.7
GA72.075.373.6EPI105.0107.3109.4
1-CQA92.476.591.5GCAT80.081.376.5
nCLA89.476.983.5EGCAT91.275.486.4
PRCA88.384.087.2VIC99.581.894.5
CLA78.380.086.4RUT88.787.492.0
cCLA101.6107.0110.0LUTRUT82.370.585.3
VA75.570.270.06LUTGLU70.071.378.0
4HBA84.288.290.6QUECLU83.386.287.0
SRA70.577.071.3HYP99.278.099.0
CA96.290.6103.0VER90.997.599.3
pCA98.891.598.3ISRUT104.5115.0109.5
FA108.0102.3117.2ISGLU82.572.670.3
SA70.471.370.6NARI74.272.776.5
3,4-DCQA110.3105.3101.9APIGLU71.883.270.6
3,5-DCQA108.0104.0110.0HESP83.387.176.7
4,5-DCQA107.1107.3102.2MYR86.390.083.3
RMA114.6109.0107.8DHKAE71.375.770.6
GNA79.082.384.6ERY99.480.5100.0
CNA82.570.571.3LUT82.877.989.0
CRY110.088.870.6QUE90.480.185.0
GAL89.780.886.9API99.893.284.4
CARO80.670.572.2KAE95.690.692.6
CARA85.3113.298.0NAR85.3107.2109.3
Table 4. Major phenolic compounds identified and quantified, with the targeted method, in the solid residues, following steam distillation of the respective aromatic plants, expressed as mg/100g.
AnalytesRosemary SageOreganoSaturejaSpearmintLemon Balm
QA1056.4 ± 26.8288.3 ± 1.6579.0 ± 17.0698.0 ± 38.8419.8 ± 38.2262.0 ± 22.0
1-CQA50.0 ± 4.0nd5.4 ± 0.3nd14.9 ± 0.6nd ± 0.0
nCLA33.1 ± 2.47.6 ± 0.020.1 ± 0.67.1 ± 0.381.7 ± 1.18.8 ± 0.0
PRCA51.1 ± 3.154.8 ± 0.8100.0 ± 2.017.4 ± 0.239.8 ± 0.325.6 ± 0.6
CLA0.6 ± 0.17.2 ± 0.59.5 ± 0.0<LOQ19.4 ± 1.40.2 ± 0.1
cCLA46.8 ± 2.0nd2.6 ± 0.1nd75.9 ± 2.1<LOQ ± 0.0
VA38.9 ± 1.420.8 ± 0.234.6 ± 0.624.7 ± 0.4nd26.2 ± 0.9
4HBA34.1 ± 1.129.7 ± 0.544.8 ± 0.526.3 ± 1.025.5 ± 0.925.5 ± 0.9
CA37.4 ± 2.614.1 ± 0.316.6 ± 0.411.7 ± 1.336.2 ± 0.536.4 ± 1.3
3,4-DCQAndndndnd2.7 ± 0.11.8 ± 0.1
3,5-DCQAndndndnd31.9 ± 0.1nd ± 0.0
4,5-DCQAndndndnd10.0 ± 0.021.0 ± 1.0
FAndndndnd152.5 ± 2.521.0 ± 1.0
RMA2469.6 ± 48.84251.6 ± 160.45914.8 ± 253.22530.0 ± 30.09660.0 ± 60.09330.4 ± 147.2
Sulphated RMAndndndnd3444.5 ± 0.0nd ± 0.0
LITA isomer Indnd1366.7nd150.7 ± 9.0640.0 ± 16.0
LITA isomer IIndnd2666.8 ± 38.3585.2 ± 14.8296.7 ± 15.3775.7 ± 15.9
Phenolic acids3817.9 a ± 92.04674.1 b ± 159.110760.9 c ± 142.33900.3 a ± 25.114462.2 e ± 34.911174.6 d ± 140.3
EGCATnd46.0 ± 2.0nd<LOQndnd
medioresinolndnd1708.4 ± 110.4ndnd800.0 ± 20.0
GCAT isomer2111.9 ± 97.5ndnd2805.8 ± 74.22332.8 ± 63.296.3 ± 2.7
VIC28.7 ± 0.9252.0 ± 11.7888.4 ± 24.479.5 ± 1.518.6 ± 0.36.8 ± 0.1
LUTRUT199.7 ± 9.3132.6 ± 1.4ndnd284.4 ± 8.4nd
LUTGLUnd207.2 ± 3.2ndndnd186.6 ± 2.2
VER70.8 ± 10.810.6 ± 0.6<LOQ19.7 ± 0.312.0 ± 0.6<LOQ
HYPndnd<LOQndnd17.6 ± 0.8
QUEGLUndnd<LOQ5.4 ± 0.2<LOQnd
DHKAE5.5 ± 0.3<LOQ29.8 ± 1.55.9 ± 0.9ndnd
ISRUTnd38.4 ± 1.6ndnd56.9 ± 0.7nd
ISGLU114.0 ± 4.137.2 ± 1.2nd<LOQ<LOQ<LOQ
APIGLU5.0 ± 0.415.7 ± 0.21.6 ± 0.0<LOQ<LOQ17.4 ± 0.6
ERYndnd185.2 ± 7.898.2 ± 15.6<LOQ<LOQ
LUT1.3 ± 0.13.5 ± 0.22.0 ± 0.30.2 ± 0.03.6 ± 0.21.4 ± 0.1
QUE<LOQ<LOQ2.9 ± 0.4<LOQ<LOQ<LOQ
HESP58.6 ± 3.4nd ± 0.0ndnd124.2 ± 7.8nd
API5.8 ± 0.54.5 ± 0.416.8 ± 0.14.0 ± 0.20.1 ± 0.0<LOQ
NAR<LOQ<LOQ140.8 ± 3.294.3 ± 1.35.6 ± 0.2<LOQ
Flavonoids2601.3 c ± 103.9747.6 a ± 13.62976.0 e ± 73.53112.9 f ± 90.92838.1 d ± 46.41126.0 b ± 21.9
CARO2211.6 ± 228.42501.2 ± 199.6485.6 ± 10.4544.0 ± 16.0ndnd
CARA3963.6 ± 240.11631.2 ± 35.4737.6 ± 24.0ndndnd
Phenolic diterpenes6175.2 d ± 11.74132.4 c ± 164.21223.2 b ± 13.6544.0 a ± 16.00.00.0
Total12594.3 c ± 207.59554.2 b ± 336.914960.2 d ± 55.27557.2 a ± 100.017300.3 e ± 77.912300.5 c ± 118.3
nd—not detected; LITA—lithospermic acid; <LOQ—lower than the level of quantification; different superscripts letters in the same line indicate differences (p ≤ 0.05) amongst the means, as determined by the Duncan’s multiple range test.
Table 5. Pearson’s correlations between polyphenolic contents of the studied extracts and their different corresponded antioxidant activities.
VariablesTFCABTSDPPHFRAPPhenolic AcidsDiterpenesLC-MS Phenolics
TPC0.992 **0.939 **0.961 **0.984 **0.949 **−0.539 *0.795 **
TFC 0.919 **0.952 **0.994 **0.950 **−0.611 **0.736 **
ABTS 0.981 **0.916 **0.925 **−0.563 *0.809 **
DPPH 0.956 **0.974 **−0.633 **0.823 **
FRAP 0.956 **−0.629 **0.745 **
* Correlation is significant at the 0.05 level (2-tailed); ** Correlation is significant at the 0.01 level (2-tailed).
Publisher’s Note: MDPI stays neutral with regard to jurisdictional claims in published maps and institutional affiliations.

