
Understanding the Role of the Antioxidant Drug Erdosteine and Its Active Metabolite on Staphylococcus aureus Methicillin Resistant Biofilm Formation


Abstract
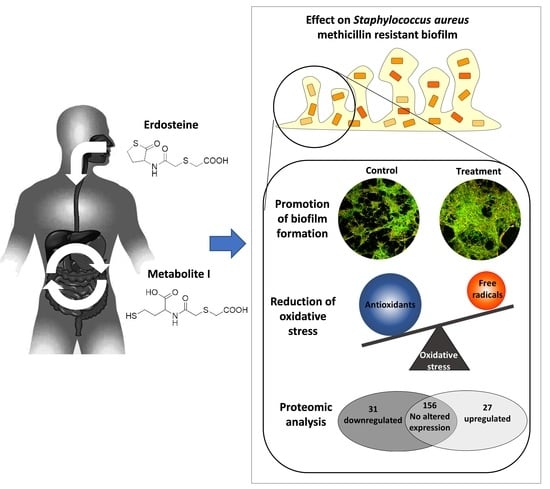
:
1. Introduction
2. Materials and Methods
2.1. Staphylococcus aureus Strains and Growth Conditions
2.2. MRSA Planktonic Growth
2.3. Biofilm Growth in the CDC Reactor
2.4. Biofilm-Dwelling Cells
2.5. Biofilm Morphology
2.6. Oxidative Stress Level
2.7. Biofilm Dispersion
2.8. Statistical Analysis
2.9. Protein Extraction and Sample Preparation
2.10. High-Resolution Mass Spectrometry Analysis (nLC-HRMS)
2.11. Bioinformatic, Statistical and Functional Annotation Analysis
3. Results
3.1. Erdosteine and Metabolite I Do Not Affect MRSA Planktonic Growth
3.2. Erdosteine and Metabolite I Promote Biofilm Formation
3.3. Erdosteine and Metabolite I Reduce the Oxidative Stress Level within the Biofilm
3.4. Metabolite I of Erdosteine Reduces Biofilm Dispersion
3.5. The 5 mg/L Metabolite I Alters the Expression of ATCC 43300 Biofilm Proteins
3.6. The 5 mg/L Metabolite I Alters the Expression of 98825 TX Biofilm Proteins
3.7. 5 mg/L Metabolite I Alters the Expression of ATCC 43300 and 98825 TX in a Different Way: Comparison between the Two Strains
4. Discussion
5. Conclusions
Supplementary Materials
Author Contributions
Funding
Institutional Review Board Statement
Informed Consent Statement
Data Availability Statement
Acknowledgments
Conflicts of Interest
References
- Koo, H.; Allan, R.N.; Howlin, R.P.; Stoodley, P.; Hall-Stoodley, L. Targeting microbial biofilms: Current and prospective therapeutic strategies. Nat. Rev. Microbiol. 2017, 15, 740–755. [Google Scholar] [CrossRef]
- Sharma, D.; Misba, L.; Khan, A.U. Antibiotics versus biofilm: An emerging battleground in microbial communities. Antimicrob. Resist. Infect. Control 2019, 8, 76. [Google Scholar] [CrossRef]
- Di Domenico, E.G.; Rimoldi, S.G.; Cavallo, I.; D’Agosto, G.; Trento, E.; Cagnoni, G.; Palazzin, A.; Pagani, C.; Romeri, F.; De Vecchi, E.; et al. Microbial biofilm correlates with an increased antibiotic tolerance and poor therapeutic outcome in infective endocarditis. BMC Microbiol. 2019, 19, 228. [Google Scholar] [CrossRef] [Green Version]
- Francolini, I.; Piozzi, A. Role of Antioxidant Molecules and Polymers in Prevention of Bacterial Growth and Biofilm Formation. Curr. Med. Chem. 2020, 27, 4882–4904. [Google Scholar] [CrossRef]
- Cattò, C.; Grazioso, G.; Dell’Orto, S.; Gelain, A.; Villa, S.; Marzano, V.; Vitali, A.; Villa, F.; Cappitelli, F.; Forlani, F. The response of Escherichia coli biofilm to salicylic acid. Biofouling 2017, 33, 235–251. [Google Scholar] [CrossRef] [Green Version]
- Ong, K.S.; Mawang, C.I.; Daniel-Jambun, D.; Lim, Y.Y.; Lee, S.M. Current anti-biofilm strategies and potential of antioxidants in biofilm control. Expert Rev. Anti Infect. Ther. 2018, 16, 855–864. [Google Scholar] [CrossRef]
- Rossi, F.; Cattò, C.; Mugnai, G.; Villa, F.; Forlani, F. Effects of the Quinone Oxidoreductase WrbA on Escherichia coli Biofilm Formation and Oxidative Stress. Antioxidants 2021, 10, 919. [Google Scholar] [CrossRef] [PubMed]
- Tenório, M.C.D.S.; Graciliano, N.G.; Moura, F.A.; Oliveira, A.C.M.; Goulart, M. N-Acetylcysteine (NAC): Impacts on Human Health. Antioxidants 2021, 10, 967. [Google Scholar] [CrossRef] [PubMed]
- Quah, S.Y.; Wu, S.; Lui, J.N.; Sum, C.P.; Tan, K.S. N-Acetylcysteine Inhibits Growth and Eradicates Biofilm of Enterococcus faecalis. J. Endod. 2012, 38, 81–85. [Google Scholar] [CrossRef] [PubMed]
- Drago, L.; De Vecchi, E.; Mattina, R.; Romanò, C.L. Activity of N-acetyl-L-cysteine against Biofilm of Staphylococcus Aureus and Pseudomonas Aeruginosa on Orthopedic Prosthetic Materials. Int. J. Artif. Organs 2013, 36, 39–46. [Google Scholar] [CrossRef]
- DiNicola, S.; De Grazia, S.; Carlomagno, G.; Pintucci, J.P. N-acetylcysteine as powerful molecule to destroy bacterial biofilms. A systematic review. Eur. Rev. Med. Pharmacol. Sci. 2014, 18, 2942–2948. [Google Scholar]
- Costa, F.; Sousa, D.; Parreira, P.; Lamghari, M.; Gomes, P.; Martins, M.C.L. N-acetylcysteine-functionalized coating avoids bacterial adhesion and biofilm formation. Sci. Rep. 2017, 7, 17134. [Google Scholar] [CrossRef] [PubMed] [Green Version]
- Yin, S.; Jiang, B.; Huang, G.; Zhang, Y.; You, B.; Chen, Y.; Gong, Y.; Chen, J.; Yuan, Z.; Zhao, Y.; et al. The Interaction of N-Acetylcysteine and Serum Transferrin Promotes Bacterial Biofilm Formation. Cell. Physiol. Biochem. 2018, 45, 1399–1409. [Google Scholar] [CrossRef]
- Li, X.; Kim, J.; Wu, J.; I Ahamed, A.; Wang, Y.; Martins-Green, M. N-Acetyl-cysteine and Mechanisms Involved in Resolution of Chronic Wound Biofilm. J. Diabetes Res. 2020, 2020, 9589507. [Google Scholar] [CrossRef] [Green Version]
- Manoharan, A.; Ognenovska, S.; Paino, D.; Whiteley, G.; Glasbey, T.; Kriel, F.; Farrell, J.; Moore, K.; Manos, J.; Das, T. N-Acetylcysteine Protects Bladder Epithelial Cells from Bacterial Invasion and Displays Antibiofilm Activity against Urinary Tract Bacterial Pathogens. Antibiotics 2021, 10, 900. [Google Scholar] [CrossRef] [PubMed]
- Quezada, H.; Martínez-Vázquez, M.; López-Jácome, E.; González-Pedrajo, B.; Andrade, Á.; Fernández-Presas, A.M.; Tovar-García, A.; García-Contreras, R. Repurposed anti-cancer drugs: The future for anti-infective therapy? Expert Rev. Anti Infect. Ther. 2020, 18, 609–612. [Google Scholar] [CrossRef] [Green Version]
- Petricciuolo, M.; Davidescu, M.; Fettucciari, K.; Gatticchi, L.; Brancorsini, S.; Roberti, R.; Corazzi, L.; Macchioni, L. The efficacy of the anticancer 3-bromopyruvate is potentiated by antimycin and menadione by unbalancing mitochondrial ROS production and disposal in U118 glioblastoma cells. Heliyon 2020, 6, e05741. [Google Scholar] [CrossRef] [PubMed]
- Visca, P.; Pisa, F.; Imperi, F. The antimetabolite 3-bromopyruvate selectively inhibits Staphylococcus aureus. Int. J. Antimicrob. Agents 2019, 53, 449–455. [Google Scholar] [CrossRef] [Green Version]
- Sedlmayer, F.; Woischnig, A.-K.; Unterreiner, V.; Fuchs, F.; Baeschlin, D.; Khanna, N.; Fussenegger, M. 5-Fluorouracil blocks quorum-sensing of biofilm-embedded methicillin-resistant Staphylococcus aureus in mice. Nucleic Acids Res. 2021, 49, e73. [Google Scholar] [CrossRef]
- Pedre, B.; Barayeu, U.; Ezeriņa, D.; Dick, T.P. The mechanism of action of N-acetylcysteine (NAC): The emerging role of H2S and sulfane sulfur species. Pharmacol. Ther. 2021, 228, 107916. [Google Scholar] [CrossRef]
- Miyake, K.; Kaise, T.; Hosoe, H.; Akuta, K.; Manabe, H.; Ohmori, K. The effect of erdosteine and its active metabolite on reactive oxygen species production by inflammatory cells. Inflamm. Res. 1999, 48, 205–209. [Google Scholar] [CrossRef] [PubMed]
- Dechant, K.L.; Noble, S. Erdosteine. Drugs 1996, 52, 875–882. [Google Scholar] [CrossRef]
- Cazzola, M.; Page, C.; Rogliani, P.; Calzetta, L.; Matera, M.G. Multifaceted Beneficial Effects of Erdosteine: More than a Mucolytic Agent. Drugs 2020, 80, 1799–1809. [Google Scholar] [CrossRef]
- Moretti, M. Pharmacology and clinical efficacy of erdosteine in chronic obstructive pulmonary disease. Expert Rev. Respir. Med. 2007, 1, 307–316. [Google Scholar] [CrossRef]
- Cazzola, M.; Calzetta, L.; Page, C.; Rogliani, P.; Matera, M.G. Thiol-Based Drugs in Pulmonary Medicine: Much More than Mucolytics. Trends Pharmacol. Sci. 2019, 40, 452–463. [Google Scholar] [CrossRef]
- Braga, P.C.; Sasso, M.D.; Sala, M.T.; Gianelle, V. Effects of Erdosteine and Its Metabolites on Bacterial Adhesiveness. Arzneimittelforschung 1999, 49, 344–350. [Google Scholar] [CrossRef]
- Merritt, J.H.; Kadouri, D.E.; O’Toole, G.A. Growing and Analyzing Static Biofilms. Curr. Protoc. Microbiol. 2005, 22, 1B.1.1–1B.1.17. [Google Scholar] [CrossRef] [Green Version]
- Cattò, C.; Dell’Orto, S.; Villa, F.; Villa, S.; Gelain, A.; Vitali, A.; Marzano, V.; Baroni, S.; Forlani, F.; Cappitelli, F. Unravelling the Structural and Molecular Basis Responsible for the Anti-Biofilm Activity of Zosteric Acid. PLoS ONE 2015, 10, e0131519. [Google Scholar] [CrossRef] [Green Version]
- Garnett, M.J.; Edelman, E.J.; Heidorn, S.J.; Greenman, C.D.; Dastur, A.; Lau, K.W.; Greninger, P.; Thompson, I.R.; Luo, X.; Soares, J.; et al. Systematic identification of genomic markers of drug sensitivity in cancer cells. Nature 2012, 483, 570–575. [Google Scholar] [CrossRef] [Green Version]
- Cattò, C.; James, G.; Villa, F.; Villa, S.; Cappitelli, F. Zosteric acid and salicylic acid bound to a low density polyethylene surface successfully control bacterial biofilm formation. Biofouling 2018, 34, 440–452. [Google Scholar] [CrossRef] [PubMed]
- Jakubowski, W.; Biliński, T.; Bartosz, G. Oxidative stress during aging of stationary cultures of the yeast Saccharomyces cerevisiae. Free Radic. Biol. Med. 2000, 28, 659–664. [Google Scholar] [CrossRef]
- Mi, H.; Ebert, D.; Muruganujan, A.; Mills, C.; Albou, L.-P.; Mushayamaha, T.; Thomas, P.D. PANTHER version 16: A revised family classification, tree-based classification tool, enhancer regions and extensive API. Nucleic Acids Res. 2021, 49, D394–D403. [Google Scholar] [CrossRef]
- Maudsley, S.; Chadwick, W.; Wang, L.; Zhou, Y.; Martin, B.; Park, S.-S. Bioinformatic Approaches to Metabolic Pathways Analysis. Methods Mol. Biol. 2011, 756, 99–130. [Google Scholar] [CrossRef] [Green Version]
- Braga, P.C.; Culici, M.; Sasso, M.D.; Falchi, M.; Spallino, A. Free Radical Scavenging Activity of Erdosteine Metabolite I Investigated by Electron Paramagnetic Resonance Spectroscopy. Pharmacology 2010, 85, 195–202. [Google Scholar] [CrossRef] [PubMed]
- Andersson, D.I.; Hughes, D. Microbiological effects of sublethal levels of antibiotics. Nat. Rev. Microbiol. 2014, 12, 465–478. [Google Scholar] [CrossRef] [PubMed]
- Bernardi, S.; Anderson, A.; Macchiarelli, G.; Hellwig, E.; Cieplik, F.; Vach, K.; Al-Ahmad, A. Subinhibitory Antibiotic Concentrations Enhance Biofilm Formation of Clinical Enterococcus faecalis Isolates. Antibiotics 2021, 10, 874. [Google Scholar] [CrossRef]
- Saeki, E.K.; Yamada, A.Y.; de Araujo, L.A.; Anversa, L.; Garcia, D.D.O.; de Souza, R.L.B.; Martins, H.M.; Kobayashi, R.K.T.; Nakazato, G. Subinhibitory Concentrations of Biogenic Silver Nanoparticles Affect Motility and Biofilm Formation in Pseudomonas aeruginosa. Front. Cell. Infect. Microbiol. 2021, 11, 656984. [Google Scholar] [CrossRef] [PubMed]
- Kot, B.; Sytykiewicz, H.; Sprawka, I. Expression of the Biofilm-Associated Genes in Methicillin-Resistant Staphylococcus aureus in Biofilm and Planktonic Conditions. Int. J. Mol. Sci. 2018, 19, 3487. [Google Scholar] [CrossRef] [Green Version]
- Hemmadi, V.; Biswas, M. An overview of moonlighting proteins in Staphylococcus aureus infection. Arch. Microbiol. 2021, 203, 481–498. [Google Scholar] [CrossRef]
- Zheng, J.; Wu, Y.; Lin, Z.; Wang, G.; Jiang, S.; Sun, X.; Tu, H.; Yu, Z.; Qu, D. ClpP participates in stress tolerance, biofilm formation, antimicrobial tolerance, and virulence of Enterococcus faecalis. BMC Microbiol. 2020, 20, 30. [Google Scholar] [CrossRef] [Green Version]
- Frees, D.; Chastanet, A.; Qazi, S.; Sørensen, K.; Hill, P.; Msadek, T.; Ingmer, H. Clp ATPases are required for stress tolerance, intracellular replication and biofilm formation in Staphylococcus aureus. Mol. Microbiol. 2004, 54, 1445–1462. [Google Scholar] [CrossRef]
- Bosch, M.E.; Bertrand, B.P.; Heim, C.E.; Alqarzaee, A.A.; Chaudhari, S.S.; Aldrich, A.L.; Fey, P.D.; Thomas, V.C.; Kielian, T. Staphylococcus aureus ATP Synthase Promotes Biofilm Persistence by Influencing Innate Immunity. mBio 2020, 11, e01581-20. [Google Scholar] [CrossRef]
- Uziel, O.; Borovok, I.; Schreiber, R.; Cohen, G.; Aharonowitz, Y. Transcriptional Regulation of the Staphylococcus aureus Thioredoxin and Thioredoxin Reductase Genes in Response to Oxygen and Disulfide Stress. J. Bacteriol. 2004, 186, 326–334. [Google Scholar] [CrossRef] [Green Version]
- Cosgrove, K.; Coutts, G.; Jonsson, I.-M.; Tarkowski, A.; Kokai-Kun, J.F.; Mond, J.J.; Foster, S.J. Catalase (KatA) and Alkyl Hydroperoxide Reductase (AhpC) Have Compensatory Roles in Peroxide Stress Resistance and Are Required for Survival, Persistence, and Nasal Colonization in Staphylococcus aureus. J. Bacteriol. 2007, 189, 1025–1035. [Google Scholar] [CrossRef] [PubMed] [Green Version]
- Imber, M.; Van Loi, V.; Reznikov, S.; Fritsch, V.N.; Pietrzyk-Brzezinska, A.J.; Prehn, J.; Hamilton, C.; Wahl, M.; Bronowska, A.K.; Antelmann, H. The aldehyde dehydrogenase AldA contributes to the hypochlorite defense and is redox-controlled by protein S-bacillithiolation in Staphylococcus aureus. Redox Biol. 2018, 15, 557–568. [Google Scholar] [CrossRef]
- Felix, L.; Mylonakis, E.; Fuchs, B.B. Thioredoxin Reductase Is a Valid Target for Antimicrobial Therapeutic Development Against Gram-Positive Bacteria. Front. Microbiol. 2021, 12, 663481. [Google Scholar] [CrossRef] [PubMed]
- Lei, M.G.; Gupta, R.K.; Lee, C.Y. Proteomics of Staphylococcus aureus biofilm matrix in a rat model of orthopedic implant-associated infection. PLoS ONE 2017, 12, e0187981. [Google Scholar] [CrossRef] [Green Version]
- Urbano, R.; Karlinsey, J.E.; Libby, S.J.; Doulias, P.-T.; Ischiropoulos, H.; Warheit-Niemi, H.I.; Liggitt, D.H.; Horswill, A.R.; Fang, F.C. Host Nitric Oxide Disrupts Microbial Cell-to-Cell Communication to Inhibit Staphylococcal Virulence. Cell Host Microbe 2018, 23, 594–606.e7. [Google Scholar] [CrossRef] [PubMed] [Green Version]
- Heckler, I.; Boon, E.M. Insights Into Nitric Oxide Modulated Quorum Sensing Pathways. Front. Microbiol. 2019, 10, 2174. [Google Scholar] [CrossRef]
- Williams, D.E.; Boon, E.M. Towards Understanding the Molecular Basis of Nitric Oxide-Regulated Group Behaviors in Pathogenic Bacteria. J. Innate Immun. 2018, 11, 205–215. [Google Scholar] [CrossRef] [PubMed]
- Kinkel, T.L.; Ramos-Montañez, S.; Pando, J.M.; Tadeo, D.V.; Strom, E.N.; Libby, S.J.; Fang, F.C. An essential role for bacterial nitric oxide synthase in Staphylococcus aureus electron transfer and colonization. Nat. Microbiol. 2016, 2, 16224. [Google Scholar] [CrossRef] [Green Version]
- Poole, R.K. Flavohaemoglobin: The pre-eminent nitric oxide–detoxifying machine of microorganisms. F1000Research 2020, 9, 7. [Google Scholar] [CrossRef] [Green Version]
- Mashruwala, A.A.; Gries, C.; Scherr, T.D.; Kielian, T.; Boyd, J.M. SaeRS Is Responsive to Cellular Respiratory Status and Regulates Fermentative Biofilm Formation in Staphylococcus aureus. Infect. Immun. 2017, 85, e00157-17. [Google Scholar] [CrossRef] [Green Version]
- Linzner, N.; Van Loi, V.; Fritsch, V.N.; Antelmann, H. Thiol-based redox switches in the major pathogen Staphylococcus aureus. Biol. Chem. 2021, 402, 333–361. [Google Scholar] [CrossRef] [PubMed]
- Fuller, J.R.; Vitko, N.P.; Perkowski, E.F.; Scott, E.; Khatri, D.; Spontak, J.S.; Thurlow, L.R.; Richardson, A.R. Identification of a Lactate-Quinone Oxidoreductase in Staphylococcus aureus that is Essential for Virulence. Front. Cell. Infect. Microbiol. 2011, 1, 19. [Google Scholar] [CrossRef] [PubMed] [Green Version]
- Vitko, N.P.; Spahich, N.A.; Richardson, A.R. Glycolytic Dependency of High-Level Nitric Oxide Resistance and Virulence in Staphylococcus aureus. mBio 2015, 6, e00045-15. [Google Scholar] [CrossRef] [PubMed] [Green Version]
- Spahich, N.A.; Vitko, N.P.; Thurlow, L.R.; Temple, B.; Richardson, A.R. Staphylococcus aureuslactate- and malate-quinone oxidoreductases contribute to nitric oxide resistance and virulence. Mol. Microbiol. 2016, 100, 759–773. [Google Scholar] [CrossRef] [PubMed] [Green Version]
- Sasso, M.D.; Culici, M.; Bianchi, T.; Fonti, E.; Braga, P.C. Inhibitory Effects of Metabolite I of Erdosteine on the Generation of Nitric Oxide and Peroxynitrite Chemiluminescence by Human Neutrophils. Pharmacology 2004, 71, 120–127. [Google Scholar] [CrossRef] [PubMed]
- Lewis, A.M.; Matzdorf, S.S.; Endres, J.L.; Windham, I.H.; Bayles, K.W.; Rice, K.C. Examination of theStaphylococcus aureusnitric oxide reductase (saNOR) reveals its contribution to modulating intracellular NO levels and cellular respiration. Mol. Microbiol. 2015, 96, 651–669. [Google Scholar] [CrossRef] [Green Version]
- Jardeleza, C.; Foreman, A.; Baker, L.; Paramasivan, S.; Field, J.; Tan, L.W.; Wormald, P.-J. The effects of nitric oxide on Staphylococcus aureus biofilm growth and its implications in chronic rhinosinusitis. Int. Forum Allergy Rhinol. 2011, 1, 438–444. [Google Scholar] [CrossRef]
- Grosser, M.R.; Paluscio, E.; Thurlow, L.R.; Dillon, M.M.; Cooper, V.S.; Kawula, T.H.; Richardson, A.R. Genetic requirements for Staphylococcus aureus nitric oxide resistance and virulence. PLoS Pathog. 2018, 14, e1006907. [Google Scholar] [CrossRef]
- Savijoki, K.; Miettinen, I.; Nyman, T.A.; Kortesoja, M.; Hanski, L.; Varmanen, P.; Fallarero, A. Growth Mode and Physiological State of Cells Prior to Biofilm Formation Affect Immune Evasion and Persistence of Staphylococcus aureus. Microorganisms 2020, 8, 106. [Google Scholar] [CrossRef] [Green Version]
- Balamurugan, P.; Krishna, V.P.; Bharath, D.; Lavanya, R.; Vairaprakash, P.; Princy, S.A. Staphylococcus aureus Quorum Regulator SarA Targeted Compound, 2-[(Methylamino)methyl]phenol Inhibits Biofilm and Down-Regulates Virulence Genes. Front. Microbiol. 2017, 8, 1290. [Google Scholar] [CrossRef]
- Nguyen, H.T.; Nguyen, T.H.; Otto, M. The staphylococcal exopolysaccharide PIA—Biosynthesis and role in biofilm formation, colonization, and infection. Comput. Struct. Biotechnol. J. 2020, 18, 3324–3334. [Google Scholar] [CrossRef]
- Foster, T.J. The remarkably multifunctional fibronectin binding proteins of Staphylococcus aureus. Eur. J. Clin. Microbiol. Infect. Dis. 2016, 35, 1923–1931. [Google Scholar] [CrossRef] [PubMed]
- Speziale, P.; Pietrocola, G. The Multivalent Role of Fibronectin-Binding Proteins A and B (FnBPA and FnBPB) of Staphylococcus aureus in Host Infections. Front. Microbiol. 2020, 11, 2054. [Google Scholar] [CrossRef]
- Dai, Y.; Wang, Y.; Liu, Q.; Gao, Q.; Lu, H.; Meng, H.; Qin, J.; Hu, M.; Li, M. A Novel ESAT-6 Secretion System-Secreted Protein EsxX of Community-Associated Staphylococcus aureus Lineage ST398 Contributes to Immune Evasion and Virulence. Front. Microbiol. 2017, 8, 819. [Google Scholar] [CrossRef] [Green Version]
- Burts, M.L.; Williams, W.A.; DeBord, K.; Missiakas, D.M. EsxA and EsxB are secreted by an ESAT-6-like system that is required for the pathogenesis of Staphylococcus aureus infections. Proc. Natl. Acad. Sci. USA 2005, 102, 1169–1174. [Google Scholar] [CrossRef] [PubMed] [Green Version]
- Shin, H.-J.; Yang, S.; Lim, Y. Antibiotic susceptibility of Staphylococcus aureus with different degrees of biofilm formation. J. Anal. Sci. Technol. 2021, 12, 41. [Google Scholar] [CrossRef]
- Braga, P.C.; Zuccotti, T.; Sasso, M.D. Bacterial Adhesiveness: Effects of the SH Metabolite of Erdosteine (Mucoactive Drug) plus Clarithromycin versus Clarithromycin Alone. Chemotherapy 2001, 47, 208–214. [Google Scholar] [CrossRef]
- Dal, S.M.; Bovio, C.; Culici, M.; Braga, P.C. The combination of the SH metabolite of erdosteine (a mucoactive drug) and ciprofloxacin increases the inhibition of bacterial adhesiveness achieved by ciprofloxacin alone. Drugs Exp. Clin. Res. 2002, 28, 75–82. [Google Scholar] [PubMed]
- Cogo, R. Erdosteine: A new therapeutic weapon beyond the PEACE. Trends Med. 2012, 12, 133–142. [Google Scholar]


| Accession | Protein Name | Ratio: Met I/Control | |
|---|---|---|---|
| Upregulated in Both Strains | ATCC 43300 | 98825 TX | |
| A0A6B5GER5 | ATP synthase gamma chain | 4.115 | 3.731 |
| A0A5C8XBW5 | ATP-dependent Clp protease ATP-binding subunit | 3.247 | 5.263 |
| A0A1Q8DC93 | Phosphoglycerate kinase | 2.778 | 5.780 |
| A0A6B0BUI5 | Enolase | 2.075 | 2.262 |
| A0A2S6DJ38 | 30S ribosomal protein S4 | 1.815 | 1.565 |
| A0A5C8X8W0 | Ornithine carbamoyltransferase | 1.669 | 21.739 |
| A0A1Q8DBU3 | 30S ribosomal protein S3 | 1.536 | 1.770 |
| A0A2S6DKC3 | Elongation factor G | 1.502 | 4.630 |
| Downregulated in Both Strains | |||
| A0A0E1X760 | Ornithine aminotransferase | 0.646 | 0.178 |
| A0A077UHY4 | Elongation factor Ts | 0.589 | 0.507 |
| A0A5F0TDJ0 | Fructose-bisphosphate aldolase class 1 | 0.573 | 0.377 |
| A0A0E0VNI4 | Glutamine synthetase | 0.424 | 0.181 |
| Q2YSV9 | Transcriptional regulator SarA | 0.391 | 0.184 |
| T1YCP4 | Aldehyde dehydrogenase | 0.389 | 0.372 |
| A0A0E1VIR3 | Pyruvate kinase | 0.382 | 0.539 |
| T1Y9F1 | Transcription elongation factor GreA | 0.321 | 0.144 |
| A0A0E0VNW0 | Thioredoxin | 0.279 | 0.140 |
| A0A0E1VGN7 | Universal stress protein | 0.267 | 0.059 |
| A0A0E0VU32 | D-lactate dehydrogenase | 0.257 | 0.337 |
| T1YCX2 | Probable malate:quinone oxidoreductase | 0.235 | 0.089 |
| A0A0E1VJH6 | 30S ribosomal protein S1 | 0.217 | 0.055 |
| A0A077ULP0 | Alkaline shock protein 23 | 0.200 | 0.050 |
| A0A0E0VL26 | Alkyl hydroperoxide reductase C | 0.167 | 0.044 |
| A0A0E1XIM1 | Glutamine-ructose-6-phosphate aminotransferase | 0.158 | 0.161 |
| A0A380DHX1 | Flavohemoglobin | 0.157 | 0.191 |
| A0A6B0BAU5 | Ketose-bisphosphate aldolase | 0.122 | 0.074 |
| A0A077W3A7 | 50S ribosomal protein L18 | 0.043 | 0.208 |
| A0A5C8X621 | ESAT-6-like protein | 0.039 | 0.055 |
Publisher’s Note: MDPI stays neutral with regard to jurisdictional claims in published maps and institutional affiliations. |
© 2021 by the authors. Licensee MDPI, Basel, Switzerland. This article is an open access article distributed under the terms and conditions of the Creative Commons Attribution (CC BY) license (https://creativecommons.org/licenses/by/4.0/).
Share and Cite
Cattò, C.; Villa, F.; Cappitelli, F. Understanding the Role of the Antioxidant Drug Erdosteine and Its Active Metabolite on Staphylococcus aureus Methicillin Resistant Biofilm Formation. Antioxidants 2021, 10, 1922. https://doi.org/10.3390/antiox10121922
Cattò C, Villa F, Cappitelli F. Understanding the Role of the Antioxidant Drug Erdosteine and Its Active Metabolite on Staphylococcus aureus Methicillin Resistant Biofilm Formation. Antioxidants. 2021; 10(12):1922. https://doi.org/10.3390/antiox10121922
Chicago/Turabian StyleCattò, Cristina, Federica Villa, and Francesca Cappitelli. 2021. "Understanding the Role of the Antioxidant Drug Erdosteine and Its Active Metabolite on Staphylococcus aureus Methicillin Resistant Biofilm Formation" Antioxidants 10, no. 12: 1922. https://doi.org/10.3390/antiox10121922