Preserved Cerebral Oxygen Metabolism in Astrocytic Dysfunction: A Combination Study of 15O-Gas PET with 14C-Acetate Autoradiography

 ,
,
Abstract
:1. Introduction
2. Materials and Methods
2.1. Preparation of FC Solution
2.2. Animal Preparation
2.3. 15O-Gas PET Measurement
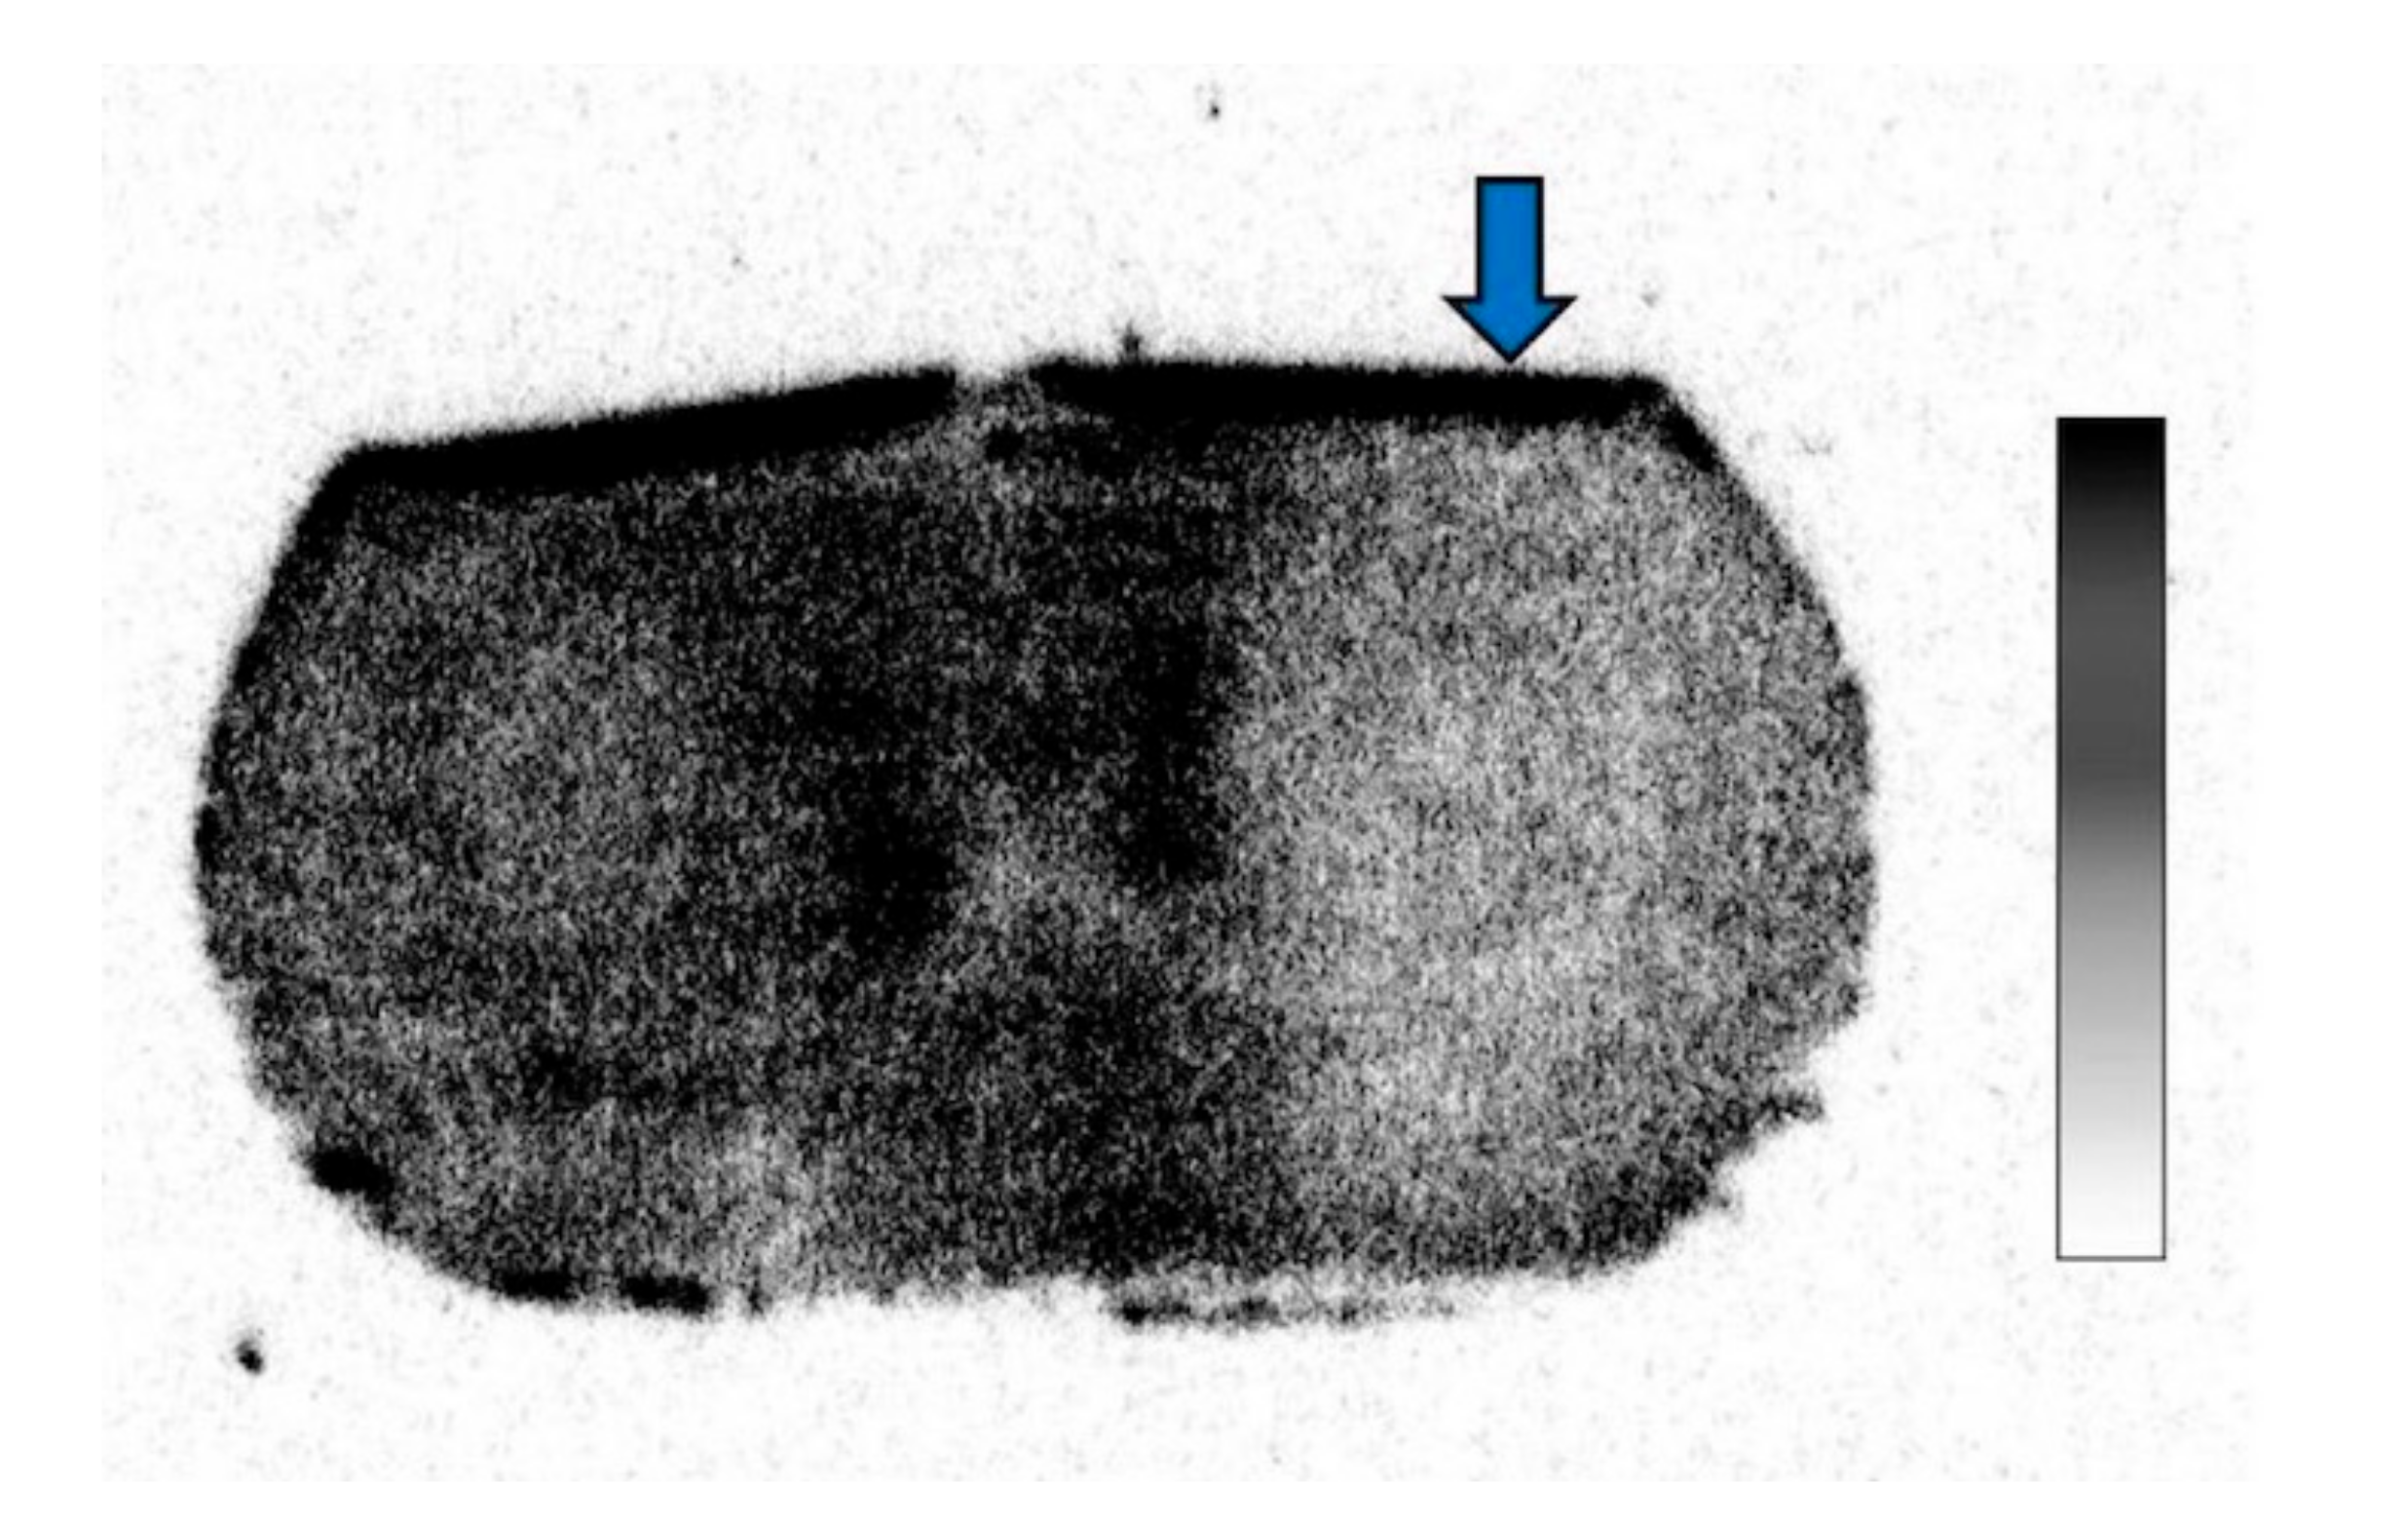
2.4. 14C-Acetate Autoradiography
2.5. PET Data Analysis
2.6. Statistics
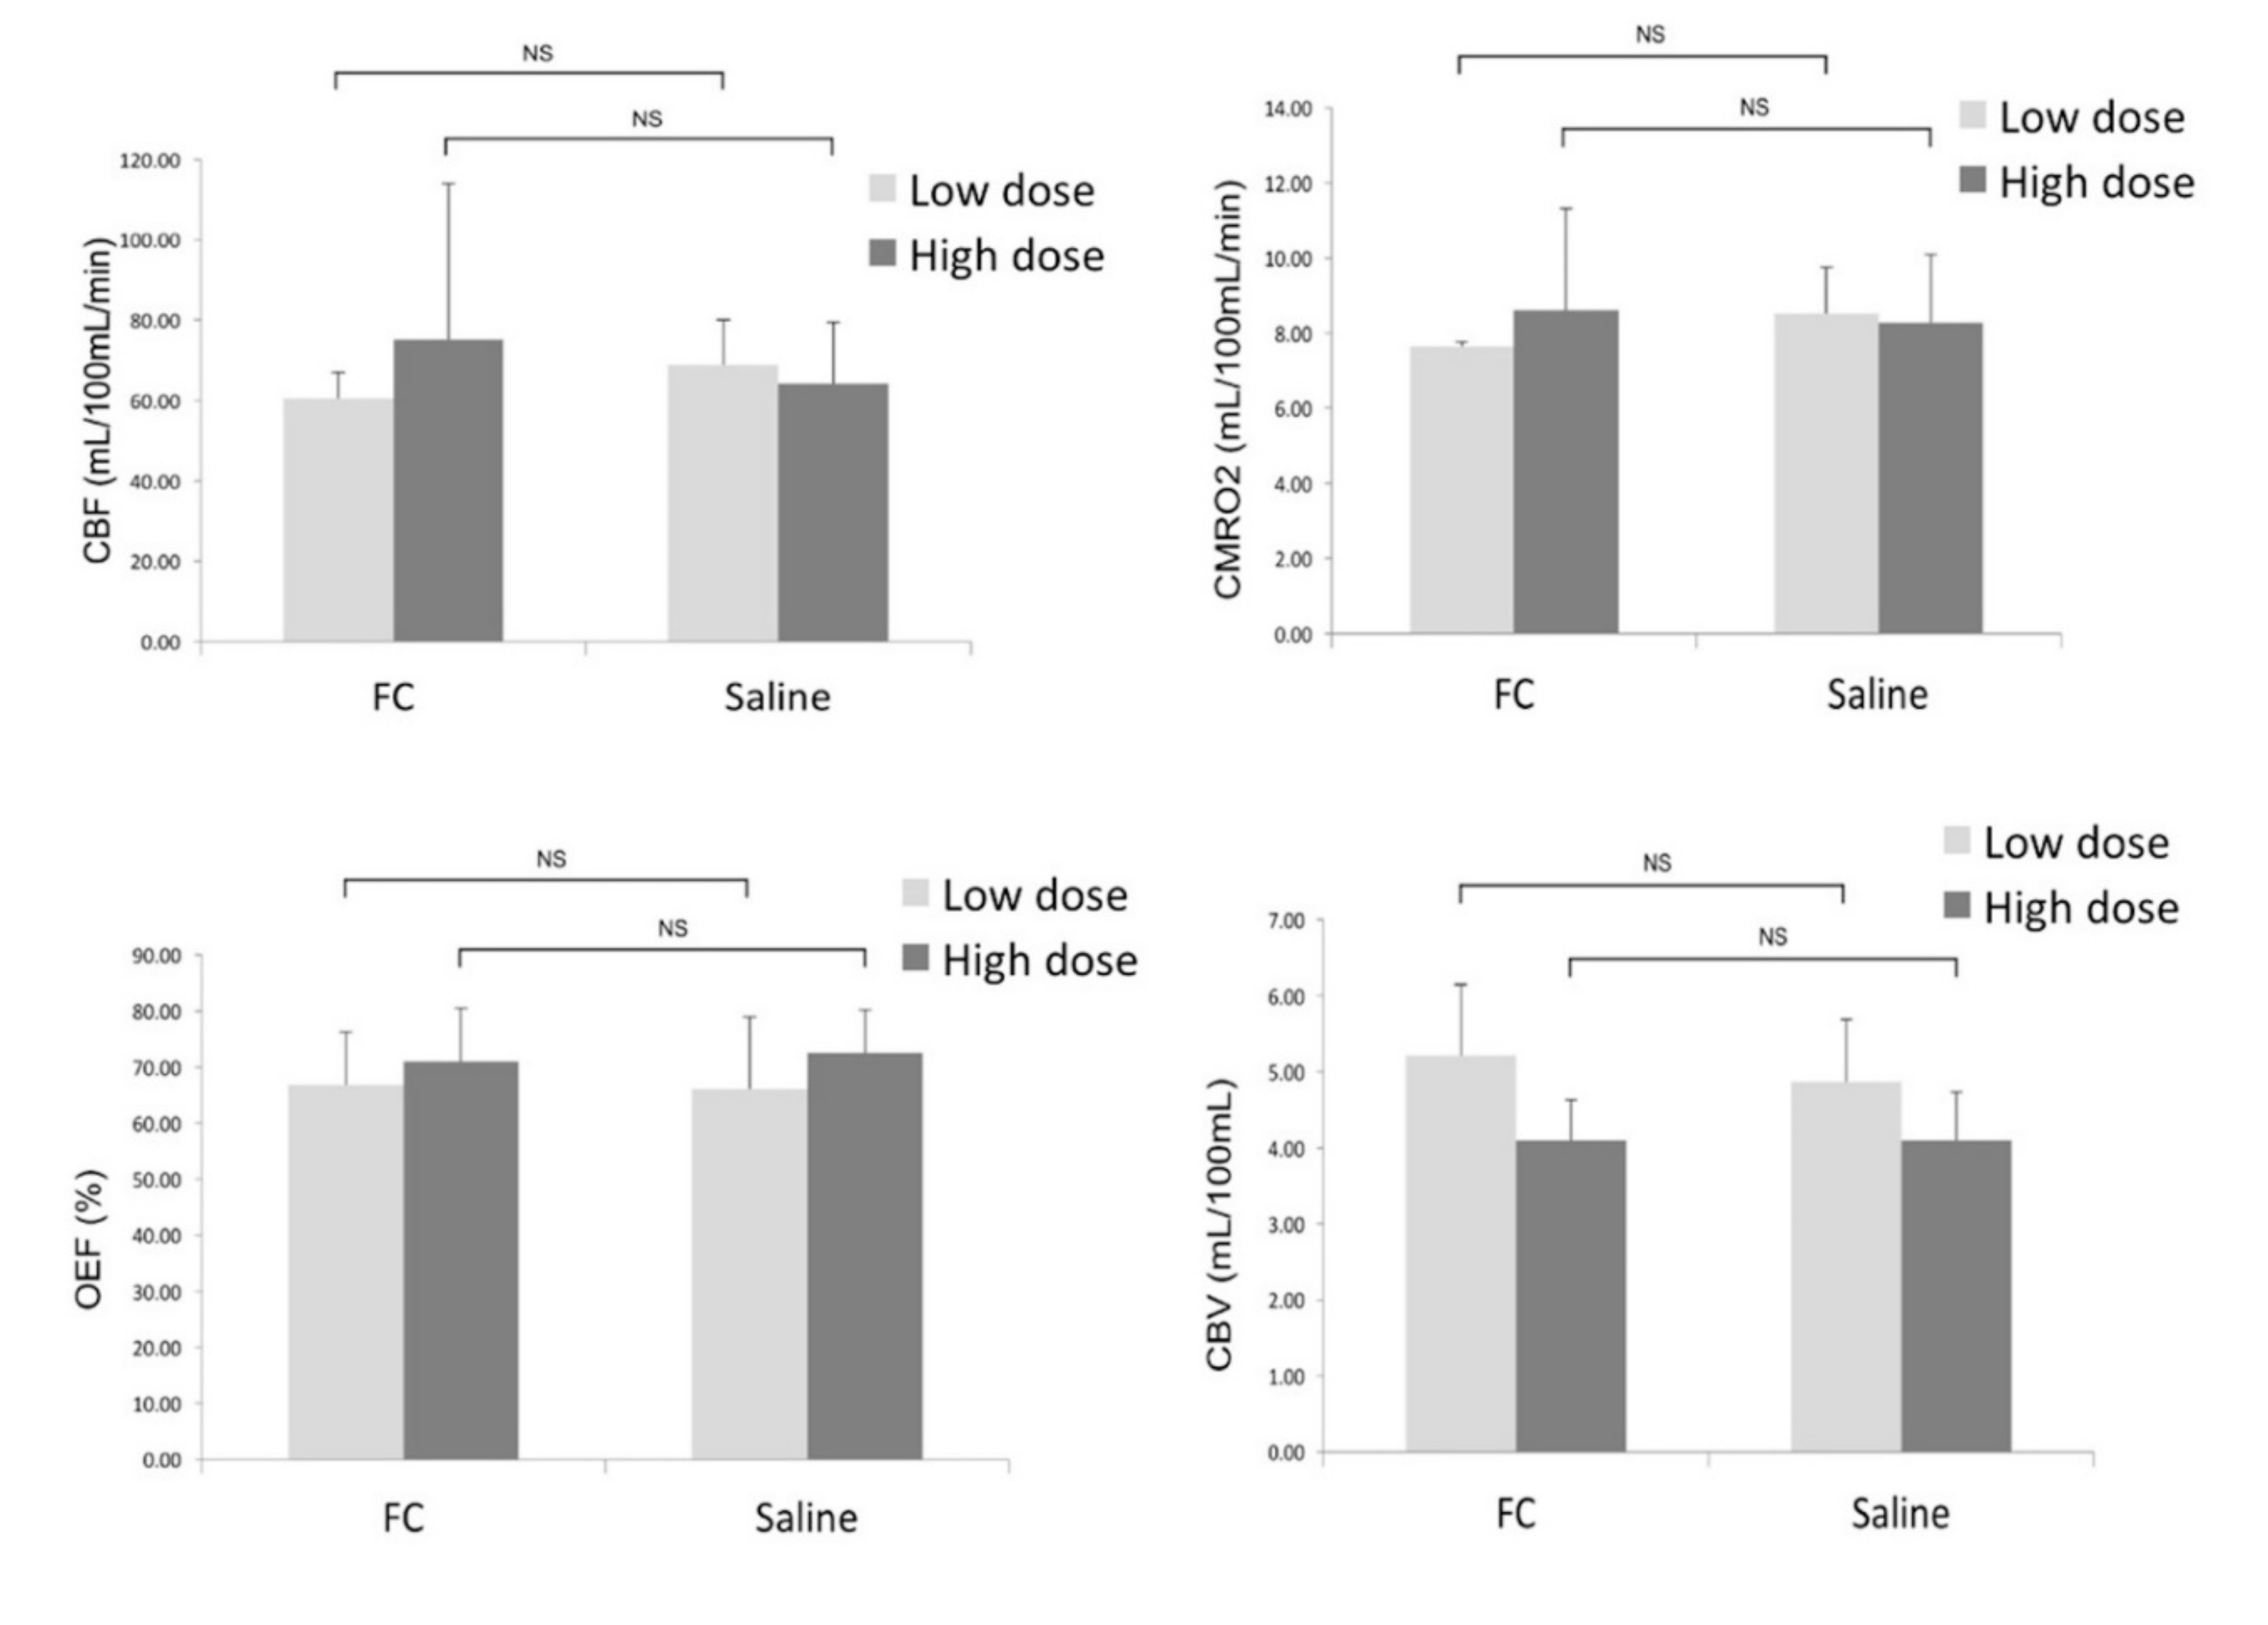
3. Results
4. Discussion
5. Conclusions
Author Contributions
Funding
Acknowledgments
Conflicts of Interest
References
- Hosoi, R.; Kashiwagi, Y.; Hatazawa, J.; Gee, A.; Inoue, O. Glial metabolic dysfunction caused neural damage by short-term ischemia in brain. Ann. Nucl. Med. 2006, 20, 377–380. [Google Scholar] [CrossRef] [PubMed]
- Stobart, J.L.; Anderson, C.M. Multifunctional role of astrocytes as gatekeepers of neuronal energy supply. Front. Cell Neurosci. 2013, 7, 38. [Google Scholar] [CrossRef] [PubMed]
- Rossi, D.; Volterra, A. Astrocytic dysfunction: Insights on the role in neurodegeneration. Brain Res. Bull. 2009, 80, 224–232. [Google Scholar] [CrossRef] [PubMed]
- Voloboueva, L.A.; Duan, M.; Ouyang, Y.; Emery, J.F.; Stoy, C.; Giffard, R.G. Overexpression of mitochondrial Hsp70/Hsp75 protects astrocytes against ischemic injury in vitro. J. Cereb. Blood Flow Metab. 2008, 28, 1009–1016. [Google Scholar] [CrossRef] [PubMed]
- Belanger, M.; Allaman, I.; Magistretti, P.J. Brain energy metabolism: Focus on astrocyte-neuron metabolic cooperation. Cell Metab. 2011, 14, 724–738. [Google Scholar] [CrossRef] [PubMed]
- Genc, S.; Kurnaz, I.A.; Ozilgen, M. Astrocyte-neuron lactate shuttle may boost more ATP supply to the neuron under hypoxic conditions—In silico study supported by in vitro expression data. BMC Syst. Biol. 2011, 5, 162. [Google Scholar] [CrossRef] [PubMed]
- Waniewski, R.A.; Martin, D.L. Preferential utilization of acetate by astrocytes is attributable to transport. J. Neurosci. 1998, 18, 5225–5233. [Google Scholar] [CrossRef] [PubMed]
- Hirose, S.; Umetani, Y.; Amitani, M.; Hosoi, R.; Momosaki, S.; Hatazawa, J.; Gee, A.; Inoue, O. Role of NMDA receptors in the increase of glucose metabolism in the rat brain induced by fluorocitrate. Neurosci. Lett. 2007, 415, 259–263. [Google Scholar] [CrossRef] [PubMed]
- Watabe, T.; Shimosegawa, E.; Watabe, H.; Kanai, Y.; Hanaoka, K.; Ueguchi, T.; Isohashi, K.; Kato, H.; Tatsumi, M.; Hatazawa, J. Quantitative evaluation of cerebral blood flow and oxygen metabolism in normal anesthetized rats: 15O-labeled gas inhalation PET with MRI Fusion. J. Nucl. Med. 2013, 54, 283–290. [Google Scholar] [CrossRef] [PubMed]
- Hirayama, Y.; Ikeda-Matsuo, Y.; Notomi, S.; Enaida, H.; Kinouchi, H.; Koizumi, S. Astrocyte-mediated ischemic tolerance. J. Neurosci. 2015, 35, 3794–3805. [Google Scholar] [CrossRef] [PubMed]
- Hosoi, R.; Okada, M.; Hatazawa, J.; Gee, A.; Inoue, O. Effect of astrocytic energy metabolism depressant on 14C-acetate uptake in intact rat brain. J. Cereb. Blood Flow Metab. 2004, 24, 188–190. [Google Scholar] [CrossRef] [PubMed]
- Horitsugi, G.; Watabe, T.; Kanai, Y.; Ikeda, H.; Kato, H.; Naka, S.; Ishibashi, M.; Matsunaga, K.; Isohashi, K.; Shimosegawa, E.; et al. Oxygen-15 labeled CO2, O2, and CO PET in small animals: Evaluation using a 3D-mode microPET scanner and impact of reconstruction algorithms. EJNMMI Res. 2017, 7, 91. [Google Scholar] [CrossRef] [PubMed]
- Turner, D.A.; Adamson, D.C. Neuronal-astrocyte metabolic interactions: Understanding the transition into abnormal astrocytoma metabolism. J. Neuropathol. Exp. Neurol. 2011, 70, 167–176. [Google Scholar] [CrossRef] [PubMed]
- Falkowska, A.; Gutowska, I.; Goschorska, M.; Nowacki, P.; Chlubek, D.; Baranowska-Bosiacka, I. Energy Metabolism of the Brain, Including the Cooperation between Astrocytes and Neurons, Especially in the Context of Glycogen Metabolism. Int. J. Mol. Sci. 2015, 16, 25959–25981. [Google Scholar] [CrossRef] [PubMed]
- Hosoi, R.; Kashiwagi, Y.; Tokumura, M.; Abe, K.; Hatazawa, J.; Inoue, O. Sensitive reduction in 14C-acetate uptake in a short-term ischemic rat brain. J. Stroke Cerebrovasc. Dis. 2007, 16, 77–81. [Google Scholar] [CrossRef] [PubMed]
- Pischiutta, F.; Micotti, E.; Hay, J.R.; Marongiu, I.; Sammali, E.; Tolomeo, D.; Vegliante, G.; Stocchetti, N.; Forloni, G.; De Simoni, M.G.; et al. Single severe traumatic brain injury produces progressive pathology with ongoing contralateral white matter damage one year after injury. Exp. Neurol. 2018, 300, 167–178. [Google Scholar] [CrossRef] [PubMed]
- Jackson, J.G.; O’Donnell, J.C.; Takano, H.; Coulter, D.A.; Robinson, M.B. Neuronal activity and glutamate uptake decrease mitochondrial mobility in astrocytes and position mitochondria near glutamate transporters. J. Neurosci. 2014, 34, 1613–1624. [Google Scholar] [CrossRef] [PubMed]
- Frykholm, P.; Hillered, L.; Langstrom, B.; Persson, L.; Valtysson, J.; Enblad, P. Relationship between cerebral blood flow and oxygen metabolism, and extracellular glucose and lactate concentrations during middle cerebral artery occlusion and reperfusion: A microdialysis and positron emission tomography study in nonhuman primates. J. Neurosurg. 2005, 102, 1076–1084. [Google Scholar] [CrossRef] [PubMed]
- Hertz, L.; Zielke, H.R. Astrocytic control of glutamatergic activity: Astrocytes as stars of the show. Trends Neurosci. 2004, 27, 735–743. [Google Scholar] [CrossRef] [PubMed]
- Willoughby, J.O.; Mackenzie, L.; Broberg, M.; Thoren, A.E.; Medvedev, A.; Sims, N.R.; Nilsson, M. Fluorocitrate-mediated astroglial dysfunction causes seizures. J. Neurosci. Res. 2003, 74, 160–166. [Google Scholar] [CrossRef] [PubMed]


| Parameters | Average ± Standard Deviation |
|---|---|
| pH | 7.44 ± 0.05 |
| pCO2 (mmHg) | 40.4 ± 6 |
| pO2 (mmHg) | 111.2 ± 28 |
| sO2 (%) | 98 ± 1 |
| Hematocrit (%PCV) | 41.1 ± 2.0 |
| Hemoglobin (g/dL) | 14.0 ± 0.9 |
| Heart rate (bpm) | 360 ± 51 |
| SBP (mmHg) | 131 ± 29 |
| DBP (mmHg) | 102 ± 20 |
© 2019 by the authors. Licensee MDPI, Basel, Switzerland. This article is an open access article distributed under the terms and conditions of the Creative Commons Attribution (CC BY) license (http://creativecommons.org/licenses/by/4.0/).
Share and Cite
Macaisa, C.M.; Watabe, T.; Liu, Y.; Romanov, V.; Kanai, Y.; Horitsugi, G.; Kato, H.; Shimosegawa, E.; Hatazawa, J. Preserved Cerebral Oxygen Metabolism in Astrocytic Dysfunction: A Combination Study of 15O-Gas PET with 14C-Acetate Autoradiography. Brain Sci. 2019, 9, 101. https://doi.org/10.3390/brainsci9050101
Macaisa CM, Watabe T, Liu Y, Romanov V, Kanai Y, Horitsugi G, Kato H, Shimosegawa E, Hatazawa J. Preserved Cerebral Oxygen Metabolism in Astrocytic Dysfunction: A Combination Study of 15O-Gas PET with 14C-Acetate Autoradiography. Brain Sciences. 2019; 9(5):101. https://doi.org/10.3390/brainsci9050101
Chicago/Turabian StyleMacaisa, Carla Mari, Tadashi Watabe, Yuwei Liu, Victor Romanov, Yasukazu Kanai, Genki Horitsugi, Hiroki Kato, Eku Shimosegawa, and Jun Hatazawa. 2019. "Preserved Cerebral Oxygen Metabolism in Astrocytic Dysfunction: A Combination Study of 15O-Gas PET with 14C-Acetate Autoradiography" Brain Sciences 9, no. 5: 101. https://doi.org/10.3390/brainsci9050101