Article

Visual Motor Reaction Times Predict Receptive and Expressive Language Development in Early School-Age Children

by
Areej A. Alhamdan
1,2,*,
Melanie J. Murphy
1 and
Sheila G. Crewther
1,3,*
1
Department of Psychology, Counselling and Therapy, La Trobe University, Melbourne, VIC 3086, Australia
2
Department of Psychology, Imam Muhammad Ibn Saud Islamic University, Riyadh 11564, Saudi Arabia
3
Centre for Human Psychopharmacology, Swinburne University of Technology, Melbourne, VIC 3122, Australia
*
Authors to whom correspondence should be addressed.
Brain Sci. 2023, 13(6), 965; https://doi.org/10.3390/brainsci13060965
Submission received: 29 May 2023 / Revised: 12 June 2023 / Accepted: 15 June 2023 / Published: 19 June 2023

Abstract

:
Proficiency of multisensory processing and motor skill are often associated with early cognitive, social, and language development. However, little research exists regarding the relationship between multisensory motor reaction times (MRTs) to auditory, visual and audiovisual stimuli, and classical measures of receptive language and expressive vocabulary development in school-age children. Thus, this study aimed to examine the concurrent development of performance in classical tests of receptive (Peabody Picture Vocabulary Test; abbreviated as PPVT) and expressive vocabulary (Expressive Vocabulary Test; abbreviated as EVT), nonverbal intelligence (NVIQ) (determined with the aid of Raven’s Colored Progressive Matrices; abbreviated as RCPM), speed of visual–verbal processing in the Rapid Automatic Naming (RAN) test, Eye–Hand Co-ordination (EHC) in the SLURP task, and multisensory MRTs, in children (n = 75), aged between 5 and 10 years. Bayesian statistical analysis showed evidence for age group differences in EVT performance, while PPVT was only different for the youngest group of children aged 5–6, supporting different developmental trajectories in vocabulary acquisition. Bayesian correlations revealed evidence for associations between age, NVIQ, and vocabulary measures, with decisive evidence and a higher correlation (r = 0.57 to 0.68) between EVT, MRT tasks, and EHC visuomotor processing. This was further supported by regression analyses indicating that EVT performance was the strongest unique predictor of multisensory MRTs, EHC, and RAN time. Additionally, visual MRTs were found to predict both receptive and expressive vocabulary. The findings of the study have important implications as accessible school-based assessments of the concurrent development of NVIQ, language, and multisensory processing; and hence as rapid and timely measures of developmental and neurodevelopmental status.

1. Introduction

Language is defined as a system of communication to facilitate social interaction and self-expression [1,2] that incorporates symbols, gestures, and sounds, including spoken and written words (vocabulary) or icons. Language development begins in early infancy through toddlerhood with the gradual learning and understanding of single words (receptive vocabulary) and continues with the more rapid acquisition of semantic understanding of words that can express desires or ideas (expressive vocabulary) through childhood into adolescence [3,4,5]. However, what is less well understood is the concurrent development of visually driven intelligence and language acquisition and goal-directed multisensory actions in early school-age children.
Indeed, early developmental research by Kail (1994) proposed that both the linguistic and cognitive processing of children with Specific Language Impairments (SLIs) were characterized by the generalized domain-general deficit ‘slowing’ of reaction times (RTs) on nonverbal tasks (involving visual or/and auditory stimuli) [6]. This hypothesis has since been supported by a number of cognitive studies including a recent meta-analytical review of 46 published studies in children (mean age 8.9 years) that found that individuals with Developmental Language Disorder (DLD) exhibit slower motor RTs in nonverbal tasks, which contributed to observed deficits in language processing, motor skills, and executive functioning [7]. Additionally, a longitudinal study noted that a faster and more accurate performance in looking-while-listening tasks in infants aged 15, 18, 21, and 25 months was associated with a faster and more accelerated maturation in expressive vocabulary across the second year of life [8]. Similarly, the early achievement of sensorimotor milestones and early language learning including word acquisition has been reported [9], while multisensory motor reaction times (MRTs) and vocabulary word number at 25 months have been shown to predict later cognitive outcomes, such as generalised intelligence using the Mental Processing Index (MPI) and working memory measures at 8 years of age [10]. Gross motor abilities [11,12] and multisensory attention skills [13] have also been found to predict receptive and expressive vocabulary performance in children aged 1 to 5 years (for a review, see [14]), while automated eye-tracking technology has demonstrated an association between audiovisual asynchrony processing in speech perception tasks and scores on measures of the receptive and expressive language abilities of young children aged 1 to 7 years [15].
The idea of domain-general development has been confirmed by brain imaging by Imada et al. (2006), that reported that the sensory-motor system already begins developing rapidly at around 5–6 months of age and that the neural networks underlying multisensory motor and language information processing in the superior temporal and inferior frontal region [16] in infants and adults are linked to the motor system through multiple connections between the dorsal and ventral prefrontal and premotor cortices [17,18]. However, the relationships between the development of multisensory vision/hearing, mouth/tongue vocalization motor skills, and language processing have seldom been investigated in neurotypical school-age children, though our recent studies [19,20] have identified age, nonverbal intelligence (NVIQ) on the Raven’s Progressive Colored Matrices (RPCM), and visual working memory as the strongest predictors of multisensory MRT tasks.
Thus, the aim of this study was to explore the concurrent development of classical measures of receptive (Peabody Picture Vocabulary Test (PPVT)) and Expressive Vocabulary Test (EVT) performance, as well as the speed of multisensory MRTs processing in terms of age and NVIQ of neurotypical young children (5–10 years). The current study also aimed to use basic motor reaction times to visual, auditory, and audiovisual stimuli and other more complex cognitively associated measures of time (e.g., time taken to complete the motor tracing of shapes in a novel Eye–Hand Coordination (EHC SLURP) task), and visual–verbal speed which was assessed using the Rapid Automatic Naming (RAN) test of familiar objects. Motor and cognitive processing speeds have previously been shown to decrease with age, i.e., performance improves with age [19,20]. The RAN test was included as a quantitative measure of early visual-verbal processing, i.e., total time needed to firstly visually process a familiar expected object and secondly to access the lexical storage system [21,22], rather than as a traditionally predictive measure of reading performance and other language-related tasks in dyslexia [23] and deficits in phonological processing [24].
Building upon these findings [24,25], the current study sought to enhance the understanding of the concurrent development of classical vocabulary measures (e.g., PPVT, EVT, NVIQ, multisensory processing, and EHC SLURP) in three groups of early school-aged children (5–6, 7–8, and 9–10). Specifically, our aims were as follows:
  • To investigate the apparent developmental changes in vocabulary measures using PPVT and EVT tests and the RAN task. It was hypothesized that children in all groups would demonstrate significant improvements in language and RAN measures with increasing age. In line with the findings of Reinhartsen et al. (2019) [25], we expected the children’s receptive and expressive vocabulary tests would demonstrate age-related developmental trajectories.
  • To explore the relationships between age, NVIQ, MRT measures of multisensory processing EHC, and classical vocabulary measures. Based on both the generalized slowing hypothesis by both Kail (1994) and LeBarton and Iverson (2013) [6,26], we hypothesized that age and higher raw scores on the NVIQ would be highly associated with a more complex expressive vocabulary (as opposed to a more simple receptive vocabulary) and faster MRTs in multisensory tasks and the completion of EHC SLURP items.
  • Lastly, to investigate whether performance in vocabulary tasks predicts MRT measures of multisensory processing and EHC SLURP and whether simple multisensory processes (measured as MRTs, EHC SLURP and RAN) are predictive of developmental vocabulary measures. We hypothesized that a measure of expressive vocabulary (EVT) that requires verbal expression and the integration of visual perceptual and auditory output [5] would contribute more to the rate of multisensory and visuo-motor processing than receptive language. On the basis of our previous study [20], we also expected that visual MRTs would contribute more to vocabulary measures (PPVT and EVT) than auditory MRTs.

2. Method

2.1. Participants

In this study, a total of 75 participants (59% male) enrolled in foundation/Prep year to Grade 4 were recruited from both Catholic and Public Elementary Schools in metropolitan Melbourne, Australia. The participants were categorized into three age groups: 5–6 years (n = 25), 7–8 years (n = 26), and 9–10 years (n = 24). Ethical approval for the project was obtained from the Human Ethics Committee of La Trobe University (HEC 18139, HEC 16121), Victorian Department of Education and Catholic Education Melbourne. Individual school principals assisted with the distribution of study information and consent forms to parents and guardians. The inclusion criteria were as follows: children between the ages of 5 and 10 years who showed normal or corrected-to-normal vision and hearing, along with adequate color vision, and no clinical diagnosis of neurodevelopmental disorders such as language impairments, autism spectrum disorder (ASD), or intellectual disability, as indicated by a non-verbal IQ (NVIQ) standard score ≥ 85. The children who took part in the research were restricted to those whose parents gave consent by signing the forms stating that “my child is allowed to participate in the study” and also filling out the accompanying questionnaire about their child’s medical history and any possible developmental problems. Children’s verbal consent to the testing was ascertained prior to each testing session. Under the Helsinki Declaration, withdrawal of permission to participate was available to all parents or children at any time.

2.2. Screening and Psychometric Tests

2.2.1. Vision and Hearing Screening

Hearing and vision screenings were conducted to ensure that the children had normal hearing and normal-or-corrected to normal vision. First, vision screening involved assessing distance and near visual acuity with Lea Symbols chart [27], while color vision was assessed with Ishihara tests. Second, during the auditory screening, a commercially available portable audiometer (Interacoustic Screening Audiometer, model AS208) manufactured by Interacoustic (A/S, Assens, Denmark) with Peltor (H7A) sound-attenuating headphones with a frequency range of (250–8000 Hz) and 20 dB sound pressure levels for each octave were used to assess a child’s hearing ability. Hearing screening procedures were followed based on the Guidelines for the School Setting of Hearing Screening, Division of Community and Public Health, Missouri Department of Health and Senior Services.

2.2.2. Nonverbal Intelligence (RCPM)

NVIQ of all participants was evaluated using Raven’s Colored Progressive Matrix (RCPM) [28]. In addition to being a relatively quick, well-normed test able to measure nonverbal reasoning abilities in Australian schoolchildren [29], the RCPM is also accepted internationally as demonstrating highly reliable measures of nonverbal intellectual ability in children aged 5–11 [30]. The selection of this test was based on its culture-free items and the fact that cognitive visual manipulation is required rather than language cues. RCPM was administered as an untimed test divided into three sets, each containing 12 problems that progressively increase in complexity and difficulty. For each item, participants were required to choose what they thought was the best of six alternatives available to complete the matrix. Factor analysis indicates that the RCPM measures four distinct intellectual abilities: proficiency in completing simple continuous patterns, proficiency in completing discrete patterns, proficiency in completing simple and complex structures, and proficiency in reasoning by analogy [31,32], which makes the test a very good measure of nonverbal intelligence for problem solving.

2.3. Experimental Measures

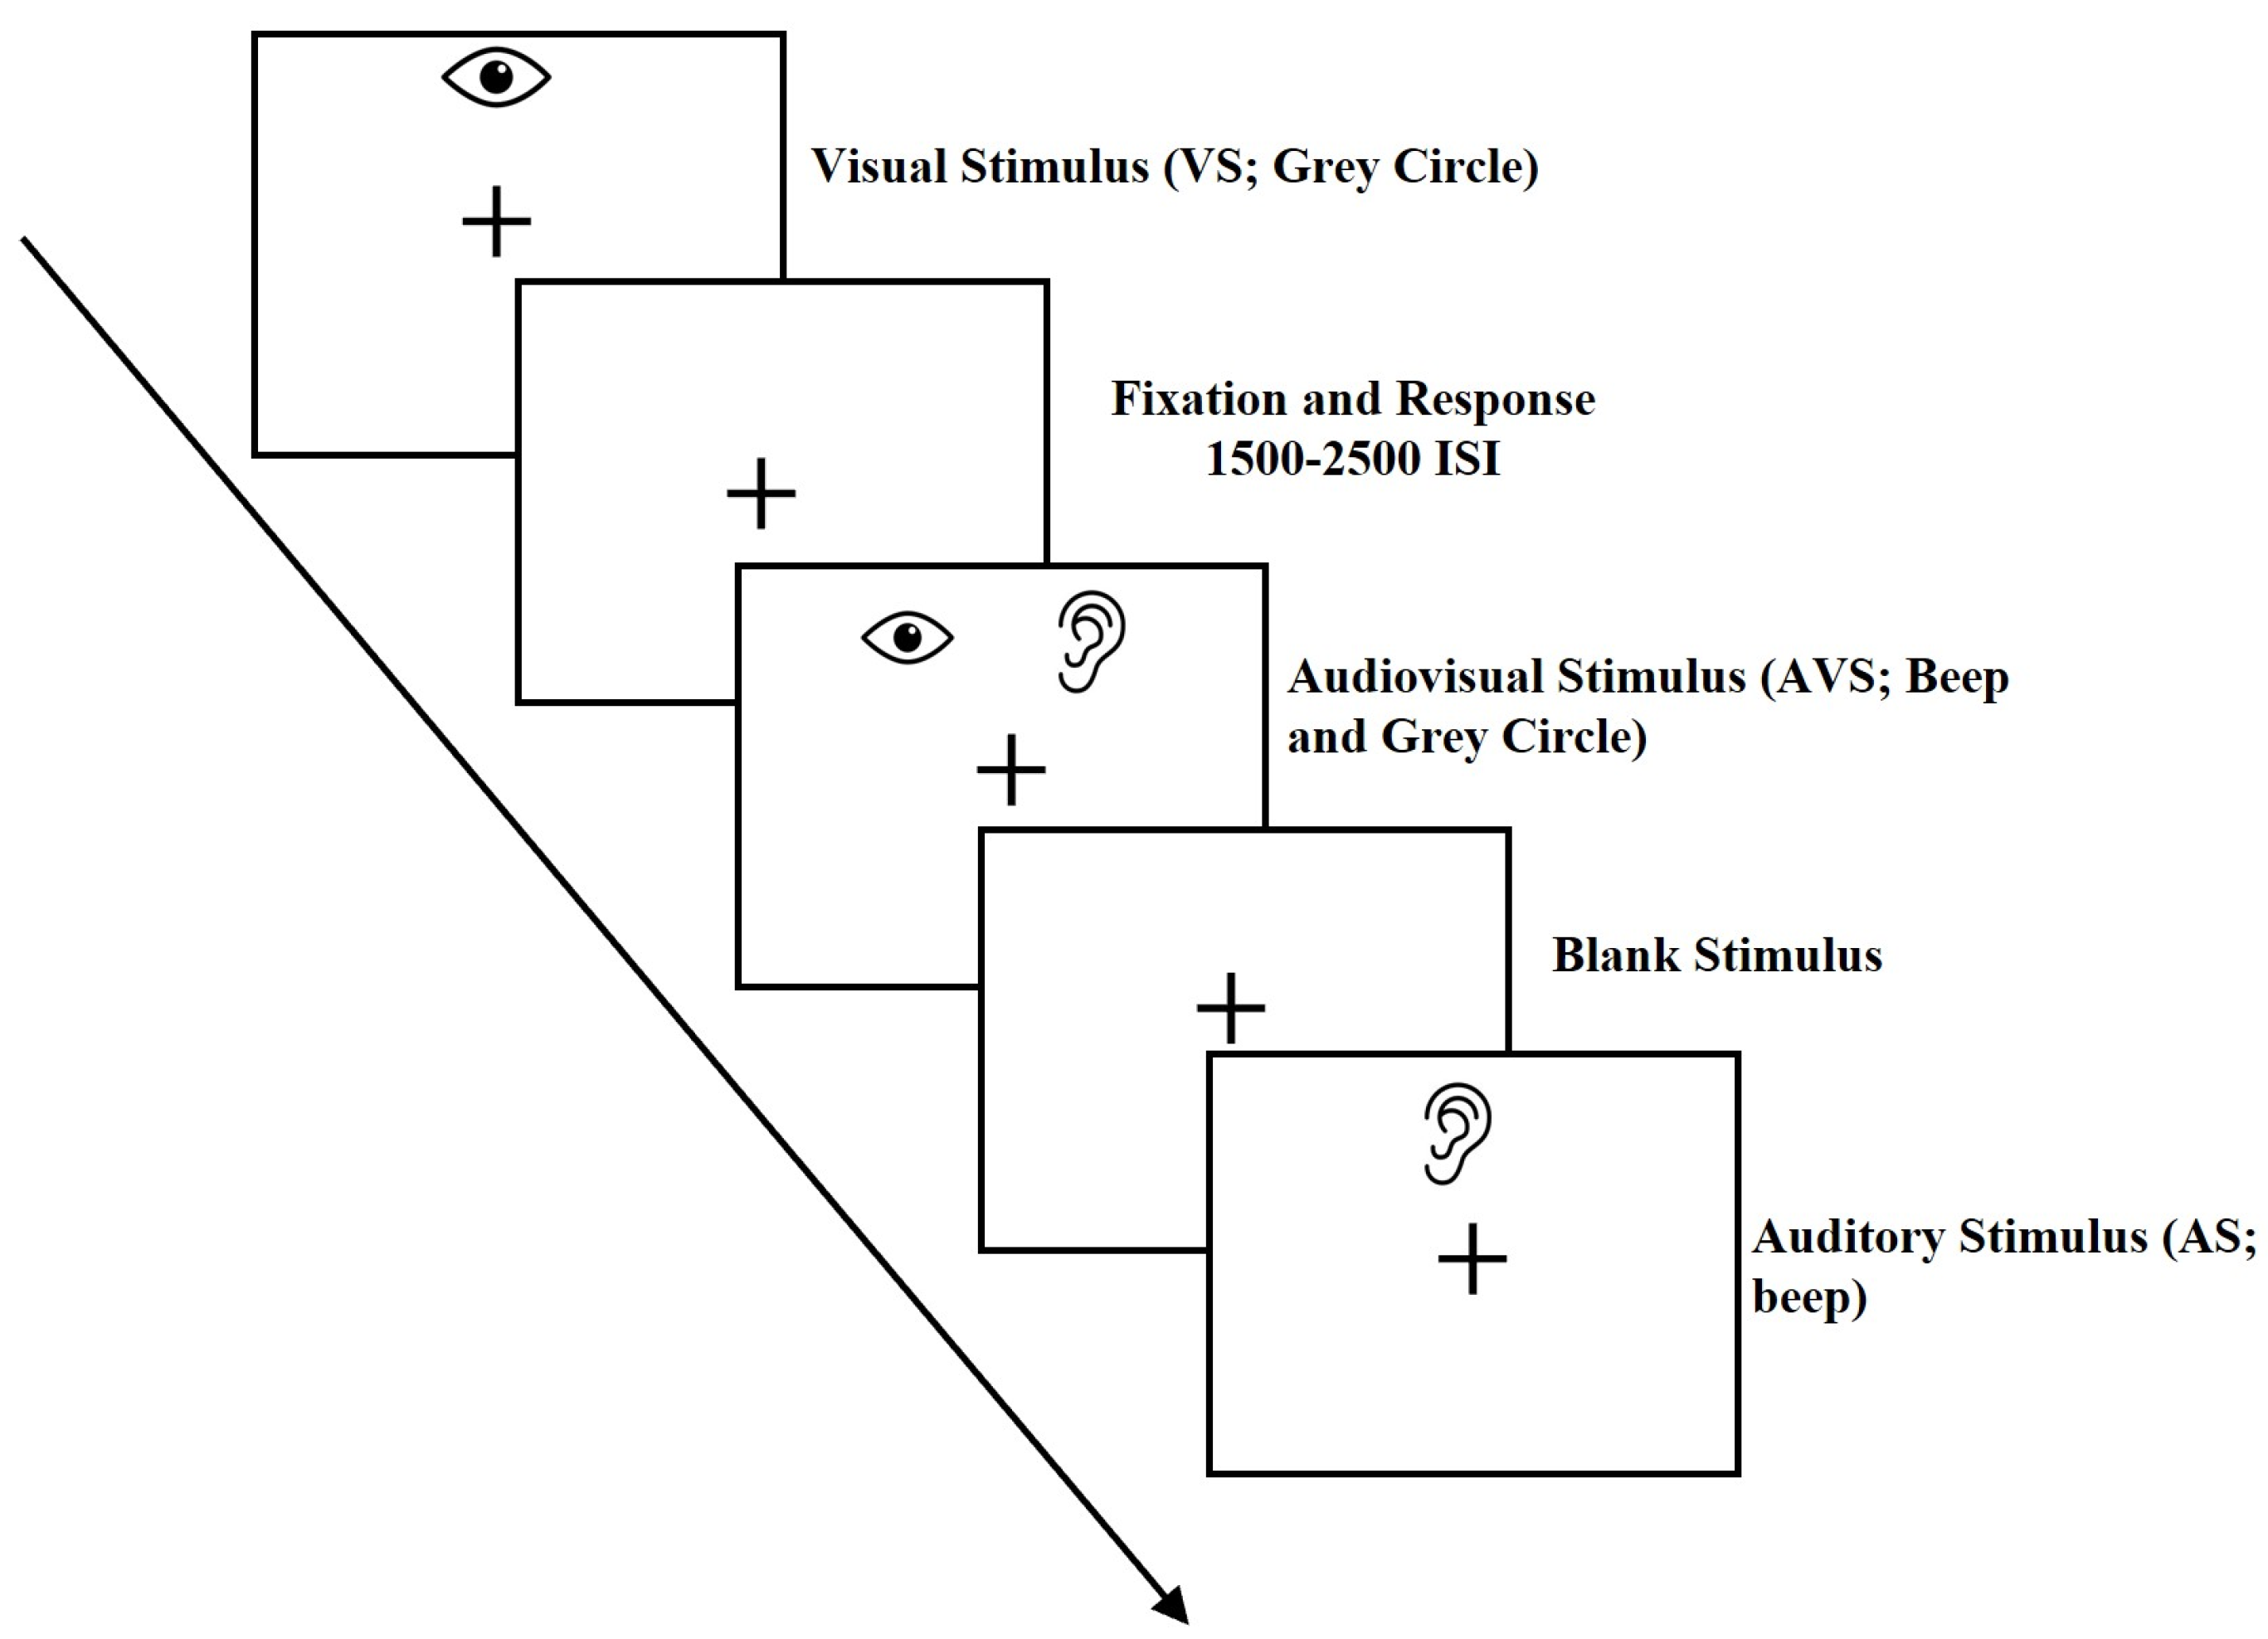
2.3.1. Multisensory Task

To assess the multisensory processing threshold, we used a target detection task that involved measuring the speed of participants MRTs. The methodology employed for this task was based on prior research [33] and our own earlier studies [19,20]. The task presented three types of stimuli: an auditory stimulus alone (AS; beep), a visual stimulus alone (VS; gray circle), and both audio-visual stimulus (AVS; beep and gray circle presented simultaneously) (see Figure 1). To indicate the stimulus and record responses, children were instructed to press a button as rapidly and accurately as possible on the handheld RESPONSEPixx button box (Model VPX-ACC-3100). VPixxTM software (V 3.20) and RESPONSEPixx hardware (VPixx, Vision Science Solutions, Quebec, Canada) were used to present and control stimuli for the task. To ensure that all participants, particularly those in the youngest age group, understood and could accurately perform the task, a practice trial was conducted for all three types of stimuli (AS, VS, and AVS) prior to testing. Closed headphones were used to present the auditory stimulus (AS) consisting of a 1500 Hz tone with a 5 ms rise and fall time. To ensure conscious attention during the task, the visual target stimulus was displayed as a Gaussian circle presented at various positions on the screen (away from the center). The mean MRTs for each condition of the task, i.e., visual-only, auditory-only, and audiovisual stimuli, were determined as the time interval between the onset of a stimulus and the button press response. Only MRTs scores within the range of 150 ms to 1500 ms were considered when calculating the mean reaction time for each participant. In terms of accuracy, error rates below 50% (i.e., seven out of fifteen errors) were excluded from the analysis. The multisensory task demonstrated high internal reliability with a Cronbach alpha score of 0.93, and the scores for AS, VS, and AVS ranged from 0.87 to 0.9 [19].

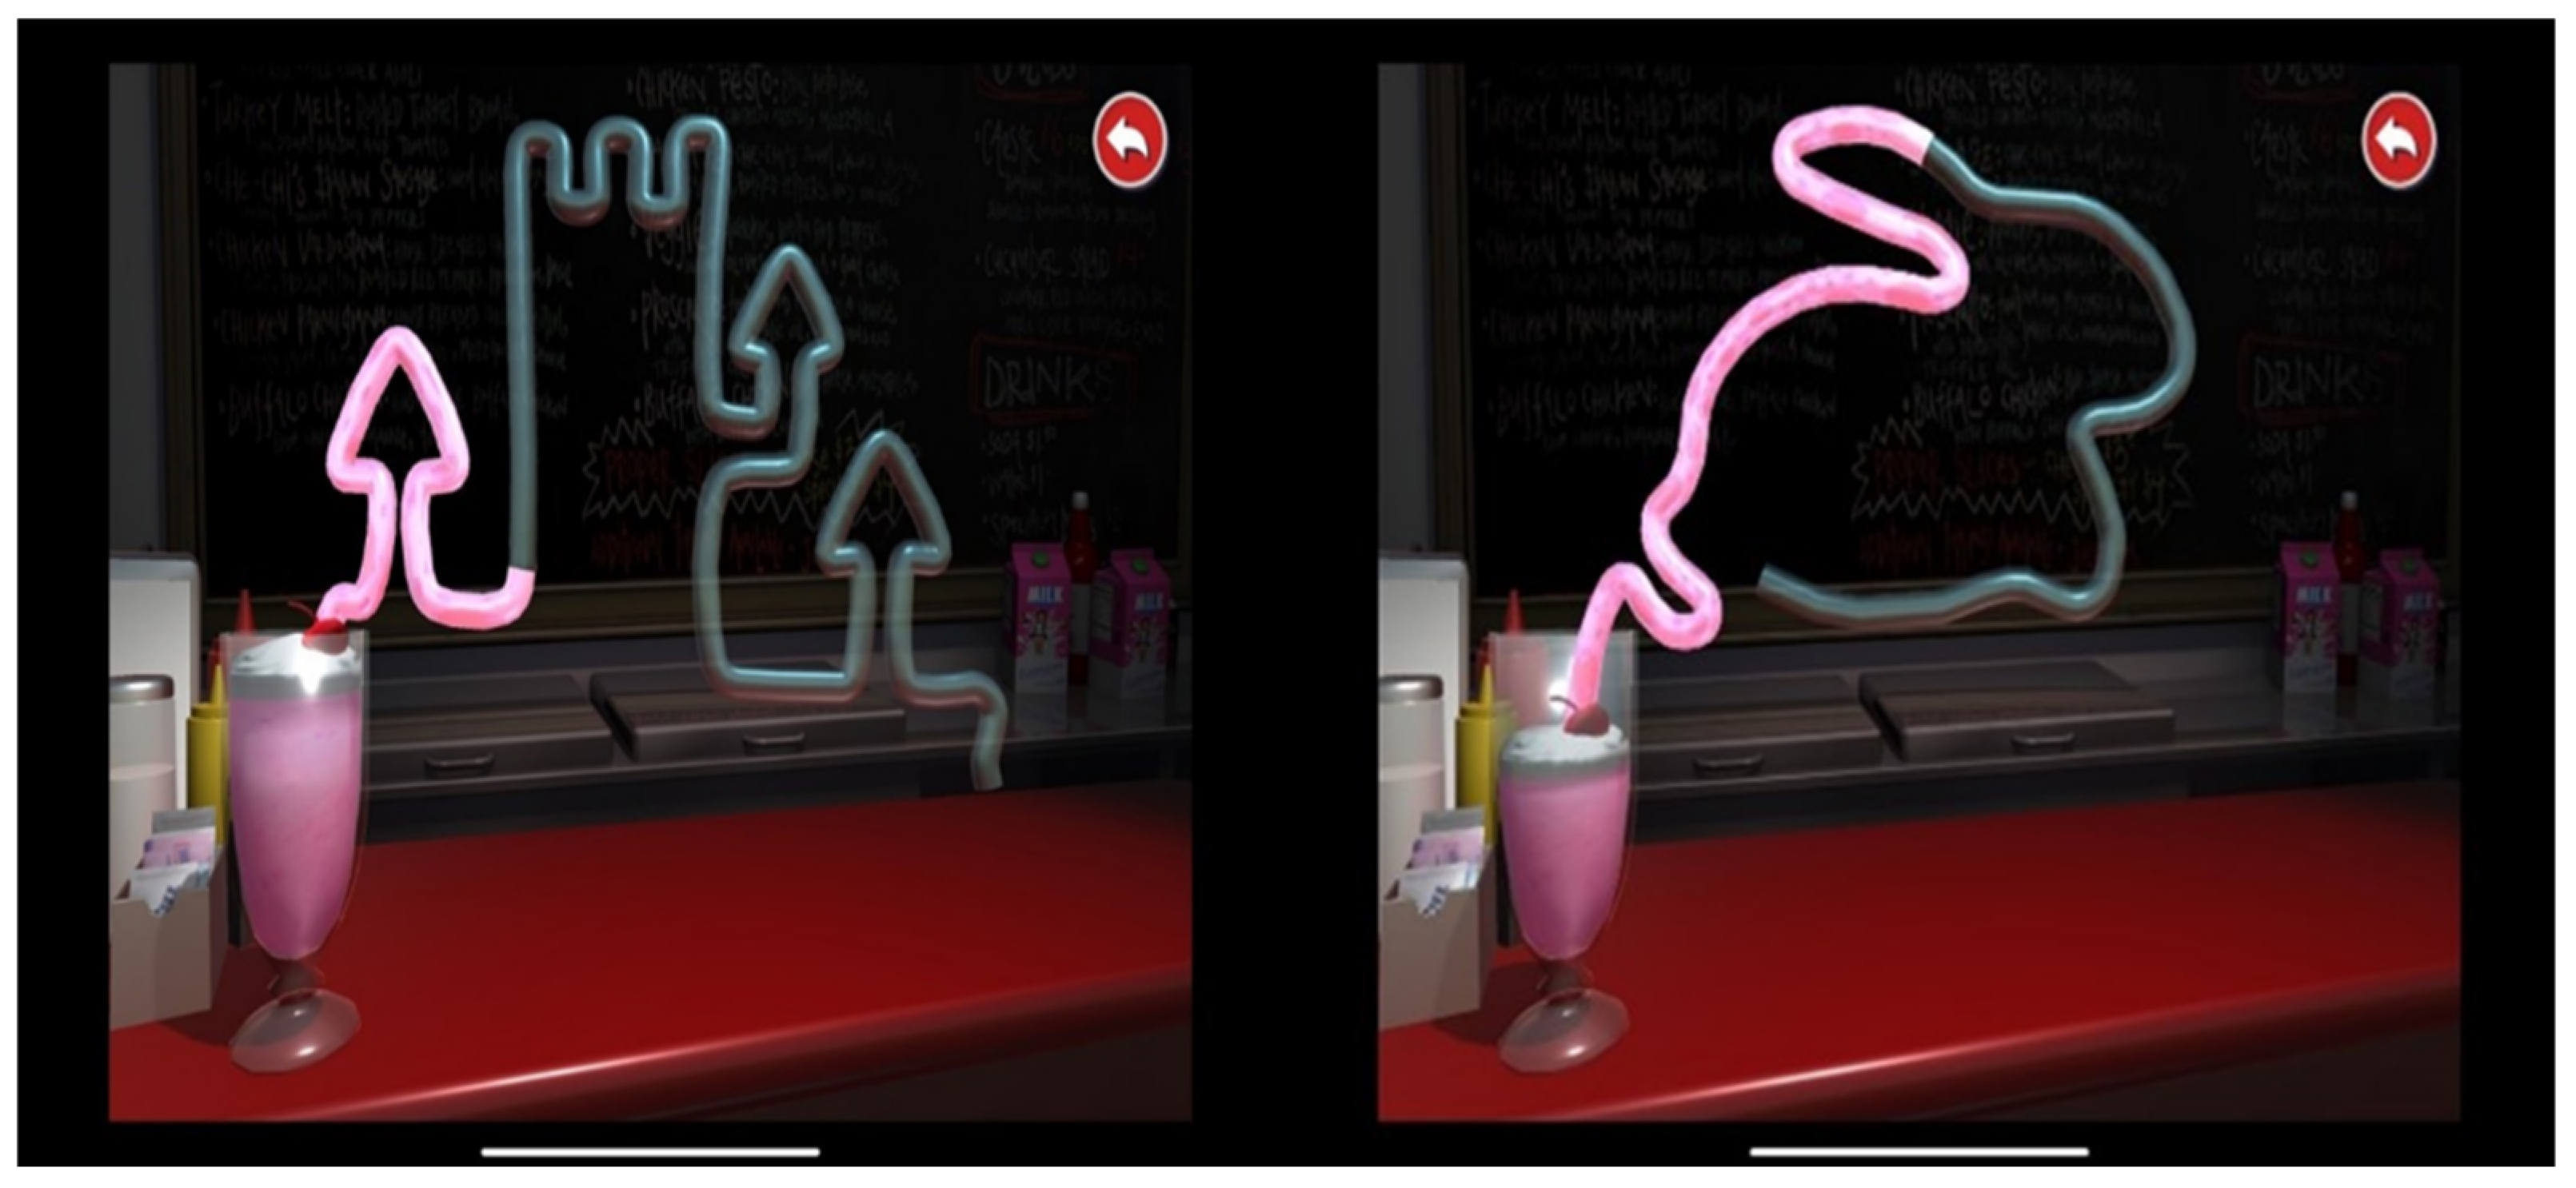
2.3.2. Visuomotor Processing Using the SLURP Eye–Hand Coordination (EHC) App

The Lee–Ryan Eye–Hand Coordination Test [34] (SLURP) was used to evaluate fine visually driven motor ability (visuomotor). SLURP was purchased from Apple App Store for $2.10 USD (dated 13 August 2020), and it has been shown that this task is a reliable valid and effective measure of visuomotor integration skills in both children and adults [34,35]. The task requires children to trace five shapes in a particular order after practicing a Castle shape. The Castle item was selected to familiarize children with the procedure and because this relatively difficult item requires many changes in direction while tracing across an iPad screen of 12 inches [35] (see Figure 2). For each child, the time taken to complete five shapes (circle, triangle, square, rabbit, and snail) was extracted and analyzed.

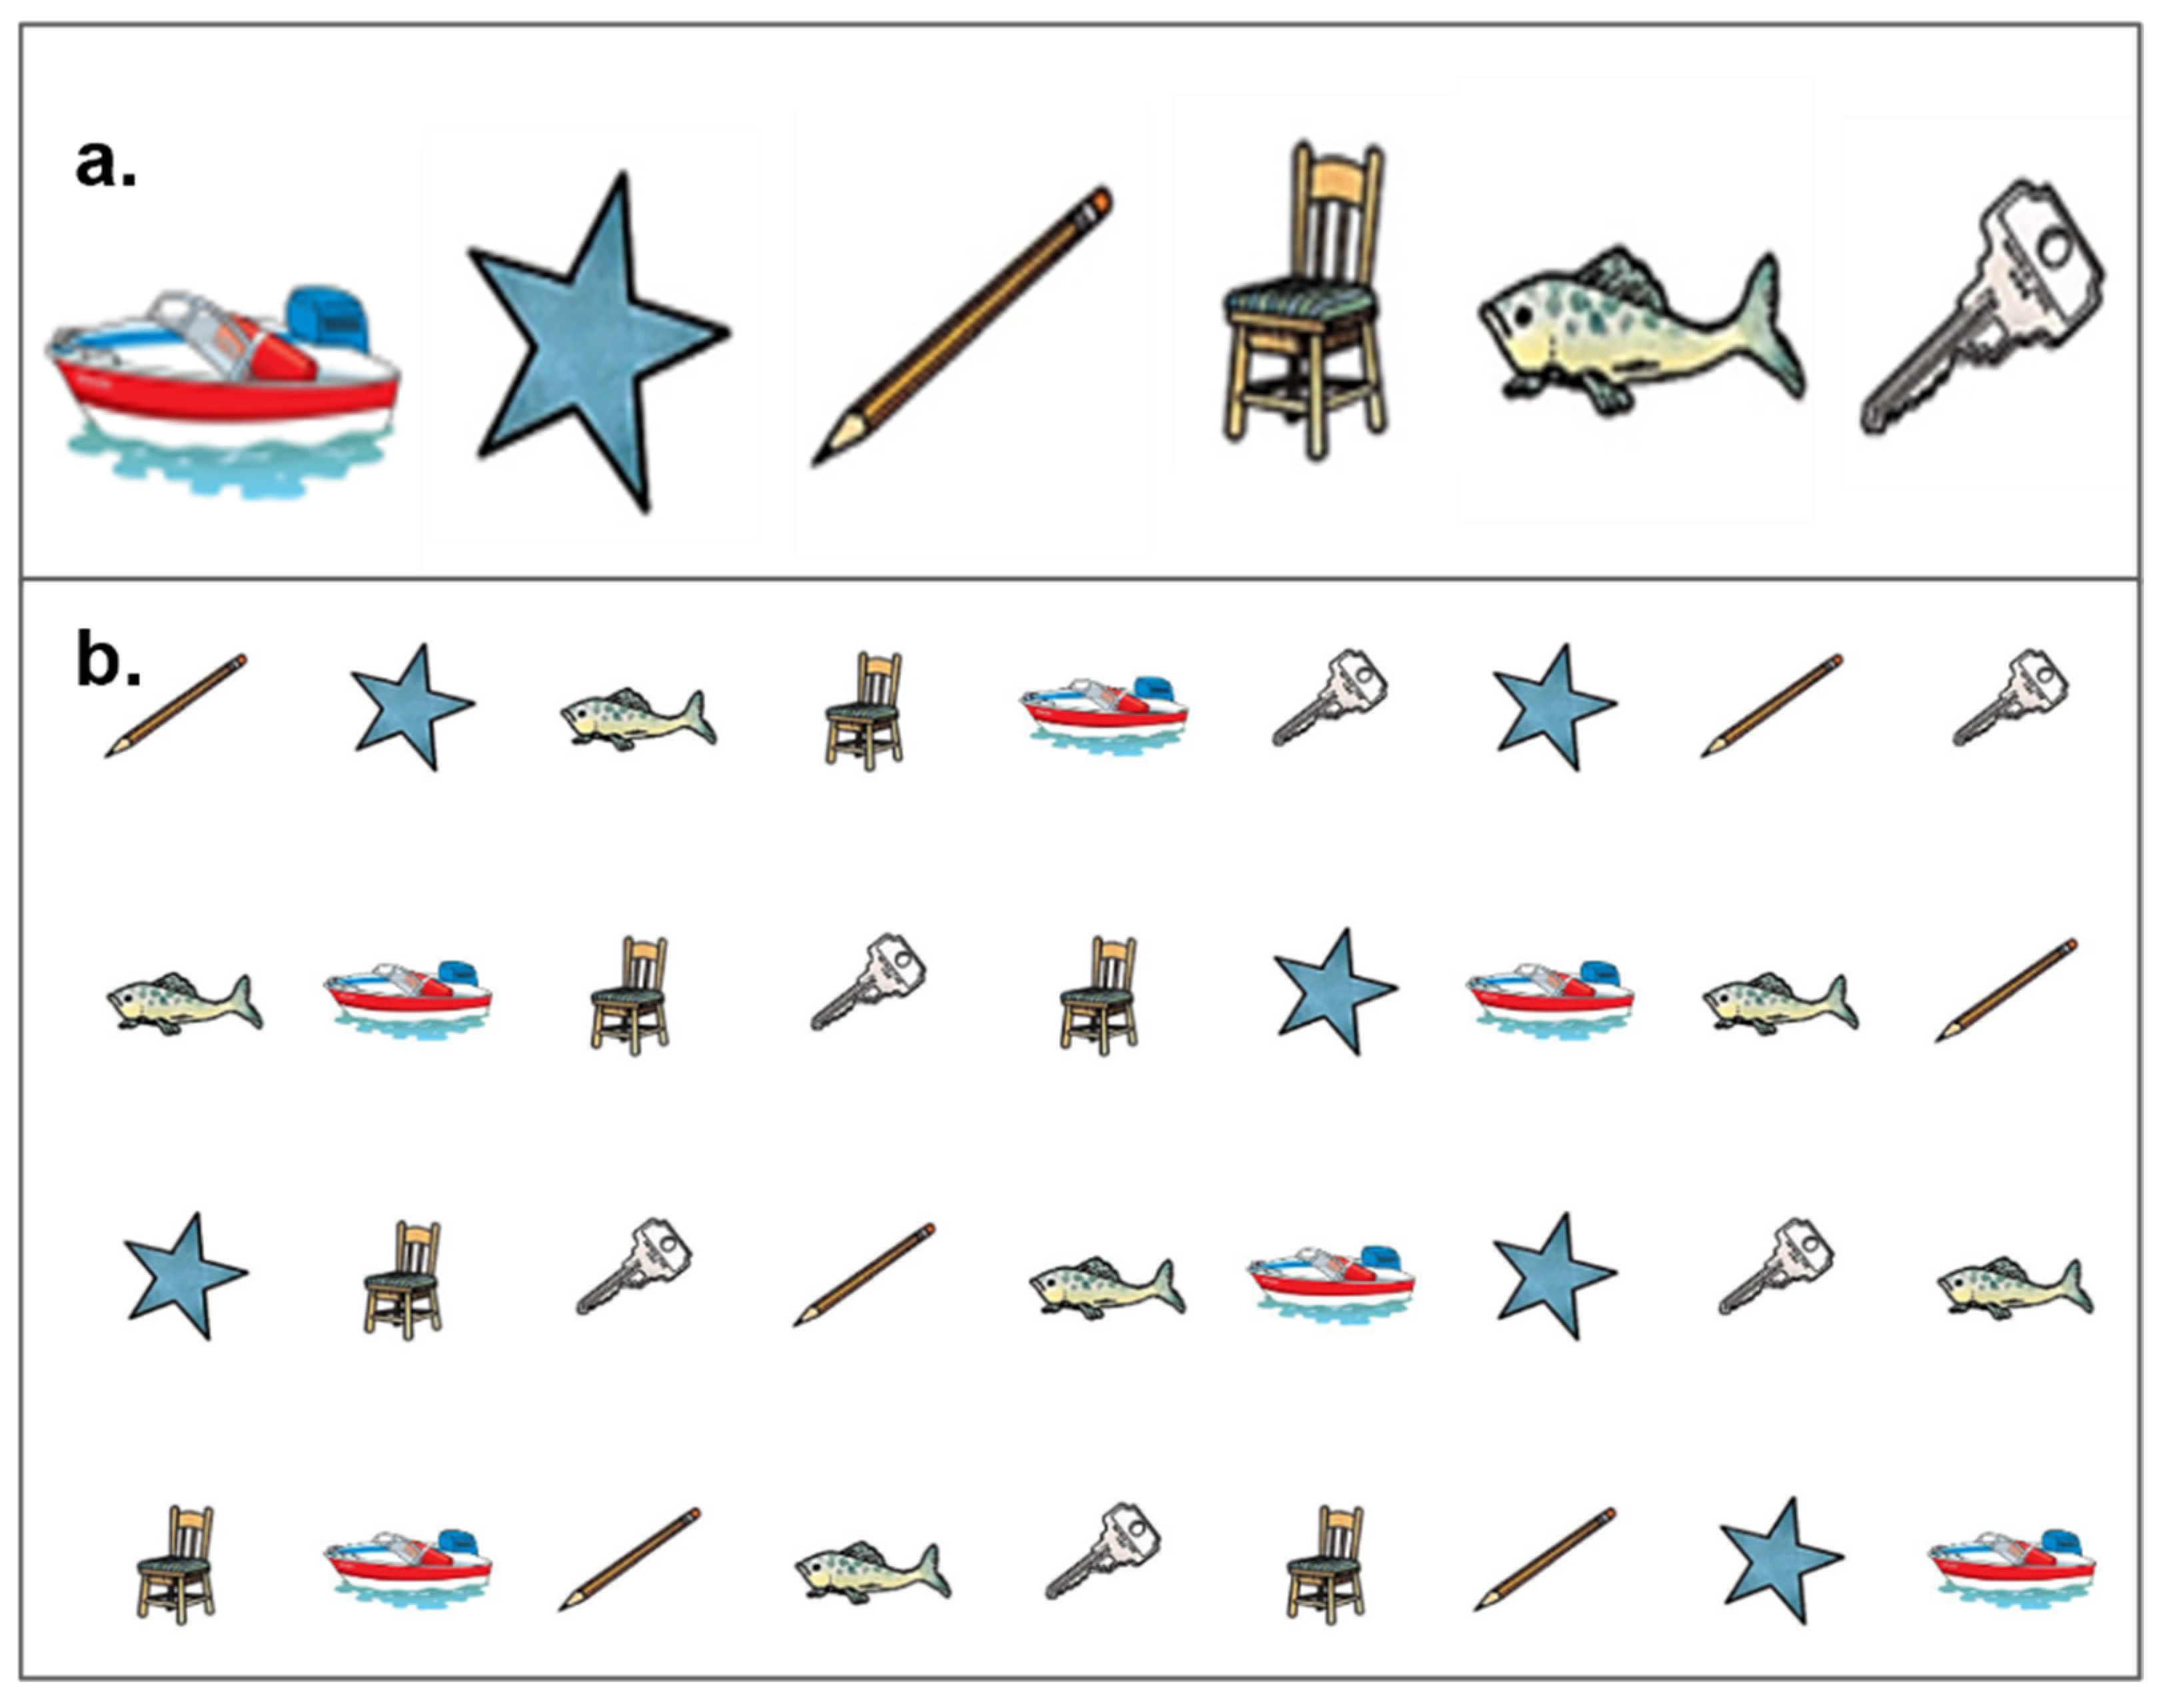
2.3.3. Rapid Automatized Naming (RAN) Task

The RAN was originally developed to measure the speed and accuracy of continuous naming responses [23,24,36]. The RAN tasks [37] used in this study consisted of 36 objects of 6 randomly repeated objects (i.e., boat, star, pencil, chair, fish, and key) (Figure 3). It has been suggested that RAN can be used for both visual–verbal (language domain) [38] and processing speed [21] contributions to reading. Participants were required to verbally name each object from left to right as fast and accurately as possible. To ensure the consistency of naming trials, the task begins with a practice trial consisting of all six familiar objects to ensure that all participants understood the names of objects and instructions of the task performance. The time and errors made in naming all objects were recorded. Only the total time score (i.e., how fast participants can verbally name the objects) was analyzed from this task. The RAN task has been demonstrated to be highly reliable (test–retest r = 0.90) [39].

2.3.4. Receptive Vocabulary Task

Receptive vocabulary ability was measured using the Peabody Picture Vocabulary Test, Fourth Edition (PPVT-4) [40] (Dunn and Dunn, 2007). Children were asked to point to the picture that matched the spoken word from an array of four colored pictures. Responses were scored dichotomously, meaning that they were either correct or incorrect. This test comprises 192 target words in 12-item sets of increasing difficulty. For the starting and ending items, we followed the ceiling and basal set rules to ensure that the examinee only receives sets appropriate to their vocabulary level. The PPVT-4 is an untimed test and has demonstrated highly reliable estimates within the normative samples (a = 0.95) [40].

2.3.5. Expressive Vocabulary Task

Expressive vocabulary ability was measured by using the Expressive Vocabulary Test, Second Edition (EVT-2) [41], which was co-normed with the PPVT-. Children were asked to provide a short verbal description or the most appropriate single-word synonym that described the picture. Responses were scored dichotomously (either one or zero). This test continues until five consecutive errors are made or until the entire test is completed. The EVT-2 is an untimed test that has demonstrated highly reliable estimates within the normative samples (a = 0.94) [41].

2.4. Procedure

A child was assessed if their guardian returned a signed ethics consent form to the school. Vision and hearing screening was conducted first, followed by adequate practice trials for all experimental tasks. Assessments were conducted individually during school hours in a quiet private room in the presence of at least two researchers. Sessions were limited to 20–30 min in length, with assessments typically conducted over three or four sessions to ensure engagement and reduce fatigue of participants. In cases where children were unable to focus on the tasks, at any time, children were encouraged to take a break or return to class. At the end of each session, each child received a sticker or small stationery item as a thank you.

2.5. Data Screening and Analysis

Power analysis. The sample size for the number of participants was estimated by power analysis using the G*Power 3.1 analysis software [42]. According to Cohen (1992), in order to reach moderate effect sizes with α < 0.05 and a power of 0.8 (1-β error probability when conducting one-way ANOVAs, a sample size of 32 participants is recommended for frequentist analyses [43].
Data Cleaning and Outliers. For multisensory MRT tasks, appropriately timed MRT responses were recorded and averaged for each participant, following the exclusion of reaction times below 150 ms or above 1500 ms, as suggested by previous studies [44,45]. The extremely slow RTs indicated participant inattention; however, extremely fast RTs indicated either a false alarm or a response to a previous stimulus [44]. According to these criteria, only 1% of the RT responses were excluded. Two children (in the 5–6 and 7–8 groups) made more than 50% errors in multisensory trials, so their data were excluded. For the RAN task, boxplots identified one outlier whose data were removed. No exclusion was necessary for either the EHC SLURP or vocabulary tasks. According to Victorian school class medians, we divided the participants into three categories based on age (5–6, 7–8, and 9–10 years). All participants were measured for NVIQ in order to ensure they were within the range of normal IQ (see Table 1).
Data Analysis. A Bayesian statistical approach using JASP 0.16.3.0 free software (JASP Team, 2022; http://www.jasp-stats.org/, accessed on 2 February 2023 [46]) was used to analyze all data. Bayesian statistics and analysis were chosen due to their theoretical and practical advantages in the assessment and interpretation of developmental data [47] and in order to facilitate straightforward interpretation [48]. Bayesian statistics are not based on the assumption of normality; thus, they demonstrate important advantages in use with small samples [48]. Such analyses facilitate the assessment of the strength of evidence for each model using a model comparison and selection strategy rather than the null hypothesis testing models associated with frequentist statistics [49,50]. It has also been reported that Bayesian statistics can be used to conduct multiple statistical tests without increasing the risk of Type 1 Errors [51]. Bayes factors (BF10) greater than zero were considered evidence in favor of alternative hypotheses. Based on Wetzels and Wagenmakers (2012) [52], BF10 values were interpreted as anecdotal evidence if values were between BF10 1 and 3, moderate evidence if values were between BF10 3 and 10, strong evidence if values were between BF10 10 and 30, very strong evidence if values were between BF10 30 and 100, and extreme or/decisive evidence if BF10 values were 100 or above.
Data analysis was performed using Bayesian for ANOVA, correlations, and multiple linear regressions.
Firstly, Bayesian one-way ANOVAs were conducted to examine whether there were differences in performance between the three age groups in vocabulary measures (PPVT and EVT) and RAN task. To obtain post hoc comparisons for each Bayesian ANOVA, a default t-test with a Cauchy prior was utilized, as suggested by Wagenmakers et al. (2018) [53]. Posterior odds estimates and 95% credible intervals (95%CI) have been reported. In addition, Omega-squared ( ω 2 ) were calculated to estimate the effect size (ES: ω 2 > 0.01 = small; ω 2 > 0.06 = moderate; ω 2 > 0.14 = large) for differences between groups and to ensure a less biased estimation of variance [54,55,56].
Secondly, Correlations were conducted to investigate the associations between the multisensory processing (AS, VS, and AVS), visuomotor performance, language measures (PPVT and EVT), and RAN task. Bayesian correlations were determined using the default prior (“stretched beta prior width” = 1.0). Pearson correlation coefficients (r) and the Bayes Factor (BF10) are reported in this study.
Lastly, two directions of Bayesian linear Regressions analyses were also performed to determine (i) the predictive value of language and vocabulary development to MRT measures of multisensory processing (i.e., auditory RT, visual RT, audiovisual RT, and EHC SLURP) and (ii) the predictive value of simple multisensory processes measured as auditory RT, visual RT, audiovisual RT, EHC SLURP, and RAN to language and vocabulary development. In the first regression analysis, we entered the vocabulary tests (PPVT and EVT) and RAN task scores as predictor variables. In the second regression analysis, we entered the simple MRT, EHC SLURP, and RAN as predictor variables. For all models of regression, we presented the Bayes factor (BF) in comparison to the best fitting model, as well as the BFinclusion, which indicated that values above 1 suggested that predictors should be included (all values reported are detailed in Goss-Sampson, 2019 [57]).

3. Results

3.1. Results 1: Age-Group Differences in Receptive and Expressive Vocabulary Tests (PPVT and EVT) and Rapid Automatized Naming (RAN) across Three Age Groups

A series of Bayesian one-way ANOVAs were performed to determine whether there were age-related differences in scores in the Receptive and Expressive Vocabulary Tests (PPVT and EVT) and Rapid Automatized Naming (RAN) tasks for the three age groups. The descriptive statistics for all dependent measures are shown in Table 2. Results of Bayesian one-way ANOVA of vocabulary measures showed decisive evidence for differences across groups, favoring the alternative hypothesis (BF10 = 4.264 × 10⁷, ω2 = 0.48, BF10 = 1.239 × 10⁷, ω2 = 0.49) for PPVT and EVT, respectively. For the PPVT task, post hoc analysis showed that these significant differences were primarily driven by the youngest age group (5–6-year-old group) performing decisively worse, i.e., 5–6 year olds had smaller vocabularies than the children form 7–8 and 9–10 year old groups. The findings also indicate moderate evidence of differences between the 7–8 age group and the 9–10 age group (see Figure 4a and Table 3a). For the EVT task, post hoc comparisons showed that there were very strong to decisive differences between the three age groups (see Figure 4b and Table 3b). For the RAN task, results revealed strong evidence for differences among the groups, supporting the alternative hypothesis (BF10 = 25.777, ω2 = 0.16). Post hoc comparisons indicated that the 9–10 age group exhibited faster performances regarding the RAN test compared to the 5–6 age group. However, there was no evidence indicating differences between the 7–8 age group and either the 5–6 or 9–10 age groups (see Figure 4c and Table 3c), nor was there any evidence of any sex-related differences. Analyses and results of sex-related differences can be found in Supplementary Materials.

3.2. Results 2: Relationships among Age, NVIQ, and Vocabulary Tests (PPVT, EVT) and Multisensory MRT Tasks

Bayesian correlations were performed to investigate the strength of evidence for associations between chronological age, NVIQ, vocabulary tasks, and timed measures of multisensory processing (visual, auditory audiovisual, EHC SLURP, and RAN) in this sample of young early school-age children. First, we found evidence of a correlation between chronological age and all of our dependent measures (r = 0.55–0.76), supporting the alternative hypothesis, with a significant negative Pearson’s correlation observed between MRTs in the multisensory task, EHC SLURP, and RAN with age, indicating age-related decreases in the time required to complete visually driven motor tasks. Second, there was very strong evidence to suggest that faster MRT tasks were associated with higher NVIQ scores, as well as better performance in PPVT and EVT tasks, with the highest correlation (r = 0.70) being between EVT and NVIQ, indicating that a higher NVIQ score is decisively associated with greater expressive vocabulary ability. Our results also demonstrated that EVT was decisively correlated with all multisensory MRT tasks, EHC, and RAN (r = 0.48–0.63), suggesting that better performance in the expressive vocabulary task is correlated with faster MRTs in multisensory tasks such as visual RT, auditory RT, Audiovisual RT, visuomotor processing. Very strong evidence of relationships was also found between the receptive vocabulary (PPVT) task and multisensory MRT to only VS, AVS, and EHC SLURP tasks. Lastly, results showed that timing in the RAN task significantly correlated with EHC timing in SLURP (very strong r = 0.45), supporting the hypothesis that better performance in both tasks requires faster visual perception and faster motor responses (Table 4).
Separate Bayesian correlation analyses for each age group (5–6, 7–8 and 9–10 years) were conducted to ascertain whether these associations differ by age group. For the 5–6 years group, the results revealed that there was only anecdotal evidence of associations between NVIQ, EHC SLURP, and EVT task. For the 7–8 years group, anecdotal to moderate evidence of the association was found between NVIQ, multisensory MRTs to VS and AVS, and both PPVT and EVT tasks. For children in the 9–10 age group, there is a notable trend of increasing correlations, as interpreted from anecdotal to very strong evidence, between NVIQ, multisensory MRTs, RAN, and EVT. There was also moderate to very strong evidence between the EVT task and multisensory MRT tasks, EHC and RAN, suggesting that better performance in expressive vocabulary tasks would be associated with faster MRTs of multisensory tasks in older children. In Supplementary Materials, full correlation tables are provided for each age group.

3.3. Results 3: Receptive and Expressive Vocabulary Tests and Rapid Automatized Naming (RAN) Predict Multisensory MRT Measures and EHC SLURP and Vice Versa

Bayesian linear regressions were performed next to determine whether receptive and expressive vocabulary tasks and RAN predict multisensory processing (i.e., auditory RT, visual RT, audiovisual RT, and EHC SLURP) (see Table 5) and whether multisensory processes (i.e., auditory RT, visual RT, audiovisual RT, and EHC SLURP) and RAN predict receptive and expressive vocabulary tasks (see Table 6).
Firstly, to determine whether performance in vocabulary tests predicts multisensory MRT tasks, three regression models (PPVT, EVT, and RAN) were used to predict auditory RT, visual RT, audiovisual RT, and total time to complete each item in the visuomotor task (EHC) (see Table 5). In all regression analyses, the EVT scores were the best predictive model. For auditory and audiovisual RT, the odds (BFM) in favor of the model containing EVT as a predictor increased by a factor of 5.45 and 10.96, respectively. This model was 1.23 times for auditory RT and 2.94 times more likely than the model with the next highest BF10 value. Similarly, for visual RT, EVT increased the likelihood of the model containing it by a factor of (BFM = 15.54), and it was 5.07 times more likely than the model with the next highest BF10 value. For the EHC the visuomotor task, the best predictive model was for both EVT+ RAN; the likelihood of the model with both EVT and RAN as predictors increased by (BFM = 3.81), making the model 1.01 times more likely compared to the model with the next highest BF10 value. Table 7 provides the posterior summary for Bayes factor inclusion and shows decisive evidence for the inclusion of EVT in this model as a predictor of all multisensory MRTs. There is also evidence that EVT (moderate) and RAN (only anecdotal) should be included as predictors for the visuomotor EHC Slurp task items.
As shown in Table 5e, RAN was considered as a visuo-verbal motor task and thus regressed in PPVT and EVT task performance. Similarly, the best predictive model was composed of the EVT scores. The odds of this model were increased by (BFM = 9.29), making this model 3.38 times more likely than the next highest BF10 value, and posterior summary of this model indicated very strong evidence for the inclusion of EVT as a predictor. Overall, the expressive vocabulary task (EVT), which is a language measure of visually derived information, was a unique and constant predictor of multisensory MRTs, EHC visuo-motor processing, and visual–verbal–motor RAN task performance.
To determine whether the rate of multisensory processing predicts scores in receptive and expressive vocabulary tasks, five regression models investigating multisensory MRTs to AS, VS and AVS, visuomotor (EHC), and RAN task as predictors of receptive vocabulary (PPVT) and expressive vocabulary (EVT) were examined (Table 6). In the PPVT test, the best predictive model was the time score of the visual RT, as the odds (BFM = 10.92) favored the model including visual RT as a predictor. In the EVT test, the best predictive model was also the scores regarding the time taken to complete the visual RT and EHC SLURP tests; the odds (BFM = 10.71) favored the model including this model as a predictor. Table 8 provides the posterior summary for Bayes factor inclusion. Results showed moderate evidence for visual RT to be included as a predictor of both PPVT and EVT, while there was only anecdotal evidence for the RAN to be included as a predictor of expressive vocabulary (EVT). Overall, visual RT was found to be a consistent predictor of vocabulary measures. Since we have previously demonstrated that age and NVIQ were the most influential predictors of both multisensory motor tasks and cognitive abilities such as working memory [19,20], and as supported by our correlation analysis (refer to Table 2), we intentionally excluded them from our regression analysis to focus on other variables and obtain more meaningful results. However, detailed regressions involving age, NVIQ, and their prediction of MRT measures of multisensory processing can be found in the Supplementary Materials.

4. Discussion

The primary objective of the current study was to investigate the concurrent development of receptive and expressive vocabulary performance, NVIQ, multisensory MRTs processing regarding visual, auditory, audiovisual stimuli, and fine visual motor processing in early school-age children. Collectively, the results of the different age groups (5–6, 7–8, and 9–10 years old) indicated significant and very strong to decisive evidence of improved performance in EVT among the three age groups, while there was moderate evidence of differences in PPVT, confirming different developmental patterns. Our results also indicated that there was evidence for associations between chronological age, NVIQ, vocabulary measures, MRT in multisensory tasks, and visuomotor EHC. Our findings also showed that complex EVT performance, which predominantly requires verbal expression combined with visual perceptual input and auditory output, was decisively correlated with multisensory MRT tasks, EHC, and RAN tasks. This was further supported by our Bayesian regression analyses, as we found that EVT performance (not PPVT) was a unique and constant predictor of multisensory MRTs, visuo-motor processing, and RAN. Such results suggest that increasing the complexity of expressive vocabulary skills involving verbalization using visual inputs and auditory outputs plays a more critical role in multisensory processing rather than simply understanding the meaning of words (i.e., receptive vocabulary skills). In subsequent sections, age-group-related differences in vocabulary measures and the RAN task will be discussed first, followed by the associations between vocabulary measures, NVIQ, and MRTs in multisensory tasks.

4.1. Age-Group Differences in Receptive and Expressive Vocabulary Tests and RAN

Consistent with our hypotheses, significant age-group differences were demonstrated in both receptive and expressive vocabulary tests. More specifically, receptive vocabulary performance, as measured by the PPVT test was only different for children aged 5–6 years old but not children aged 7-year-old and above, suggesting that receptive vocabulary development may plateau in the later stages of childhood. In addition, we found very strong to decisive differences between the three age groups for expressive vocabulary measured via the EVT task, which indicates that expressive vocabulary skills continue to develop throughout childhood. This is consistent with previous research in the literature that has shown that the highest rate of oral vocabulary growth, according to the PPVT, test occurs during preschool ages from birth until 5–6 years of age, and this rate declines for each subsequent age period [59,60]. A recent study conducted by Acha et al. (2023) has also demonstrated that the language system, which incorporates a phonological component with storage, monitoring, and sentence-processing abilities, is relatively well-developed in 6 to 7-year-old children [61]. The authors of this study also suggested that receptive vocabulary skills develop earlier than expressive vocabulary skills [62], which is clearly in line with the developmental sequence of these skills (i.e., receptive and expressive skills) [63] in preverbal children. There is also evidence suggesting that children in the first years of life tend to depend more on their ability to understand linguistic information, but at a later age, the maturation of expressive skills becomes more important for a comprehensive understanding of pictures and symbols [64]. These results are further supported by a recent systematic review conducted by Dobinson and Dockrell (2021) [65] that examined the importance of using universal strategies (i.e., structured vocabulary programs and approaches involving speech and language therapists) in order to improve expressive rather than receptive language skills during the early school years [65], whereby a child’s expressive language is closely associated with improved literacy and education outcomes in primary school [66,67,68].
Visual (first process) and verbal (second process) processing, as measured by the RAN task, also showed significant differences (i.e., strong evidence) between the 5–6 and 9–10 age groups, indicating that the older children were significantly faster at naming objects compared to the younger children. This finding is consistent with those of Alghamdi et al. (2021) [21] and Peters et al. (2020) [69], who found statistically significant differences in children aged 5–8 years for RAN performance. One possible interpretation of these results could be based on previous research [69,70,71] that has revealed the significance of attention and higher cognitive processes in eye movement-driven temporal processing during Rapid Automatized Naming (RAN) tasks for successful object recognition. Consequently, it is possible that the faster naming of stimuli observed in older children in the current study is indicative of their superior rapid sequential modality shift processing skills [72].

4.2. Age, NVIQ, and Their Relationship with Multisensory MRT Tasks and Vocabulary Tasks

In line with our current hypotheses and our previous work [24] we found significant correlations between age, NVIQ, and decreased MRTs in the multisensory tasks involving audiovisual, visuo-motor processing, and visual–verbal (RAN) processing. Furthermore, children with higher NVIQ and working memory scores showed faster performance in multisensory MRT tasks [20]. In the current study, NVIQ was also significantly correlated with vocabulary tasks (PPVT and EVT), which is in line with the body of evidence that indicates that receptive and expressive vocabulary tests are highly correlated with performance on the measures of NVIQ in both adults and children [32,73,74].
More interestingly, our hypothesis regarding the association between vocabulary tests and novel multisensory MRTs and EHC SLURP was supported by our Bayesian analyses, as we found evidence of an association between the PPVT, EVT tests, and multisensory RT to visual, auditory, audiovisual, and visuomotor tasks. Once again, the EVT task showed a more decisive and higher correlation with multisensory MRT tasks than the PPVT task. These findings lend support to Kail’s ‘generalized slowing hypothesis’ [6], which suggests that the differences in processing speed, as measured by motor reaction time (RT) tasks, between children with Specific Language Impairments and those without, are not specific to the task itself but instead reflect a more general cognitive processing component [6]. Indeed, Haapala et al. (2014) have also noted that better linguistic skills, such as reading fluency and comprehension, are associated with better motor performance [75]. This association is thought to be related to the overlap of brain networks, such as the inferior frontal gyrus and left superior temporal gyrus, which are involved in both visuo-motor and verbalization processing [76]. The activation and maturation of these shared brain regions [77] presumably facilitates the development of both motor and linguistic skills and, equally likely, the slower neurodevelopment of such areas presumably accounts for the executive dysfunction observed in individuals of all ages diagnosed with neurodevelopmental disorders such as dyslexia [78].
Our findings also fit well with previous evidence that indicates that faster processing speeds in nonverbal motor tasks are associated with language development in early infancy [79,80] and in school-age children (ages 8–14 years) for both expressive and receptive language skills [81,82]. One possibility is that faster looking time, i.e., time required for an infant to fixate an object and then to ability to rapidly shift eye gaze and hence attention, reflects the earlier development of automatization regarding both the motor control of eye-driven attention and extraction of salience from a simple range of tasks [80]. Gaze patterns involve the integration of selective attention and the perceptual and receptive processing of instructions and prescribed targets to support the integration of auditory and visual information and motor processing, thereby enhancing language development [26,79]. Presumably, the automatization of visually or verbally driven motor actions is closely related to modality shift effect research [72,83] that refers to the time and neural resources required to shift between different sensory modalities (e.g., auditory and visual) while performing cognitive tasks, which should facilitate word learning in the earliest stages of receptive language development.

4.3. Predictive Ability of Receptive and Expressive Vocabulary Scores for Multisensory MRT Tasks and Vice Versa

In our Bayesian regression analyses, we found that the EVT test consistently predicted the rate of multisensory MRTs and EHC, supporting the hypothesis that expressive rather than receptive vocabulary tests would contribute to multisensory processing tasks. This finding is consistent with a study by Peter et al. (2019), who found that the processing speed of spoken word recognition in toddlers (assessed by the looking-while-listening paradigm) predicted children’s expressive vocabulary and utterance complexity during early development [80]. Indeed, our findings add to the large body of studies that support the notion that individuals with faster MRTs (i.e., faster switching from a distractor to a target image) have larger expressive vocabularies than those with slower MRTs in both children [8,10,61,79,84] and adults [85,86]. This may be due to some developmental differences in cognitive abilities, such as NVIQ, attentional resources, perceptual processing, which would contribute to the associations between the greater speed and accuracy of MRTs and growth in expressive language [84].
In addition, the findings reported in the current study demonstrate that the measure of speed of MRTs to visual stimuli has consistently predicted scores on vocabulary tasks, as measured by PPVT and EVT. This finding suggests that individuals with faster visual motor processing abilities are more likely to perform better on vocabulary tasks [87], which is in line with previous research in infants [8,10]. In addition, Yu et al. suggested that visually driven sustained attention with longer eye fixation on objects by infants leads to more successful word learning [88,89]. Such observations are in line with previous electrophysiological and psychophysical research showing that the fast-conducting Magnocellularly driven attention of the dorsal brain networks is associated with better NVIQ scores and reading [69], motor coordination, and cognitive abilities [71,90,91].

5. Limitations

A particular strength of this study is the use of a variety of visuomotor tasks (i.e., simple multisensory motor reaction time task, EHC, and visual–verbal motor reaction time (RAN) task) to measure multisensory motor processing in children and the utilization of Bayesian probability statistics in accordance with recent analytical recommendations to assess the strength of evidence for the alternative hypothesis [92,93]. On the other hand, an important limitation of the current study is that the selective classical measures of receptive and expressive vocabulary tests, such as the Peabody Picture Vocabulary Test (PPVT) and the Expressive Vocabulary Test (EVT), use pictorially derived contexts to assess verbal language understanding (i.e., receptive language) and expression rather than more extensive measurements of language manipulation skills and verbal comprehension abilities, e.g., grammar and sentence processing abilities. Thus, future studies may benefit from including other aspects of language abilities tasks, as well as a parent report of language, such as the Alberta Language and Development Questionnaire [94], to provide a more comprehensive understanding of children’s language skills.
A further limitation of the present study was the absence of an independent assessment of non-motor components of multisensory auditory and visual threshold detection times. Thus, future research should aim to include non-motor reaction times for both visual and auditory recognition tasks in addition to using other robust measures of oculomotor function, such as eye movement or/and flicker fusion thresholds [69], to assess the recovery time of visual conduction pathways between the eye and cortex. Finally, it is also important to acknowledge that although the sample size of the current study was not large, the use of Bayesian analysis, which does not assume normality, was a statistical advantage [48].

6. Conclusions and Future Directions

To our knowledge, our study is the first to investigate whether the time required to respond to multisensory information and the completion of EHC SLURP items predicts classical measures of vocabulary development, including receptive and expressive performance in early elementary school-age children. Overall, our findings using Bayesian analyses provide evidence for age-group differences in expressive vocabulary performance, as measured by EVT test, while PPVT performance was only significantly different for children aged between 5 and 6 years old but not children aged 7 and above, highlighting different developmental trajectories of types of language acquisition during early childhood. Furthermore, our results show evidence for associations between chronological age, NVIQ, MRT in multisensory tasks, EHC, and vocabulary measures of both PPVT and EVT, with there being a decisive correlation between EVT and all MRT tasks. Our most important finding indicates that EVT performance (but not PPVT) is a unique and constant predictor of multisensory MRTs, visuo-motor processing for EHC tasks, and visual–verbal processing using the RAN. Our results are unique in the sense that they provide preliminary evidence that increasing the complexity of expressive vocabulary skills, which involves combining visual and auditory processing with verbal expression rather than simply understanding the meaning of words (i.e., receptive vocabulary skills), contributes more significantly to the rate of multisensory processing and acquisition of fine motor skills. However, future research using more precise measures of specific aspects of automatization of expressive language, such as syntactic complexity and lexical skills rather than just extent of lexical vocabulary, could provide insight into the relationships between expressive vocabulary skills and multisensory processing. Results from the current study also have educational implications in terms of providing an easy-to-administer, accessible, school-based system to assess the concurrent development of NVIQ and language and multisensory processing. The aforementioned factors can all be better assessed through the use of PPVT, EVT, and SLURP Eye–Hand Coordination test. All tests are readily attainable and are rigorous time-sensitive measures that can be used to identify developmental and neurodevelopmental conditions.

Supplementary Materials

The following supporting information can be downloaded at: https://www.mdpi.com/article/10.3390/brainsci13060965/s1; Table S1: Post Hoc Comparisons of sex-related differences in PPVT, EVT and RAN; Table S2: Bayesian Pearson Correlations (5–6 group); Table S3: Bayesian Pearson Correlations (7–8 group); Table S4: Bayesian Pearson Correlations (9–10 group); Table S5: Bayesian Multiple Regressions for Age, Nonverbal IQ and Multisensory EHC SLURP and RAN Predict PPVT and EVT; Table S6: Posterior Summaries of Regression Coefficients; Table S7: Bayesian Multiple Regressions for Age, Nonverbal IQ, PPVT, EVT and RAN Predict Multisensory MRTs; Table S8: Posterior Summaries of Regression Coefficients.

Author Contributions

A.A.A. and S.G.C. designed and developed the study content. Data analysis and interpretation conducted by A.A.A. under the supervision of S.G.C., and M.J.M., A.A.A., and S.G.C. contributed to most of the writing. All authors have read and agreed to the published version of the manuscript.

Funding

This project was primarily funded by the La Trobe University, School of Psychology and Public Health, Department of Psychology, Counselling and Therapy. The VPixxTM equipment and RESPONSEPixx (VPixx) were purchased with funds provided to Prof. SGC through ARCDP171029. The audiometer used, an Interacoustic Screening Audiometer of portable model AS208, and Peltor H7A sound attenuating headphones are on loan from Carl Parsons and the Fildes Foundation.

Institutional Review Board Statement

The study was conducted in accordance with the Decla-ration of Helsinki and approved by the La Trobe University Human Ethics Committee, the Vic-torian Department of Education Human Ethics Committee, and the Victorian Catholic Schools Ethics Committee (protocol code HEC 18139; approved May 2018, and HEC 1611121; approved December 2016).

Informed Consent Statement

Written informed consent was obtained for all participants in the study.

Data Availability Statement

All data are available upon request.

Acknowledgments

Authors would like to acknowledge Hayley Pickering for her assistance in recruiting participants and collecting data, as well as for improving the final version of this manuscript. Authors would also thank Rana Alghamdi, Samuel Spiteri, and Kate Mellody for their assistance with data collection.

Conflicts of Interest

The authors declare that there are no conflict of interest.

References

  1. Pinker, S. The Language Instinct: How the Mind Creates Language; Penguin UK: London, UK, 2003. [Google Scholar]
  2. Trask, R.L.; Trask, R.L. Key Concepts in Language and Linguistics; Psychology Press: London, UK, 1999. [Google Scholar]
  3. Conti-Ramsden, G.; Durkin, K. Language Development and Assessment in the Preschool Period. Neuropsychol. Rev. 2012, 22, 384–401. [Google Scholar] [CrossRef] [PubMed]
  4. Meng, X.; Sun, C.; Du, B.; Liu, L.; Zhang, Y.; Dong, Q.; Georgiou, G.K.; Nan, Y. The development of brain rhythms at rest and its impact on vocabulary acquisition. Dev. Sci. 2022, 25, e13157. [Google Scholar] [CrossRef] [PubMed]
  5. Smith, A. Development and course of receptive and expressive vocabulary from infancy to old age: Administrations of the peabody picture vocabulary test, Third edition, And the expressive vocabulary test to the same standardization population of 2725 subjects. Int. J. Neurosci. 1997, 92, 73–78. [Google Scholar] [CrossRef] [PubMed]
  6. Kail, R. A Method for Studying the Generalized Slowing Hypothesis in Children with Specific Language Impairment. J. Speech Lang. Hear. Res. 1994, 37, 418–421. [Google Scholar] [CrossRef]
  7. Zapparrata, N.M.; Brooks, P.J.; Ober, T. Developmental Language Disorder Is Associated With Slower Processing across Domains: A Meta-Analysis of Time-Based Tasks. J. Speech Lang. Hear. Res. 2023, 66, 325–346. [Google Scholar] [CrossRef] [PubMed]
  8. Fernald, A.; Perfors, A.; Marchman, V.A. Picking up speed in understanding: Speech processing efficiency and vocabulary growth across the 2nd year. Dev. Psychol. 2006, 42, 98–116. [Google Scholar] [CrossRef] [Green Version]
  9. Iverson, J.M. Developing language in a developing body: The relationship between motor development and language development. J. Child Lang. 2010, 37, 229–261. [Google Scholar] [CrossRef] [Green Version]
  10. Marchman, V.A.; Fernald, A. Speed of word recognition and vocabulary knowledge in infancy predict cognitive and language outcomes in later childhood. Dev. Sci. 2008, 11, F9–F16. [Google Scholar] [CrossRef]
  11. Bhat, A.N.; Galloway, J.C.; Landa, R.J. Relation between early motor delay and later communication delay in infants at risk for autism. Infant Behav. Dev. 2012, 35, 838–846. [Google Scholar] [CrossRef] [Green Version]
  12. LeBarton, E.S.; Landa, R.J. Infant motor skill predicts later expressive language and autism spectrum disorder diagnosis. Infant Behav. Dev. 2019, 54, 37–47. [Google Scholar] [CrossRef]
  13. Bahrick, L.E.; Todd, J.T.; Soska, K.C. The Multisensory Attention Assessment Protocol (MAAP): Characterizing individual differences in multisensory attention skills in infants and children and relations with language and cognition. Dev. Psychol. 2018, 54, 2207. [Google Scholar] [CrossRef] [PubMed]
  14. Mason, G.M.; Goldstein, M.H.; Schwade, J.A. The role of multisensory development in early language learning. J. Exp. Child Psychol. 2019, 183, 48–64. [Google Scholar] [CrossRef] [PubMed]
  15. Righi, G.; Tenenbaum, E.J.; McCormick, C.; Blossom, M.; Amso, D.; Sheinkopf, S.J. Sensitivity to audio-visual synchrony and its relation to language abilities in children with and without ASD. Autism Res. 2018, 11, 645–653. [Google Scholar] [CrossRef] [PubMed]
  16. Imada, T.; Zhang, Y.; Cheour, M.; Taulu, S.; Ahonen, A.; Kuhl, P.K. Infant speech perception activates Broca’s area: A developmental magnetoencephalography study. NeuroReport 2006, 17, 957–962. [Google Scholar] [CrossRef]
  17. Hill, V.B.; Cankurtaran, C.Z.; Liu, B.P.; Hijaz, T.A.; Naidich, M.; Nemeth, A.J.; Gastala, J.; Krumpelman, C.; McComb, E.N.; Korutz, A.W. A Practical Review of Functional MRI Anatomy of the Language and Motor Systems. AJNR Am. J. Neuroradiol. 2019, 40, 1084–1090. [Google Scholar] [CrossRef] [Green Version]
  18. Wang, Y.; Ji, Q.; Zhou, C.; Wang, Y. Brain mechanisms linking language processing and open motor skill training. Front. Hum. Neurosci. 2022, 16, 911894. [Google Scholar] [CrossRef]
  19. Alhamdan, A.; Murphy, M.; Crewther, S. Age-related decrease in motor contribution to multisensory reaction times in primary school children. Front. Hum. Neurosci. 2022, 16, 967081. [Google Scholar] [CrossRef]
  20. Alhamdan, A.A.; Murphy, M.J.; Pickering, H.E.; Crewther, S.G. The contribution of visual and auditory working memory and non-verbal IQ to motor multisensory processing in elementary school children. Brain Sci. 2023, 13, 270. [Google Scholar] [CrossRef]
  21. Alghamdi, R.J.; Murphy, M.J.; Goharpey, N.; Crewther, S.G. The Age-Related Changes in Speed of Visual Perception, Visual Verbal and Visuomotor Performance, and Nonverbal Intelligence during Early School Years. Front. Hum. Neurosci. 2021, 15, 667612. [Google Scholar] [CrossRef]
  22. Ikiz, M.; Yucel, E. The relationships between language, working memory and rapid naming in children with mild to moderate hearing loss. Int. J. Pediatr. Otorhinolaryngol. 2022, 158, 111156. [Google Scholar] [CrossRef]
  23. Denckla, M.B.; Rudel, R. Rapid “Automatized” Naming of Pictured Objects, Colors, Letters and Numbers by Normal Children. Cortex 1974, 10, 186–202. [Google Scholar] [CrossRef]
  24. Wolf, M. Naming, reading, and the dyslexias: A longitudinal overview. Ann. Dyslexia 1984, 34, 87–115. [Google Scholar] [CrossRef] [PubMed]
  25. Reinhartsen, D.B.; Tapia, A.L.; Watson, L.; Crais, E.; Bradley, C.; Fairchild, J.; Herring, A.H.; Daniels, J. Expressive Dominant Versus Receptive Dominant Language Patterns in Young Children: Findings from the Study to Explore Early Development. J. Autism Dev. Disord. 2019, 49, 2447–2460. [Google Scholar] [CrossRef] [PubMed]
  26. LeBarton, E.S.; Iverson, J.M. Fine motor skill predicts expressive language in infant siblings of children with autism. Dev. Sci. 2013, 16, 815–827. [Google Scholar] [CrossRef] [Green Version]
  27. Vivekanand, U.; Gonsalves, S.; Bhat, S.S. Is LEA symbol better compared to Snellen chart for visual acuity assessment in preschool children? Rom. J. Ophthalmol. 2019, 63, 35–37. [Google Scholar] [CrossRef] [PubMed]
  28. Raven, J.C.; Court, J.H. Coloured Progressive Matrices; Oxford Psychologists Press: Oxford, UK, 1990. [Google Scholar]
  29. Cotton, S.M.; Kiely, P.M.; Crewther, D.P.; Thomson, B.; Laycock, R.; Crewther, S.G. A normative and reliability study for the Raven’s Coloured Progressive Matrices for primary school aged children from Victoria, Australia. Personal. Individ. Differ. 2005, 39, 647–659. [Google Scholar] [CrossRef]
  30. Raven, J.C.; Court, J.H.; Raven, J.C. Manual for Raven’s Progressive Matrices and Vocabulary Scales; Oxford Psychologists Press: Oxford, UK, 1988. [Google Scholar]
  31. Corman, L.; Budoff, M. Factor structures of retarded and nonretarded children on Raven’s Progressive Matrices. Educ. Psychol. Meas. 1974, 34, 407–412. [Google Scholar] [CrossRef]
  32. Goharpey, N.; Crewther, D.P.; Crewther, S.G. Problem solving ability in children with intellectual disability as measured by the Raven’s Colored Progressive Matrices. Res. Dev. Disabil. 2013, 34, 4366–4374. [Google Scholar] [CrossRef]
  33. Barutchu, A.; Danaher, J.; Crewther, S.G.; Innes-Brown, H.; Shivdasani, M.N.; Paolini, A.G. Audiovisual integration in noise by children and adults. J. Exp. Child Psychol. 2010, 105, 38–50. [Google Scholar] [CrossRef]
  34. Lee, K.; Junghans, B.M.; Ryan, M.; Khuu, S.; Suttle, C.M. Development of a novel approach to the assessment of eye–hand coordination. J. Neurosci. Methods 2014, 228, 50–56. [Google Scholar] [CrossRef]
  35. Junghans, B.M.; Khuu, S.K. Populations Norms for “SLURP”—An iPad App for Quantification of Visuomotor Coordination Testing. Front. Neurosci. 2019, 13, 711. [Google Scholar] [CrossRef] [PubMed] [Green Version]
  36. Denckla, M.B.; Rudel, R.G. Rapid ‘automatized’ naming (R.A.N.): Dyslexia differentiated from other learning disabilities. Neuropsychologia 1976, 14, 471–479. [Google Scholar] [CrossRef] [PubMed]
  37. Wagner, R.; Torgesen, J.; Rashotte, C.; Pearson, N. Comprehensive Test of Phonological Processing, 2nd ed.; CTOPP-2; Pro-Ed.: Austin, TX, USA, 2013. [Google Scholar]
  38. Denckla, M.B.; Cutting, L.E. History and significance of rapid automatized naming. Ann. Dyslexia 1999, 49, 29–42. [Google Scholar] [CrossRef]
  39. Hornung, C.; Martin, R.; Fayol, M. General and Specific Contributions of RAN to Reading and Arithmetic Fluency in First Graders: A Longitudinal Latent Variable Approach. Front. Psychol. 2017, 8, 1746. [Google Scholar] [CrossRef] [Green Version]
  40. Dunn, L.; Dunn, D. Peabody Picture Vocabulary Test; Pearson Assessments: Minneapolis, MN, USA, 2007. [Google Scholar]
  41. Williams, K.T.; Williams, K.T. EVT-2: Expressive Vocabulary Test; Pearson Assessments: Minneapolis, MN, USA, 2007. [Google Scholar]
  42. Faul, F.; Erdfelder, E.; Lang, A.-G.; Buchner, A. G* Power 3: A flexible statistical power analysis program for the social, behavioral, and biomedical sciences. Behav. Res. Methods 2007, 39, 175–191. [Google Scholar] [CrossRef]
  43. Cohen, J. A power primer. Psychol. Bull. 1992, 112, 155. [Google Scholar] [CrossRef]
  44. Barutchu, A.; Crewther, D.P.; Crewther, S.G. The race that precedes coactivation: Development of multisensory facilitation in children. Dev. Sci. 2009, 12, 464–473. [Google Scholar] [CrossRef]
  45. Ostrolenk, A.; Bao, V.A.; Mottron, L.; Collignon, O.; Bertone, A. Reduced multisensory facilitation in adolescents and adults on the autism spectrum. Sci. Rep. 2019, 9, 11965. [Google Scholar] [CrossRef] [Green Version]
  46. JASP Team. JASP (Version 0.16.3) [Computer Software]. 2022. Available online: https://jasp-stats.org/ (accessed on 15 February 2023).
  47. Weaver, B.P.; Hamada, M.S. Quality quandaries: A gentle introduction to Bayesian statistics. Qual. Eng. 2016, 28, 508–514. [Google Scholar] [CrossRef]
  48. Marsman, M.; Wagenmakers, E.-J. Bayesian benefits with JASP. Eur. J. Dev. Psychol. 2017, 14, 545–555. [Google Scholar] [CrossRef] [Green Version]
  49. Morey, R.D.; Rouder, J.N. Bayes factor approaches for testing interval null hypotheses. Psychol. Methods 2011, 16, 406. [Google Scholar] [CrossRef] [Green Version]
  50. Wagenmakers, E.-J.; Lee, M.; Lodewyckx, T.; Iverson, G.J. Bayesian versus frequentist inference. In Bayesian Evaluation of Informative Hypotheses; Springer: Berlin/Heidelberg, Germany, 2008; pp. 181–207. [Google Scholar] [CrossRef]
  51. Kelter, R. Analysis of Bayesian posterior significance and effect size indices for the two-sample t-test to support reproducible medical research. BMC Med. Res. Methodol. 2020, 20, 88. [Google Scholar] [CrossRef] [Green Version]
  52. Wetzels, R.; Wagenmakers, E.-J. A default Bayesian hypothesis test for correlations and partial correlations. Psychon. Bull. Rev. 2012, 19, 1057–1064. [Google Scholar] [CrossRef] [Green Version]
  53. Wagenmakers, E.-J.; Love, J.; Marsman, M.; Jamil, T.; Ly, A.; Verhagen, J.; Selker, R.; Gronau, Q.F.; Dropmann, D.; Boutin, B.; et al. Bayesian inference for psychology. Part II: Example applications with JASP. Psychon. Bull. Rev. 2018, 25, 58–76. [Google Scholar] [CrossRef] [PubMed] [Green Version]
  54. Field, A. Discovering Statistics Using IBM SPSS Statistics; Sage: Atlanta, GA, USA, 2013. [Google Scholar]
  55. Lakens, D. Calculating and reporting effect sizes to facilitate cumulative science: A practical primer for t-tests and ANOVAs. Front. Psychol. 2013, 4, 863. [Google Scholar] [CrossRef] [PubMed] [Green Version]
  56. Olejnik, S.; Algina, J. Generalized eta and omega squared statistics: Measures of effect size for some common research designs. Psychol. Methods 2003, 8, 434. [Google Scholar] [CrossRef] [Green Version]
  57. Goss-Sampson, M. Statistical analysis in JASP: A guide for students. In JASP; University of Greenwich: London, UK, 2019. [Google Scholar]
  58. Westfall, P.H.; Johnson, W.O.; Utts, J.M. A Bayesian perspective on the Bonferroni adjustment. Biometrika 1997, 84, 419–427. [Google Scholar] [CrossRef] [Green Version]
  59. Farkas, G.; Beron, K. The detailed age trajectory of oral vocabulary knowledge: Differences by class and race. Soc. Sci. Res. 2004, 33, 464–497. [Google Scholar] [CrossRef]
  60. Scheffner Hammer, C.; Lawrence, F.R.; Miccio, A.W. Exposure to English Before and After Entry into Head Start: Bilingual Children’s Receptive Language Growth in Spanish and English. Int. J. Biling. Educ. Biling. 2008, 11, 30–56. [Google Scholar] [CrossRef] [PubMed]
  61. Acha, J.; Agirregoikoa, A.; Barreto-Zarza, F.; Arranz-Freijo, E.B. Cognitive predictors of language abilities in primary school children: A cascaded developmental view. J. Child Lang. 2023, 50, 417–436. [Google Scholar] [CrossRef]
  62. Benedict, H. Early lexical development: Comprehension and production. J. Child Lang. 1979, 6, 183–200. [Google Scholar] [CrossRef] [PubMed]
  63. Maier, M.F.; Bohlmann, N.L.; Palacios, N.A. Cross-language associations in the development of preschoolers’ receptive and expressive vocabulary. Early Child. Res. Q. 2016, 36, 49–63. [Google Scholar] [CrossRef] [PubMed] [Green Version]
  64. Cheung, R.W.; Hartley, C.; Monaghan, P. Receptive and expressive language ability differentially support symbolic understanding over time: Picture comprehension in late talking and typically developing children. J. Exp. Child Psychol. 2022, 214, 105305. [Google Scholar] [CrossRef] [PubMed]
  65. Dobinson, K.L.; Dockrell, J.E. Universal strategies for the improvement of expressive language skills in the primary classroom: A systematic review. First Lang. 2021, 41, 527–554. [Google Scholar] [CrossRef]
  66. Melby-Lervag, M.; Hagen, a.M.; Lervag, A. Disentangling the far transfer of language comprehension gains using latent mediation models. Dev. Sci. 2020, 23, e12929. [Google Scholar] [CrossRef]
  67. Savage, R.; Kozakewich, M.; Genesee, F.; Erdos, C.; Haigh, C. Predicting writing development in dual language instructional contexts: Exploring cross-linguistic relationships. Dev. Sci. 2017, 20, e12406. [Google Scholar] [CrossRef]
  68. Shiel, G.; Cregan, Á.; McGough, A.; Archer, P. Oral Language in Early Childhood and Primary Education (3–8 Years); National Council for Curriculum and Assessment: Dublin, Ireland, 2012. [Google Scholar]
  69. Peters, J.L.; Bavin, E.L.; Crewther, S.G. Eye Movements during RAN as an Operationalization of the RAN-Reading “Microcosm”. Front. Hum. Neurosci. 2020, 14, 67. [Google Scholar] [CrossRef] [Green Version]
  70. Crewther, S.; Peters, J.; Goharpey, N.; Taylor, J.; Mungkhetklang, C.; Crewther, D.; Laycock, R. Eye Movements During Rapid Naming tasks Predict Reading Ability. J. Vis. 2017, 17, 539. [Google Scholar] [CrossRef]
  71. Crewther, S.G.; Crewther, D.P.; Klistorner, A.; Kiely, P.M. Development of the magnocellular VEP in children: Implications for reading disability. Electroencephalogr. Clin. Neurophysiol. Suppl. 1999, 49, 123–128. [Google Scholar]
  72. Barutchu, A.; Spence, C. Top–down task-specific determinants of multisensory motor reaction time enhancements and sensory switch costs. Exp. Brain Res. 2021, 239, 1021–1034. [Google Scholar] [CrossRef]
  73. Garrity, L.I.; Donoghue, J.T. Preschool Children’s Performance on the Raven’s Coloured Progressive Matrices and the Peabody Picture Vocabulary Test. Educ. Psychol. Meas. 1976, 36, 1043–1047. [Google Scholar] [CrossRef]
  74. Mungkhetklang, C.; Bavin, E.L.; Crewther, S.G.; Goharpey, N.; Parsons, C. The contributions of memory and vocabulary to non-verbal ability scores in adolescents with intellectual disability. Front. Psychiatry 2016, 7, 204. [Google Scholar] [CrossRef] [PubMed] [Green Version]
  75. Haapala, E.A.; Poikkeus, A.-M.; Tompuri, T.; Kukkonen-Harjula, K.; Leppänen, P.H.T.; Lindi, V.; Lakka, T.A. Associations of motor and cardiovascular performance with academic skills in children. Med. Sci. Sport. Exerc. 2014, 46, 1016–1024. [Google Scholar] [CrossRef] [Green Version]
  76. Halje, P.; Seeck, M.; Blanke, O.; Ionta, S. Inferior frontal oscillations reveal visuo-motor matching for actions and speech: Evidence from human intracranial recordings. Neuropsychologia 2015, 79, 206–214. [Google Scholar] [CrossRef] [PubMed] [Green Version]
  77. Ionta, S. Visual Neuropsychology in Development: Anatomo-Functional Brain Mechanisms of Action/Perception Binding in Health and Disease. Front. Hum. Neurosci. 2021, 15, 689912. [Google Scholar] [CrossRef]
  78. Farah, R.; Ionta, S.; Horowitz-Kraus, T. Neuro-Behavioral Correlates of Executive Dysfunctions in Dyslexia over Development from Childhood to Adulthood. Front. Psychol. 2021, 12, 708863. [Google Scholar] [CrossRef]
  79. Fernald, A.; Marchman, V.A. Individual Differences in Lexical Processing at 18° Months Predict Vocabulary Growth in Typically Developing and Late-Talking Toddlers. Child Dev. 2012, 83, 203–222. [Google Scholar] [CrossRef] [Green Version]
  80. Peter, M.S.; Durrant, S.; Jessop, A.; Bidgood, A.; Pine, J.M.; Rowland, C.F. Does speed of processing or vocabulary size predict later language growth in toddlers? Cogn. Psychol. 2019, 115, 101238. [Google Scholar] [CrossRef]
  81. Leonard, L.B.; Weismer, S.E.; Miller, C.A.; Francis, D.J.; Tomblin, J.B.; Kail, R.V. Speed of Processing, Working Memory, and Language Impairment in Children. J. Speech Lang. Hear. Res. 2007, 50, 408–428. [Google Scholar] [CrossRef]
  82. Park, J.S.; Miller, C.A.; Sanjeevan, T.; Hell, J.G.v.; Weiss, D.J.; Mainela-Arnold, E. Bilingualism and Processing Speed in Typically Developing Children and Children With Developmental Language Disorder. J. Speech Lang. Hear. Res. 2020, 63, 1479–1493. [Google Scholar] [CrossRef]
  83. Shaw, L.H.; Freedman, E.G.; Crosse, M.J.; Nicholas, E.; Chen, A.M.; Braiman, M.S.; Molholm, S.; Foxe, J.J. Operating in a multisensory context: Assessing the interplay between multisensory reaction time facilitation and inter-sensory task-switching effects. Neuroscience 2020, 436, 122–135. [Google Scholar] [CrossRef] [PubMed]
  84. Fernald, A.; Swingley, D.; Pinto, J.P. When Half a Word Is Enough: Infants Can Recognize Spoken Words Using Partial Phonetic Information. Child Dev. 2001, 72, 1003–1015. [Google Scholar] [CrossRef] [Green Version]
  85. Mainz, N.; Shao, Z.; Brysbaert, M.; Meyer, A.S. Vocabulary Knowledge Predicts Lexical Processing: Evidence from a Group of Participants with Diverse Educational Backgrounds. Front. Psychol. 2017, 8, 1164. [Google Scholar] [CrossRef] [Green Version]
  86. Yap, M.J.; Tse, C.-S.; Balota, D.A. Individual differences in the joint effects of semantic priming and word frequency revealed by RT distributional analyses: The role of lexical integrity. J. Mem. Lang. 2009, 61, 303–325. [Google Scholar] [CrossRef] [PubMed] [Green Version]
  87. Pickering, H.E.; Peters, J.L.; Crewther, S.G. A Role for Visual Memory in Vocabulary Development: A Systematic Review and Meta-Analysis. Neuropsychol. Rev. 2022, 1–31. [Google Scholar] [CrossRef]
  88. Yu, C.; Smith, L.B. What you learn is what you see: Using eye movements to study infant cross-situational word learning. Dev. Sci. 2011, 14, 165–180. [Google Scholar] [CrossRef] [Green Version]
  89. Yu, C.; Suanda, S.H.; Smith, L.B. Infant sustained attention but not joint attention to objects at 9 months predicts vocabulary at 12 and 15 months. Dev. Sci. 2019, 22, e12735. [Google Scholar] [CrossRef] [PubMed] [Green Version]
  90. Brown, A.; Corner, M.; Crewther, D.; Crewther, S. Age Related Decline in Cortical Multifocal Flash VEP: Latency Increases Shown to Be Predominately Magnocellular. Front. Aging Neurosci. 2019, 10, 430. [Google Scholar] [CrossRef]
  91. Laycock, R.; Crewther, S.G.; Crewther, D.P. A role for the ‘magnocellular advantage’ in visual impairments in neurodevelopmental and psychiatric disorders. Neurosci. Biobehav. Rev. 2007, 31, 363–376. [Google Scholar] [CrossRef]
  92. Benjamin, D.J.; Berger, J.O.; Johannesson, M.; Nosek, B.A.; Wagenmakers, E.J.; Berk, R.; Bollen, K.A.; Brembs, B.; Brown, L.; Camerer, C.; et al. Redefine statistical significance. Nat. Hum. Behav. 2018, 2, 6–10. [Google Scholar] [CrossRef] [Green Version]
  93. Keysers, C.; Gazzola, V.; Wagenmakers, E.-J. Using Bayes factor hypothesis testing in neuroscience to establish evidence of absence. Nat. Neurosci. 2020, 23, 788–799. [Google Scholar] [CrossRef] [PubMed]
  94. Paradis, J.; Emmerzael, K.; Duncan, T.S. Assessment of English language learners: Using parent report on first language development. J. Commun. Disord. 2010, 43, 474–497. [Google Scholar] [CrossRef] [PubMed]
Figure 1. An example of three types of stimuli (AS, VS, and AVS) used in multisensory tasks.
Brainsci 13 00965 g001
Figure 2. Two examples of Eye–Hand Coordination Test (SLURP).
Brainsci 13 00965 g002
Figure 3. Example of Rapid Automatic Naming (RAN) practice trial (a); timed trial (b).
Brainsci 13 00965 g003
Figure 4. The model-averaged posterior distribution (horizontal bars show the 95% credible intervals around the median) for (a) Receptive Vocabulary Test (PPVT), (b) Expressive Vocabulary Test (EVT), and (c) Rapid Automatized Naming (RAN).
Brainsci 13 00965 g004
Table 1. The descriptive statistics present the mean age (SD), raw scores, and standard score for NVIQ measure in each age group.
NAge RangeNVIQ (RS)NVIQ (SS)
Min.Max.M (SD)Min.Max.M (SD)Min.Max.M (SD)
5–6 years245.006.906.00 (0.58)11.0029.0017.91 (5.07)86.00130.00102.87
−11.64
7–8 years257.008.797.93 (0.48)20.0034.0026.48 (3.78)89.00128.00109.84
−10.18
9–10 years249.0010.999.94 (0.66)26.0034.0030.04 (2.56)89.00121.00106.73
−9.05
Total73
Note: NVIQ= Non-verbal IQ assessed using Raven’s Colored Progressive Matrices (RCPM), and scores range from 0 to 36; RS = Raw Score of RCPM; SS = Standard Score of RCPM.
Table 2. Descriptive statistics for PPVT, EVT, and RAN by age groups.
95% Credible Interval
MeasureAgeMSDLowerUpper
PPVT5–6 years
7–8 years
9–10 years
116.304
143.115
157.611
18.247
13.765
18.983
108.414
137.556
148.171
124.195
148.675
167.051
EVT5–6 years
7–8 years
9–10 years
83.524
101.269
117.267
11.075
13.367
14.023
78.482
95.870
109.501
88.565
106.668
125.032
RAN (ms)5–6 years
7–8 years
9–10 years
47.117
39.569
35.848
8.798
9.650
10.312
43.000
35.396
31.275
51.235
43.742
40.420
Note: PPVT = Overall scores of the Peabody Picture Vocabulary Test; EVT = Overall scores of Expressive Vocabulary Test (EVT); RAN = Rapid Automatized Naming (RAN) response time.
Table 3. Post hoc comparisons.
Prior OddsPosterior OddsBF10, U Error %
  • PPVT
5–6 years7–8 years0.58715,426.61726,262.4951.148 × 10−10
9–10 years0.587298,595.504508,333.2804.549 × 10−11
7–8 years9–10 years0.5874.7288.0491.190 × 10−6
b.
EVT
5–6 years7–8 years0.587722.4601229.9269.769 × 10−9
9–10 years0.5872.028 × 1063.452e+61.839 × 10⁻⁹
7–8 years9–10 years0.58721.31836.2926.217 × 10−7
c.
RAN
5–6 years7–8 years0.5871.1361.9350.008
9–10 years0.58732.74255.7411.185 × 10−7
7–8 years9–10 years0.5870.4390.7470.007
Note: The posterior odds have been corrected for multiple testing by fixing the prior probability to 0.5 so that the null hypothesis holds across all comparisons [58]. Individual comparisons are based on the default t-test with a Cauchy (0, r = 1/sqrt (2)) prior. The “U” in the Bayes factor denotes that it is uncorrected.
Table 4. Bayesian Pearson Correlations for Total Sample.
VariableAgeRCPMASVSAVSEHCPPVTEVTRAN
1. AgePearson’s r
BF₁₀
2. RCPMPearson’s r0.764 ***
BF₁₀2.081 × 10¹²
3. ASPearson’s r−0.552 ***−0.410 **
BF₁₀42,147.60783.288
4. VSPearson’s r−0.664 ***−0.568 ***0.774 ***
BF₁₀7.570 × 107100,894.3597.069 × 1012
5. AVSPearson’s r−0.686 ***−0.559 ***0.816 ***0.872 ***
BF₁₀4.976 × 10862,846.5394.156e × 1054.116 × 1020
6. EHCPearson’s r−0.688 ***−0.560 ***0.516 ***0.572 ***0.605 ***
BF₁₀1.936 × 1079011.2751287.93916,180.99589,593.183
7. PPVTPearson’s r0.715 ***0.633 ***−0.351−0.506 ***−0.421 **−0.450 **
BF₁₀4.985 × 108938,481.9638.6721319.79960.77761.115
8. EVTPearson’s r0.751 ***0.679 ***−0.578 ***−0.639 ***−0.621 ***−0.564 ***0.823 ***
BF₁₀2.169 × 1095.527 × 10614,531.478404,008.271142,794.9272096.1833.054 × 1013
9. RANPearson’s r−0.505 ***−0.377 *0.362 *0.3270.3440.451 **−0.359−0.487 ***
BF₁₀1230.23416.74611.1924.9217.30576.5547.291194.699
Note: Age = age in numbers; RCPM = nonverbal IQ of Raven; AS = auditory MTR stimuli; VS = visual MRT stimuli; AVS = audiovisual MRT stimuli; EHC SLURP = visuomotor tasks; PPVT = Peabody picture vocabulary test; EVT = expressive vocabulary test; RAN = rapid automatized task response time. * BF₁₀ > 10, ** BF₁₀ > 30, *** BF₁₀ > 100.
Table 5. Multiple Bayesian regressions for PPVT, EVT, and RAN predicting Multisensory MRTs to Auditory, Visual, and Audiovisual stimuli and EHC SLURP.
Model PredictorsP (M)P (M|Data)BFMBF10R2
  • Auditory RT
EVT0.1250.4385.4561.0000.308
EVT + PPVT0.1250.3553.8600.8110.343
EVT + RAN0.1250.1050.8200.2390.309
EVT + PPVT + RAN0.1250.0990.7680.2260.343
PPVT0.1250.0010.0080.0020.120
PPVT + RAN0.1259.590 × 10−40.0070.0020.158
RAN0.1255.888 × 10−40.0040.0010.097
Null model0.1251.993 × 10−40.0014.550 × 10−40.000
b.
Visual RT
EVT0.1250.68915.5401.0000.406
EVT + RAN0.1250.1361.1010.1970.406
EVT + PPVT0.1250.1351.0880.1950.406
EVT + PPVT + RAN0.1250.0340.2440.0490.407
PPVT0.1250.0050.0320.0070.277
PPVT + RAN0.1250.0020.0120.0030.292
RAN0.1251.736 × 10−51.215 × 10−42.518 × 10−50.095
Null model0.1256.249 × 10−64.374 × 10−59.063 × 10−60.000
c.
Audiovisual RT
EVT0.1250.61010.9601.0000.366
EVT + PPVT0.1250.2071.8280.3390.379
EVT + RAN0.1250.1271.0180.2080.366
EVT + PPVT + RAN0.1250.0540.3980.0880.379
PPVT0.1250.0010.0070.0020.185
PPVT + RAN0.1256.295 × 10−40.0040.0010.210
RAN0.1258.289 × 10−55.803 × 10−41.358 × 10−40.095
Null model0.1252.976 × 10−52.083 × 10−44.877 × 10−50.000
d.
EHC SLURP
EVT + RAN0.1250.3533.8111.0000.334
EVT0.1250.3473.7220.9850.289
EVT + PPVT + RAN0.1250.1040.8160.2960.334
EVT + PPVT0.1250.0900.6910.2550.290
PPVT + RAN0.1250.0690.5230.1970.281
RAN0.1250.0230.1640.0650.196
PPVT0.1250.0130.0910.0360.174
Null model0.1258.332 × 10−40.0060.0020.000
e.
RAN
EVT0.2500.7569.2911.0000.258
EVT + PPVT0.2500.2230.8590.2950.263
PPVT0.2500.0190.0590.0260.140
Null model0.2500.0020.0060.0030.000
Note: EVT = expressive vocabulary test; PPVT = Peabody picture vocabulary test; RAN = rapid automatized task response time; EHC SLURP = visual motor processing.
Table 6. Multiple Bayesian regressions for Multisensory MRTs to Auditory, Visual, and Audiovisual stimuli, EHC SLURP, and RAN predicting PPVT and EVT.
Model PredictorsP (M)P (M|DATA)BFMBF10R2
  • PPVT
VS0.0310.26010.9201.0000.290
VS + EHC SLURP0.0310.1123.9250.4310.308
VS + RAN0.0310.0953.2620.3660.302
AS + VS0.0310.0772.5880.2960.296
VS + AVS0.0310.0672.2400.2590.291
AS + VS + EHC SLURP0.0310.0431.4000.1660.315
VS + RAN + EHC SLURP0.0310.0411.3160.1560.313
VS + AVS + EHC SLURP0.0310.0401.2760.1520.312
AS + VS + RAN0.0310.0381.2350.1470.311
VS + AVS + RAN0.0310.0321.0260.1230.306
b.
EVT
VS + EHC SLURP0.0310.25710.7171.0000.545
VS + RAN + EHC SLURP0.0310.1555.6700.6020.566
VS + RAN0.0310.1043.6140.4060.526
VS + AVS + EHC SLURP0.0310.0601.9800.2340.547
AS + VS + EHC SLURP0.0310.0581.9210.2270.547
VS0.0310.0571.8740.2220.474
VS + AVS + RAN + EHC SLURP0.0310.0411.3090.1580.569
AS + VS + RAN + EHC SLURP0.0310.0391.2430.1500.568
VS + AVS + RAN0.0310.0341.0750.1300.535
AS + VS + RAN0.0310.0270.8540.1040.530
Note: VS = visual RT; AS = auditory RT; AVS = audiovisual RT; EHC SLURP = visual motor processing; RAN = rapid automatized task response time; EVT = expressive vocabulary test; PPVT = Peabody picture vocabulary test; RAN = rapid automatized task response time.
Table 7. Posterior summaries of regression coefficients for PPVT, EVT, and RAN predicting Multisensory MRTs to Auditory, Visual, and Audiovisual stimuli and EHC SLURP.
CoefficientP (incl) P (incl|Data)BFinclusion Mean SD 95% Credible Interval
Lower Upper
  • Auditory RT
Intercept1.0001.0001.000869.53716.728835.300904.376
EVT0.5000.997351.833−5.1181.596−8.782−2.523
PPVT0.5000.4560.8390.8751.266−0.2033.891
RAN0.5000.2050.2580.0820.795−1.9212.120
b.
Visual RT
Intercept1.0001.0001.000904.76314.019878.190931.600
EVT0.5000.994156.342−4.4640.966−6.298−2.558
PPVT0.5000.1750.212−0.0340.483−1.4550.878
RAN0.5000.1710.207−0.0390.610−1.7511.070
c.
Audiovisual RT
Intercept1.0001.0001.000824.21113.577798.533852.953
EVT0.5000.998551.686−4.2271.020−6.502−2.271
PPVT0.5000.2630.3560.2540.674−0.2992.608
RAN0.5000.1820.222−0.0040.597−1.1971.835
d.
EHC SLURP
Intercept1.0001.0001.00067.3732.26662.89871.910
EVT0.5000.8948.431−0.4040.206−0.7110.000
PPVT0.5000.2770.382−0.0160.101−0.3370.168
RAN0.5000.5491.2190.2300.274−0.0590.789
e.
RAN
Intercept1.0001.0001.00041.0401.26838.43443.496
EVT0.5000.97945.733−0.2870.092−0.488−0.116
PPVT0.5000.2420.3190.0090.054−0.1070.171
Note: EVT = expressive vocabulary test; PPVT = Peabody picture vocabulary test; RAN = rapid automatized task response time; EHC SLURP = visual motor processing.
Table 8. Posterior summaries of regression coefficients for Multisensory MRTs to Auditory, Visual, and Audiovisual stimuli, EHC SLURP, and RAN predicting PPVT and EVT.
CoefficientP (incl)P (incl|Data)BFinclusionMeanSD95% Credible Interval
Lower Upper
  • PPVT
Intercept1.0001.0001.000138.1132.686132.533143.765
AS0.5000.2690.3680.0040.017−0.0210.061
VS0.5000.9039.294−0.0660.033−0.1210.000
AVS0.5000.2890.406−0.0010.027−0.0680.063
RAN0.5000.2970.422−0.0650.176−0.5880.187
EHC SLURP0.5000.3430.522−0.0560.118−0.3860.077
b.
EVT
Intercept1.0001.0001.000100.3731.79996.802103.841
AS0.5000.2040.257−0.0020.011−0.0330.016
VS0.5000.9049.374−0.0620.028−0.0990.000
AVS0.5000.2790.388−0.0090.024−0.0850.017
RAN0.5000.4710.889−0.1540.211−0.6550.006
EHC SLURP0.5000.6922.250−0.1670.143−0.4150.000
Note: VS = visual RT; AS = auditory RT; AVS = audiovisual RT; EHC SLURP = visual motor processing; RAN = rapid automatized task; EVT = expressive vocabulary test; PPVT Peabody picture vocabulary test; RAN = rapid automatized task response time.
Disclaimer/Publisher’s Note: The statements, opinions and data contained in all publications are solely those of the individual author(s) and contributor(s) and not of MDPI and/or the editor(s). MDPI and/or the editor(s) disclaim responsibility for any injury to people or property resulting from any ideas, methods, instructions or products referred to in the content.

