

Dual Cannabinoid and Orexin Regulation of Anhedonic Behaviour Caused by Prolonged Restraint Stress
 ,
, 
Abstract
:1. Introduction
2. Materials and Methods
2.1. Compounds
2.2. Animals
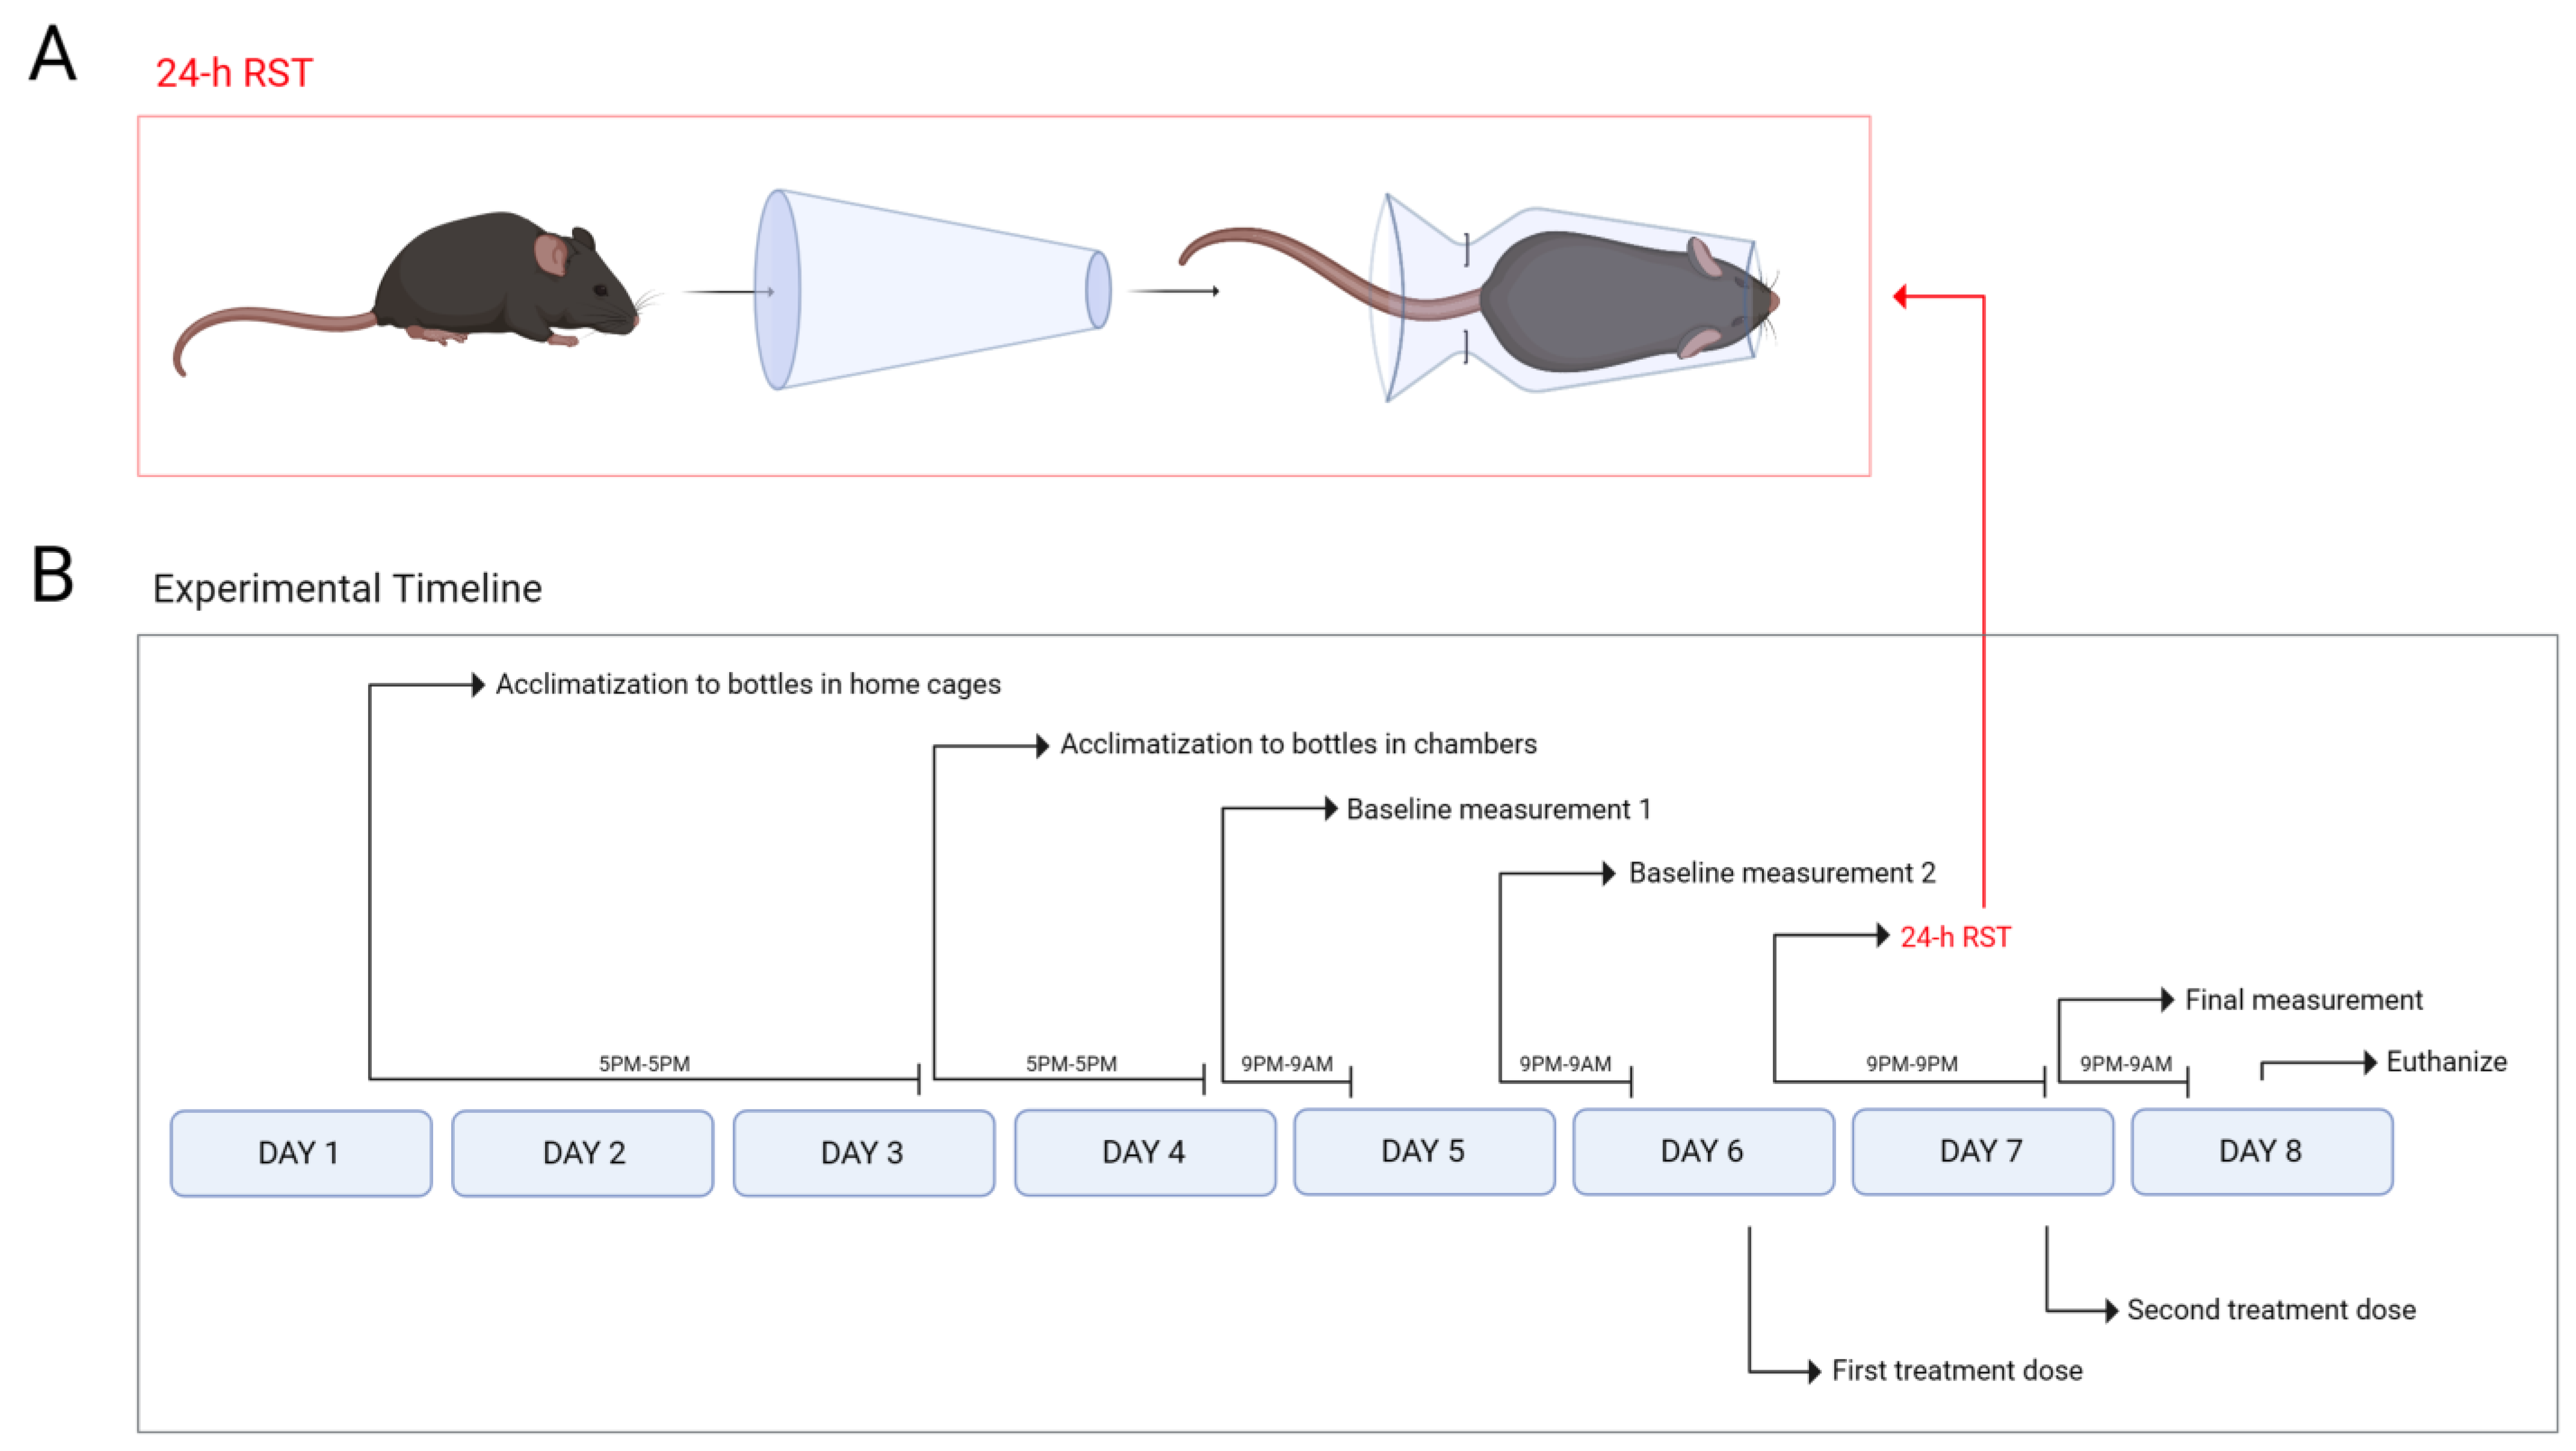
2.3. SPT and 24 h RST
2.4. Tissue Perfusion and Immunohistochemistry
2.5. Confocal Microscopy and Colocalization Analysis
2.6. Blood Collection and Corticosterone Quantification
2.7. Statistical Analysis
3. Results
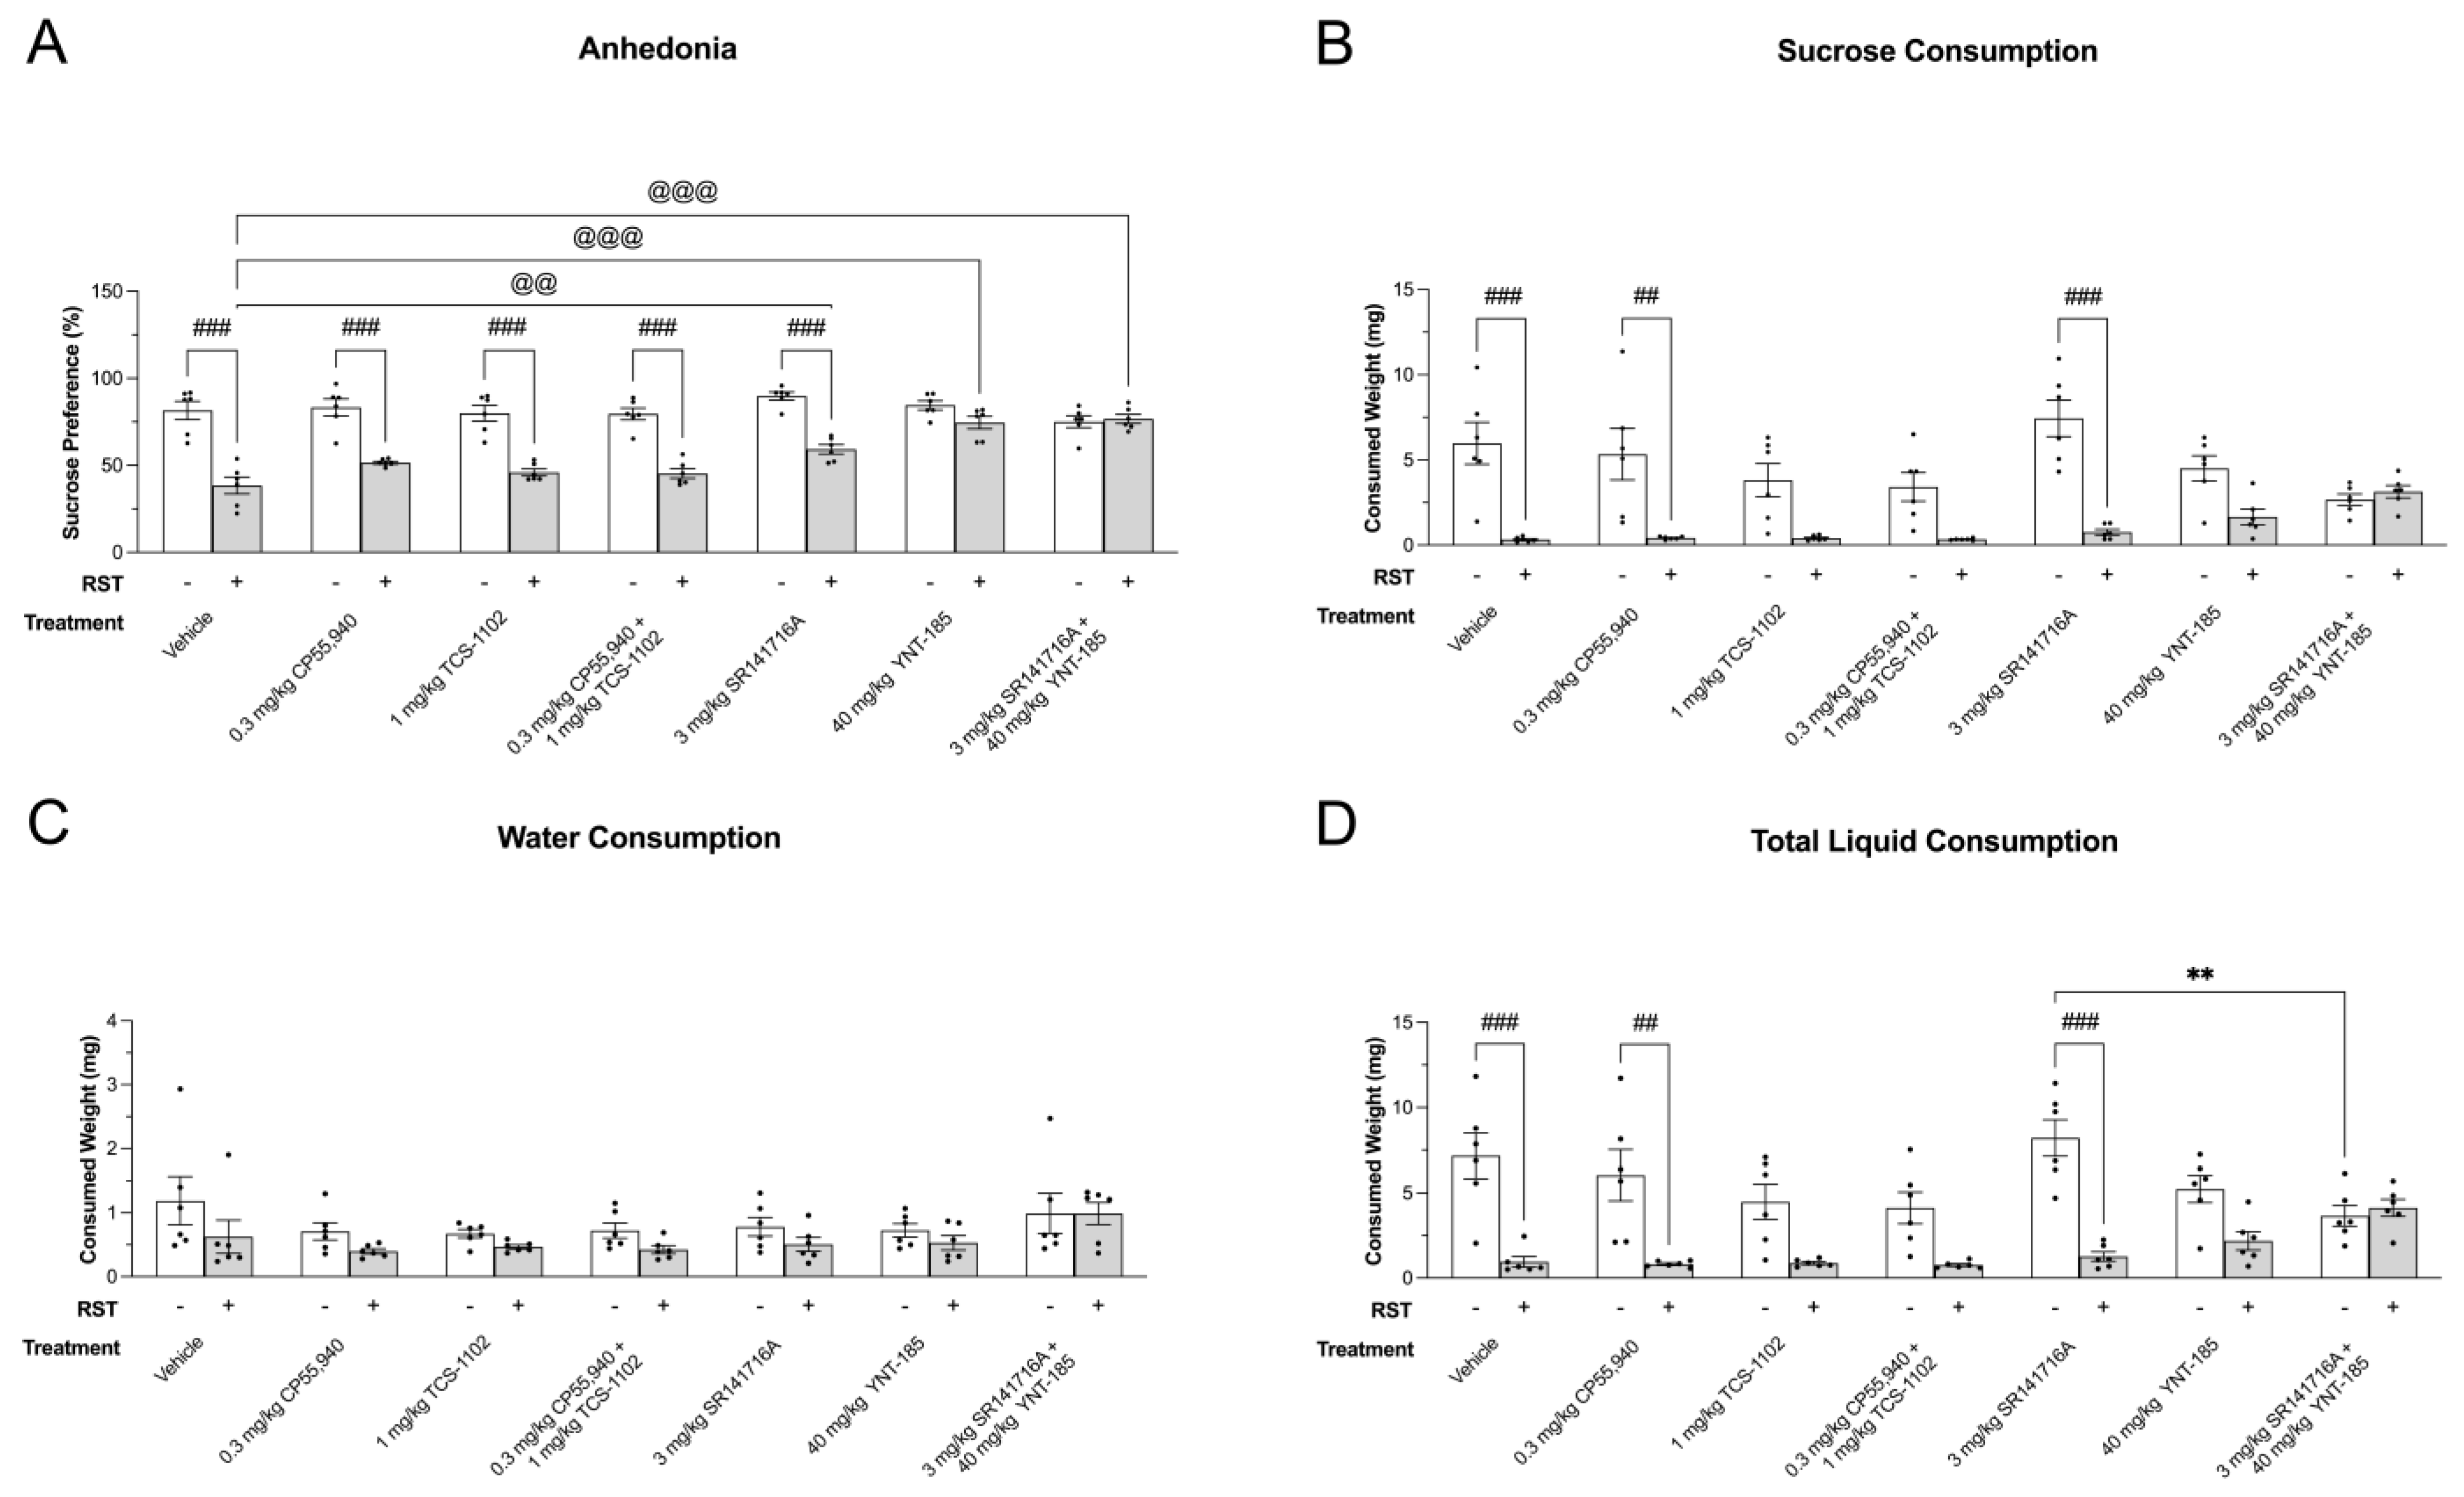
3.1. Anhedonia
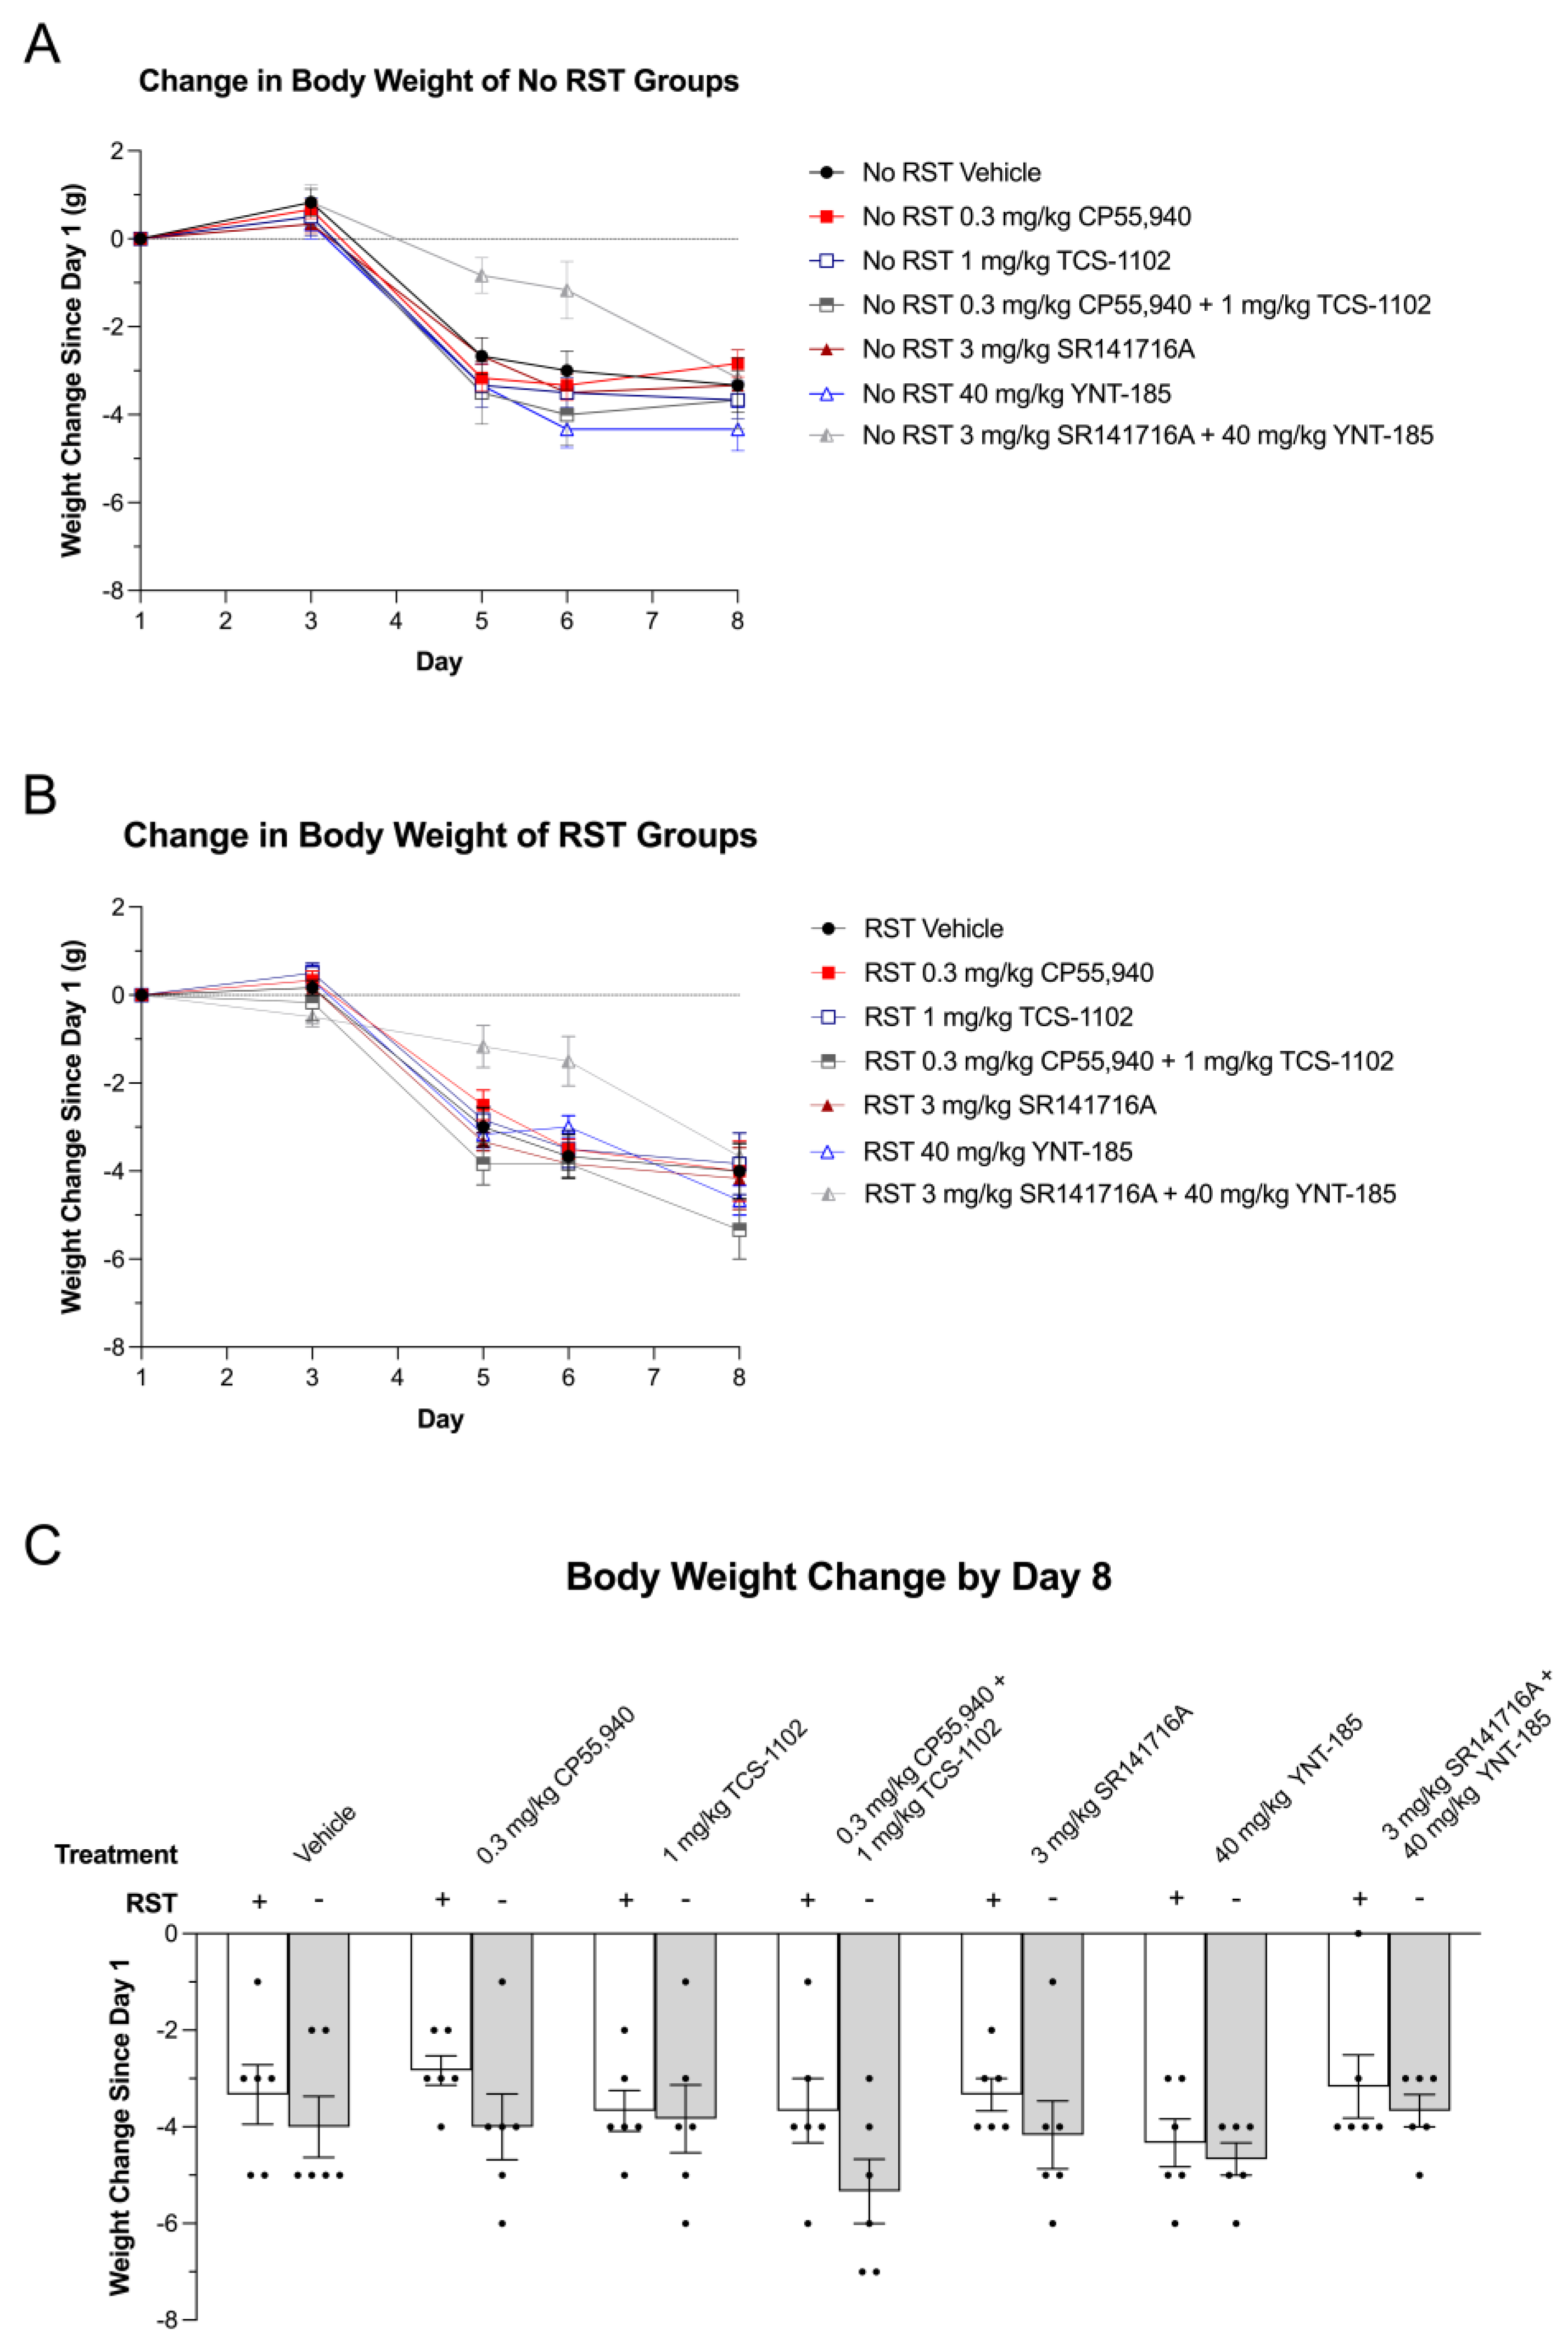
3.2. Body Weight
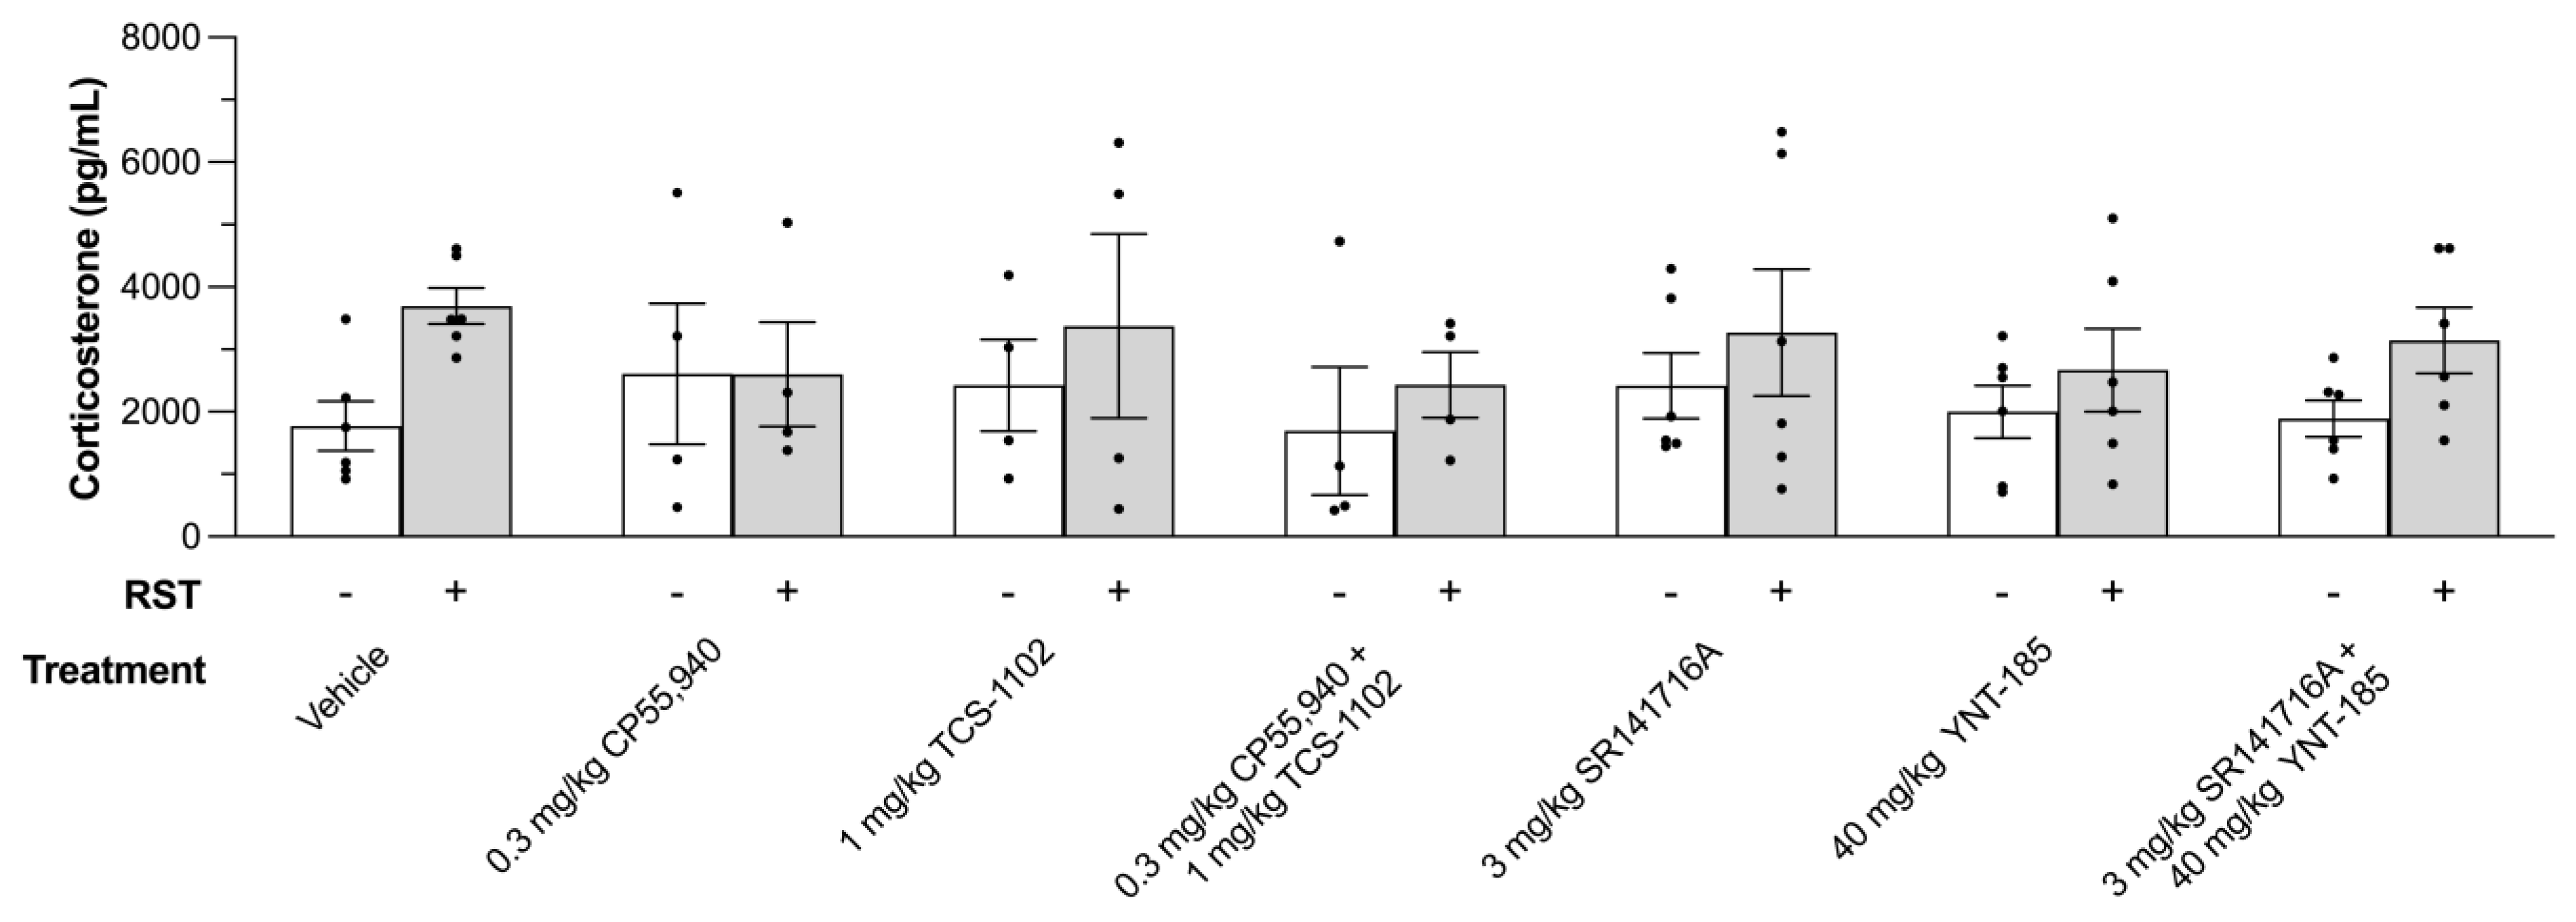
3.3. Plasma Corticosterone
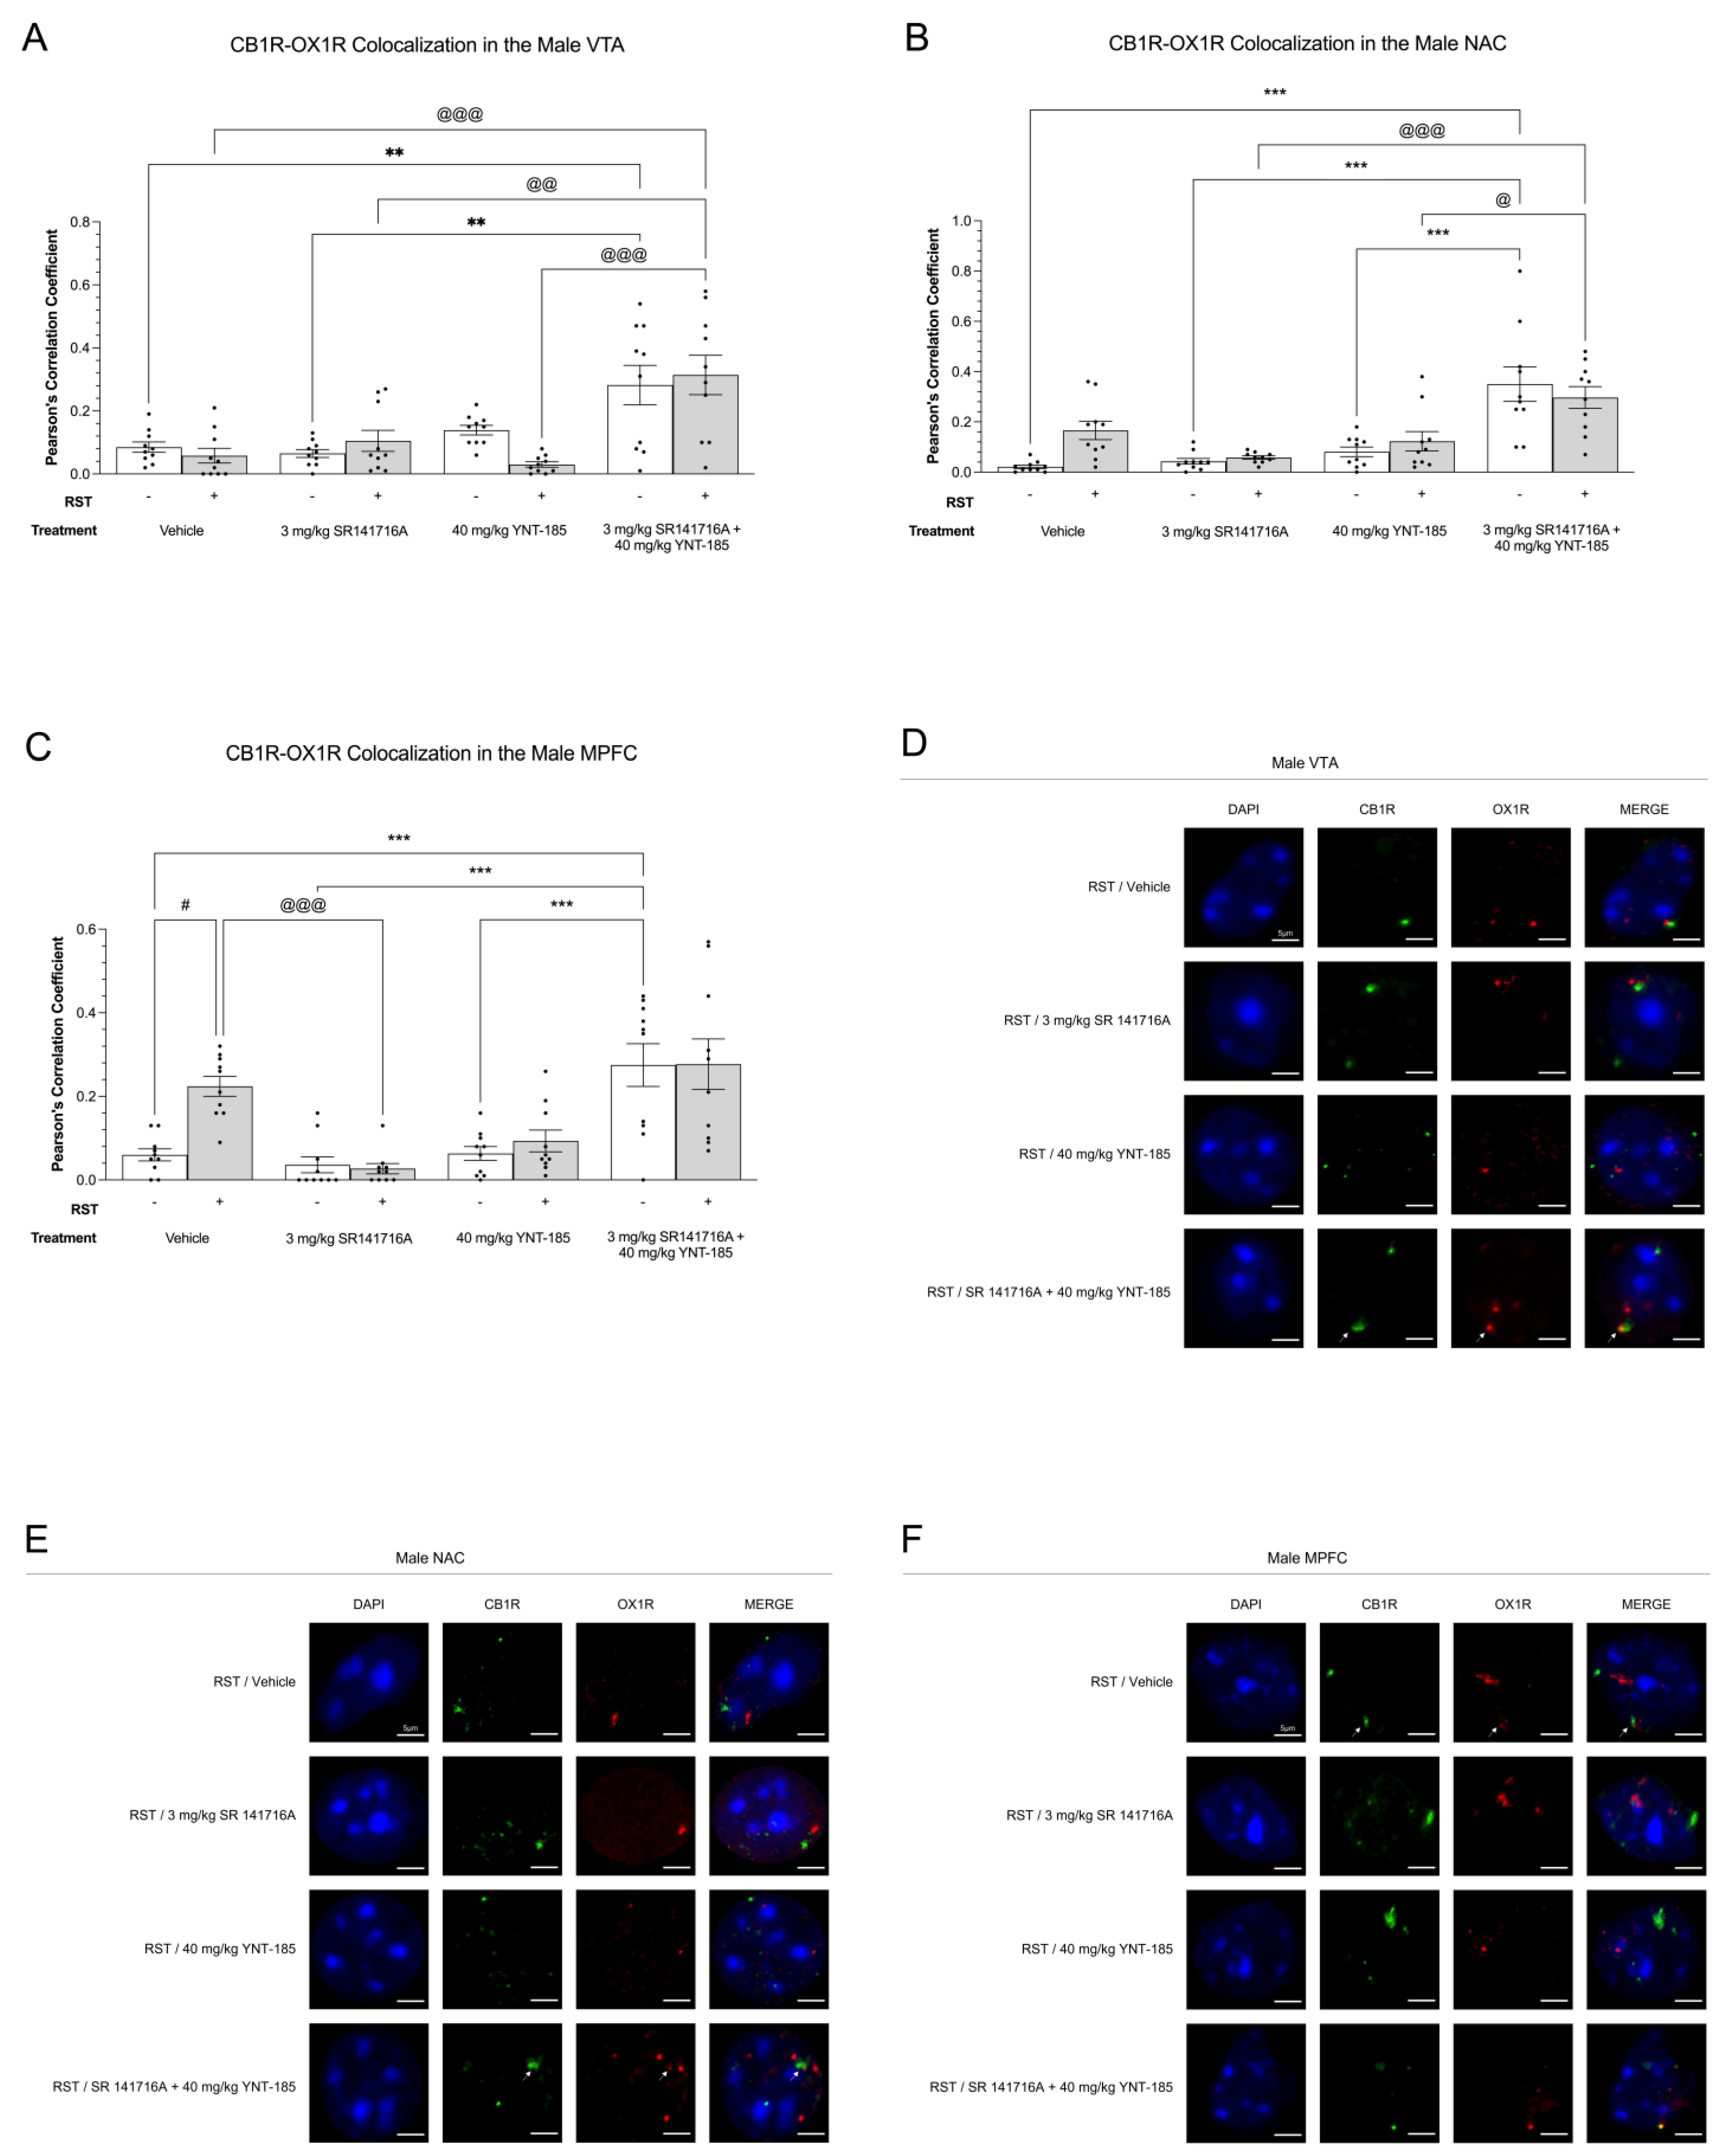
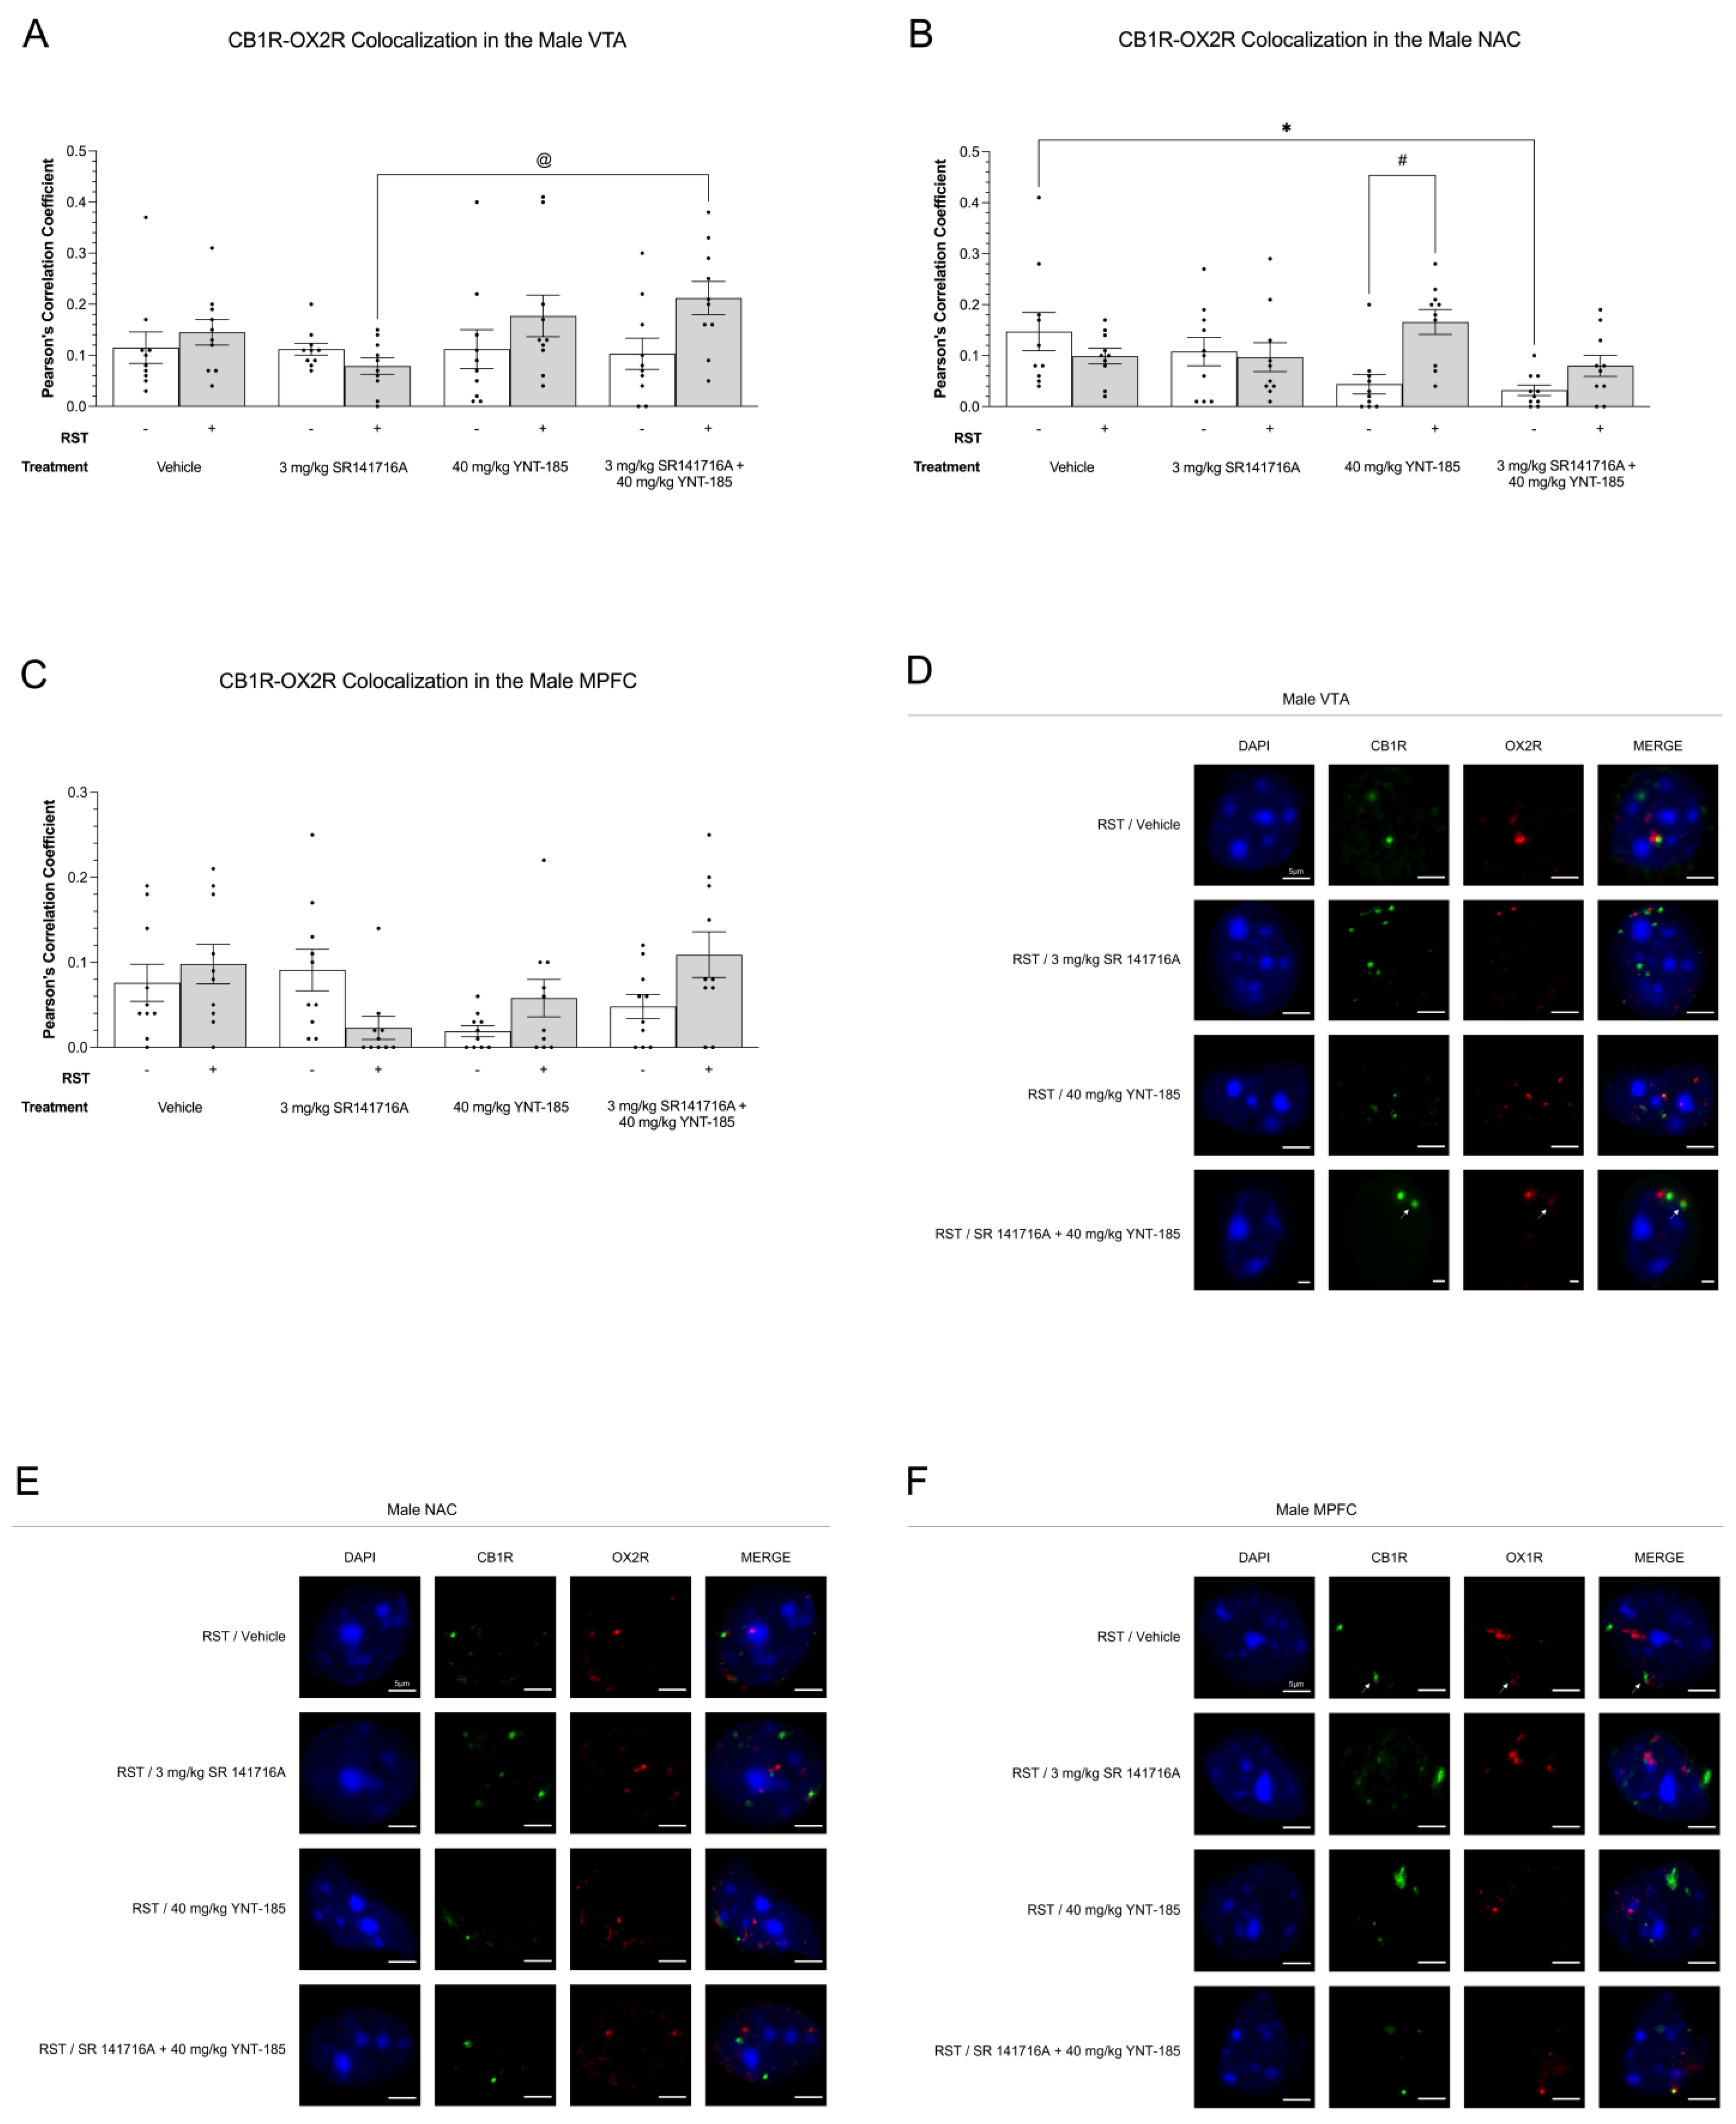
3.4. Cannabinoid–Orexin Receptor Colocalization in Male Brain Regions
3.4.1. CB1R-OX1R Colocalization
3.4.2. CB1R-OX2R Colocalization
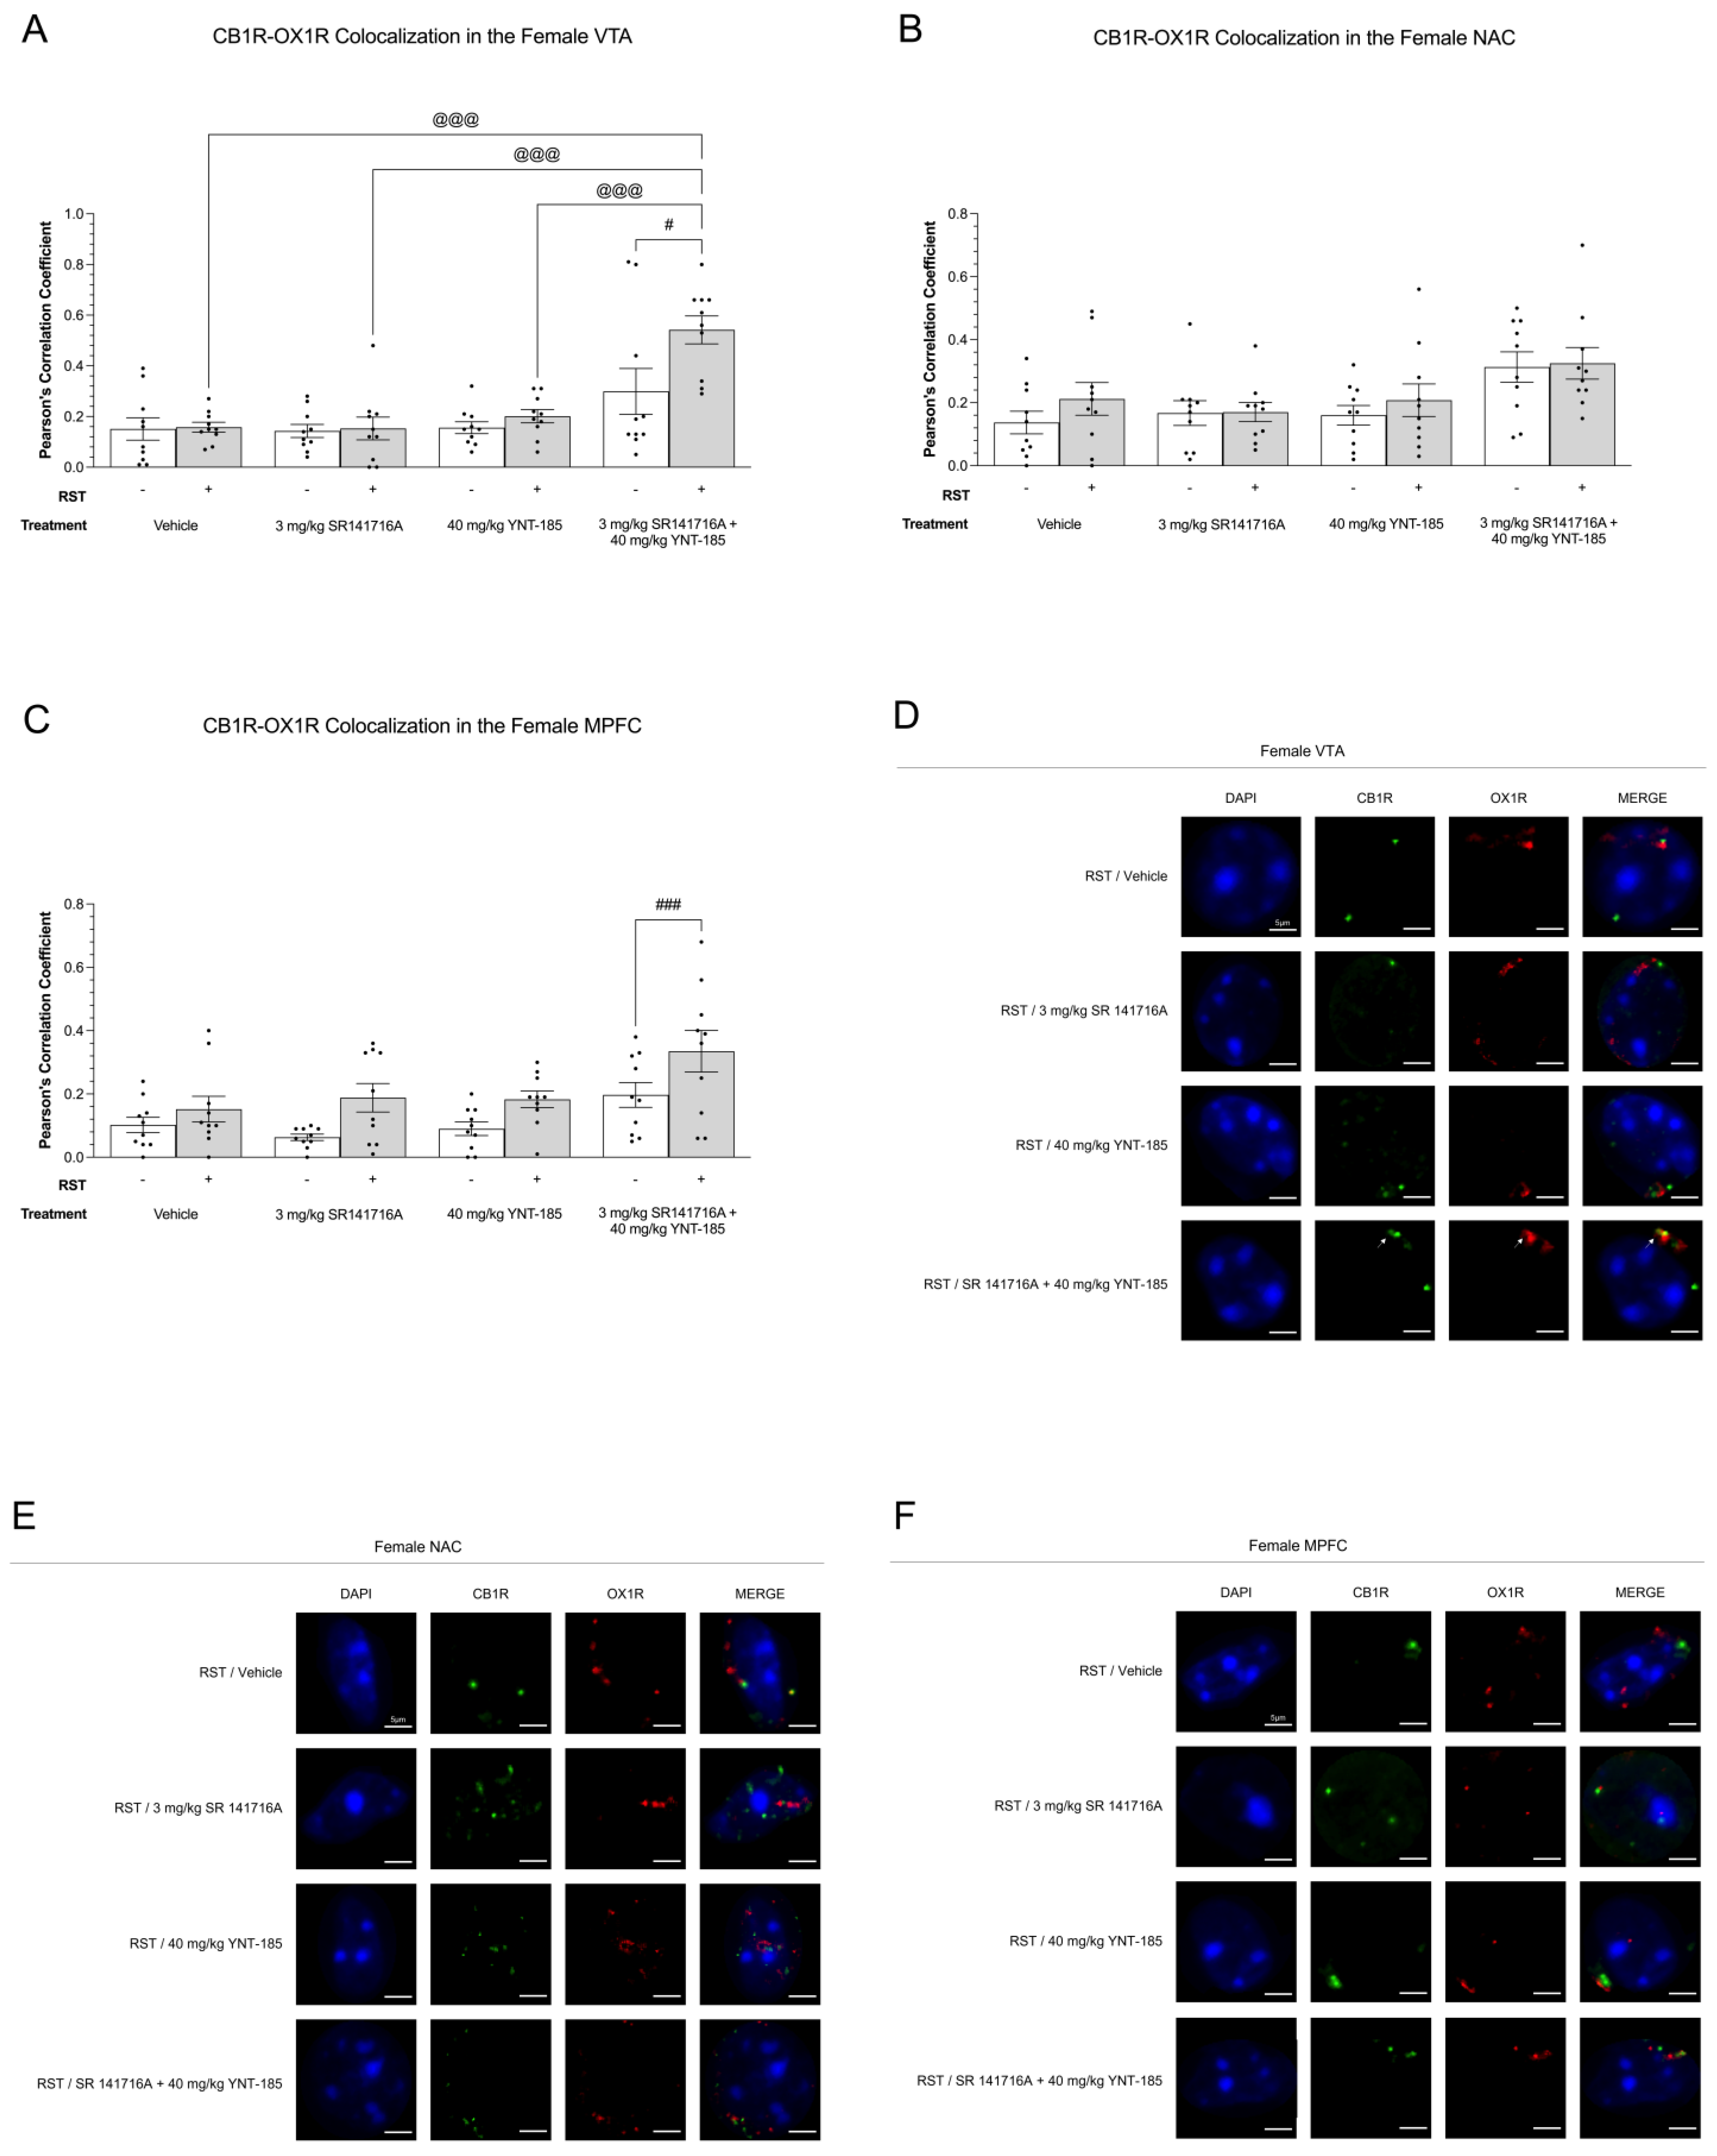
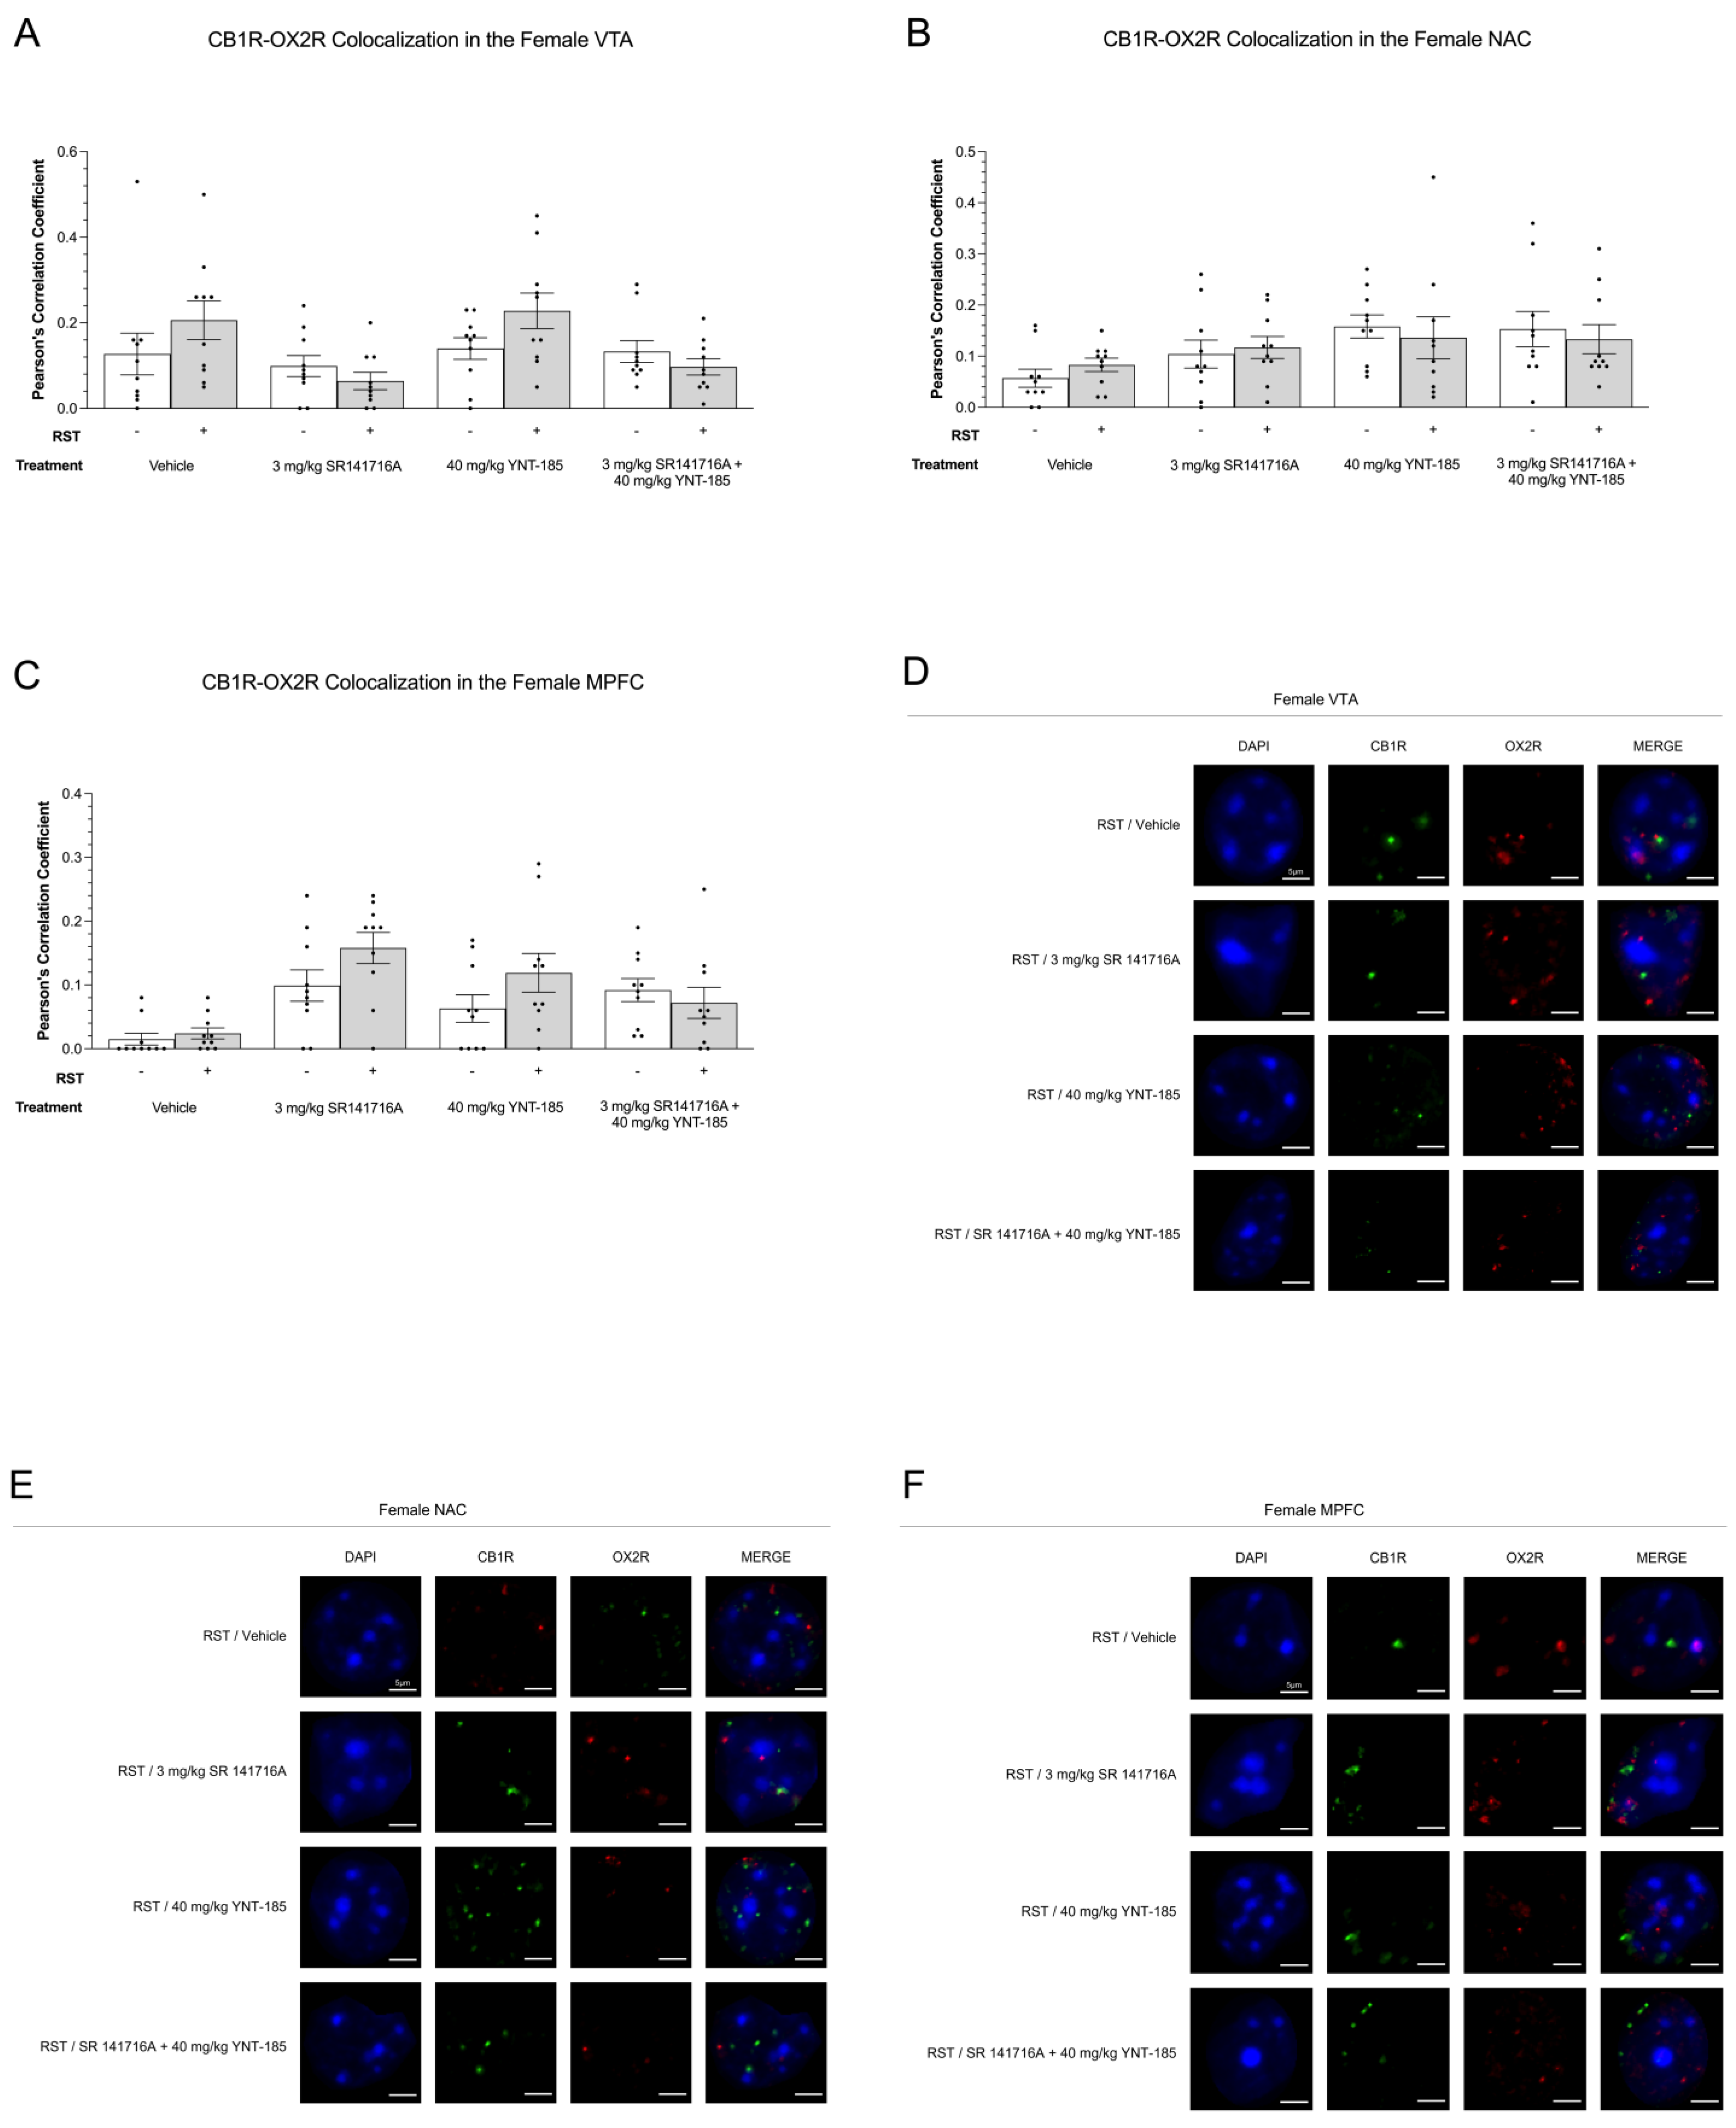
3.5. Cannabinoid–Orexin Receptor Colocalization in Female Brain Regions
3.5.1. CB1R-OX1R Colocalization
3.5.2. CB1R-OX2R Colocalization
4. Discussion
5. Conclusions
Supplementary Materials
Author Contributions
Funding
Institutional Review Board Statement
Informed Consent Statement
Data Availability Statement
Conflicts of Interest
References
- American Psychiatric Association. Diagnostic and Statistical Manual of Mental Disorders, 5th ed.; American Psychiatric Association: Washington, DC, USA, 2013. [Google Scholar] [CrossRef]
- Pizzagalli, D.A. Depression, stress, and anhedonia: Toward a synthesis and integrated model. Ann. Rev. Clin. Psychol. 2014, 10, 393–423. [Google Scholar] [CrossRef] [PubMed]
- Winer, E.S.; Bryant, J.; Bartoszek, G.; Rojas, E.; Nadorff, M.R.; Kilgore, J. Mapping the relationship between anxiety, anhedonia, and depression. J. Affect. Disord. 2017, 221, 289–296. [Google Scholar] [CrossRef] [PubMed]
- Garfield, J.B.; Lubman, D.I.; Yücel, M. Anhedonia in substance use disorders: A systematic review of its nature, course and clinical correlates. Aust. N. Z. J. Psychiatry 2014, 48, 36–51. [Google Scholar] [CrossRef]
- Khoo, S.Y.; Clemens, K.J.; McNally, G.P. Palatable food self-administration and reinstatement are not affected by dual orexin receptor antagonism. Prog. Neuro-Psychopharmacol. Biol. Psychiatry. 2018, 87, 147–157. [Google Scholar] [CrossRef] [PubMed]
- Freeman, L.R.; Bentzley, B.S.; James, M.H.; Aston-Jones, G. Sex Differences in Demand for Highly Palatable Foods: Role of the Orexin System. Int. J. Neuropharmacol. 2021, 24, 54–63. [Google Scholar] [CrossRef] [PubMed]
- Berridge, K.C.; Robinson, T.E. Parsing reward. Trends Neurosci. 2003, 26, 507–513. [Google Scholar] [CrossRef] [PubMed]
- Thomsen, K.R. Measuring anhedonia: Impaired ability to pursue, experience, and learn about reward. Front. Psychol. 2005, 6, 1409. [Google Scholar] [CrossRef] [PubMed]
- Vujanovic, A.A.; Wardle, M.C.; Smith, L.J.; Berenz, E.C. Reward functioning in posttraumatic stress and substance use disorders. Curr. Opin. Psychol. 2017, 14, 49–55. [Google Scholar] [CrossRef]
- Xie, J.; Fang, P.; Zhang, Z.; Luo, R.; Dai, B. Behavioral Inhibition/Activation Systems and Depression Among Females With Substance Use Disorder: The Mediating Role of Intolerance of Uncertainty and Anhedonia. Front. Psychiatry 2021, 12, 644882. [Google Scholar] [CrossRef]
- Antoniuk, S.; Bijata, M.; Ponimaskin, E.; Wlodarczyk, J. Chronic unpredictable mild stress for modeling depression in rodents: Meta-analysis of model reliability. Neurosci. Biobehav. Rev. 2019, 99, 101–116. [Google Scholar] [CrossRef]
- Chu, X.; Zhou, Y.; Hu, Z.; Lou, J.; Song, W.; Li, J.; Liang, X.; Chen, C.; Wang, S.; Yang, B.; et al. 24-hour-restraint stress induces long-term depressive-like phenotypes in mice. Sci. Rep. 2016, 6, 32935. [Google Scholar] [CrossRef]
- Shoji, H.; Miyakawa, T. Differential effects of stress exposure via two types of restraint apparatuses on behavior and plasma corticosterone level in inbred male BALB/cAJcl mice. Neuropsychopharmacol. Rep. 2020, 40, 73–84. [Google Scholar] [CrossRef]
- Goldstein Ferber, S.; Weller, A.; Yadid, G.; Friedman, A. Discovering the Lost Reward: Critical Locations for Endocannabinoid Modulation of the Cortico-Striatal Loop That Are Implicated in Major Depression. Int. J. Mol. Sci. 2021, 22, 1867. [Google Scholar] [CrossRef]
- Katzman, M.A.; Katzman, M.P. Neurobiology of the Orexin System and Its Potential Role in the Regulation of Hedonic Tone. Brain Sci. 2022, 12, 150. [Google Scholar] [CrossRef]
- Mackie, K. Cannabinoid receptors: Where they are and what they do. J. Neuroendocrinol. 2008, 20, 10–14. [Google Scholar] [CrossRef]
- Fagundo, A.B.; de la Torre, R.; Jiménez-Murcia, S.; Agüera, Z.; Pastor, A.; Casanueva, F.F.; Granero, R.; Baños, R.; Botella, C.; Del Pino-Gutierrez, A.; et al. Modulation of the Endocannabinoids N-Arachidonoylethanolamine (AEA) and 2-Arachidonoylglycerol (2-AG) on Executive Functions in Humans. PLoS ONE. 2013, 8, e66387. [Google Scholar] [CrossRef]
- Zou, S.; Kumar, U. Cannabinoid Receptors and the Endocannabinoid System: Signaling and Function in the Central Nervous System. Int. J. Mol. Sci. 2008, 19, 833. [Google Scholar] [CrossRef]
- Kukkonen, J.P. Orexin/Hypocretin Signaling. Curr. Top. Behav. Neurosci. 2017, 33, 17–50. [Google Scholar] [CrossRef]
- Schöne, C.; Burdakov, D. Orexin/Hypocretin and Organizing Principles for a Diversity of Wake-Promoting Neurons in the Brain. Curr. Top. Behav. Neurosci. 2017, 33, 51–74. [Google Scholar] [CrossRef]
- Yoshimichi, G.; Yoshimatsu, H.; Masaki, T.; Sakata, T. Orexin-A regulates body temperature in coordination with arousal status. Exp. Biol. Med. 2001, 226, 468–476. [Google Scholar] [CrossRef]
- Chen, Q.; de Lecea, L.; Hu, Z.; Gao, D. The hypocretin/orexin system: An increasingly important role in neuropsychiatry. Med. Res. Rev. 2015, 35, 152–197. [Google Scholar] [CrossRef]
- Li, J.; Hu, Z.; de Lecea, L. The hypocretins/orexins: Integrators of multiple physiological functions. Br. J. Pharmacol. 2014, 171, 332–350. [Google Scholar] [CrossRef]
- Tung, L.W.; Lu, G.L.; Lee, Y.H.; Yu, L.; Lee, H.J.; Leishman, E.; Bradshaw, H.; Hwang, L.L.; Hung, M.S.; Mackie, K.; et al. Orexins contribute to restraint stress-induced cocaine relapse by endocannabinoid-mediated disinhibition of dopaminergic neurons. Nat. Commun. 2016, 7, 12199. [Google Scholar] [CrossRef]
- Patel, S.; Hillard, C.J. Role of endocannabinoid signaling in anxiety and depression. Curr. Top. Behav. Neurosci. 2009, 1, 347–371. [Google Scholar] [CrossRef]
- Nollet, M.; Leman, S. Role of orexin in the pathophysiology of depression: Potential for pharmacological intervention. CNS Drugs 2013, 27, 411–422. [Google Scholar] [CrossRef]
- Johnson, P.L.; Molosh, A.; Fitz, S.D.; Truitt, W.A.; Shekhar, A. Orexin, stress, and anxiety/panic states. Prog. Brain Res. 2012, 198, 133–161. [Google Scholar] [CrossRef]
- Robinson, T.E.; Berridge, K.C. The neural basis of drug craving: An incentive-sensitization theory of addiction. Brain Res. Rev. 1993, 18, 247–291. [Google Scholar] [CrossRef]
- Berridge, K.C.; Robinson, T.E.; Aldridge, J.W. Dissecting components of reward: ‘liking’, ‘wanting’, and learning. Curr. Opin. Pharmacol. 2009, 9, 65–73. [Google Scholar] [CrossRef]
- Poleszak, E.; Wośko, S.; Sławińska, K.; Szopa, A.; Wróbel, A.; Serefko, A. Cannabinoids in depressive disorders. Life Sci. 2019, 213, 18–24. [Google Scholar] [CrossRef]
- Black, N.; Stockings, E.; Campbell, G.; Tran, L.T.; Zagic, D.; Hall, W.D.; Farrell, M.; Degenhardt, L. Cannabinoids for the treatment of mental disorders and symptoms of mental disorders: A systematic review and meta-analysis. Lancet Psychiat. 2019, 6, 995–1010. [Google Scholar] [CrossRef]
- Soya, S.; Sakurai, T. Orexin as a modulator of fear-related behavior: Hypothalamic control of noradrenaline circuit. Brain Res. 2020, 1731, 146037. [Google Scholar] [CrossRef]
- Prajapati, S.K.; Krishnamurthy, S. Non-selective orexin-receptor antagonist attenuates stress-re-stress-induced core PTSD-like symptoms in rats: Behavioural and neurochemical analyses. Behav. Brain Res. 2021, 399, 113015. [Google Scholar] [CrossRef]
- Hilairet, S.; Bouaboula, M.; Carrière, D.; Le Fur, G.; Casellas, P. Hypersensitization of the orexin 1 receptor by the CB1 receptor: Evidence for cross-talk blocked by the specific CB1 antagonist, SR141716. J. Biol. Chem. 2003, 278, 23731–23737. [Google Scholar] [CrossRef]
- Ellis, J.; Pediani, J.D.; Canals, M.; Milasta, S.; Milligan, G. Orexin-1 receptor-cannabinoid CB1 receptor heterodimerization results in both ligand dependent and -independent coordinated alterations of receptor localization and function. J. Biol. Chem. 2006, 281, 38812–38824. [Google Scholar] [CrossRef]
- Ward, R.J.; Pediani, J.D.; Milligan, G. Heteromultimerization of cannabinoid CB 1 receptor and orexin OX 1 receptor generates a unique complex in which both protomers are regulated by orexin A. J. Biol. Chem. 2011, 286, 37414–37428. [Google Scholar] [CrossRef]
- Jäntti, M.H.; Mandrika, I.; Kukkonen, J.P. Human orexin/hypocretin receptors form constitutive homo- and heteromeric complexes with each other and with human CB1 cannabinoid receptors. Biochem. Biophys. Res. Commun. 2014, 445, 486–490. [Google Scholar] [CrossRef]
- Marcus, J.N.; Aschkenasi, C.J.; Lee, C.E.; Chemelli, R.M.; Saper, C.B.; Yanagisawa, M.; Elmquist, J.K. Differential expression of Orexin receptors 1 and 2 in the rat brain. J. Comp. Neurol. 2001, 435, 6–25. [Google Scholar] [CrossRef]
- Mackie, K. Distribution of cannabinoid receptors in the central and peripheral nervous system. In Cannabinoids, 1st ed.; Pertwee, R.G., Ed.; Springer: Heidelberg, Germany, 2005; pp. 299–325. [Google Scholar]
- Kim, H.J.; Zagzoog, A.; Smolyakova, A.M.; Ezeaka, U.C.; Benko, M.J.; Holt, T.; Laprairie, R.B. In vivo Evidence for Brain Region-Specific Molecular Interactions between Cannabinoid and Orexin Receptors. Front. Neurosci. 2021, 15, 790546. [Google Scholar] [CrossRef]
- Zagzoog, A.; Mohamed, K.A.; Kim, H.; Kim, E.D.; Frank, C.S.; Black, T.; Jadhav, P.D.; Holbrook, L.A.; Laprairie, R.B. In vitro and in vivo pharmacological activity of minor cannabinoids isolated from Cannabis sativa. Sci. Rep. 2020, 10, 20405. [Google Scholar] [CrossRef]
- Zagzoog, A.; Brandt, A.L.; Black, T.; Kim, E.D.; Burkart, R.; Patel, M.; Jin, Z.; Nikolaeva, M.; Laprairie, R.B. Assessment of select synthetic cannabinoid receptor agonist bias and selectivity between the type 1 and type 2 cannabinoid receptor. Sci. Rep. 2021, 11, 10611. [Google Scholar] [CrossRef]
- Kim, H.J.; Zagzoog, A.; Black, T.; Baccetto, S.L.; Ezeaka, U.C.; Laprairie, R.B. Impact of the mouse estrus cycle on cannabinoid receptor agonist-induced molecular and behavioral outcomes. Pharmacol. Res. Perspect. 2021, 10, e00950. [Google Scholar] [CrossRef]
- Craft, R.M.; Wakley, A.A.; Tsutsui, K.T.; Laggart, J.D. Sex differences in cannabinoid 1 vs. cannabinoid 2 receptor-selective antagonism of antinociception produced by delta9-tetrahydrocannabinol and CP55,940 in the rat. J. Pharmacol. Exp. Ther. 2021, 340, 787–800. [Google Scholar] [CrossRef]
- Irukayama-Tomobe, Y.; Ogawa, Y.; Tominaga, H.; Ishikawa, Y.; Hosokawa, N.; Ambai, S.; Kawabe, Y.; Uchida, S.; Nakajima, R.; Saitoh, T.; et al. Nonpeptide orexin type-2 receptor agonist ameliorates narcolepsy-cataplexy symptoms in mouse models. Proc. Natl. Acad. Sci. 2017, 114, 5731–5736. [Google Scholar] [CrossRef]
- Canadian Council on Animal Care (CCAC). Guide to the Care and Use of Experimental Animals, 2nd ed.; Canadian Council on Animal Care: Ottawa, ON, Canada, 1993. [Google Scholar]
- Liu, M.Y.; Yin, C.Y.; Zhu, L.J.; Zhu, X.H.; Xu, C.; Luo, C.X.; Chen, H.; Zhu, D.Y.; Zhou, Q.G. Sucrose preference test for measurement of stress-induced anhedonia in mice. Nat. Protoc. 2018, 13, 1686–1698. [Google Scholar] [CrossRef]
- Zinchuk, V.; Zinchuk, O. Quantitative colocalization analysis of confocal fluorescence microscopy images. Curr. Protoc. Cell Biol. 2008, 39, 4–19. [Google Scholar] [CrossRef]
- Herman, J.P.; McKlveen, J.M.; Ghosal, S.; Kopp, B.; Wulsin, A.; Makinson, R.; Scheimann, J.; Myers, B. Regulation of the Hypothalamic-Pituitary-Adrenocortical Stress Response. Compr Physiol. 2016, 6, 603–621. [Google Scholar] [CrossRef]
- Rossi, M.A.; Stuber, G.D. Overlapping Brain Circuits for Homeostatic and Hedonic Feeding. Cell Metab. 2018, 27, 42–56. [Google Scholar] [CrossRef]
- Morena, M.; Patel, S.; Bains, J.S.; Hill, M.N. Neurobiological Interactions between Stress and the Endocannabinoid System. Neuropharmacology 2016, 41, 80–102. [Google Scholar] [CrossRef]
- Patel, S.; Roelke, C.T.; Rademacher, D.J.; Cullinan, W.E.; Hillard, C.J. Endocannabinoid signaling negatively modulates stress-induced activation of the hypothalamic-pituitary-adrenal axis. Endocrinology 2004, 145, 5431–5438. [Google Scholar] [CrossRef] [Green Version]
- Rademacher, D.J.; Meier, S.E.; Shi, L.; Ho, W.S.; Jarrahian, A.; Hillard, C.J. Effects of acute and repeated restraint stress on endocannabinoid content in the amygdala, ventral striatum, and medial prefrontal cortex in mice. Neuropharmacology 2008, 54, 108–116. [Google Scholar] [CrossRef]
- Wang, M.; Hill, M.N.; Zhang, L.; Gorzalka, B.B.; Hillard, C.J.; Alger, B.E. Acute restraint stress enhances hippocampal endocannabinoid function via glucocorticoid receptor activation. J. Psychopharmacol. 2012, 26, 56–70. [Google Scholar] [CrossRef] [PubMed]
- McLaughlin, R.J.; Hill, M.N.; Bambico, F.R.; Stuhr, K.L.; Gobbi, G.; Hillard, C.J.; Gorzalka, B.B. Prefrontal cortical anandamide signaling coordinates coping responses to stress through a serotonergic pathway. Eur. Neuropsychopharmacol. 2012, 22, 664–671. [Google Scholar] [CrossRef]
- Martin, M.; Ledent, C.; Parmentier, M.; Maldonado, R.; Valverde, O. Involvement of CB1 cannabinoid receptors in emotional behaviour. Psychopharmacology 2012, 159, 379–387. [Google Scholar] [CrossRef]
- Rademacher, D.J.; Hillard, C.J. Interactions between endocannabinoids and stress-induced decreased sensitivity to natural reward. Prog. Neuropsychopharmacol. Biol. Psychiatry 2007, 31, 633–641. [Google Scholar] [CrossRef]
- Winsky-Sommerer, R.; Yamanaka, A.; Diano, S.; Borok, E.; Roberts, A.J.; Sakurai, T.; Kilduff, T.S.; Horvath, T.L.; de Lecea, L. Interaction between the corticotropin-releasing factor system and hypocretins (orexins): A novel circuit mediating stress response. J. Neurosci. 2004, 24, 11439–11448. [Google Scholar] [CrossRef]
- Messina, G.; Di Bernardo, G.; Viggiano, A.; De Luca, V.; Monda, V.; Messina, A.; Chieffi, S.; Galderisi, U.; Monda, M. Exercise increases the level of plasma orexin A in humans. J. Basic Clin. Physiol. Pharmacol. 2016, 27, 611–616. [Google Scholar] [CrossRef]
- Piccoli, L.; Micioni Di Bonaventura, M.V.; Cifani, C.; Costantini, V.J.; Massagrande, M.; Montanari, D.; Martinelli, P.; Antolini, M.; Ciccocioppo, R.; Massi, M.; et al. Role of orexin-1 receptor mechanisms on compulsive food consumption in a model of binge eating in female rats. Neuropharmacology 2012, 37, 1999–2011. [Google Scholar] [CrossRef]
- Panhelainen, A.E.; Korpi, E.R. Evidence for a role of inhibition of orexinergic neurons in the anxiolytic and sedative effects of diazepam: A c-Fos study. Pharmacol. Biochem. Behav. 2012, 101, 115–124. [Google Scholar] [CrossRef]
- Johnson, P.L.; Federici, L.M.; Fitz, S.D.; Renger, J.J.; Shireman, B.; Winrow, C.J.; Bonaventure, P.; Shekhar, A. Orexin 1 and 2 receptor involvement in co2 -induced panic-associated behavior and autonomic responses. Depress Anxiety 2015, 32, 671–683. [Google Scholar] [CrossRef] [Green Version]
- Salvadore, G.; Bonaventure, P.; Shekhar, A.; Johnson, P.L.; Lord, B.; Shireman, B.T.; Lebold, T.P.; Nepomuceno, D.; Dugovic, C.; Brooks, S.; et al. Translational evaluation of novel selective orexin-1 receptor antagonist JNJ-61393215 in an experimental model for panic in rodents and humans. Transl. Psychiatry 2020, 10, 308. [Google Scholar] [CrossRef]
- Gorka, S.M.; Khorrami, K.J.; Manzler, C.A.; Phan, K.L. Acute orexin antagonism selectively modulates anticipatory anxiety in humans: Implications for addiction and anxiety. Transl. Psychiatry 2022, 12, 308. [Google Scholar] [CrossRef]
- Grafe, L.A.; Eacret, D.; Luz, S.; Gotter, A.L.; Renger, J.J.; Winrow, C.J.; Bhatnagar, S. Orexin 2 receptor regulation of the hypothalamic-pituitary-adrenal (HPA) response to acute and repeated stress. J. Neurosci. 2017, 348, 313–323. [Google Scholar] [CrossRef]
- Mahler, S.V.; Moorman, D.E.; Smith, R.J.; James, M.H.; Aston-Jones, G. Motivational activation: A unifying hypothesis of orexin/hypocretin function. Nat. Neurosci. 2014, 17, 1298–1303. [Google Scholar] [CrossRef]
- Grafe, L.A.; Bhatnagar, S. Orexins and stress. Front. Neuroendocrinol. 2018, 51, 132–145. [Google Scholar] [CrossRef]
- Kalló, I.; Omrani, A.; Meye, F.J.; de Jong, H.; Liposits, Z.; Adan, R. Characterization of orexin input to dopamine neurons of the ventral tegmental area projecting to the medial prefrontal cortex and shell of nucleus accumbens. Brain Struct. Funct. 2022, 227, 1083–1098. [Google Scholar] [CrossRef]
- Hervieu, G.J.; Cluderay, J.E.; Harrison, D.C.; Roberts, J.C.; Leslie, R.A. Gene expression and protein distribution of the orexin-1 receptor in the rat brain and spinal cord. J. Neurosci. 2021, 103, 777–797. [Google Scholar] [CrossRef]
- Castelli, M.P.; Fadda, P.; Casu, A.; Spano, M.S.; Casti, A.; Fratta, W.; Fattore, L. Male and female rats differ in brain cannabinoid CB1 receptor density and function and in behavioural traits predisposing to drug addiction: Effect of ovarian hormones. Curr. Pharm. Des. 2014, 20, 2100–2113. [Google Scholar] [CrossRef]
- Grafe, L.A.; Cornfeld, A.; Luz, S.; Valentino, R.; Bhatnagar, S. Orexins Mediate Sex Differences in the Stress Response and in Cognitive Flexibility. Biol. Psychiatry 2017, 81, 683–692. [Google Scholar] [CrossRef]
- Anderson, J.J.; Kask, A.M.; Chase, T.N. Effects of cannabinoid receptor stimulation and blockade on catalepsy produced by dopamine receptor antagonists. Eur. J. Pharmacol. 1996, 295, 163–168. [Google Scholar] [CrossRef]
- Delgado, M.R.; Nystrom, L.E.; Fissell, C.; Noll, D.C.; Fiez, J.A. Tracking the hemodynamic responses to reward and punishment in the striatum. J. Neurophysiol. 2000, 84, 3072–3077. [Google Scholar] [CrossRef]
- Delgado, M.R. Reward-related responses in the human striatum. Ann. N. Y. Acad. Sci. 2007, 1104, 70–88. [Google Scholar] [CrossRef]
- Flores, Á.; Julià-Hernández, M.; Maldonado, R.; Berrendero, F. Involvement of the orexin/hypocretin system in the pharmacological effects induced by Δ(9) -tetrahydrocannabinol. Br. J. Pharmacol. 2016, 173, 1381–1392. [Google Scholar] [CrossRef]
- James, M.H.; Campbell, E.J.; Dayas, C.V. Role of the Orexin/Hypocretin System in Stress-Related Psychiatric Disorders. Curr. Top. Behav. Neurosci. 2017, 33, 197–219. [Google Scholar] [CrossRef]


Disclaimer/Publisher’s Note: The statements, opinions and data contained in all publications are solely those of the individual author(s) and contributor(s) and not of MDPI and/or the editor(s). MDPI and/or the editor(s) disclaim responsibility for any injury to people or property resulting from any ideas, methods, instructions or products referred to in the content. |
© 2023 by the authors. Licensee MDPI, Basel, Switzerland. This article is an open access article distributed under the terms and conditions of the Creative Commons Attribution (CC BY) license (https://creativecommons.org/licenses/by/4.0/).
Share and Cite
Kim, H.J.J.; Zagzoog, A.; Ceni, C.; Ferrisi, R.; Janz, N.; Laprairie, R.B. Dual Cannabinoid and Orexin Regulation of Anhedonic Behaviour Caused by Prolonged Restraint Stress. Brain Sci. 2023, 13, 314. https://doi.org/10.3390/brainsci13020314
Kim HJJ, Zagzoog A, Ceni C, Ferrisi R, Janz N, Laprairie RB. Dual Cannabinoid and Orexin Regulation of Anhedonic Behaviour Caused by Prolonged Restraint Stress. Brain Sciences. 2023; 13(2):314. https://doi.org/10.3390/brainsci13020314
Chicago/Turabian StyleKim, Hye Ji J., Ayat Zagzoog, Costanza Ceni, Rebecca Ferrisi, Nicola Janz, and Robert B. Laprairie. 2023. "Dual Cannabinoid and Orexin Regulation of Anhedonic Behaviour Caused by Prolonged Restraint Stress" Brain Sciences 13, no. 2: 314. https://doi.org/10.3390/brainsci13020314