
Graph-Based Analysis of Brain Connectivity in Multiple Sclerosis Using Functional MRI: A Systematic Review


Abstract
:1. Introduction
2. Materials and Methods
2.1. Research Questions for Literature Review
- RQ1:
- What is the role of fMRI in studying brain connectivity in people with MS?
- RQ2:
- How is brain connectivity altered in the brain network in people with MS?
- RQ3:
- What is the value of applying graph theory for neurological disorders such as MS?
- RQ4:
- How does graph theory help detect early stages of MS or MS progression?
2.2. Study Search and Selection Process
- “Multiple sclerosis” OR “MS” AND “fMRI” AND “graph theory”;
- “Multiple sclerosis” OR “MS” AND “fMRI”
- “Multiple sclerosis” OR “MS” AND “graph theory”;
- “Multiple sclerosis” OR “MS” AND “brain connectivity”;
- “Multiple sclerosis” OR “MS” AND “brain network”;
- “Multiple sclerosis” OR “MS” AND “graph theory” AND “node”.
2.3. Eligible Studies and Quality Assessment
- Articles in English, original peer-reviewed articles,
- articles collecting functional magnetic resonance imaging (fMRI) data,
- articles with precise methods and explanations of the results,
- articles using graph theory for the analysis.
- Articles not answering or aligning with the research questions.
3. Results
3.1. Quality Assessment of the Selected Articles
3.2. Study Characteristics
3.3. Overview of the Review
4. Discussion
- The role of fMRI as a neuroimaging method in studying MS;
- Brain connectivity in MS (including brain functional connectivity and brain effective connectivity in MS);
- The role of graph theory as a computational approach in studying MS (including referring to other computational approaches, graph theory for disease detection, disease progression, and network alterations in MS);
- Limitations and considerations of applying graph theory to fMRI data on MS patients.
4.1. fMRI in MS Studies

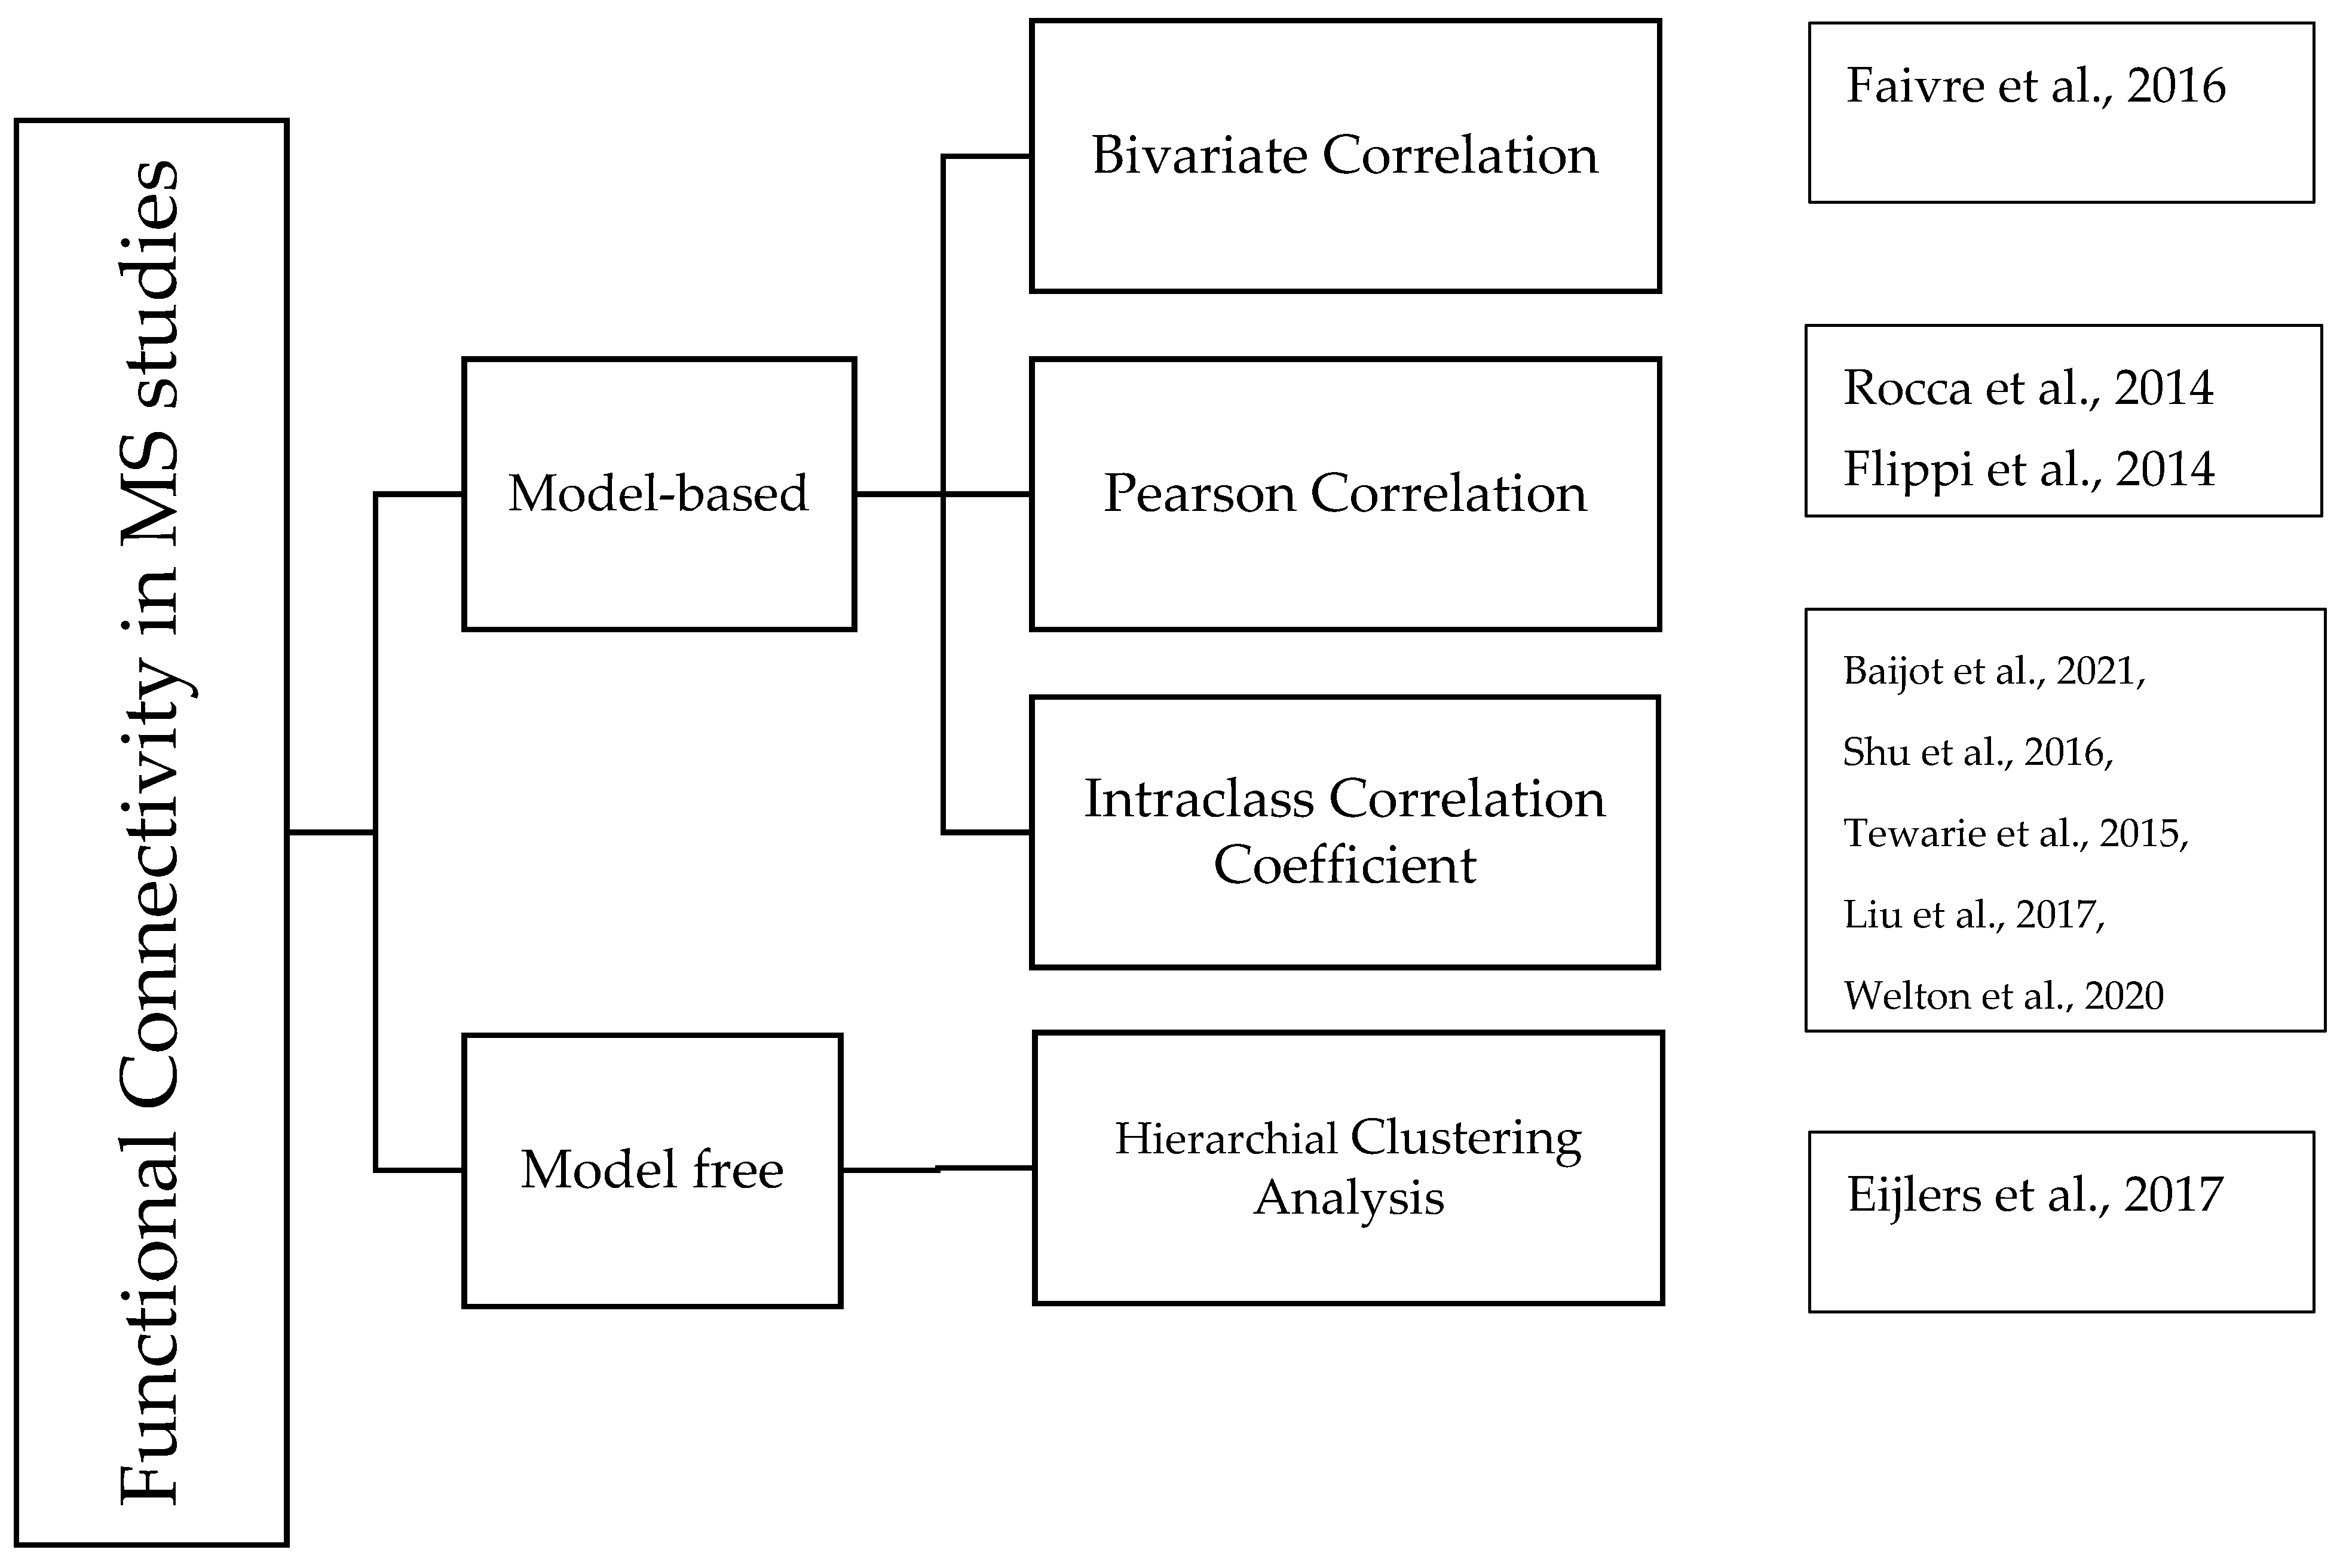
4.2. Brain Connectivity in MS

| Papers | Regions with Altered Functional Connectivity in MS | Alteration in FC |
|---|---|---|
| [74] | Bilateral inferior parietal cortex, posterior cingulate, medial prefrontal cortex |  |
| [75] | Caudate nucleus and motor cortex | |
| [76] | Anterior and middle parts of the putamen, adjacent globus pallidus, anterior and posterior thalamus, subthalamic nucleus, motor network | |
| [77] | Sensorimotor and somatosensory association |  |
| [78,79] | Right sensory-motor and premotor cortex, and anterior cingulate gyrus | |
| [80] | Subcortical and default-mode networks | |
| [81] | Insula and the dACC to the striatum | |
| [82] | Thalamus and several cortical regions | |
| [82] | Intra- and inter-thalamic connectivity | |
| [83] | Left hippocampus and cortical regions | |
| [84] | Medial prefrontal and frontal pole regions | |
| [85] | Fusiform gyrus with the right lateral occipital cortex | |
| [86] | Sensorimotor cerebellum with cerebellar, thalamic, and cortical (frontal, parietal, and temporal) areas | |
| [86] | Sensorimotor cerebellum with insular areas | |
| [87] | Right medial thalamic nuclei connectivity with bilateral caudate/thalamus and left cerebellar areas | |
| [87] | Left anterior thalamic nuclei and anterior cingulate cortex, bilaterally | |
| [88] | Superior ventral striatum and posterior cingulate cortex | |
| [89] | DMN in the posterior cingulate cortex and bilateral inferior parietal cortex | |
| [72] | Bilateral hippocampal and dorsal-frontal components | |
| [72] | Cerebellum, thalamus, cingulum, and prefrontal cortex components | |
| [33] | Prefrontal cortices, anterior and posterior cingulate cortices, anterior and middle temporal cortices, inferior parietal cortex, and thalamus | |
4.3. Brain Functional Connectivity in MS
4.4. Brain Effective Connectivity in MS Studies
4.5. Graph Theory in Studying Brain Connectivity
4.6. Graph Theory in MS
Properties for Graph Theory Using MS Data Based on fMRI
4.7. Other Computational Approaches in MS Studies Using fMRI
Graph Theory Combined with Machine Learning in MS Studies
4.8. Disease Detection and Prediction in MS Studies with Graph Theory
4.8.1. Network Abnormalities in Patients with MS
4.8.2. Cognitive Impairment and Network Efficiency in MS
4.9. Graph Theory Analysis of Disease Progression in MS
- Hubs (High-Degree Nodes)
- White Matter Lesions
4.10. Toolboxes for Statistical Analysis in MS Studies Using fMRI
4.11. Limitation and Future Directions in MS Studies Using Graph Theory
- Experiment Design:
- Sample Size
- Graph-Theory-Related Limitations in MS Studies
- Network Reliability Limitations
- Study Design Limitations
- Disease Classification
- Overlapping in the Network
- Suggestions and Future Work
5. Conclusions
Author Contributions
Funding
Institutional Review Board Statement
Informed Consent Statement
Conflicts of Interest
References
- Apostolopoulos, V.; Matsoukas, J. Advances in Multiple Sclerosis Research–Series I. Brain Sci. 2020, 10, 795. [Google Scholar] [CrossRef]
- Fleischer, V.; Muthuraman, M.; Anwar, A.R.; Gonzalez-Escamilla, G.; Radetz, A.; Gracien, R.-M.; Bittner, S.; Luessi, F.; Meuth, S.G.; Zipp, F.; et al. Continuous reorganization of cortical information flow in multiple sclerosis: A longitudinal fMRI effective connectivity study. Sci. Rep. 2020, 10, 806. [Google Scholar] [CrossRef] [Green Version]
- Macaron, G.; Ontaneda, D. Diagnosis and Management of Progressive Multiple Sclerosis. Biomedicines 2019, 7, 56. [Google Scholar] [CrossRef] [Green Version]
- Siegert, R.J.; Abernethy, D.A. Depression in multiple sclerosis: A review. J. Neurol. Neurosurg. Psychiatry 2005, 76, 469–475. [Google Scholar] [CrossRef] [Green Version]
- Grossman, P.; Kappos, L.; Gensicke, H.; D’Souza, M.; Mohr, D.C.; Penner, I.K.; Steiner, C. MS quality of life, depression, and fatigue improve after mindfulness training: A randomized trial. Neurology 2010, 75, 1141–1149. [Google Scholar] [CrossRef] [Green Version]
- Sauder, T.; Keune, P.M.; Müller, R.; Schenk, T.; Oschmann, P.; Hansen, S. Trait mindfulness is primarily associated with depression and not with fatigue in multiple sclerosis (MS): Implications for mindfulness-based interventions. BMC Neurol. 2021, 21, 115. [Google Scholar] [CrossRef]
- Rocca, M.A.; De Meo, E.; Filippi, M. Functional MRI in investigating cognitive impairment in multiple sclerosis. Acta Neurol. Scand. 2016, 134, 39–46. [Google Scholar] [CrossRef]
- Kurtzke, J.F. Rating neurologic impairment in multiple sclerosis: An expanded disability status scale (EDSS). Neurology 1983, 33, 1444–1452. [Google Scholar] [CrossRef] [Green Version]
- World Health Organization. Atlas: Multiple Sclerosis Resources in the World 2008; World Health Organization: Geneva, Switzerland, 2008.
- MS Classifications Revised. Available online: https://momentummagazineonline.com/ms-classifications-revised/ (accessed on 5 December 2022).
- Walton, C.; King, R.; Rechtman, L.; Kaye, W.; Leray, E.; Marrie, R.A.; Robertson, N.; La Rocca, N.; Uitdehaag, B.; Van Der Mei, I.; et al. Rising prevalence of multiple sclerosis worldwide: Insights from the Atlas of MS, third edition. Mult. Scler. J. 2020, 26, 1816–1821. [Google Scholar] [CrossRef]
- Sintzel, M.B.; Rametta, M.; Reder, A.T. Vitamin D and Multiple Sclerosis: A Comprehensive Review. Neurol. Ther. 2017, 7, 59–85. [Google Scholar] [CrossRef]
- Bjornevik, K.; Cortese, M.; Healy, B.C.; Kuhle, J.; Mina, M.J.; Leng, Y.; Elledge, S.J.; Niebuhr, D.W.; Scher, A.I.; Munger, K.L.; et al. Longitudinal analysis reveals high prevalence of Epstein-Barr virus associated with multiple sclerosis. Science 2022, 375, 296–301. [Google Scholar] [CrossRef]
- Lublin, F.D.; Reingold, S.C.; Cohen, J.A.; Cutter, G.R.; Sørensen, P.S.; Thompson, A.J.; Wolinsky, J.S.; Balcer, L.J.; Banwell, B.; Barkhof, F. Defining the clinical course of multiple sclerosis: The 2013 revisions. Neurology 2014, 83, 278–286. [Google Scholar] [CrossRef] [Green Version]
- McDonald, W.I.; Compston, A.; Edan, G.; Goodkin, D.; Hartung, H.P.; Lublin, F.D.; McFarland, H.F.; Paty, D.W.; Polman, C.H.; Reingold, S.C. Recommended diagnostic criteria for multiple sclerosis: Guidelines from the International Panel on the diagnosis of multiple sclerosis. Ann. Neurol. 2001, 50, 121–127. [Google Scholar] [CrossRef]
- Polman, C.H.; Wolinsky, J.S.; Reingold, S.C. Multiple sclerosis diagnostic criteria: Three years later. Mult. Scler. J. 2005, 11, 5–12. [Google Scholar] [CrossRef]
- Politis, M. Neuroimaging in Parkinson disease: From research setting to clinical practice. Nat. Rev. Neurol. 2014, 10, 708–722. [Google Scholar] [CrossRef]
- Jameen, A.; Ribbons, K.; Lechner-Scott, J.; Ramadan, S. Evaluation of MS related central fatigue using MR neuroimaging methods: Scoping review. J. Neurol. Sci. 2019, 400, 52–71. [Google Scholar]
- Filippi, M.; A Rocca, M. Present and future of fMRI in multiple sclerosis. Expert Rev. Neurother. 2013, 13, 27–31. [Google Scholar] [CrossRef]
- Kose, U.; Alzubi, J. Deep Learning for Cancer Diagnosis; Springer: Singapore, 2021. [Google Scholar]
- Zeng, L.-L.; Wang, H.; Hu, P.; Yang, B.; Pu, W.; Shen, H.; Chen, X.; Liu, Z.; Yin, H.; Tan, Q.; et al. Multi-Site Diagnostic Classification of Schizophrenia Using Discriminant Deep Learning with Functional Connectivity MRI. Ebiomedicine 2018, 30, 74–85. [Google Scholar] [CrossRef] [Green Version]
- Saccà, V.; Sarica, A.; Novellino, F.; Barone, S.; Tallarico, T.; Filippelli, E.; Granata, A.; Chiriaco, C.; Bossio, R.B.; Valentino, P.; et al. Evaluation of machine learning algorithms performance for the prediction of early multiple sclerosis from resting-state FMRI connectivity data. Brain Imaging Behav. 2018, 13, 1103–1114. [Google Scholar] [CrossRef]
- Shoeibi, A.; Khodatars, M.; Jafari, M.; Moridian, P.; Rezaei, M.; Alizadehsani, R.; Khozeimeh, F.; Gorriz, J.M.; Heras, J.; Panahiazar, M. Applications of Deep Learning Techniques for Automated Multiple Sclerosis Detection Using Magnetic Resonance Imaging: A Review. arXiv 2021, arXiv:2105.04881. [Google Scholar] [CrossRef]
- Fleischer, V.; Radetz, A.; Ciolac, D.; Muthuraman, M.; Gonzalez-Escamilla, G.; Zipp, F.; Groppa, S. Graph Theoretical Framework of Brain Networks in Multiple Sclerosis: A Review of Concepts. Neuroscience 2017, 403, 35–53. [Google Scholar] [CrossRef]
- Bullmore, E.; Sporns, O. The economy of brain network organization. Nat. Rev. Neurosci. 2012, 13, 336–349. [Google Scholar] [CrossRef]
- Moher, D.; Liberati, A.; Tetzlaff, J.; Altman, D.G.; PRISMA Group. Preferred reporting items for systematic reviews and meta-analyses: The PRISMA statement. PLoS Med. 2009, 6, e1000097. [Google Scholar] [CrossRef] [Green Version]
- Whiting, P.; Savović, J.; Higgins, J.P.; Caldwell, D.M.; Reeves, B.C.; Shea, B.; Davies, P.; Kleijnen, J.; Churchill, R. ROBIS: A new tool to assess risk of bias in systematic reviews was developed. J. Clin. Epidemiol. 2016, 69, 225–234. [Google Scholar] [CrossRef] [Green Version]
- He, Y.; Dagher, A.; Chen, Z.; Charil, A.; Zijdenbos, A.; Worsley, K.; Evans, A. Impaired small-world efficiency in structural cortical networks in multiple sclerosis associated with white matter lesion load. Brain 2009, 132, 3366–3379. [Google Scholar] [CrossRef] [Green Version]
- Gamboa, O.; Tagliazucchi, E.; von Wegner, F.; Jurcoane, A.; Wahl, M.; Laufs, H.; Ziemann, U. Working memory performance of early MS patients correlates inversely with modularity increases in resting state functional connectivity networks. Neuroimage 2014, 94, 385–395. [Google Scholar] [CrossRef]
- Filippi, M.; Valsasina, P.; Bisecco, A.; Meani, A.; Parisi, L.; Messina, M.J.; Colombo, B.; Falini, A.; Comi, G.; Rocca, M. Thalamic dysfunction is associated with fatigue in patients with multiple sclerosis: A graph theory study (S13.003). Neurology 2014, 82, S13.003. [Google Scholar]
- Schoonheim, M.M.; Geurts, J.J.G.; Wiebenga, O.T.; De Munck, J.C.; Polman, C.H.; Stam, C.J.; Barkhof, F.; Wink, A.M. Changes in functional network centrality underlie cognitive dysfunction and physical disability in multiple sclerosis. Mult. Scler. J. 2013, 20, 1058–1065. [Google Scholar] [CrossRef]
- Rocca, M.A.; Valsasina, P.; Meani, A.; Falini, A.; Comi, G.; Filippi, M. Impaired functional integration in multiple sclerosis: A graph theory study. Anat. Embryol. 2014, 221, 115–131. [Google Scholar] [CrossRef]
- Faivre, A.; Robinet, E.; Guye, M.; Rousseau, C.; Maarouf, A.; Le Troter, A.; Zaaraoui, W.; Rico, A.; Crespy, L.; Soulier, E.; et al. Depletion of brain functional connectivity enhancement leads to disability progression in multiple sclerosis: A longitudinal resting-state fMRI study. Mult. Scler. J. 2016, 22, 1695–1708. [Google Scholar] [CrossRef]
- Chirumamilla, V.C.; Fleischer, V.; Droby, A.; Anjum, T.; Muthuraman, M.; Zipp, F.; Groppa, S. Functional connectivity analysis using whole brain and regional network metrics in MS patients. In Proceedings of the 2016 38th Annual International Conference of the IEEE Engineering in Medicine and Biology Society (EMBC), Orlando, FL, USA, 16–20 August 2016; pp. 4039–4042. [Google Scholar]
- Eqlimi, E.; Shalchy, M.A.; Karami, E.; Shojaei, A.; Aarabi, M.H.; Safabakhsh, H.; Alam, N.R. Modular Organization of Resting State Functional Networks in Patients with Multiple Sclerosis. In Proceedings of the 37th Annual International Conference of the IEEE Engineering in Medicine and Biology Society (EMBC 2015), Milan, Italy, 25–29 August 2015. [Google Scholar]
- Eijlers, A.J.; Meijer, K.A.; Wassenaar, T.M.; Steenwijk, M.D.; Uitdehaag, B.M.; Barkhof, F.; Wink, A.M.; Geurts, J.J.; Schoonheim, M.M. Increased default-mode network centrality in cognitively impaired multiple sclerosis patients. Neurology 2017, 88, 952–960. [Google Scholar] [CrossRef]
- Stellmann, J.-P.; Hodecker, S.; Cheng, B.; Wanke, N.; Young, K.L.; Hilgetag, C.; Gerloff, C.; Heesen, C.; Thomalla, G.; Siemonsen, S. Reduced rich-club connectivity is related to disability in primary progressive MS. Neurol.—Neuroimmunol. Neuroinflamm. 2017, 4, e375. [Google Scholar] [CrossRef]
- Liu, Y.; Wang, H.; Duan, Y.; Huang, J.; Ren, Z.; Ye, J.; Dong, H.; Shi, F.; Li, K.; Wang, J. Functional Brain Network Alterations in Clinically Isolated Syndrome and Multiple Sclerosis: A Graph-based Connectome Study. Radiology 2017, 282, 534–541. [Google Scholar] [CrossRef] [Green Version]
- Lin, S.-J.; Vavasour, I.; Kosaka, B.; Li, D.K.B.; Traboulsee, A.; Mackay, A.; McKeown, M.J. Education, and the balance between dynamic and stationary functional connectivity jointly support executive functions in relapsing–remitting multiple sclerosis. Hum. Brain Mapp. 2018, 39, 5039–5049. [Google Scholar] [CrossRef] [Green Version]
- Liu, Y.; Duan, Y.; Dong, H.; Barkhof, F.; Li, K.; Shu, N. Disrupted Module Efficiency of Structural and Functional Brain Connectomes in Clinically Isolated Syndrome and Multiple Sclerosis. Front. Hum. Neurosci. 2018, 12, 138. [Google Scholar] [CrossRef] [Green Version]
- Carotenuto, A.; Wilson, H.; Giordano, B.; Caminiti, S.P.; Chappell, Z.; Williams, S.C.R.; Hammers, A.; Silber, E.; Brex, P.; Politis, M. Impaired connectivity within neuromodulatory networks in multiple sclerosis and clinical implications. J. Neurol. 2020, 267, 2042–2053. [Google Scholar] [CrossRef] [Green Version]
- Welton, T.; Constantinescu, C.S.; Auer, D.P.; A Dineen, R. Graph Theoretic Analysis of Brain Connectomics in Multiple Sclerosis: Reliability and Relationship with Cognition. Brain Connect. 2020, 10, 95–104. [Google Scholar] [CrossRef]
- Silemek, A.C.H.; Fischer, L.; Pöttgen, J.; Penner, I.-K.; Engel, A.K.; Heesen, C.; Gold, S.M.; Stellmann, J.-P. Functional and structural connectivity substrates of cognitive performance in relapsing remitting multiple sclerosis with mild disability. NeuroImage Clin. 2020, 25, 102177. [Google Scholar] [CrossRef]
- Tommasin, S.; De Giglio, L.; Ruggieri, S.; Petsas, N.; Giannì, C.; Pozzilli, C.; Pantano, P. Multi-scale resting state functional reorganization in response to multiple sclerosis damage. Neuroradiology 2020, 62, 693–704. [Google Scholar] [CrossRef]
- Koubiyr, I.; Deloire, M.; Besson, P.; Coupé, P.; Dulau, C.; Pelletier, J.; Tourdias, T.; Audoin, B.; Brochet, B.; Ranjeva, J.-P.; et al. Longitudinal study of functional brain network reorganization in clinically isolated syndrome. Mult. Scler. J. 2018, 26, 188–200. [Google Scholar] [CrossRef]
- Hawkins, R.; Shatil, A.; Lee, L.; Sengupta, A.; Zhang, L.; Morrow, S.; Aviv, R. Reduced Global Efficiency and Random Network Features in Patients with Relapsing-Remitting Multiple Sclerosis with Cognitive Impairment. Am. J. Neuroradiol. 2020, 41, 449–455. [Google Scholar] [CrossRef] [PubMed]
- Baijot, J.; Denissen, S.; Costers, L.; Gielen, J.; Cambron, M.; D’Haeseleer, M.; D’Hooghe, M.B.; Vanbinst, A.-M.; De Mey, J.; Nagels, G.; et al. Signal quality as Achilles’ heel of graph theory in functional magnetic resonance imaging in multiple sclerosis. Sci. Rep. 2021, 11, 7376. [Google Scholar] [CrossRef] [PubMed]
- Koubiyr, I.; Deloire, M.; Brochet, B.; Besson, P.; Charré-Morin, J.; Saubusse, A.; Tourdias, T.; Ruet, A. Structural constraints of functional connectivity drive cognitive impairment in the early stages of multiple sclerosis. Mult. Scler. J. 2020, 27, 559–567. [Google Scholar] [CrossRef]
- Ashtiani, S.N.M.; Behnam, H.; Daliri, M.R. Diagnosis of Multiple Sclerosis Using Graph-Theoretic Measures of Cognitive-Task-Based Functional Connectivity Networks. IEEE Trans. Cogn. Dev. Syst. 2021, 14, 926–934. [Google Scholar] [CrossRef]
- Boscheron, J.; Ruet, A.; Deloire, M.; Charré-Morin, J.; Saubusse, A.; Brochet, B.; Tourdias, T.; Koubiyr, I. Insights on the Relationship Between Hippocampal Connectivity and Memory Performances at the Early Stage of Multiple Sclerosis. Front. Neurol. 2021, 12, 752. [Google Scholar] [CrossRef]
- Saadat, N.; Mayo, C.D.; Lacey, C.; Gawryluk, J.R. Functional connectivity pre-post exercise intervention in individuals with relapsing-remitting multiple sclerosis. Neuroreport 2021, 32, 1100–1105. [Google Scholar] [CrossRef]
- Backner, Y.; Zamir, S.; Petrou, P.; Paul, F.; Karussis, D.; Levin, N. Anatomical and functional visual network patterns in progressive multiple sclerosis. Hum. Brain Mapp. 2021, 43, 1590–1597. [Google Scholar] [CrossRef]
- Chiaravalloti, N.D.; Wylie, G.; Leavitt, V.; DeLuca, J. Increased cerebral activation after behavioral treatment for memory deficits in MS. J. Neurol. 2012, 259, 1337–1346. [Google Scholar] [CrossRef]
- Azarmi, F.; Ashtiani, S.N.M.; Shalbaf, A.; Behnam, H.; Daliri, M.R. Granger causality analysis in combination with directed network measures for classification of MS patients and healthy controls using task-related fMRI. Comput. Biol. Med. 2019, 115, 103495. [Google Scholar] [CrossRef]
- Stellmann, J.-P.; Wanke, N.; Maarouf, A.; Gellißen, S.; Heesen, C.; Audoin, B.; Gold, S.M.; Zaaraoui, W.; Poettgen, J. Cognitive performance shows domain specific associations with regional cortical thickness in multiple sclerosis. NeuroImage Clin. 2021, 30, 102606. [Google Scholar] [CrossRef]
- Schega, L.; Hamacher, D.; Sailer, M.; Broscheid, K.-C. Reliability of the Hemodynamic Response During Walking in People With Multiple Sclerosis: An fNIRS Study. Arch. Phys. Med. Rehabil. 2019, 100, e115. [Google Scholar] [CrossRef]
- Kasser, S.; Belanger, B.; Purin, G.; Cannizzaro, M. Cognitive Motor Interference and Cortical Activation during Walking in Individuals with Multiple Sclerosis. Arch. Phys. Med. Rehabil. 2019, 100, e53. [Google Scholar] [CrossRef]
- Saleh, S.; Sandroff, B.M.; Vitiello, T.; Owoeye, O.; Hoxha, A.; Hake, P.; Goverover, Y.; Wylie, G.; Yue, G.; DeLuca, J. The Role of Premotor Areas in Dual Tasking in Healthy Controls and Persons With Multiple Sclerosis: An fNIRS Imaging Study. Front. Behav. Neurosci. 2018, 12, 296. [Google Scholar] [CrossRef] [PubMed] [Green Version]
- Shirzadi, S.; Einalou, Z.; Dadgostar, M. Investigation of Functional Connectivity During Working Memory Task and Hemispheric Lateralization in Left- and Right- Handers Measured by fNIRS. Optik 2020, 221, 165347. [Google Scholar] [CrossRef]
- De Sanctis, P.; Malcolm, B.R.; Mabie, P.C.; Francisco, A.A.; Mowrey, W.B.; Joshi, S.; Molholm, S.; Foxe, J.J. Mobile Brain/Body Imaging of cognitive-motor impairment in multiple sclerosis: Deriving EEG-based neuro-markers during a dual-task walking study. Clin. Neurophysiol. 2020, 131, 1119–1128. [Google Scholar] [CrossRef]
- Borragán, G.; Gilson, M.; Atas, A.; Slama, H.; Lysandropoulos, A.; De Schepper, M.; Peigneux, P. Cognitive Fatigue, Sleep and Cortical Activity in Multiple Sclerosis Disease. A Behavioral, Polysomnographic and Functional Near-Infrared Spectroscopy Investigation. Front. Hum. Neurosci. 2018, 12, 378. [Google Scholar] [CrossRef]
- Bertoli, M.; Tecchio, F. Fatigue in multiple sclerosis: Does the functional or structural damage prevail? Mult. Scler. J. 2020, 26, 1809–1815. [Google Scholar] [CrossRef]
- Buyukturkoglu, K.; Porcaro, C.; Cottone, C.; Cancelli, A.; Inglese, M.; Tecchio, F. Simple index of functional connectivity at rest in Multiple Sclerosis fatigue. Clin. Neurophysiol. 2017, 128, 807–813. [Google Scholar] [CrossRef]
- Meijer, K.A.; Eijlers, A.J.; Douw, L.; Uitdehaag, B.M.; Barkhof, F.; Geurts, J.J.; Schoonheim, M.M. Increased connectivity of hub networks and cognitive impairment in multiple sclerosis. Neurology 2017, 88, 2107–2114. [Google Scholar] [CrossRef] [Green Version]
- Shu, N.; Liu, Y.; Li, K.; Duan, Y.; Wang, J.; Yu, C.; Dong, H.; Ye, J.; He, Y. Diffusion tensor tractography reveals disrupted topological efficiency in white matter structural networks in multiple sclerosis. Cereb. Cortex 2011, 21, 2565–2577. [Google Scholar] [CrossRef] [Green Version]
- Tewarie, P.; Schoonheim, M.M.; Schouten, D.I.; Polman, C.H.; Balk, L.J.; Uitdehaag, B.M.; Geurts, J.J.; Hillebrand, A.; Barkhof, F.; Stam, C.J. Functional brain networks: Linking thalamic atrophy to clinical disability in multiple sclerosis, a multimodal fMRI and MEG Study. Hum. Brain Mapp. 2014, 36, 603–618. [Google Scholar] [CrossRef] [PubMed]
- Stickland, R.; Allen, M.; Magazzini, L.; Singh, K.D.; Wise, R.G.; Tomassini, V. Neurovascular coupling during visual stimulation in multiple sclerosis: A MEG-fMRI study. Neuroscience 2019, 403, 54–69. [Google Scholar] [CrossRef] [PubMed]
- Tewarie, P.; Schoonheim, M.M.; Stam, C.J.; Van Der Meer, M.L.; Van Dijk, B.W.; Barkhof, F.; Polman, C.H.; Hillebrand, A. Cognitive and Clinical Dysfunction, Altered MEG Resting-State Networks and Thalamic Atrophy in Multiple Sclerosis. PLoS ONE 2013, 8, e69318. [Google Scholar] [CrossRef] [PubMed]
- Schoonheim, M.M.; Geurts, J.J.; Landi, D.; Douw, L.; van der Meer, M.L.; Vrenken, H.; Polman, C.H.; Barkhof, F.; Stam, C.J. Functional connectivity changes in multiple sclerosis patients: A graph analytical study of MEG resting state data. Hum. Brain Mapp. 2011, 34, 52–61. [Google Scholar] [CrossRef] [PubMed]
- Velásquez, J.; Suarez, X.; Aristizabal, I.; Ascencio, J.; Ochoa, J. Functional connectivity changes caused by multiple sclerosis. In Proceedings of the 2013 Pan American Health Care Exchanges (PAHCE), Medellin, Colombia, 29 April 2013–4 May 2013; pp. 1–6. [Google Scholar] [CrossRef]
- Bullmore, E.; Sporns, O. Complex brain networks: Graph theoretical analysis of structural and functional systems. Nat. Rev. Neurosci. 2009, 10, 186–198. [Google Scholar] [CrossRef]
- Tona, F.; Petsas, N.; Sbardella, E.; Prosperini, L.; Carmellini, M.; Pozzilli, C.; Pantano, P. Multiple Sclerosis: Altered Thalamic Resting-State Functional Connectivity and Its Effect on Cognitive Function. Radiology 2014, 271, 814–821. [Google Scholar] [CrossRef] [PubMed]
- Schoonheim, M.M.; Pinter, D.; E Prouskas, S.; Broeders, T.A.; Pirpamer, L.; Khalil, M.; Ropele, S.; Uitdehaag, B.M.; Barkhof, F.; Enzinger, C.; et al. Disability in multiple sclerosis is related to thalamic connectivity and cortical network atrophy. Mult. Scler. J. 2021, 28, 61–70. [Google Scholar] [CrossRef]
- Hawellek, D.J.; Hipp, J.F.; Lewis, C.M.; Corbetta, M.; Engel, A.K. Increased functional connectivity indicates the severity of cognitive impairment in multiple sclerosis. Proc. Natl. Acad. Sci. USA 2011, 108, 19066–19071. [Google Scholar] [CrossRef] [Green Version]
- Finke, C.; Schlichting, J.; Papazoglou, S.; Scheel, M.; Freing, A.; Soemmer, C.; Pech, L.; Pajkert, A.; Pfüller, C.; Wuerfel, J.; et al. Altered basal ganglia functional connectivity in multiple sclerosis patients with fatigue. Mult. Scler. J. 2014, 21, 925–934. [Google Scholar] [CrossRef]
- Dogonowski, A.-M.; Siebner, H.R.; Sørensen, P.S.; Wu, X.; Biswal, B.; Paulson, O.B.; Dyrby, T.B.; Skimminge, A.; Blinkenberg, M.; Madsen, K.H. Expanded functional coupling of subcortical nuclei with the motor resting-state network in multiple sclerosis. Mult. Scler. J. 2013, 19, 559–566. [Google Scholar] [CrossRef]
- Zhong, J.; Nantes, J.C.; Holmes, S.A.; Gallant, S.; Narayanan, S.; Koski, L. Abnormal functional connectivity and cortical integrity influence dominant hand motor disability in multiple sclerosis: A multimodal analysis. Hum. Brain Mapp. 2016, 37, 4262–4275. [Google Scholar] [CrossRef] [PubMed]
- Wu, L.; Zhang, Y.; Zhou, F.-Q.; Gao, L.; He, L.; Gong, H.; Zeng, X. Altered intra- and interregional synchronization in relapsing–remitting multiple sclerosis: A resting-state fMRI study. Neuropsychiatr. Dis. Treat. 2016, 12, 853–862. [Google Scholar] [CrossRef] [PubMed] [Green Version]
- Wu, G.F.; Brier, M.R.; Parks, C.A.-L.; Ances, B.M.; Van Stavern, G.P. An Eye on Brain Integrity: Acute Optic Neuritis Affects Resting State Functional Connectivity. Investig. Ophthalmol. Vis. Sci. 2015, 56, 2541–2546. [Google Scholar] [CrossRef] [PubMed] [Green Version]
- D’Ambrosio, A.; Valsasina, P.; Gallo, A.; De Stefano, N.; Pareto, D.; Barkhof, F.; Ciccarelli, O.; Enzinger, C.; Tedeschi, G.; Stromillo, M.L.; et al. Reduced dynamics of functional connectivity and cognitive impairment in multiple sclerosis. Mult. Scler. J. 2019, 26, 476–488. [Google Scholar] [CrossRef] [PubMed]
- Chen, M.H.; DeLuca, J.; Genova, H.M.; Yao, B.; Wylie, G.R. Cognitive Fatigue Is Associated with Altered Functional Connectivity in Interoceptive and Reward Pathways in Multiple Sclerosis. Diagnostics 2020, 10, 930. [Google Scholar] [CrossRef] [PubMed]
- Liu, Y.; Liang, P.; Duan, Y.; Huang, J.; Ren, Z.; Jia, X.; Dong, H.; Ye, J.; Shi, F.-D.; Butzkueven, H.; et al. Altered thalamic functional connectivity in multiple sclerosis. Eur. J. Radiol. 2015, 84, 703–708. [Google Scholar] [CrossRef]
- Leavitt, V.M.; Wylie, G.R.; Girgis, P.A.; DeLuca, J.; Chiaravalloti, N.D. Increased functional connectivity within memory networks following memory rehabilitation in multiple sclerosis. Brain Imaging Behav. 2012, 8, 394–402. [Google Scholar] [CrossRef]
- Wojtowicz, M.; Mazerolle, E.L.; Bhan, V.; Fisk, J.D. Altered functional connectivity and performance variability in relapsing–remitting multiple sclerosis. Mult. Scler. J. 2014, 20, 1453–1463. [Google Scholar] [CrossRef]
- Golde, S.; Heine, J.; Pottgen, J.; Mantwill, M.; Lau, S.; Wingenfeld, K.; Otte, C.; Penner, I.K.; Engel, A.K.; Heesen, C.; et al. Distinct Functional Connectivity Signatures of Impaired Social Cognition in Multiple Sclerosis. Front. Neurol. 2020, 11, 507. [Google Scholar] [CrossRef]
- Pasqua, G.; Tommasin, S.; Bharti, K.; Ruggieri, S.; Petsas, N.; Piervincenzi, C.; Pozzilli, C.; Pantano, P. Resting-state functional connectivity of anterior and posterior cerebellar lobes is altered in multiple sclerosis. Mult. Scler. J. 2021, 27, 539–548. [Google Scholar] [CrossRef]
- Lin, F.; Zivadinov, R.; Hagemeier, J.; Weinstock-Guttman, B.; Vaughn, C.; Gandhi, S.; Jakimovski, D.; Hulst, H.; Benedict, R.H.; Bergsland, N.; et al. Altered nuclei-specific thalamic functional connectivity patterns in multiple sclerosis and their associations with fatigue and cognition. Mult. Scler. J. 2018, 25, 1243–1254. [Google Scholar] [CrossRef] [PubMed]
- Cui, F.; Zhou, L.; Wang, Z.; Lang, C.; Park, J.; Tan, Z.; Yu, Y.; Sun, C.; Gao, Y.; Kong, J. Altered Functional Connectivity of Striatal Subregions in Patients with Multiple Sclerosis. Front. Neurol. 2017, 8, 129. [Google Scholar] [CrossRef] [Green Version]
- Bonavita, S.; Sacco, R.; Della Corte, M.; Esposito, S.; Sparaco, M.; D’Ambrosio, A.; Docimo, R.; Bisecco, A.; Lavorgna, L.; Corbo, D.; et al. Computer-aided cognitive rehabilitation improves cognitive performances and induces brain functional connectivity changes in relapsing remitting multiple sclerosis patients: An exploratory study. J. Neurol. 2014, 262, 91–100. [Google Scholar] [CrossRef] [PubMed]
- Colasanti, A.; Guo, Q.; Giannetti, P.; Wall, M.B.; Newbould, R.D.; Bishop, C.; Onega, M.; Nicholas, R.; Ciccarelli, O.; Muraro, P.A. Hippocampal neuroinflammation, functional connectivity, and depressive symptoms in multiple sclerosis. Biol. Psychiatry 2016, 80, 62–72. [Google Scholar] [CrossRef] [Green Version]
- Roosendaal, S.D.; Hulst, H.; Vrenken, H.; Feenstra, H.E.M.; Castelijns, J.A.; Pouwels, P.J.W.; Barkhof, F.; Geurts, J.J.G. Structural and Functional Hippocampal Changes in Multiple Sclerosis Patients with Intact Memory Function. Radiology 2010, 255, 595–604. [Google Scholar] [CrossRef] [PubMed]
- Hulst, H.E.; Schoonheim, M.M.; Van Geest, Q.; Uitdehaag, B.M.; Barkhof, F.; Geurts, J.J. Memory impairment in multiple sclerosis: Relevance of hippocampal activation and hippocampal connectivity. Mult. Scler. J. 2015, 21, 1705–1712. [Google Scholar] [CrossRef]
- Farahani, F.V.; Karwowski, W.; Lighthall, N.R. Application of Graph Theory for Identifying Connectivity Patterns in Human Brain Networks: A Systematic Review. Front. Neurosci. 2019, 13, 585. [Google Scholar] [CrossRef] [PubMed]
- Schoonheim, M.M.; E Hulst, H.; Landi, D.; Ciccarelli, O.; Roosendaal, S.D.; Sanz-Arigita, E.J.; Vrenken, H.; Polman, C.H.; Stam, C.J.; Barkhof, F.; et al. Gender-related differences in functional connectivity in multiple sclerosis. Mult. Scler. J. 2011, 18, 164–173. [Google Scholar] [CrossRef]
- Rocca, M.A.; Absinta, M.; Amato, M.P.; Moiola, L.; Ghezzi, A.; Veggiotti, P.; Capra, R.; Portaccio, E.; Fiorino, A.; Pippolo, L.; et al. Posterior brain damage and cognitive impairment in pediatric multiple sclerosis. Neurology 2014, 82, 1314–1321. [Google Scholar] [CrossRef] [Green Version]
- Shu, N.; Duan, Y.; Xia, M.; Schoonheim, M.M.; Huang, J.; Ren, Z.; Sun, Z.; Ye, J.; Dong, H.; Shi, F.-D.; et al. Disrupted topological organization of structural and functional brain connectomes in clinically isolated syndrome and multiple sclerosis. Sci. Rep. 2016, 6, 29383. [Google Scholar] [CrossRef] [Green Version]
- Dobryakova, E.; Rocca, M.A.; Valsasina, P.; Ghezzi, A.; Colombo, B.; Martinelli, V.; Comi, G.; DeLuca, J.; Filippi, M. Abnormalities of the executive control network in multiple sclerosis phenotypes: An fMRI effective connectivity study. Hum. Brain Mapp. 2016, 37, 2293–2304. [Google Scholar] [CrossRef] [PubMed]
- Duong, M.A.; Boulanouar, K.; Audoin, B.; Treseras, S.; Ibarrola, D.; Malikova, I.; Confort-Gouny, S.; Celsis, P.; Pelletier, J.; Cozzone, P.; et al. Modulation of effective connectivity inside the working memory network in patients at the earliest stage of multiple sclerosis. Neuroimage 2005, 24, 533–538. [Google Scholar] [CrossRef] [PubMed]
- Leavitt, V.M.; Wylie, G.; Genova, H.M.; Chiaravalloti, N.D.; DeLuca, J. Altered effective connectivity during performance of an information processing speed task in multiple sclerosis. Mult. Scler. J. 2011, 18, 409–417. [Google Scholar] [CrossRef] [PubMed]
- Mansoory, M.S.; Chehreh, A.; Khoshgard, K.; Rashidi, I.; Ebrahiminia, A. Effective Connectivity within the Papez Circuit in the Multiple Sclerosis Patients: A Comparative Study Using Resting-State fMRI. J. Biomed. Phys. Eng. 2022, 12, 149–160. [Google Scholar] [CrossRef]
- Stamile, C.; Kocevar, G.; Hannoun, S.; Durand-Dubief, F.; Sappey-Marinier, D. A Graph Based Classification Method for Multiple Sclerosis Clinical Forms Using Support Vector Machine. In Machine Learning Meets Medical Imaging: First International Workshop, MLMMI 2015, Held in Conjunction with ICML 2015, Lille, France, July 11, 2015, Revised Selected Papers 1; Springer International Publishing: Cham, Switzerland, 2015; pp. 57–64. [Google Scholar] [CrossRef]
- Ashtiani, S.N.M.; Daliri, M.R.; Behnam, H.; Hossein-Zadeh, G.-A.; Mehrpour, M.; Motamed, M.R.; Fadaie, F. Altered topological properties of brain networks in the early MS patients revealed by cognitive task-related fMRI and graph theory. Biomed. Signal Process. Control. 2018, 40, 385–395. [Google Scholar] [CrossRef]
- Humphries, M.D.; Gurney, K. Network ‘Small-World-Ness’: A Quantitative Method for Determining Canonical Network Equivalence. PLoS ONE 2008, 3, e0002051. [Google Scholar] [CrossRef]
- Achard, S.; Bullmore, E. Efficiency and Cost of Economical Brain Functional Networks. PLoS Comput. Biol. 2007, 3, e17. [Google Scholar] [CrossRef]
- Moazami, F.; Lefevre-Utile, A.; Papaloukas, C.; Soumelis, V. Machine Learning Approaches in Study of Multiple Sclerosis Disease Through Magnetic Resonance Images. Front. Immunol. 2021, 12. [Google Scholar] [CrossRef]
- Karmonik, C.; Boone, T.; Khavari, R. Data-driven machine-learning quantifies differences in the voiding initiation network in neurogenic voiding dysfunction in women with multiple sclerosis. Int. Neurourol. J. 2019, 23, 195. [Google Scholar] [CrossRef] [Green Version]
- Zurita, M.; Montalba, C.; Labbé, T.; Cruz, J.P.; da Rocha, J.D.; Tejos, C.; Ciampi, E.; Cárcamo, C.; Sitaram, R.; Uribe, S. Characterization of relapsing-remitting multiple sclerosis patients using support vector machine classifications of functional and diffusion MRI data. NeuroImage Clin. 2018, 20, 724–730. [Google Scholar] [CrossRef]
- Al Zoubi, O.; Misaki, M.; Tsuchiyagaito, A.; Zotev, V.; White, E.; Paulus, M.; Bodurka, J. Machine Learning Evidence for Sex Differences Consistently Influences Resting-State Functional Magnetic Resonance Imaging Fluctuations Across Multiple Independently Acquired Data Sets. Brain Connect. 2022, 12, 348–361. [Google Scholar] [CrossRef] [PubMed]
- Aslani, S.; Dayan, M.; Murino, V.; Sona, D. Deep 2D encoder-decoder convolutional neural network for multiple sclerosis lesion segmentation in brain MRI. In Brainlesion: Glioma, Multiple Sclerosis, Stroke and Traumatic Brain Injuries: 4th International Workshop, BrainLes 2018, Held in Conjunction with MICCAI 2018, Granada, Spain, September 16, 2018, Revised Selected Papers, Part I 4; Springer International Publishing: Cham, Switzerland, 2019; pp. 132–141. [Google Scholar] [CrossRef]
- Yoo, Y.; Tang, L.W.; Brosch, T.; Li, D.K.B.; Metz, L.; Traboulsee, A.; Tam, R. Deep Learning of Brain Lesion Patterns for Predicting Future Disease Activity in Patients with Early Symptoms of Multiple Sclerosis. In Deep Learning and Data Labeling for Medical Applications: First International Workshop, LABELS 2016, and Second International Workshop, DLMIA 2016, Held in Conjunction with MICCAI 2016, Athens, Greece, October 21, 2016, Proceedings 1; Springer International Publishing: Cham, Switzerland, 2016; pp. 86–94. [Google Scholar] [CrossRef]
- Yoo, Y.; Brosch, T.; Traboulsee, A.; Li, D.K.; Tam, R. Deep learning of image features from unlabeled data for multiple sclerosis lesion segmentation. In Proceedings of the International Workshop on Machine Learning in Medical Imaging, Munich, Germany, 5 October 2015; pp. 117–124. [Google Scholar]
- Ye, Z.; George, A.; Wu, A.T.; Niu, X.; Lin, J.; Adusumilli, G.; Naismith, R.T.; Cross, A.H.; Sun, P.; Song, S. Deep learning with diffusion basis spectrum imaging for classification of multiple sclerosis lesions. Ann. Clin. Transl. Neurol. 2020, 7, 695–706. [Google Scholar] [CrossRef] [Green Version]
- Bergamaschi, R.; Berzuini, C.; Romani, A.; Cosi, V. Predicting secondary progression in relapsing–remitting multiple sclerosis: A Bayesian analysis. J. Neurol. Sci. 2001, 189, 13–21. [Google Scholar] [CrossRef]
- Abidin, A.Z.; Chockanathan, U.; Dsouza, A.M.; Inglese, M.; Wismüller, A. Using large-scale Granger causality to study changes in brain network properties in the Clinically Isolated Syndrome (CIS) stage of multiple sclerosis. In Proceedings of the SPIE Medical Imaging, Orlando, FL, USA, 11–16 February 2017; Volume 10137, p. 101371B. [Google Scholar] [CrossRef] [Green Version]
- Kocevar, G.; Stamile, C.; Hannoun, S.; Cotton, F.; Vukusic, S.; Durand-Dubief, F.; Sappey-Marinier, D. Graph Theory-Based Brain Connectivity for Automatic Classification of Multiple Sclerosis Clinical Courses. Front. Neurosci. 2016, 10, 478. [Google Scholar] [CrossRef] [PubMed]
- Cortes, C.; Vapnik, V. Support-vector networks. Mach. Learn. 1995, 20, 273–297. [Google Scholar] [CrossRef]
- Eijlers, A.J.C.; Wink, A.M.; Meijer, K.A.; Douw, L.; Geurts, J.J.G.; Schoonheim, M.M. Reduced Network Dynamics on Functional MRI Signals Cognitive Impairment in Multiple Sclerosis. Radiology 2019, 292, 449–457. [Google Scholar] [CrossRef]
- Rocca, M.; Valsasina, P.; Absinta, M.; Riccitelli, G.; Rodegher, M.; Misci, P.; Rossi, P.; Falini, A.; Comi, G.; Filippi, M. Default-mode network dysfunction and cognitive impairment in progressive MS. Neurology 2010, 74, 1252–1259. [Google Scholar] [CrossRef]
- Schoonheim, M.M.; Meijer, K.A.; Geurts, J.J.G. Network Collapse and Cognitive Impairment in Multiple Sclerosis. Front. Neurol. 2015, 6, 82. [Google Scholar] [CrossRef] [Green Version]
- Yan, C.; Zang, Y. DPARSF: A MATLAB toolbox for “pipeline” data analysis of resting-state fMRI. Front. Syst. Neurosci. 2010, 4, 13. [Google Scholar] [CrossRef] [Green Version]
- Droby, A.; Yuen, K.S.L.; Muthuraman, M.; Reitz, S.-C.; Fleischer, V.; Klein, J.; Gracien, R.-M.; Ziemann, U.; Deichmann, R.; Zipp, F.; et al. Changes in brain functional connectivity patterns are driven by an individual lesion in MS: A resting-state fMRI study. Brain Imaging Behav. 2015, 10, 1117–1126. [Google Scholar] [CrossRef]
- Bottino, F.; Lucignani, M.; Pasquini, L.; Mastrogiovanni, M.; Gazzellini, S.; Ritrovato, M.; Longo, D.; Figà-Talamanca, L.; Rossi Espagnet, M.C.; Napolitano, A. Spatial stability of functional networks: A measure to assess the robustness of graph-theoretical metrics to spatial errors related to brain parcellation. Front. Neurosci. 2022, 15, 1909. [Google Scholar] [CrossRef] [PubMed]
- Poldrack, R.A. Can cognitive processes be inferred from neuroimaging data? Trends Cogn. Sci. 2006, 10, 59–63. [Google Scholar] [CrossRef] [PubMed] [Green Version]
- Faskowitz, J.; Betzel, R.F.; Sporns, O. Edges in brain networks: Contributions to models of structure and function. Netw. Neurosci. 2021, 6, 1–28. [Google Scholar] [CrossRef] [PubMed]
- Imms, P.; Clemente, A.; Cook, M.; D’Souza, W.; Wilson, P.H.; Jones, D.K.; Caeyenberghs, K. The structural connectome in traumatic brain injury: A meta-analysis of graph metrics. Neurosci. Biobehav. Rev. 2019, 99, 128–137. [Google Scholar] [CrossRef] [Green Version]
- Kambeitz, J.; Kambeitz-Ilankovic, L.; Cabral, C.; Dwyer, D.B.; Calhoun, V.D.; Heuvel, M.P.V.D.; Falkai, P.; Koutsouleris, N.; Malchow, B. Aberrant Functional Whole-Brain Network Architecture in Patients With Schizophrenia: A Meta-analysis. Schizophr. Bull. 2016, 42, S13–S21. [Google Scholar] [CrossRef] [Green Version]
- Rakhimberdina, Z.; Liu, X.; Murata, T. Population Graph-Based Multi-Model Ensemble Method for Diagnosing Autism Spectrum Disorder. Sensors 2020, 20, 6001. [Google Scholar] [CrossRef]
- SScarselli, F.; Gori, M.; Tsoi, A.C.; Hagenbuchner, M.; Monfardini, G. The graph neural network model. IEEE Trans. Neural Netw. 2008, 20, 61–80. [Google Scholar] [CrossRef]
- Kipf, T.N.; Welling, M. Semi-supervised classification with graph convolutional networks. arXiv 2016, arXiv:1609.02907. [Google Scholar]
- Marzullo, A.; Kocevar, G.; Stamile, C.; Durand-Dubief, F.; Terracina, G.; Calimeri, F.; Sappey-Marinier, D. Classification of multiple sclerosis clinical profiles via graph convolutional neural networks. Front. Neurosci. 2019, 13, 594. [Google Scholar] [CrossRef] [Green Version]
- Barile, B.; Marzullo, A.; Stamile, C.; Durand-Dubief, F.; Sappey-Marinier, D. Data augmentation using generative adversarial neural networks on brain structural connectivity in multiple sclerosis. Comput. Methods Programs Biomed. 2021, 206, 106113. [Google Scholar] [CrossRef]


| Authors, Year | Number of Participants | Graph Theory Parameters | EDSS | Imaging/Cognitive Tests | Findings |
|---|---|---|---|---|---|
| [28] | 330 (RRMS) | - Small-worldness - Global efficiency - Local efficiency | - | RS-fMRI | Decrease in regional efficiency for the insula, precentral gyrus, and prefrontal and temporal association cortices |
| [29] | 16 (MS) 20 (HC) | - Modularity | Less than 2.5 | PASAT | Increase in network modularity values for patients with MS |
| [30] | 60 (MS) 59 (HC) | - Small-worldness - Centrality | - | RS-fMRI | Fatigue in patients with MS causing decreased in degrees in the bilateral thalamus; decreased degree in the bilateral caudate nucleus in non-fatigued patients |
| [31] | 128 (MS) 50 (HC) | - Eigenvector centrality | Median 2.0 | RS-fMRI | Increase in eigenvector centrality in the bilateral thalamus and posterior cingulate areas; decrease in eigenvector centrality in sensorimotor and ventral stream areas in patients with MS |
| [32] | 246 (MS) 55 (HC) | - Global efficiency - Small-worldness | Less than 3.0 | PASAT | Decrease in the nodal degree in the bilateral caudate nucleus and right cerebellum in patients with MS |
| [33] | 38 (MS) 42 (HC) | - Nodal efficiency - Local efficiency - Connectivity index | 0–7.0 | RS-fMRI | Decrease in brain functional connectivity enhancement after advanced disease and during disease progression |
| [34] | 18 (RRMS) 25 (HC) | - Clustering coefficient - Modularity | - | RS-fMRI | Increase in modularity in the brain network in patients with MS; increase in clustering coefficient and local efficiency |
| [35] | 25 (MS) 35 (HC) | - Modularity | - | RS-fMRI | Increase in modularity in patients with MS |
| [36] | 332 (MS) 96 (HC) | - Degree centrality | Median 3.0 | RS-fMRI | Centrality increase in the default-node network in patients with MS |
| [37] | 37 (PPMS) 21 (HC) | - Global efficiency - Local efficiency - Betweenness centrality - Characteristic path length | Less than 7.00 | T25FW NHPT SDMT | With the definition of the rich club, rich club connectivity decreases among patients with MS |
| [38] | 34 (MS) 34 (CIS) 36 (HC) | - Local efficiency - Global efficiency | 0–6.5 | PASAT | Decrease in brain network efficiency |
| [39] | 46 (RRMS) | - Global efficiency - Assortativity - Characteristic path length - Modularity - Rich club coefficient - Transitivity | Median 2 | RS-fMRI | Weaker connectivity strength, decrease in network density, reduction of global changes |
| [40] | 41 (CIS) 32 (MS) 35 (HC) | - Modularity - Intra-module efficiency - Inter-module efficiency | 0–6.5 | PASAT2,3 | No differences between CIS and HC; decrease in inter-module efficiency between sensory-motor network and frontoparietal network and between visual network and frontoparietal in MS |
| [41] | 29 (MS) 24 (HC) | - Global efficiency - Local efficiency - Betweenness centrality - Characteristic path length - Clustering coefficient | 3.2 ± 1.3 | SDMT | Changes in serotonergic, noradrenergic, and cholinergic network functional connectivity in MS |
| [42] | 37 (MS) 23 (HC) | - Clustering coefficient - Characteristic path length - Global efficiency | - | PASAT ANT SDMT MFIS NFI-MS BDI-II PSQI | Increase in modularity, increase in clustering and decrease in global efficiency in functional networks, and longer average path length |
| [43] | 33 (RRMS) 29 (HC) | - Global efficiency - Characteristic path length - Clustering coefficient - Nodal strength | Median 2 0–4 | SDMT PASAT TAP | Increase in functional connectivity due to maladaptive process |
| [44] | 119 (MS) 42 (HC) | - Global efficiency - Degree centrality | 2 (0–7.5) | PASAT | Alteration in the brain network in patients with MS according to disease duration |
| [45] | 41 PWCIS 19 (HC) | Median EDSS=1 Start: 0–3 After 1 year: 0–5 | RS-fMRI | No global efficiency difference between CIS and HC | |
| [46] | 25 (RRMS) 18 (HC) | - Global efficiency | Mean 4.3 | CVLT-II, PASAT, SDMT, JLOT, COWAT | Decreased global efficiency in patients with MS with cognitive impairment |
| [47] | 50 (MS) 26 (HC) | - Number of edges - Characteristic path length - Local efficiency - Global efficiency - Transitivity - Small-worldness | Less than 6.0 | SDMT CVLT-II BVMT-R COWAT | No significant link between brain network alterations and cognition |
| [48] | 32 (MS) 10 (HC) | - Centrality (degree and betweenness centrality) - Clustering coefficient - Characteristic path length | 0–3.0 | RS-fMRI | Significant increase in structural-functional coupling among patients with MS after 5 years |
| [49] | 8 (MS) 12 (HC) | - Centrality - Modularity - Transitivity - Small-worldness | 0–3.5 | PASAT | Best sensitivity in MS analysis acquired from two global values of modularity and small-worldness index |
| [50] | 32 (MS) 10 (HC) | - Strength - Centrality - Clustering coefficient | First episode suggestive of MS | SRT BVMT-R | Decrease in verbal memory function associated with hippocampal volume loss |
| [51] | 10 (RRMS) | - Local efficiency - Global efficiency | - | RS-fMRI | Mixed observations in graph properties for walking exercise |
| [52] | 48 (PPMS) | - Density - Strength - Local efficiency - Modularity | - | RS-fMRI | No significant difference for MS patients with and without optic neuritis in functional graph metrics. |
Disclaimer/Publisher’s Note: The statements, opinions and data contained in all publications are solely those of the individual author(s) and contributor(s) and not of MDPI and/or the editor(s). MDPI and/or the editor(s) disclaim responsibility for any injury to people or property resulting from any ideas, methods, instructions or products referred to in the content. |
© 2023 by the authors. Licensee MDPI, Basel, Switzerland. This article is an open access article distributed under the terms and conditions of the Creative Commons Attribution (CC BY) license (https://creativecommons.org/licenses/by/4.0/).
Share and Cite
Hejazi, S.; Karwowski, W.; Farahani, F.V.; Marek, T.; Hancock, P.A. Graph-Based Analysis of Brain Connectivity in Multiple Sclerosis Using Functional MRI: A Systematic Review. Brain Sci. 2023, 13, 246. https://doi.org/10.3390/brainsci13020246
Hejazi S, Karwowski W, Farahani FV, Marek T, Hancock PA. Graph-Based Analysis of Brain Connectivity in Multiple Sclerosis Using Functional MRI: A Systematic Review. Brain Sciences. 2023; 13(2):246. https://doi.org/10.3390/brainsci13020246
Chicago/Turabian StyleHejazi, Sara, Waldemar Karwowski, Farzad V. Farahani, Tadeusz Marek, and P. A. Hancock. 2023. "Graph-Based Analysis of Brain Connectivity in Multiple Sclerosis Using Functional MRI: A Systematic Review" Brain Sciences 13, no. 2: 246. https://doi.org/10.3390/brainsci13020246