
Characteristics of Electroencephalogram in the Prefrontal Cortex during Deep Brain Stimulation of Subthalamic Nucleus in Parkinson’s Disease under Propofol General Anesthesia
 , , and
Abstract
:1. Introduction
2. Materials and Methods
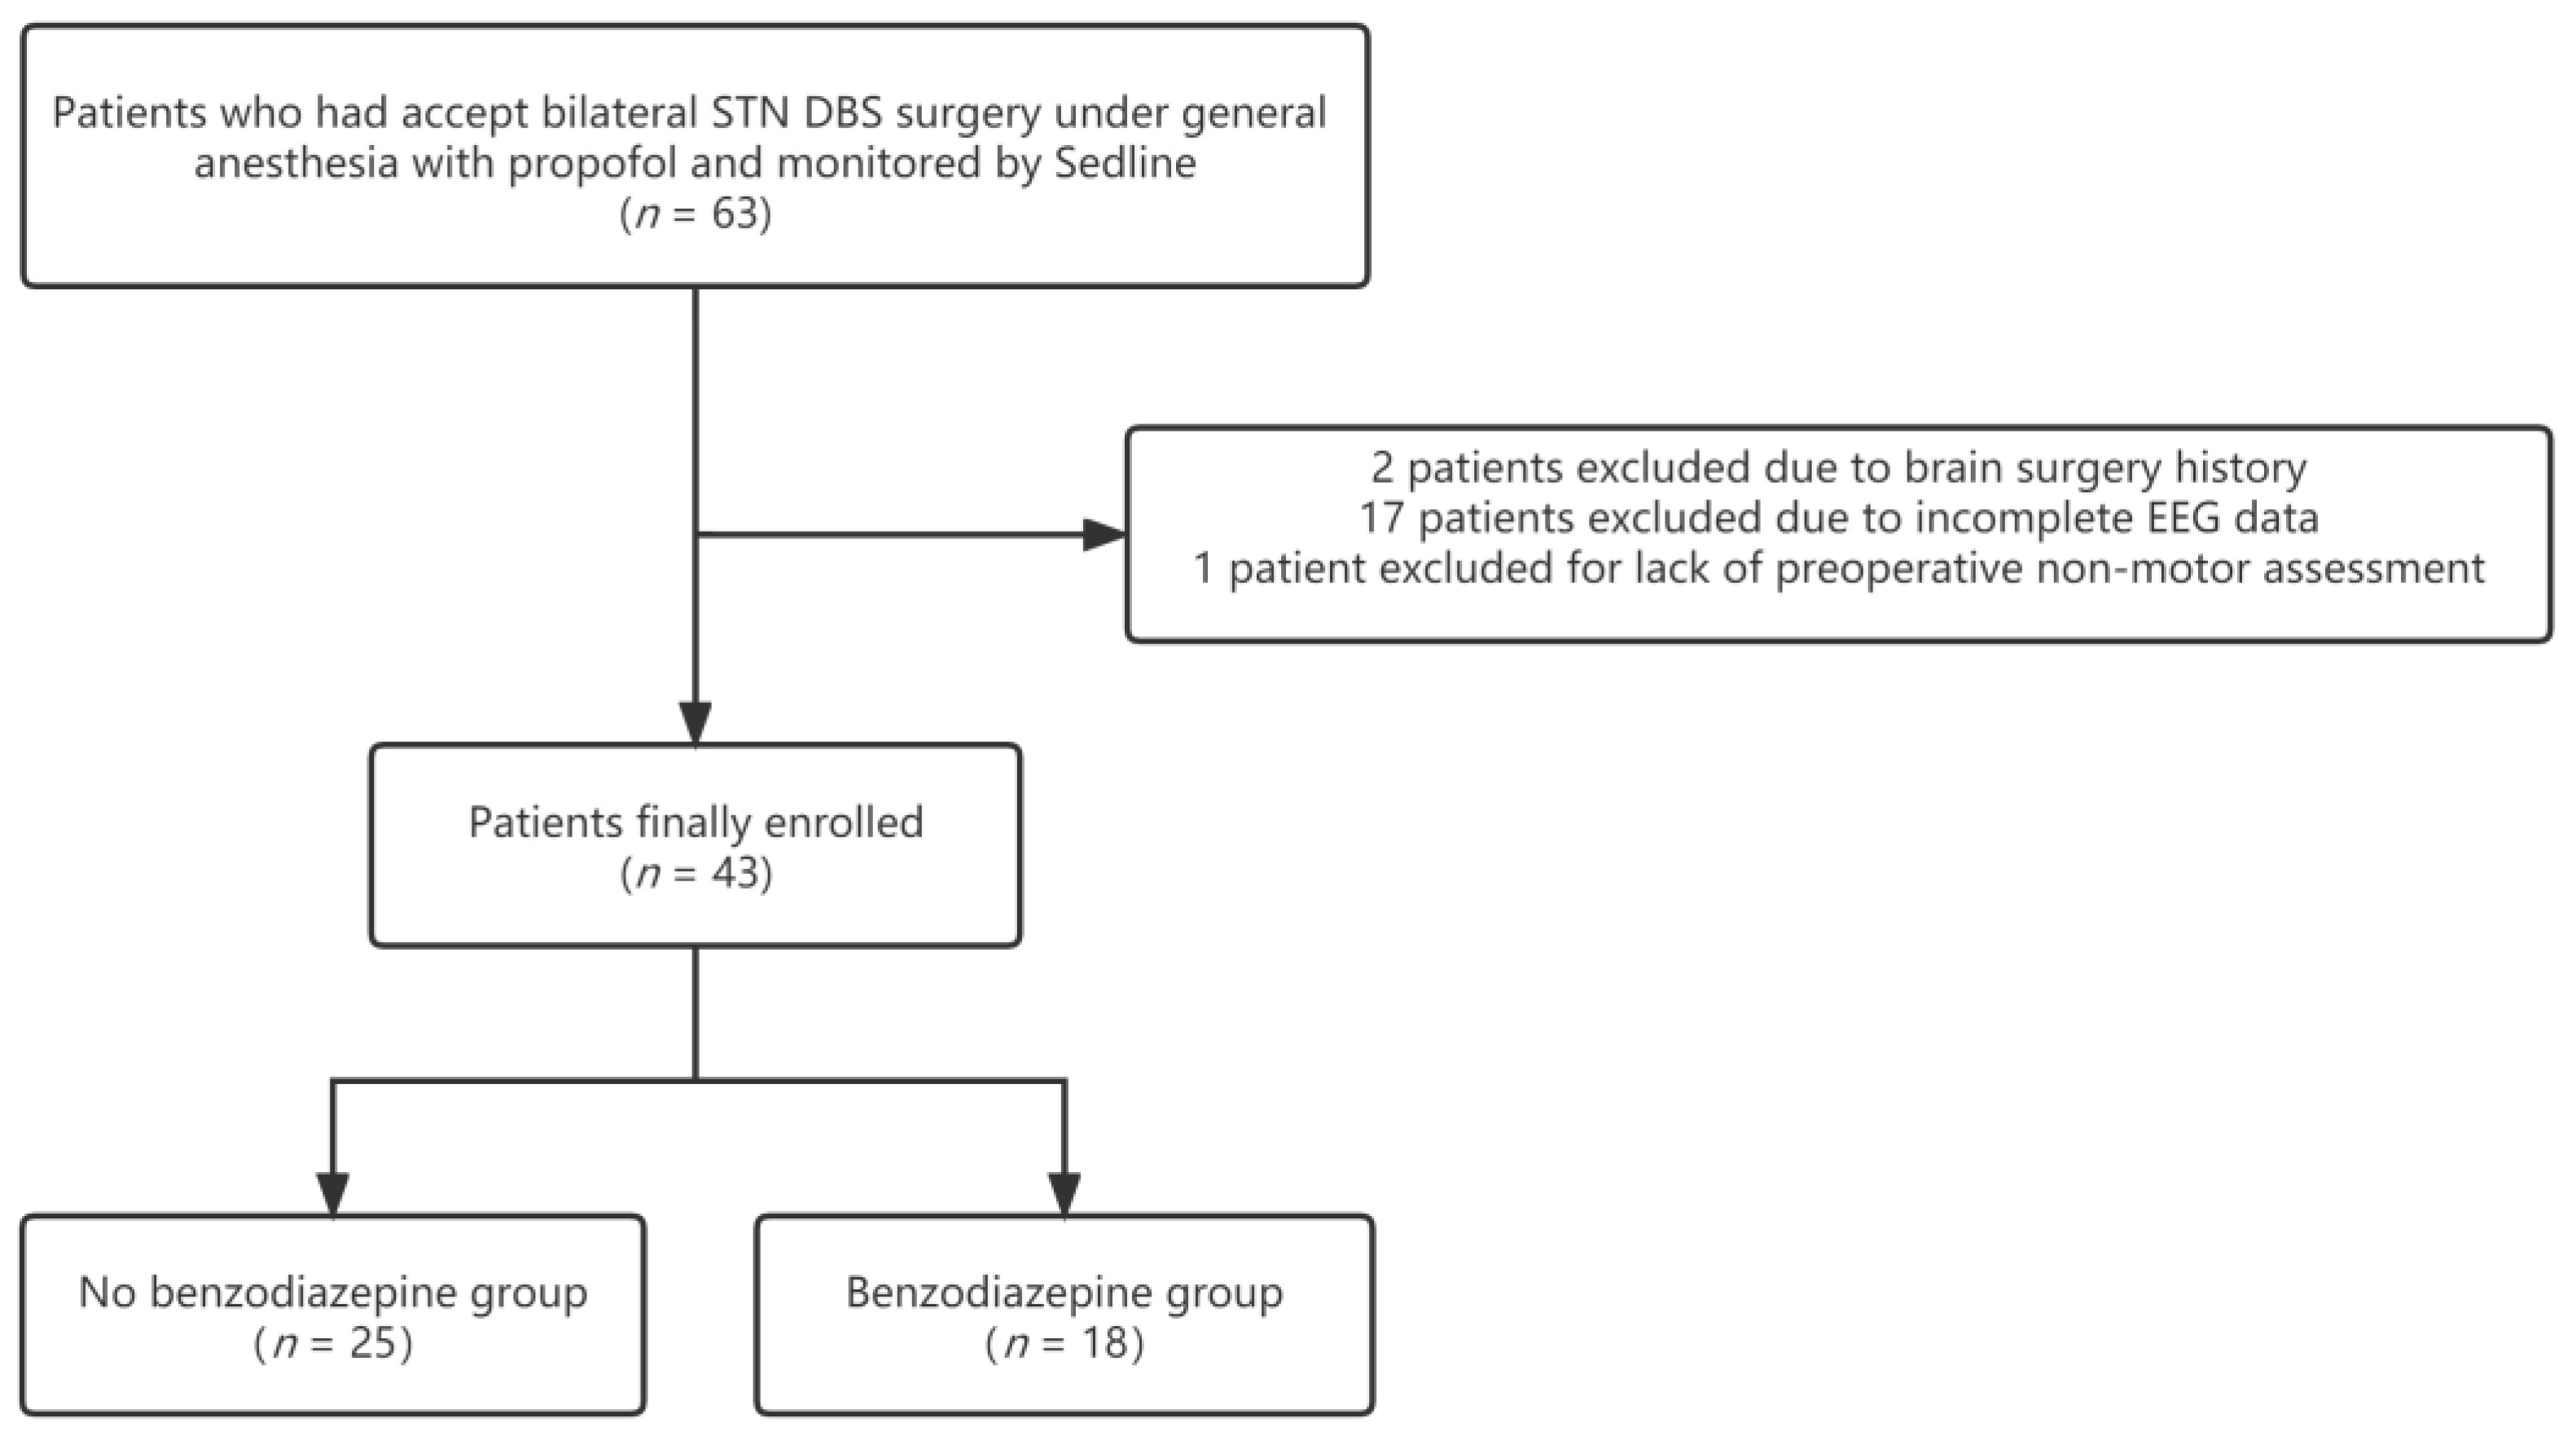
2.1. Patient Population
2.2. Surgical Procedures
2.3. Anesthetic Procedures
2.4. Data Collection
2.5. EEG Data Acquisition and Processing
2.6. Statistical Analyses
3. Results
3.1. Baseline Characteristics
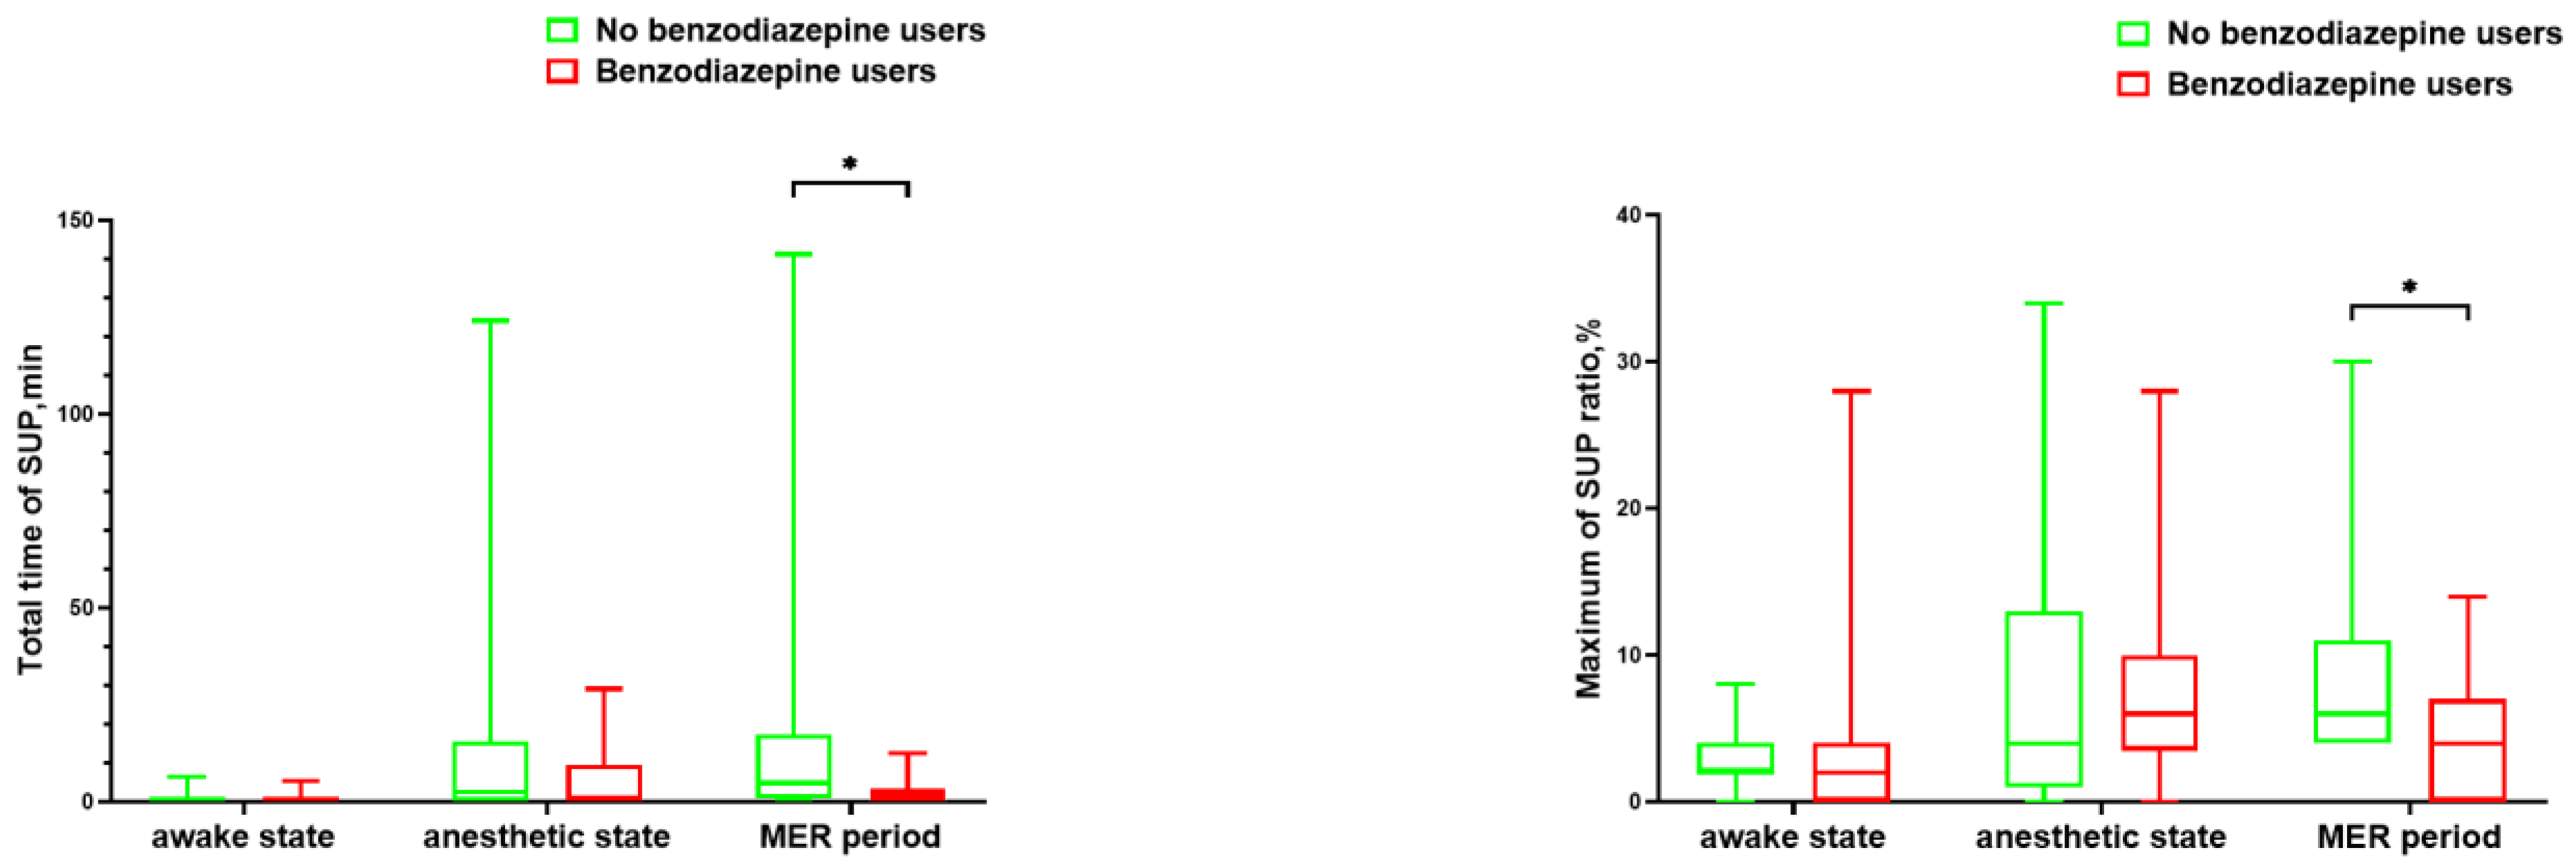
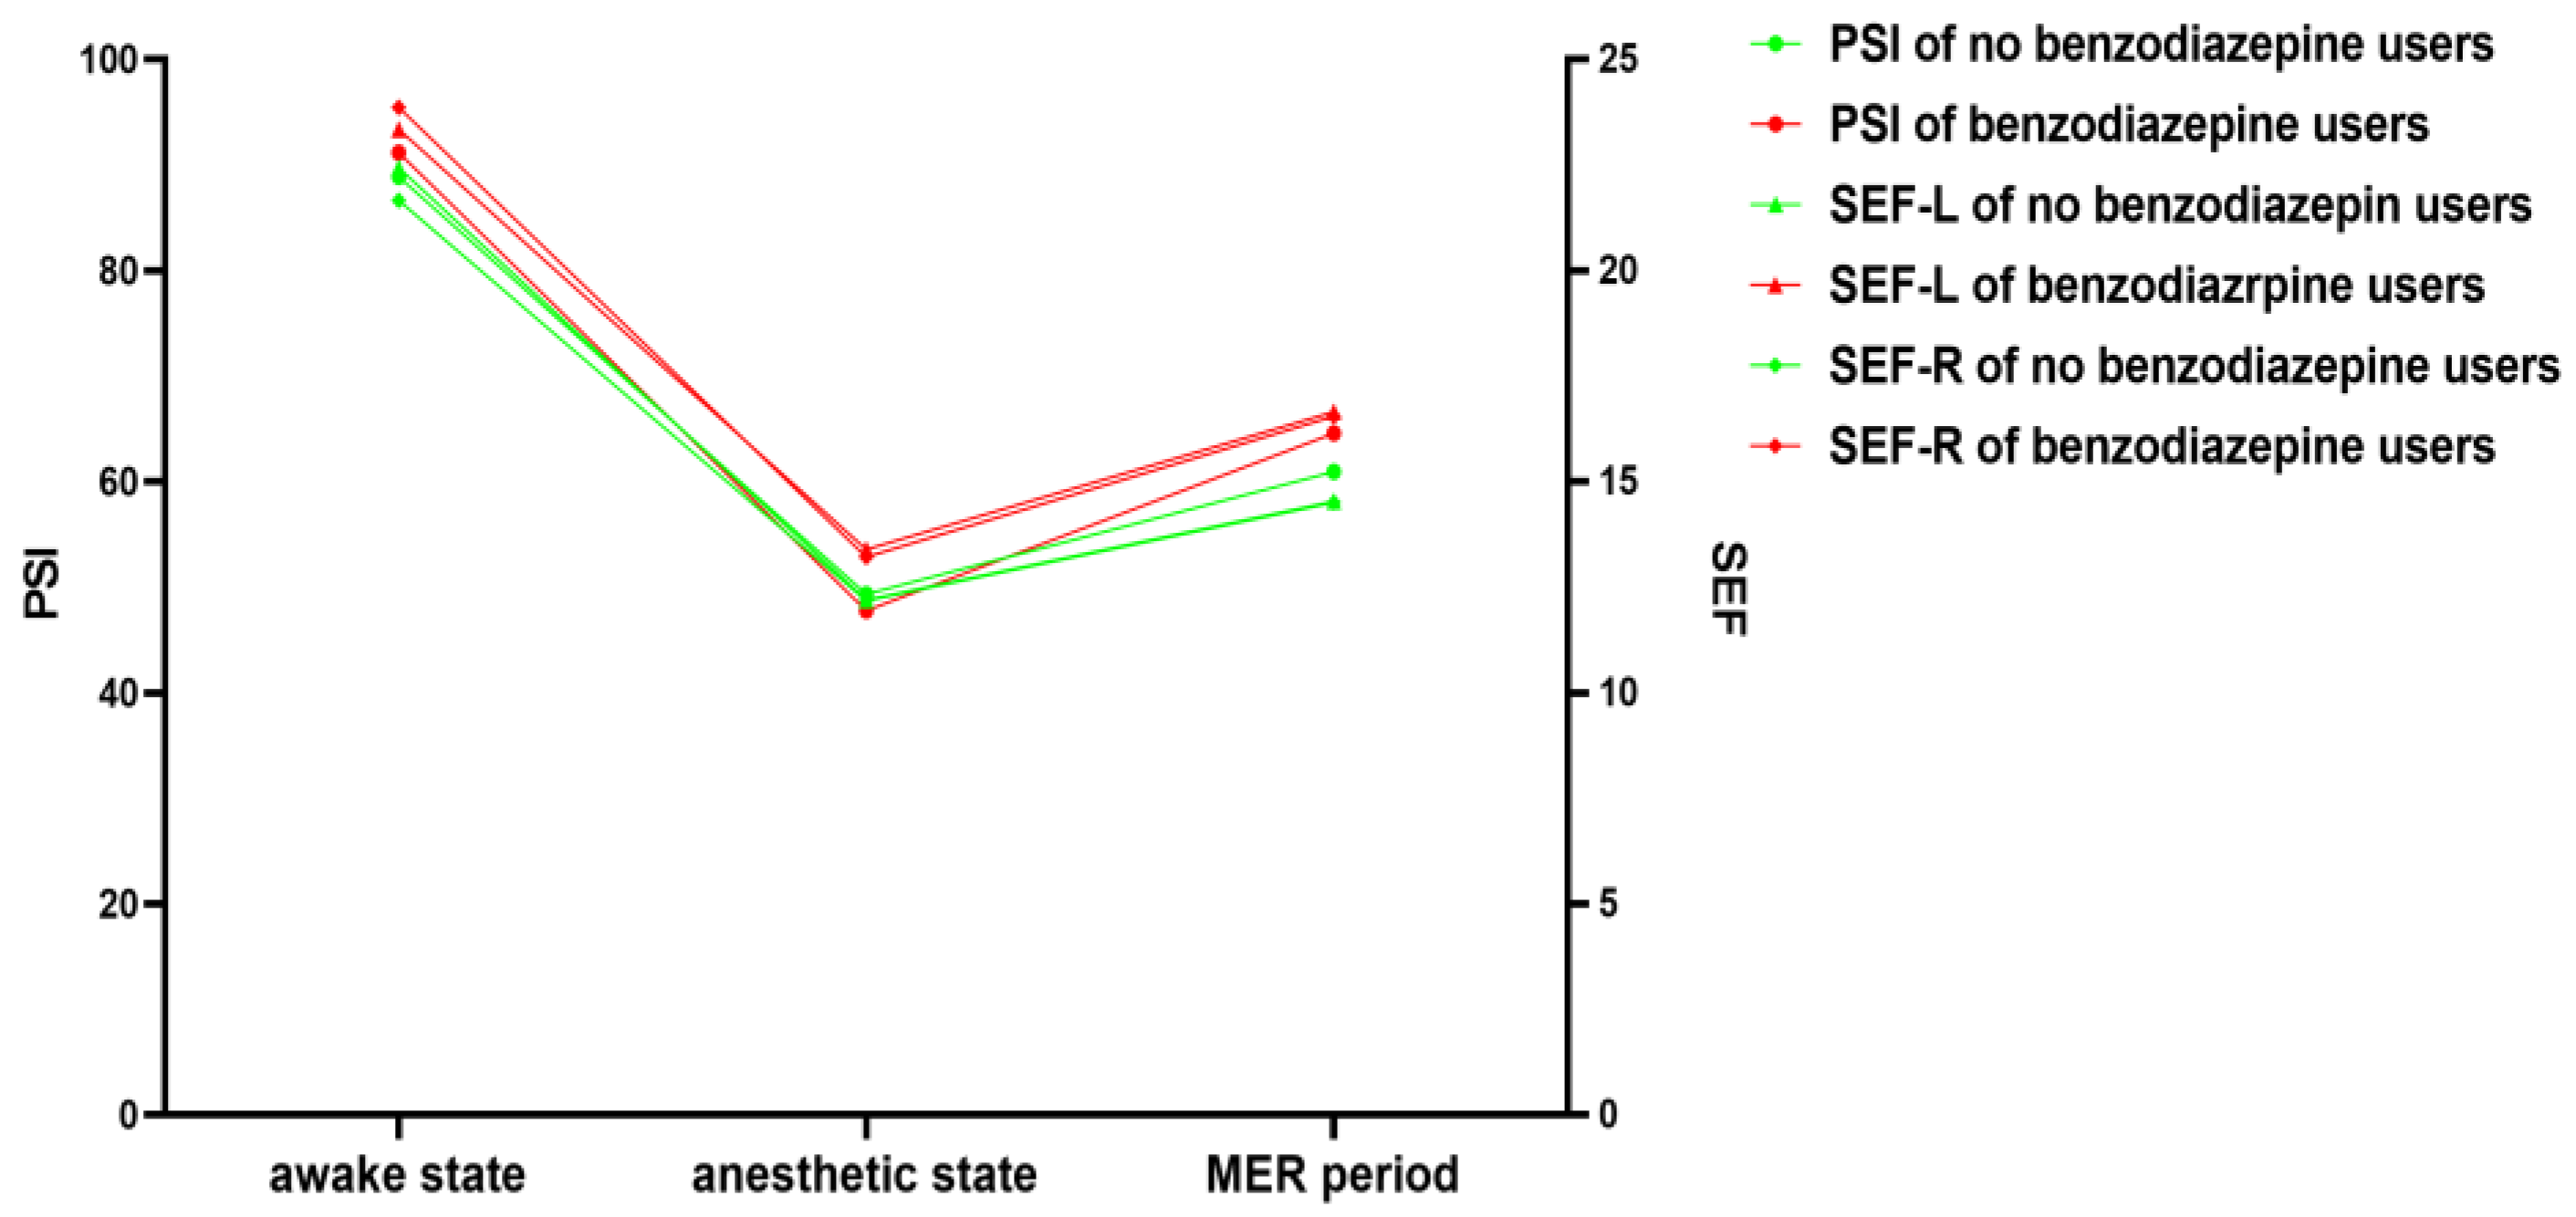
3.2. EEG Parameters
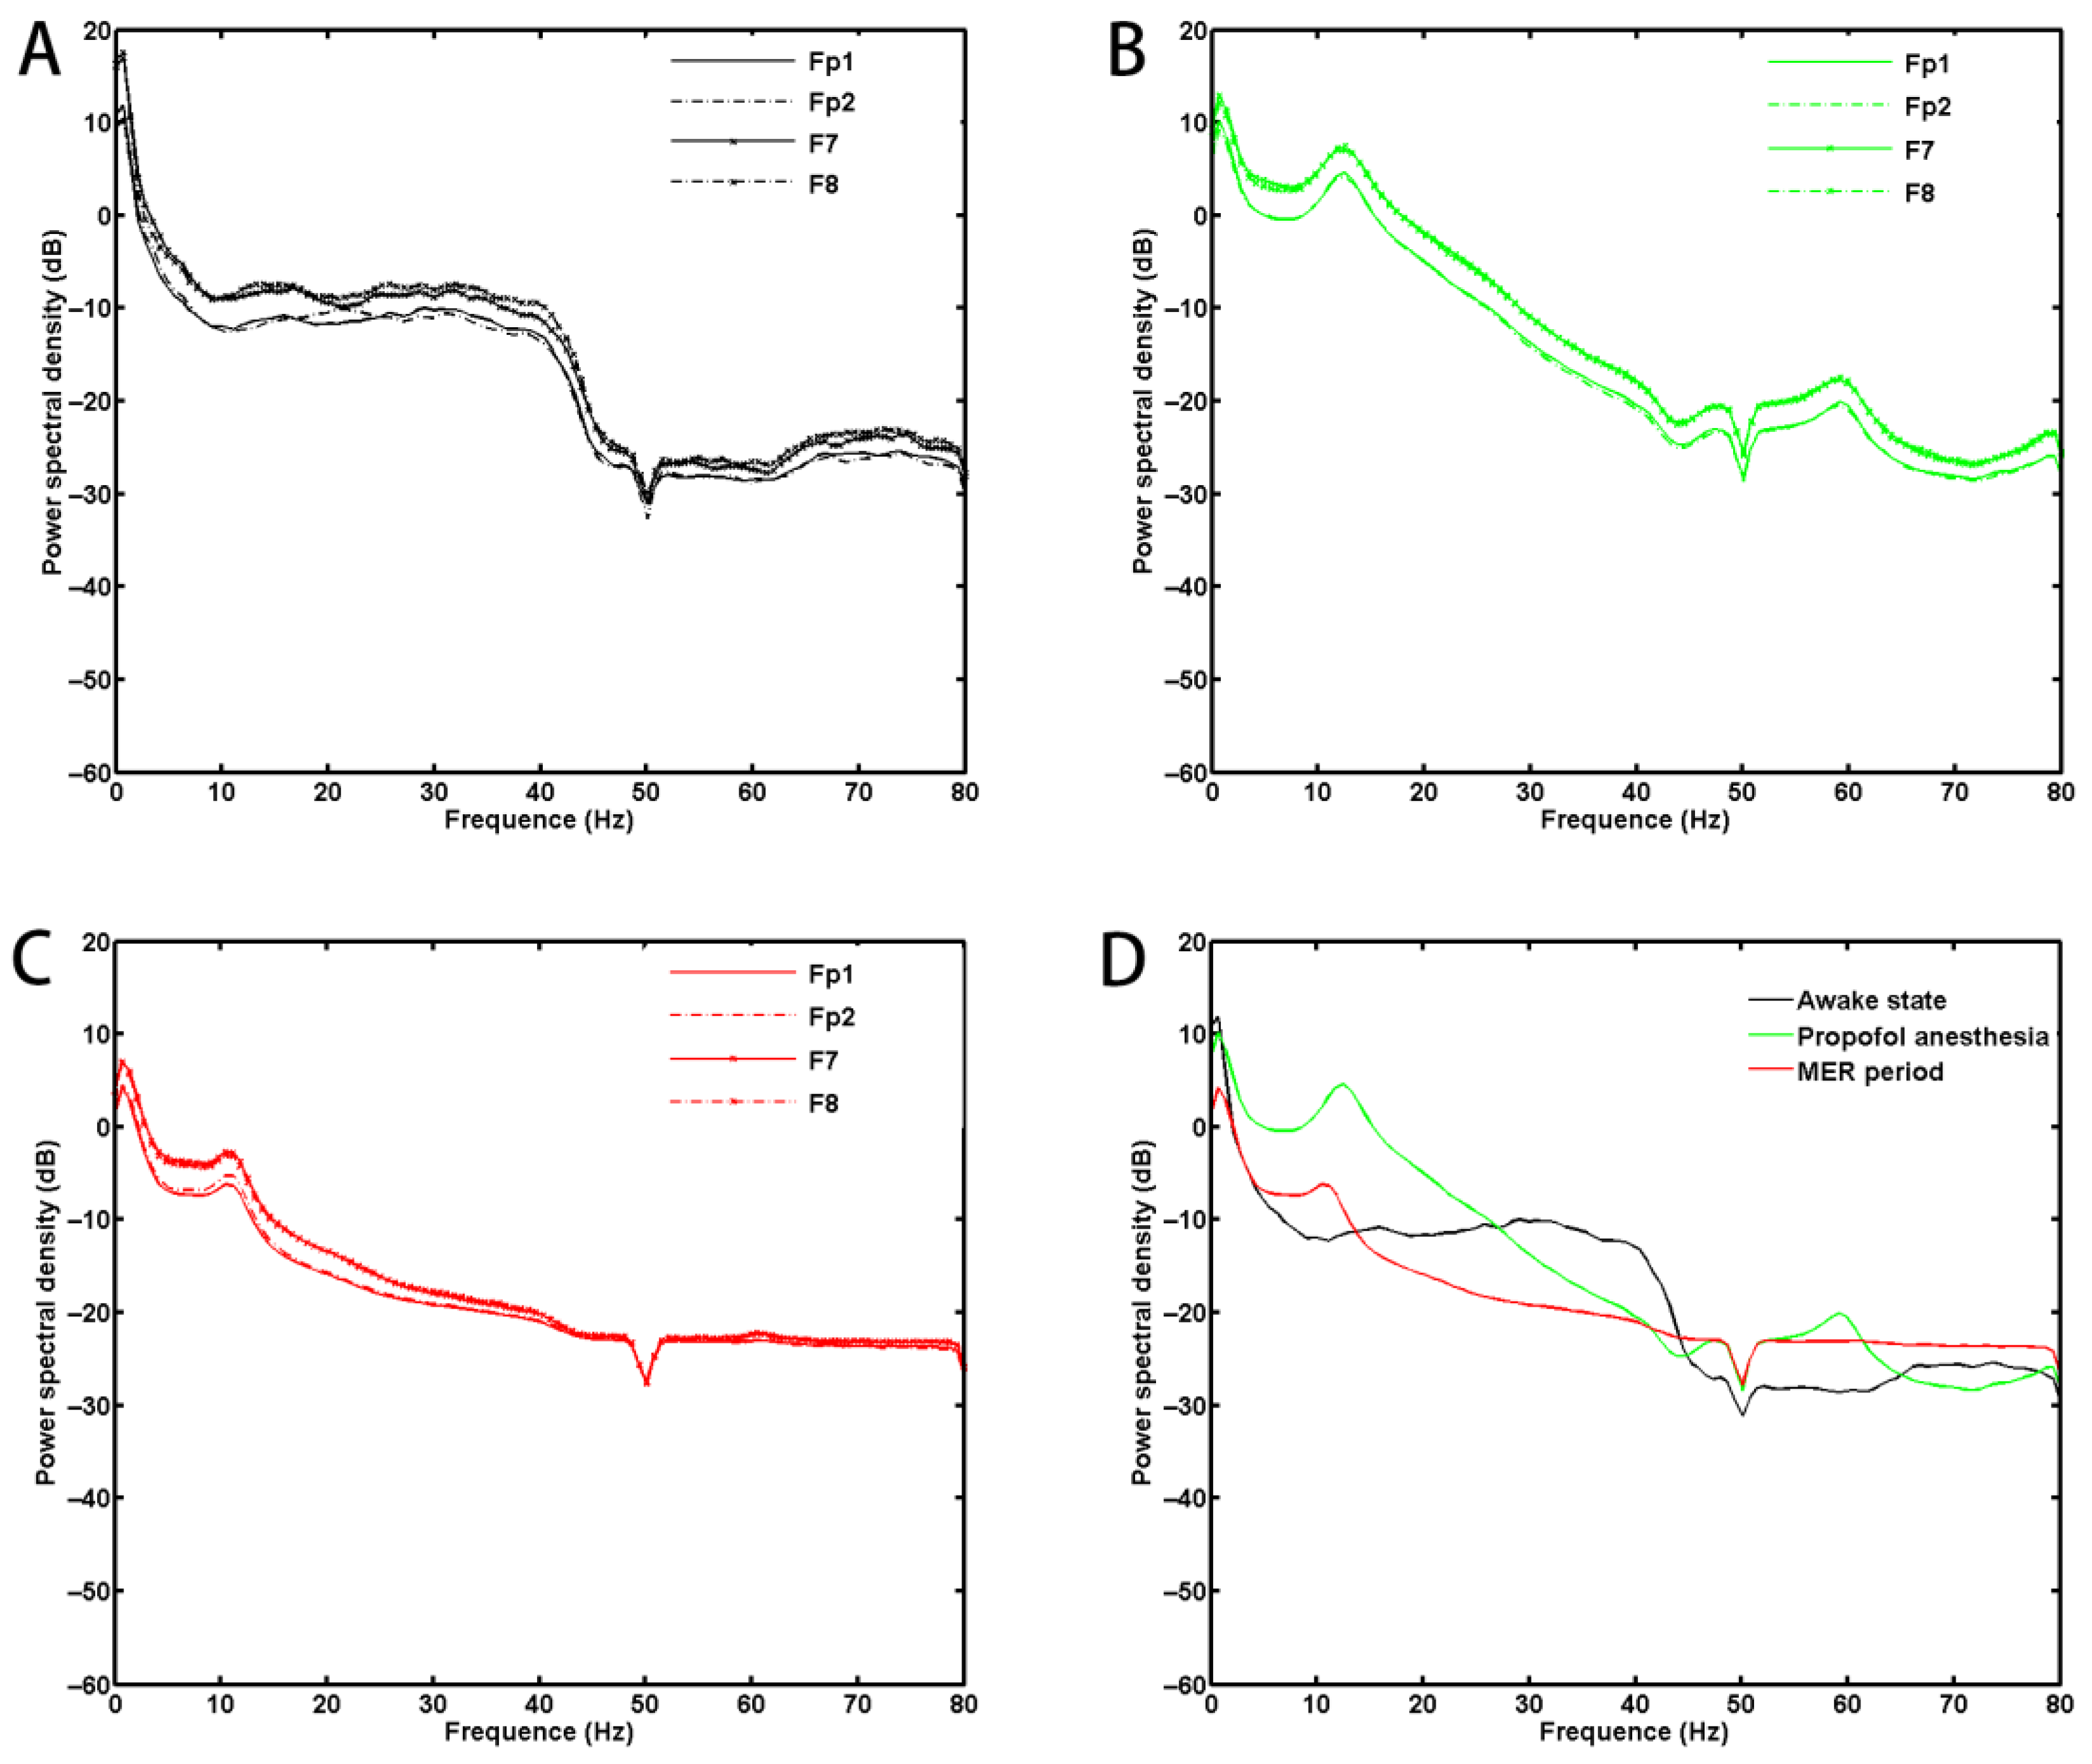
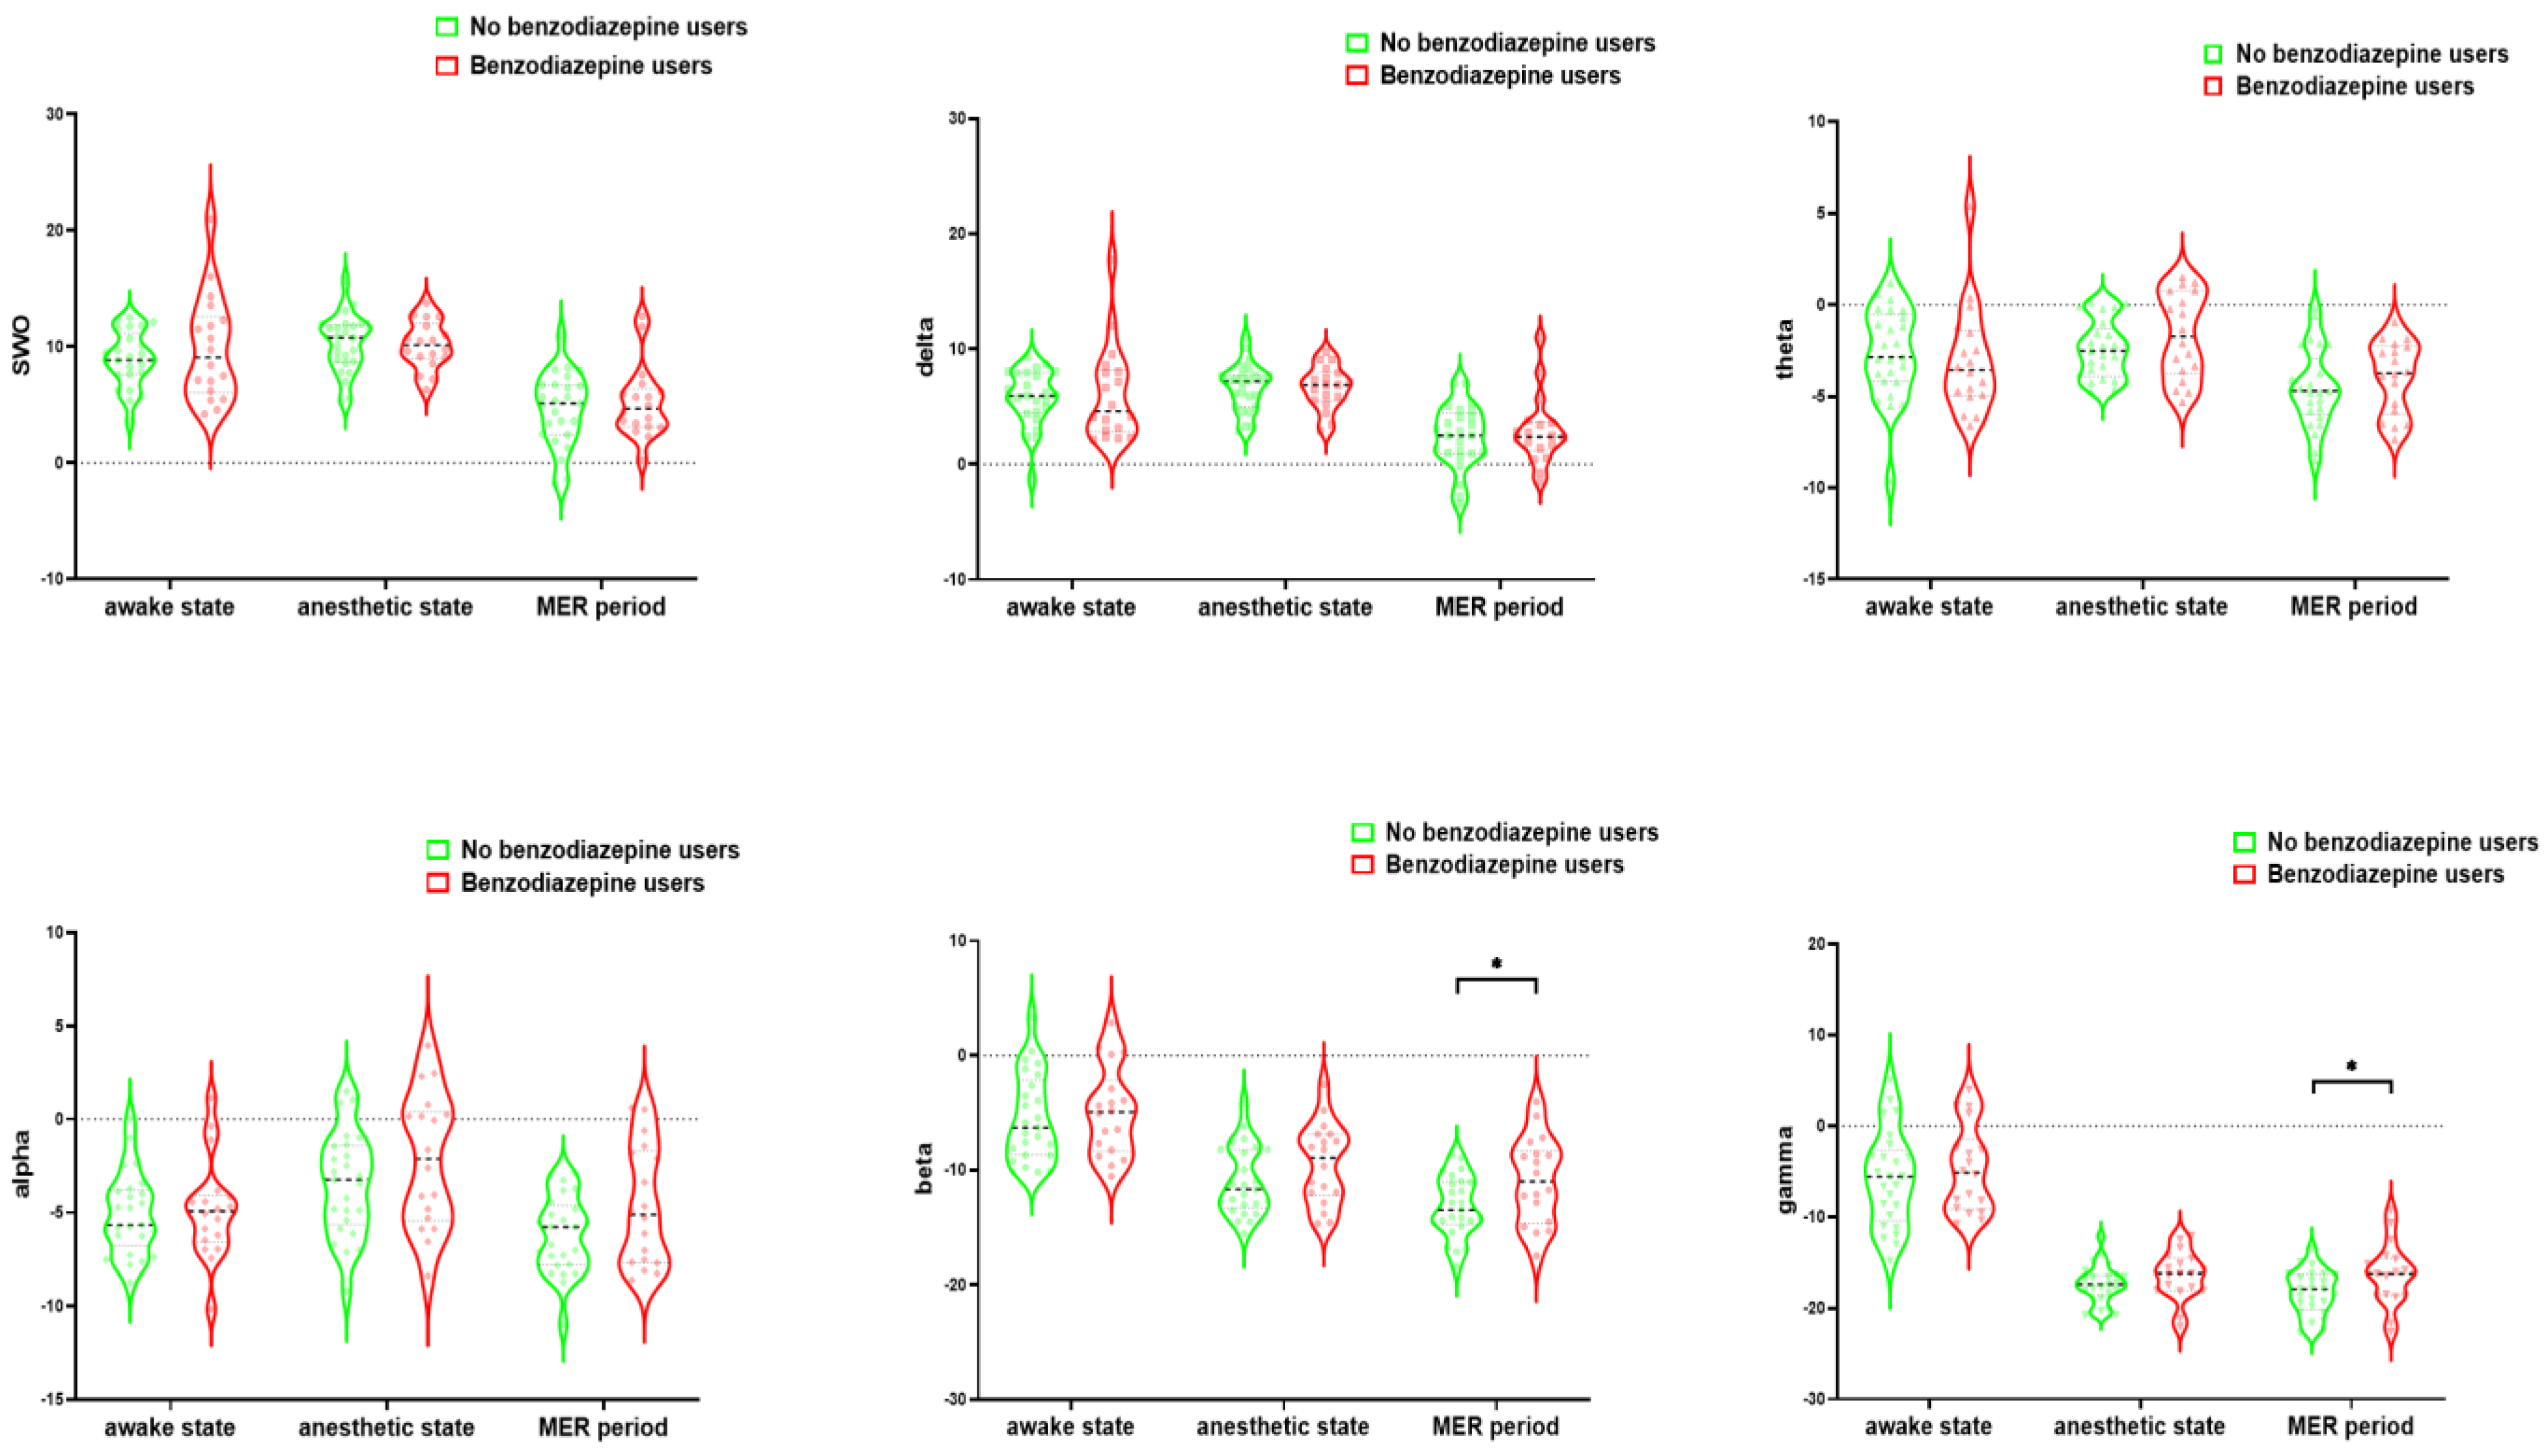
3.3. PSD Results
3.4. Linear Regression Analysis
3.5. Clinical Outcomes
4. Discussion
5. Conclusions
Supplementary Materials
Author Contributions
Funding
Institutional Review Board Statement
Informed Consent Statement
Data Availability Statement
Acknowledgments
Conflicts of Interest
References
- Bloem, B.R.; Okun, M.S.; Klein, C. Parkinson’s disease. Lancet 2021, 397, 2284–2303. [Google Scholar] [CrossRef] [PubMed]
- Anna, C.E.; Lhommée, E.M.; Moro, E.; Krack, P. Mood and behavioural effects of subthalamic stimulation in Parkinson’s disease. Lancet Neurol. 2014, 13, 287–305. [Google Scholar]
- Limousin, P.; Foltynie, T. Long-term outcomes of deep brain stimulation in Parkinson disease. Nat. Rev. Neurol. 2019, 15, 234–242. [Google Scholar] [CrossRef] [PubMed] [Green Version]
- Benabid, A.L.; Chabardes, S.; Mitrofanis, J.; Pollak, P. Deep brain stimulation of the subthalamic nucleus for the treatment of Parkinson’s disease. Lancet Neurol. 2009, 8, 67–81. [Google Scholar] [CrossRef]
- Hamani, C.; Richter, E.O.; Andrade-Souza, Y.; Hutchison, W.; Saint-Cyr, J.A.; Lozano, A.M. Correspondence of microelectrode mapping with magnetic resonance imaging for subthalamic nucleus procedures. Surg. Neurol. 2005, 63, 249–253. [Google Scholar] [CrossRef]
- Polanski, W.H.; Martin, K.D.; Engellandt, K.; von Kummer, R.; Klingelhoefer, L.; Fauser, M.; Storch, A.; Schackert, G.; Sobottka, S.B. Accuracy of subthalamic nucleus targeting by T2, FLAIR and SWI-3-Tesla MRI confirmed by microelectrode recordings. Acta Neurochir. 2015, 157, 479–486. [Google Scholar] [CrossRef]
- Schlaier, J.R.; Habermeyer, C.; Warnat, J.; Lange, M.; Janzen, A.; Hochreiter, A.; Proescholdt, M.; Brawanski, A.; Fellner, C. Discrepancies between the MRI- and the electrophysiologically defined subthalamic nucleus. Acta Neurochir. 2011, 12, 2307–2318. [Google Scholar] [CrossRef]
- Chakrabarti, R.; Ghazanwy, M.; Tewari, A. Anesthetic Challenges for Deep Brain Stimulation: A Systematic Approach. N. Am. J. Med Sci. 2014, 6, 359–369. [Google Scholar] [CrossRef]
- Venkatraghavan, L.; Luciano, M.; Manninen, P. Review article: Anesthetic management of patients undergoing deep brain stimulator insertion. Anesth. Anal. 2010, 110, 1138. [Google Scholar] [CrossRef] [Green Version]
- Rankin, D.; Tipton, C.; Stoicea, N.; Fiorda-Diaz, J.; Deogaonkar, M.S.; Andonian, N.; Bergese, S.D. Anesthetic Management of Parkinson’s Patients Undergoing Deep Brain Stimulation. Int. J. Anesth. Res. 2016, 4, 284–289. [Google Scholar]
- Jiang, N.; Ling, Y.-T.; Yang, C.; Liu, Y.; Xian, W.-B.; Zhang, L.-N.; Guo, Q.-Q.; Jin, X.-Y.; Wu, B.; Zhang, C.-M.; et al. Optimized Propofol Anesthesia Increases Power of Subthalamic Neuronal Activity in Patients with Parkinson’s Disease Undergoing Deep Brain Stimulation. Neurol. Ther. 2021, 10, 785–802. [Google Scholar] [CrossRef]
- Maltête, D.; Navarro, S.; Welter, M.L.; Roche, S.; Bonnet, A.-M.; Houerto, J.-L.; Mesnage, V.; Pidoux, B.; Dormont, D.; Cornu, P.; et al. Subthalamic stimulation in Parkinson disease: With or without anesthesia? Arch. Neurol. 2004, 61, 390–392. [Google Scholar] [CrossRef]
- Lefaucheur, J.P.; Gurruchaga, J.M.; Pollin, B.; Lefaucheur, J.-P.; Gurruchaga, J.-M.; Pollin, B.; von Raison, F.; Mohsen, N.; Shin, M.; Ménard-Lefaucheur, I.; et al. Outcome of bilateral subthalamic nucleus stimulation in the treatment of Parkinson’s disease: Correlation with intra-operative multi-unit recordings but not with the type of anaesthesia. Eur. Neurol. 2008, 60, 186–199. [Google Scholar] [CrossRef]
- Duque, P.; Mateo, O.; Ruiz, F.; de Viloria, J.; Contreras, A.; Grandas, F. Intraoperative microrecording under general anaesthesia with bispectral analysis monitoring in a case of deep brain stimulation surgery for Parkinson’s disease. Eur. J. Neurol. 2008, 15, e76–e77. [Google Scholar] [CrossRef]
- Aygun, D.; Alptekin, O.; Guz, H.; Kurt, M.; Sarihasan, B.; Temel, Y.; Kocabicak, E. Conversion of local anesthesia-guided deep brain stimulation of the subthalamic nucleus to general anesthesia. J. Neurol. Surg. A Cent. Eur. Neurosurg. 2013, 74, 332–334. [Google Scholar] [CrossRef]
- Fahy, B.G.; Chau, D.F. The Technology of Processed Electroencephalogram Monitoring Devices for Assessment of Depth of Anesthesia. Anesth. Analg. 2018, 126, 111–117. [Google Scholar] [CrossRef]
- Al Obada, Z.; Chung, K.W.; Rayus, T.K. Predicting Age from Brain EEG Signals—A Machine Learning Approach. Front. Aging Neurosci. 2018, 2, 184. [Google Scholar]
- Xu, X.-P.; Yu, X.-Y.; Wu, X.; Hu, X.-W.; Chen, J.-C.; Li, J.-B.; Wang, J.-F.; Deng, X.-M. Propofol requirement for induction of unconsciousness is reduced in patients with Parkinson’s disease: A case control study. Biomed. Res. Int. 2015, 2015, 953729. [Google Scholar] [CrossRef] [Green Version]
- Wang, J.F.; Xu, X.P.; Yu, X.Y.; Li, J.-B.; Wu, X.; Chen, J.-C.; Hu, X.-W.; Deng, X.-M. Remifentanil requirement for inhibiting responses to tracheal intubation and skin incision is reduced in patients with Parkinson’s disease undergoing deep brainstimulator implantation. J. Neurosurg. Anesthesiol. 2016, 28, 303–308. [Google Scholar] [CrossRef]
- Chloe, E.; Laurence, C. Prefrontal excitatory/inhibitory balance in stress and emotional disorders: Evidence for over-inhibition. Neurosci. Biobehav. Rev. 2019, 105, 39–51. [Google Scholar]
- Jeong, J.K.; Anant, G.; Jinfeng, T. Shared structural mechanisms of general anesthetics and benzodiazepines. Nature 2020, 585, 303–308. [Google Scholar]
- Bin, W.; Yuting, L.; Changming, Z. Risk Factors for Hiccups after Deep Brain Stimulation of Subthalamic Nucleus for Parkinson’s Disease. Brain Sci. 2022, 26, 1447. [Google Scholar]
- Stebbins Glenn, T.; Goetz Christopher, G.; Burn David, J.; Jankovic, J.; Khoo Tien, K.; Tilley Barbara, C. How to identify tremor dominant and postural instability/gait difficulty groups with the movement disorder society unified Parkinson’s disease rating scale: Comparison with the unified Parkinson’s disease rating scale. Mov. Disord. 2013, 28, 668–670. [Google Scholar] [CrossRef] [PubMed]
- Inouye, S.K.; Van Dyck, C.H.; Alessi, C.A.; Balkin, S.; Siegal, A.P.; Horwitz, R.I. Clarifying confusion: The confusion assessment method. A new method for detection of delirium. Ann. Intern. Med. 1990, 113, 941–948. [Google Scholar] [CrossRef]
- Alessandro, B.; Thummaporn, N.; Fumitaka, Y. Normative values for SedLine-based processed electroencephalography parameters in awake volunteers: A prospective observational study. J. Clin. Monit. Comput. 2021, 35, 1411–1419. [Google Scholar]
- Hashemi, A.; Pino, L.J.; Moffat, G.; Mathewson, K.J.; Aimone, C.; Bennett, P.J.; Schmidt, L.A.; Sekuler, A.B. Characterizing population EEG dynamics throughout adulthood. eNeuro 2016, 3, 0275–16.2016. [Google Scholar] [CrossRef]
- Prichep, L.S.; Gugino, L.D.; John, E.R.; Chabot, R.J.; Howard, B.; Merkin, H.; Tom, M.L.; Wolter, S.; Rausch, L.; Kox, W.J. The Patient State Index as an indicator of the level of hypnosis under general anaesthesia. Br. J. Anaesth. 2004, 92, 393–399. [Google Scholar] [CrossRef]
- Japaridze, N.; Muthuraman, M.; Reinicke, C.; Moeller, F.; Anwar, A.R.; Mideksa, K.G.; Pressler, R.; Deuschl, G.; Stephani, U.; Siniatchkin, M. Neuronal networks during burst suppression as revealed by source analysis. PLoS ONE 2015, 10, e0123807. [Google Scholar] [CrossRef] [Green Version]
- Williams, A.J.; Zhou, C.; Sun, Q.Q. Enhanced burst-suppression and disruption of local feld potential synchrony in a mouse model of focal cortical dysplasia exhibiting spike-wave seizures. Front. Neural. Circ. 2016, 10, 93. [Google Scholar]
- Fritz, B.A.; Kalarickal, P.L.; Maybrier, H.R.; Muench, M.R.; Dearth, D.; Chen, Y.; Escallier, K.E.; Ben Abdallah, A.; Lin, N.; Avidan, M.S. Intraoperative electroencephalogram suppression predicts postoperative delirium. Anesth. Analg. 2016, 122, 234–242. [Google Scholar] [CrossRef] [Green Version]
- Soehle, M.; Dittmann, A.; Ellerkmann, R.K.; Baumgarten, G.; Putensen, C.; Guenther, U. Intraoperative burst suppression is associated with postoperative delirium following cardiac surgery: A prospective, observational study. BMC Anesthesiol. 2015, 15, 61. [Google Scholar] [CrossRef] [Green Version]
- Tang, C.J.; Jin, Z.; Sands, L.P.; Pleasants, D.; Tabatabai, S.; Hong, Y.; Leung, J.M. ADAPT-2: A randomized clinical trial to reduce intraoperative EEG suppression in older surgical patients undergoing major noncardiac surgery. Anesth. Analg. 2020, 131, 1228–1236. [Google Scholar] [CrossRef]
- Pleasants, D.; Zak, R.; Ashbrook, L.H.; Zhang, L.; Tang, C.; Tran, D.; Wang, M.; Tabatabai, S.; Leung, J.M. Processed electroencephalography: Impact of patient age and surgical position on intraoperative processed electroencephalogram monitoring of burst-suppression. J. Clin. Monit. Comput. 2022, 36, 1099–1107. [Google Scholar] [CrossRef]
- Hoekema, R.; Wieneke, G.H.; Leijten, F.S.; van Veelen, C.W.; van Rijen, P.C.; Huiskamp, G.J.; Ansems, J.; van Hufelen, A.C. Measurement of the conductivity of skull, temporarily removed during epilepsy surgery. Brain Topogr. 2003, 16, 29–38. [Google Scholar] [CrossRef]
- McGinnis, S.M.; Brickhouse, M.; Pascual, B.; Dickerson, B.C. Agerelated changes in the thickness of cortical zones in humans. Brain Topogr. 2011, 24, 279–291. [Google Scholar] [CrossRef]


| Total | No Benzodiazepine Users | Benzodiazepine Users | p | ||||
|---|---|---|---|---|---|---|---|
| n = 43 | n = 25 | n = 18 | |||||
| Age (years) | 61.42 | ±8.87 | 58.72 | ±9.69 | 65.17 | ±6.01 | 0.01 a |
| Male sex | 24 | (55.81) | 16 | (64.00) | 8 | (44.44) | 0.23 b |
| Body mass index (kg/m2) | 23.49 | ±5.71 | 24.60 | ±6.44 | 21.95 | ±4.20 | 0.14 a |
| Education duration (years) | 10.77 | ±5.14 | 10.96 | ±5.07 | 10.50 | ±5.36 | 0.78 a |
| Hypertension | 7 | (16.28) | 3 | (12.00) | 4 | (22.22) | 0.43 b |
| Diabetes | 4 | (9.30) | 3 | (12.00) | 1 | (5.56) | 0.63 b |
| Age at onset of PD (years) | 51.88 | ±8.08 | 49.16 | ±7.91 | 55.67 | ±6.84 | 0.01 a |
| Duration of PD (years) | 9.58 | ±4.50 | 9.56 | ±5.33 | 9.61 | ±3.15 | 0.97 a |
| Hoehn and Yahr stage, off | 3.11 | ±0.69 | 2.98 | ±0.57 | 3.28 | ±0.83 | 0.20 a |
| Hoehn and Yahr stage, on | 2.20 | ±0.63 | 2.10 | ±0.58 | 2.33 | ±0.69 | 0.23 a |
| Levodopa challenge test (%) | 62.57 | ±13.79 | 65.74 | ±14.61 | 58.16 | ±11.52 | 0.08 a |
| MDS-UPDRS IA | 3.33 | ±2.67 | 2.80 | ±2.47 | 4.06 | ±2.84 | 0.13 a |
| MDS-UPDRS IB + II | 24.02 | ±11.52 | 21.08 | ±9.34 | 28.11 | ±13.21 | 0.05 a |
| MDS-UPDRS III, off | 45.33 | ±15.00 | 43.12 | ±12.60 | 48.39 | ±17.73 | 0.29 a |
| MDS-UPDRS III, on | 17.65 | ±10.30 | 15.00 | ±8.31 | 21.33 | ±11.84 | 0.05 a |
| MDS-UPDRS IV | 7.16 | ±4.04 | 6.88 | ±3.83 | 7.56 | ±4.40 | 0.60 a |
| Motor type (tremor) | 15 | (34.88) | 9 | (36.67) | 6 | (33.33) | 0.86 b |
| MMSE score | 26.47 | ±3.46 | 26.96 | ±3.20 | 25.78 | ±3.78 | 0.27 a |
| ESS score | 6.21 | ±5.54 | 6.20 | ±5.49 | 6.22 | ±5.77 | 0.99 a |
| PSQI score | 10.44 | ±4.80 | 8.36 | ±4.22 | 13.33 | ±4.07 | <0.01 a |
| PDSS score | 99.73 | ±20.96 | 111.48 | ±15.84 | 83.42 | ±15.69 | <0.01 a |
| RBD | 20 | (46.51) | 13 | (52.00) | 7 | (38.89) | 0.40 b |
| Anxious | 6 | (13.95) | 1 | (4.00) | 5 | (27.78) | 0.07 b |
| Depressed | 1 | (2.33) | 0 | (0.00) | 1 | (5.56) | 0.42 b |
| Apathy | 12 | (27.91) | 7 | (28.00) | 5 | (27.78) | 0.99 b |
| Freezing of gait | 24 | (55.81) | 11 | (44.00) | 13 | (72.22) | 0.06 b |
| Prefrontal silent ischemia | 23 | (53.49) | 11 | (44.00) | 12 | (66.67) | 0.14 b |
| LEDD (mg) | 897.91 | ±451.99 | 802.37 | ±259.05 | 1030.62 | ±614.75 | 0.15 a |
| Antidepressants | 12 | (27.91) | 5 | (20.00) | 7 | (38.89) | 0.17 b |
| Anesthesia time (min) | 429.19 | ±52.33 | 439.40 | ±51.70 | 415.00 | ±51.25 | 0.13 a |
| N | Total | n | No Benzodiazepine Users | n | Benzodiazepine Users | p | ||||
|---|---|---|---|---|---|---|---|---|---|---|
| Awake state before anesthesia | ||||||||||
| Heart rate, bpm | 43 | 81.27 | ±16.12 | 25 | 80.76 | ±16.21 | 18 | 81.97 | ±16.44 | 0.81 a |
| MAP, mmHg | 43 | 100.28 | ±14.16 | 25 | 102.61 | ±14.86 | 18 | 97.03 | ±12.82 | 0.21 a |
| Oral temperature, °C | 43 | 36.28 | ±0.37 | 25 | 36.30 | ±0.32 | 18 | 36.26 | ±0.44 | 0.69 a |
| Potential of hydrogen | 24 | 7.44 | ±0.03 | 16 | 7.44 | ±0.03 | 8 | 7.45 | ±0.03 | 0.96 a |
| Carbon dioxide, mmHg | 24 | 40.54 | ±4.93 | 16 | 40.50 | ±2.94 | 8 | 40.63 | ±7.82 | 0.95 b |
| Glucose, mmol/L | 24 | 5.80 | ±0.89 | 16 | 5.93 | ±1.05 | 8 | 5.54 | ±0.38 | 0.27 b |
| Lactic acid, mmol/L | 24 | 1.28 | ±0.65 | 16 | 1.36 | ±0.73 | 8 | 1.11 | ±0.46 | 0.39 a |
| Propofol anesthesia state | ||||||||||
| Heart rate, bpm | 43 | 62.03 | ±9.39 | 25 | 62.03 | ±9.62 | 18 | 62.03 | ±9.32 | 0.99 a |
| MAP, mmHg | 43 | 76.91 | ±9.05 | 25 | 78.66 | ±9.54 | 18 | 74.47 | ±7.95 | 0.14 a |
| Oral temperature, °C | 43 | 36.17 | ±0.41 | 25 | 36.17 | ±0.39 | 18 | 36.17 | ±0.45 | 0.99 a |
| Potential of hydrogen | 23 | 7.43 | ±0.04 | 15 | 7.42 | ±0.04 | 8 | 7.45 | ±0.05 | 0.13 a |
| Carbon dioxide, mmHg | 23 | 40.13 | ±4.15 | 15 | 41.07 | ±4.20 | 8 | 38.38 | ±3.66 | 0.13 a |
| Glucose, mmol/L | 24 | 5.65 | ±0.80 | 16 | 5.69 | ±0.91 | 8 | 5.56 | ±0.55 | 0.81 b |
| Lactic acid, mmol/L | 24 | 1.25 | ±0.45 | 16 | 1.29 | ±0.49 | 8 | 1.15 | ±0.37 | 0.48 a |
| MER period | ||||||||||
| Heart rate, bpm | 43 | 63.31 | ±11.19 | 25 | 63.00 | ±10.79 | 18 | 63.73 | ±12.02 | 0.84 a |
| MAP, mmHg | 43 | 79.07 | ±6.54 | 25 | 80.25 | ±6.55 | 18 | 77.43 | ±6.34 | 0.16 a |
| Oral temperature, °C | 43 | 36.04 | ±0.56 | 25 | 36.05 | ±0.59 | 18 | 36.02 | ±0.52 | 0.84 a |
| Potential of hydrogen | 24 | 7.44 | ±0.05 | 16 | 7.44 | ±0.05 | 8 | 7.46 | ±0.05 | 0.20 a |
| Carbon dioxide, mmHg | 24 | 38.54 | ±4.85 | 16 | 39.38 | ±4.99 | 8 | 36.88 | ±4.36 | 0.27 b |
| Glucose, mmol/L | 24 | 4.93 | ±0.65 | 16 | 4.96 | ±0.72 | 8 | 4.85 | ±0.51 | 0.70 a |
| Lactic acid, mmol/L | 24 | 1.95 | ±0.64 | 16 | 1.89 | ±0.51 | 8 | 2.08 | ±0.86 | 0.52 a |
| Mean | SD | Median | Min | Max | P25 | P75 | |
|---|---|---|---|---|---|---|---|
| Awake state before anesthesia | |||||||
| PSI | 89.86 | 6.89 | 92.51 | 69.80 | 97.73 | 87.94 | 94.37 |
| SEF-L, Hz | 22.81 | 4.14 | 24.13 | 9.95 | 28.24 | 19.88 | 26.29 |
| SEF-R, Hz | 22.58 | 4.13 | 23.17 | 12.21 | 28.79 | 19.88 | 26.15 |
| Total time of SUP, min | 0.85 | 1.50 | 0.35 | 0.00 | 6.50 | 0.05 | 0.67 |
| Maximum SUP ratio, % | 3.12 | 4.35 | 2.00 | 0.00 | 28.00 | 2.00 | 4.00 |
| EMG, % | 59.90 | 22.00 | 62.01 | 11.78 | 96.71 | 42.26 | 77.20 |
| Propofol anesthesia state | |||||||
| PSI | 48.68 | 12.65 | 49.38 | 23.48 | 88.82 | 41.81 | 55.87 |
| SEF-L, Hz | 12.70 | 3.33 | 12.80 | 6.65 | 19.71 | 10.30 | 14.67 |
| SEF-R, Hz | 12.61 | 3.29 | 12.41 | 6.13 | 18.84 | 10.12 | 15.20 |
| Total time of SUP, min | 9.44 | 20.23 | 1.20 | 0.00 | 124.10 | 0.28 | 12.07 |
| Maximum SUP ratio, % | 7.49 | 7.38 | 6.00 | 0.00 | 34.00 | 2.00 | 10.00 |
| MER period | |||||||
| PSI | 62.46 | 13.08 | 62.18 | 27.32 | 90.95 | 54.58 | 71.10 |
| SEF-L, Hz | 15.42 | 4.07 | 15.74 | 7.46 | 23.89 | 11.98 | 18.56 |
| SEF-R, Hz | 15.36 | 4.07 | 15.64 | 7.62 | 23.85 | 12.40 | 18.91 |
| Total time of SUP, min | 9.59 | 22.45 | 2.57 | 0.00 | 141.33 | 0.53 | 10.20 |
| Maximum SUP ratio, % | 7.12 | 6.25 | 6.00 | 0.00 | 30.00 | 4.00 | 10.00 |
| Total Time of SUP during MER | Maximum SUP Ratio during MER | |||
| B (95% CI) | p | B (95% CI) | p | |
| With/without benzodiazepine | −16.11 (−31.06, −1.16) | 0.04 | −5.19 (−9.21, −1.16) | 0.01 |
| Age, years | 0.25 (−1.28, 1.77) | 0.75 | −0.23 (−0.64, 0.18) | 0.27 |
| Age at onset of PD, years | 0.43 (−1.27, 2.14) | 0.61 | 0.35 (−0.11, 0.81) | 0.13 |
| Average PSD of Beta during MER | Average PSD of Gamma during MER | |||
| B (95% CI) | p | B (95% CI) | p | |
| With/without benzodiazepine | 2.33 (0.12, 4.54) | 0.04 | 2.07 (0.09, 4.05) | 0.04 |
| Age, years | −0.05 (−0.28, 0.17) | 0.64 | −0.05 (−0.25, 0.15) | 0.64 |
| Age at onset of PD, years | 0.04 (−0.21, 0.30) | 0.73 | 0.04 (−0.18, 0.27) | 0.71 |
Disclaimer/Publisher’s Note: The statements, opinions and data contained in all publications are solely those of the individual author(s) and contributor(s) and not of MDPI and/or the editor(s). MDPI and/or the editor(s) disclaim responsibility for any injury to people or property resulting from any ideas, methods, instructions or products referred to in the content. |
© 2022 by the authors. Licensee MDPI, Basel, Switzerland. This article is an open access article distributed under the terms and conditions of the Creative Commons Attribution (CC BY) license (https://creativecommons.org/licenses/by/4.0/).
Share and Cite
Ling, Y.; Liu, L.; Wang, S.; Guo, Q.; Xiao, Q.; Liu, Y.; Qu, B.; Wen, Z.; Li, Y.; Zhang, C.; et al. Characteristics of Electroencephalogram in the Prefrontal Cortex during Deep Brain Stimulation of Subthalamic Nucleus in Parkinson’s Disease under Propofol General Anesthesia. Brain Sci. 2023, 13, 62. https://doi.org/10.3390/brainsci13010062
Ling Y, Liu L, Wang S, Guo Q, Xiao Q, Liu Y, Qu B, Wen Z, Li Y, Zhang C, et al. Characteristics of Electroencephalogram in the Prefrontal Cortex during Deep Brain Stimulation of Subthalamic Nucleus in Parkinson’s Disease under Propofol General Anesthesia. Brain Sciences. 2023; 13(1):62. https://doi.org/10.3390/brainsci13010062
Chicago/Turabian StyleLing, Yuting, Lige Liu, Simin Wang, Qianqian Guo, Qingyuan Xiao, Yi Liu, Bo Qu, Zhishuang Wen, Yongfu Li, Changming Zhang, and et al. 2023. "Characteristics of Electroencephalogram in the Prefrontal Cortex during Deep Brain Stimulation of Subthalamic Nucleus in Parkinson’s Disease under Propofol General Anesthesia" Brain Sciences 13, no. 1: 62. https://doi.org/10.3390/brainsci13010062