
PTPRN Serves as a Prognostic Biomarker and Correlated with Immune Infiltrates in Low Grade Glioma


Abstract
:1. Introduction
2. Material and Methods
2.1. PTPRN Expression and Overall Survival Analysis by Gepia
2.2. The Human Protein Atlas Database
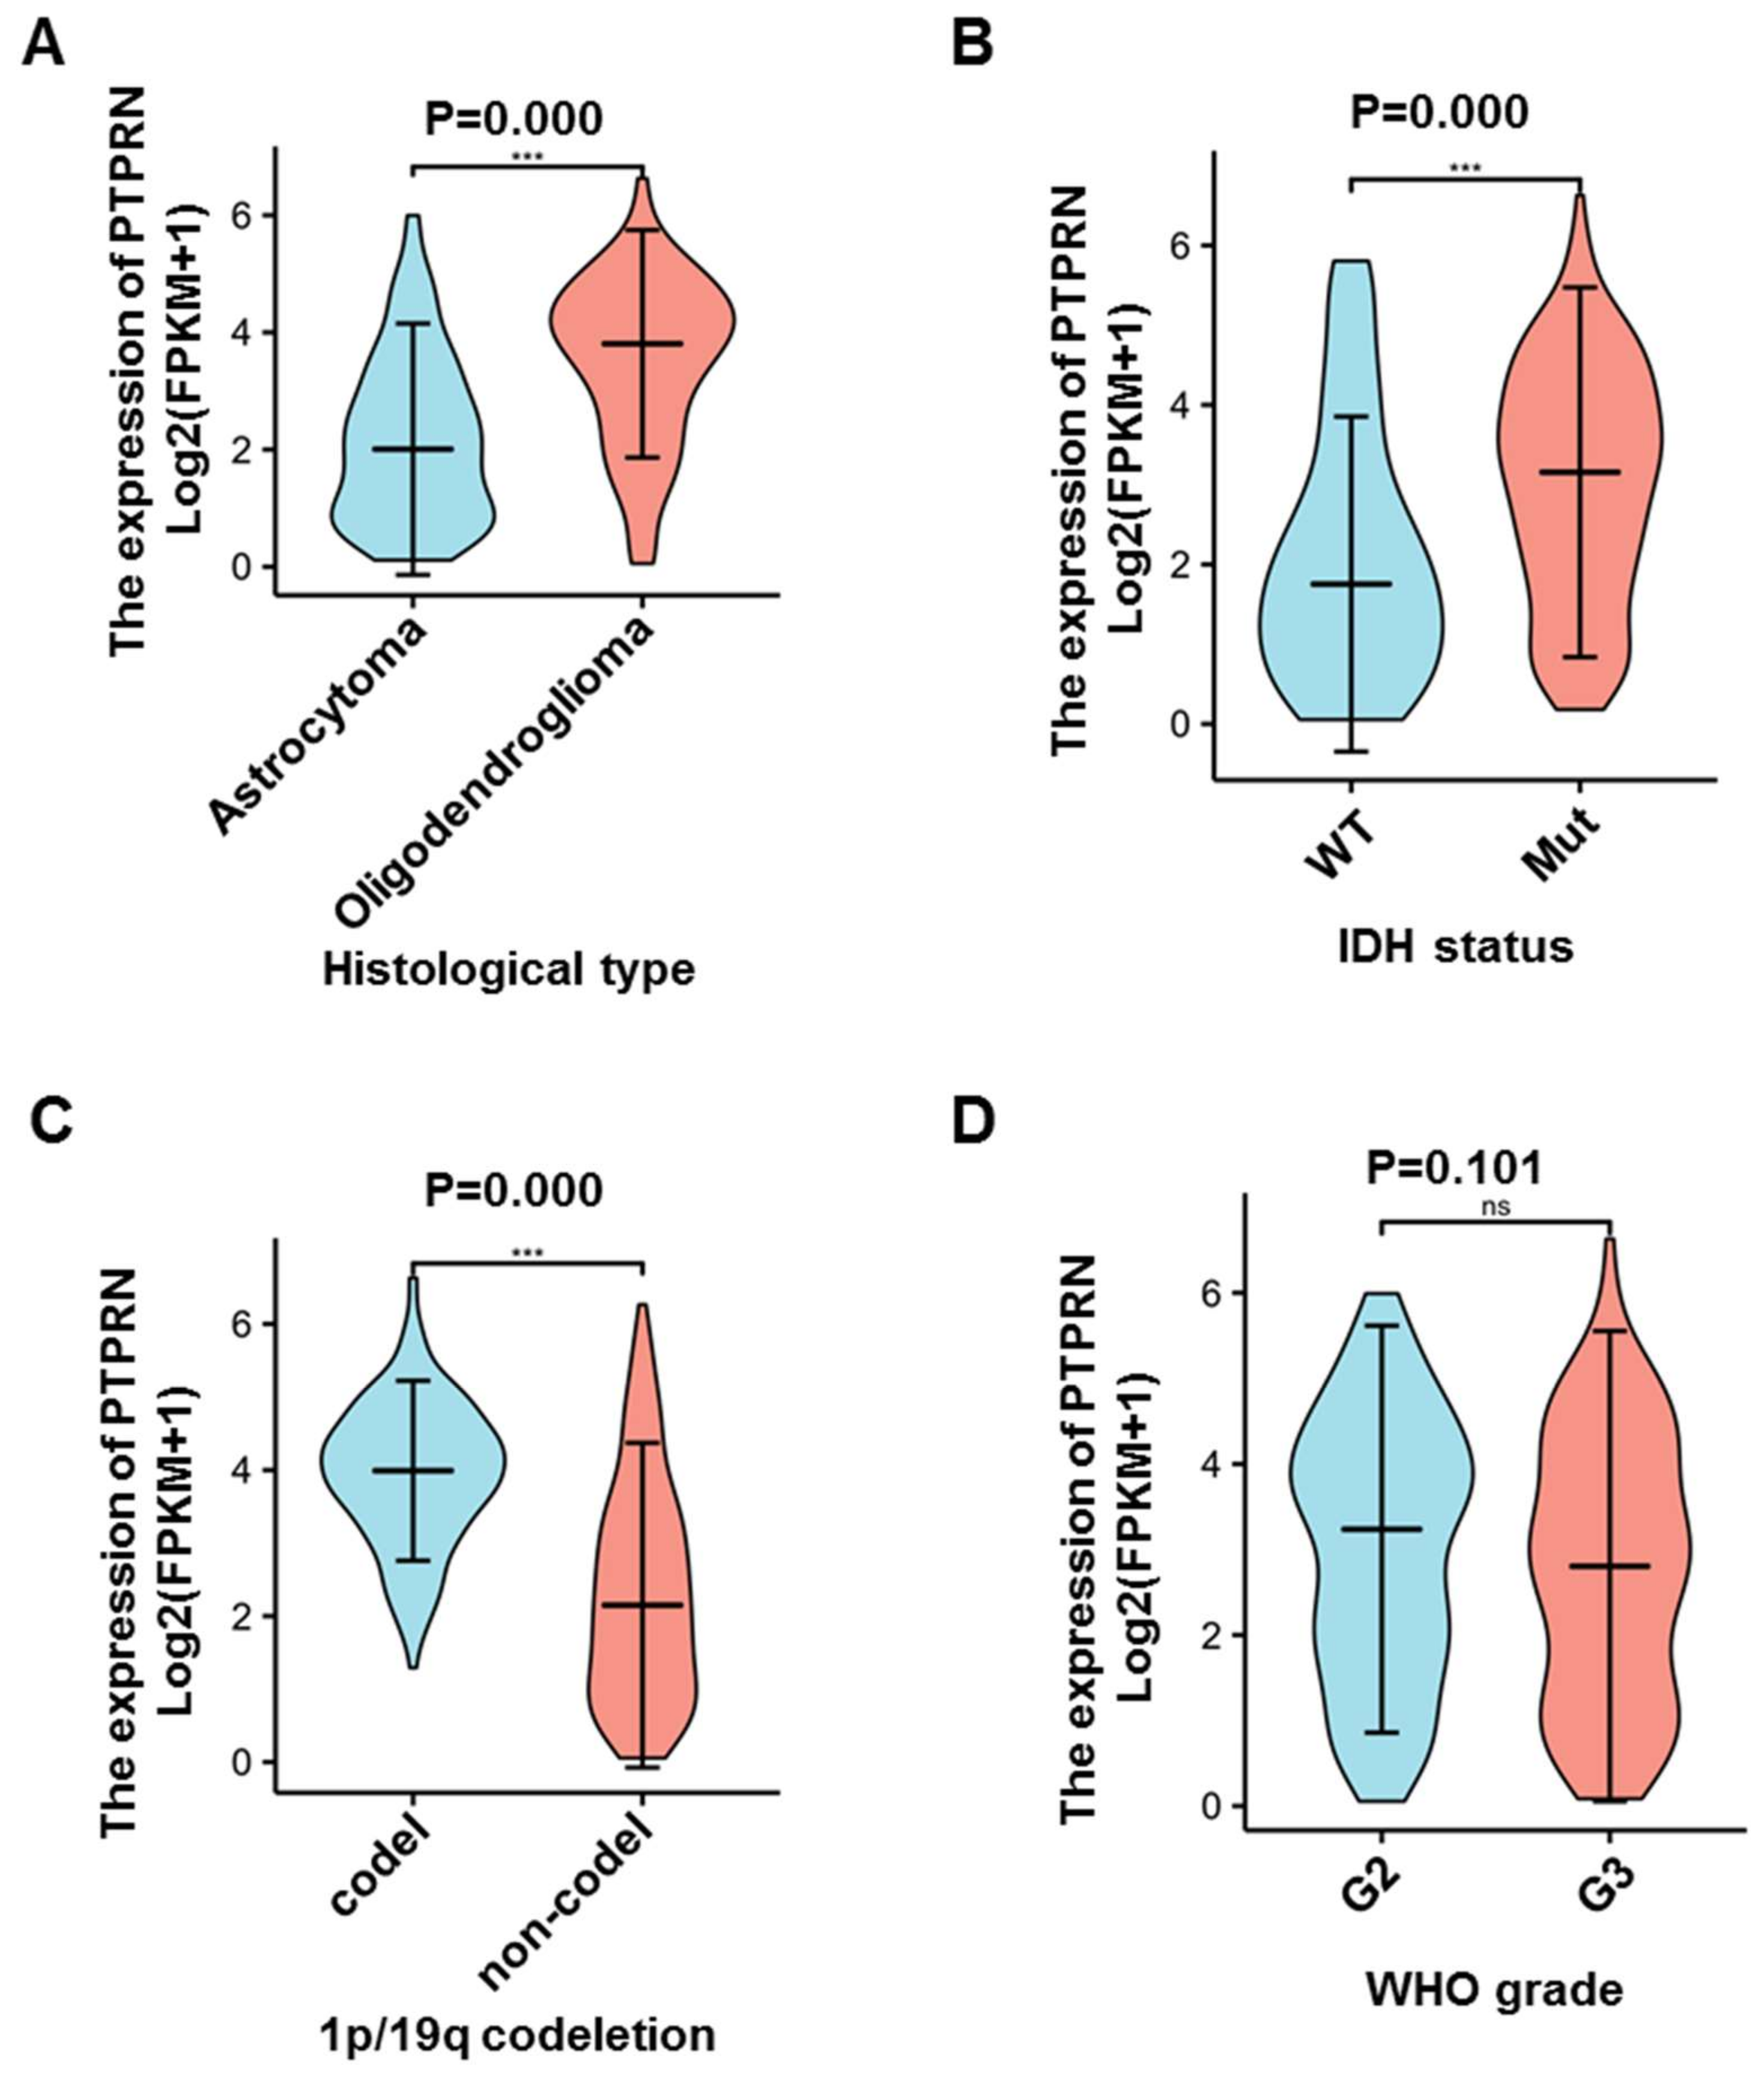
2.3. Clinic Data Analysis
2.4. DNA Methylation of the PTPRN Gene
2.5. TIMER Database to Analyze Tumor Infiltrating Immune Cells
2.6. Gene Set Enrichment Analysis
2.7. Statistical Analysis
3. Results
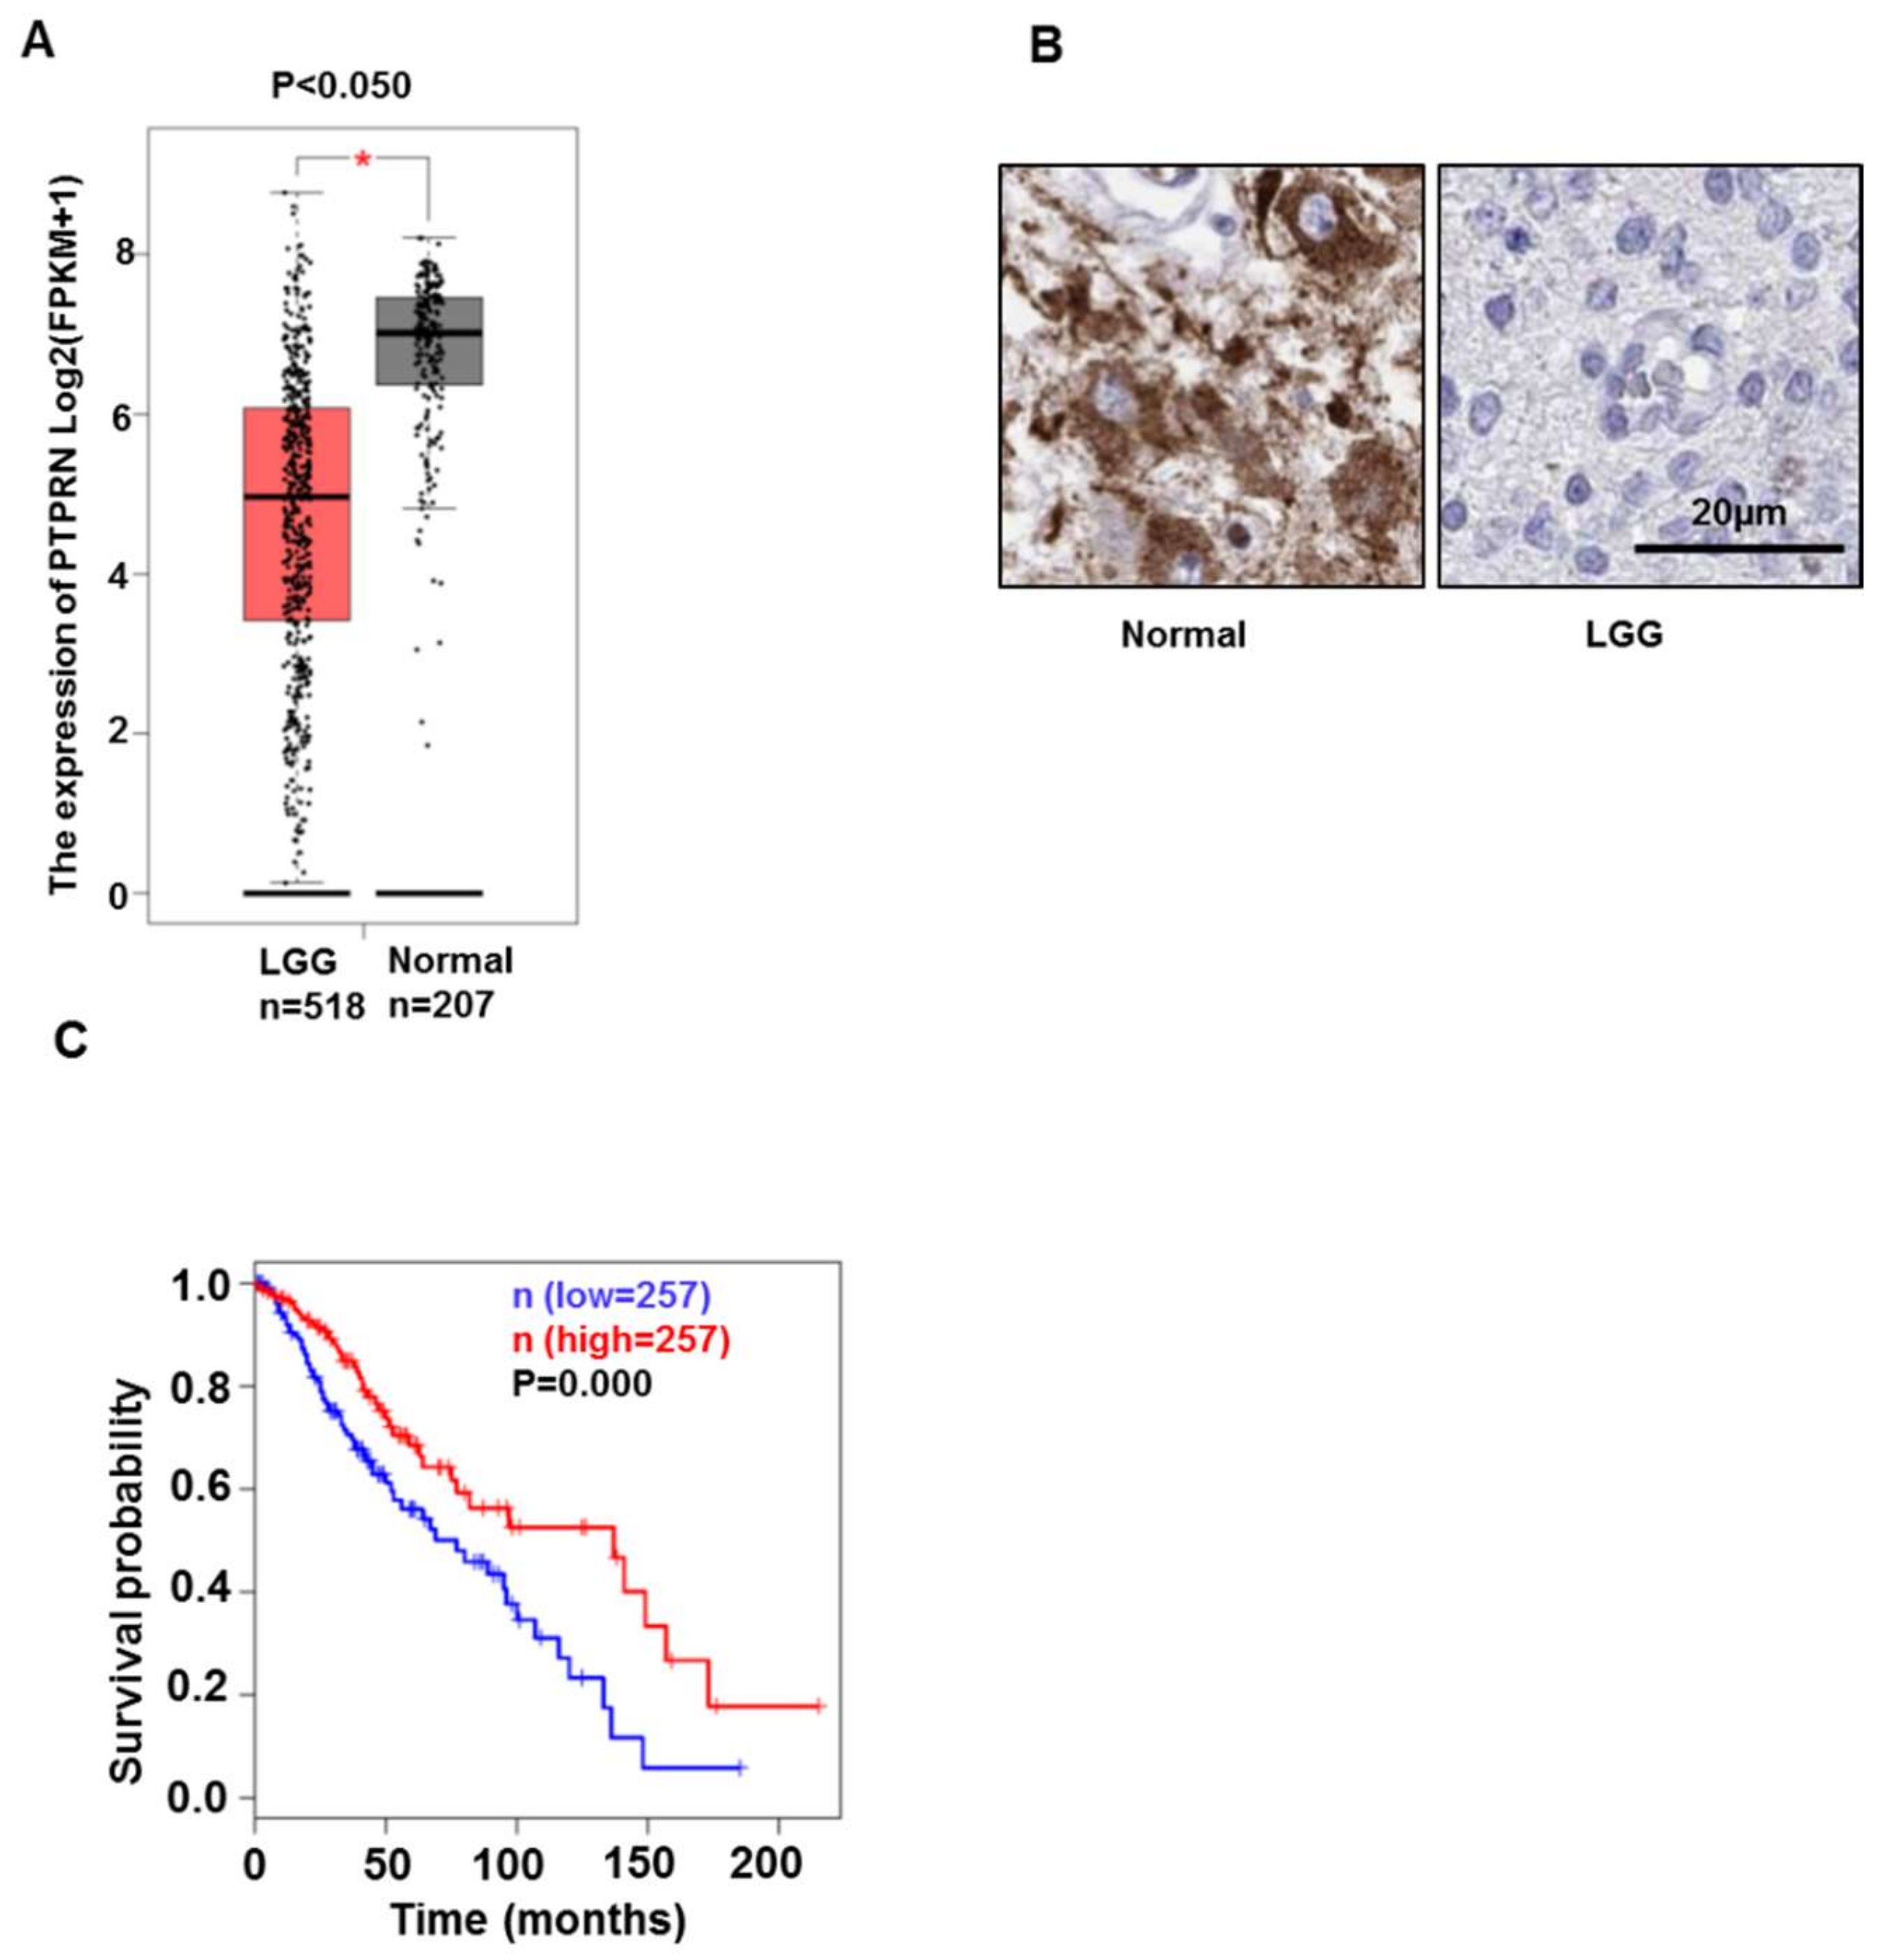
3.1. PTPRN Expression Levels and Prognostic Value in LGG
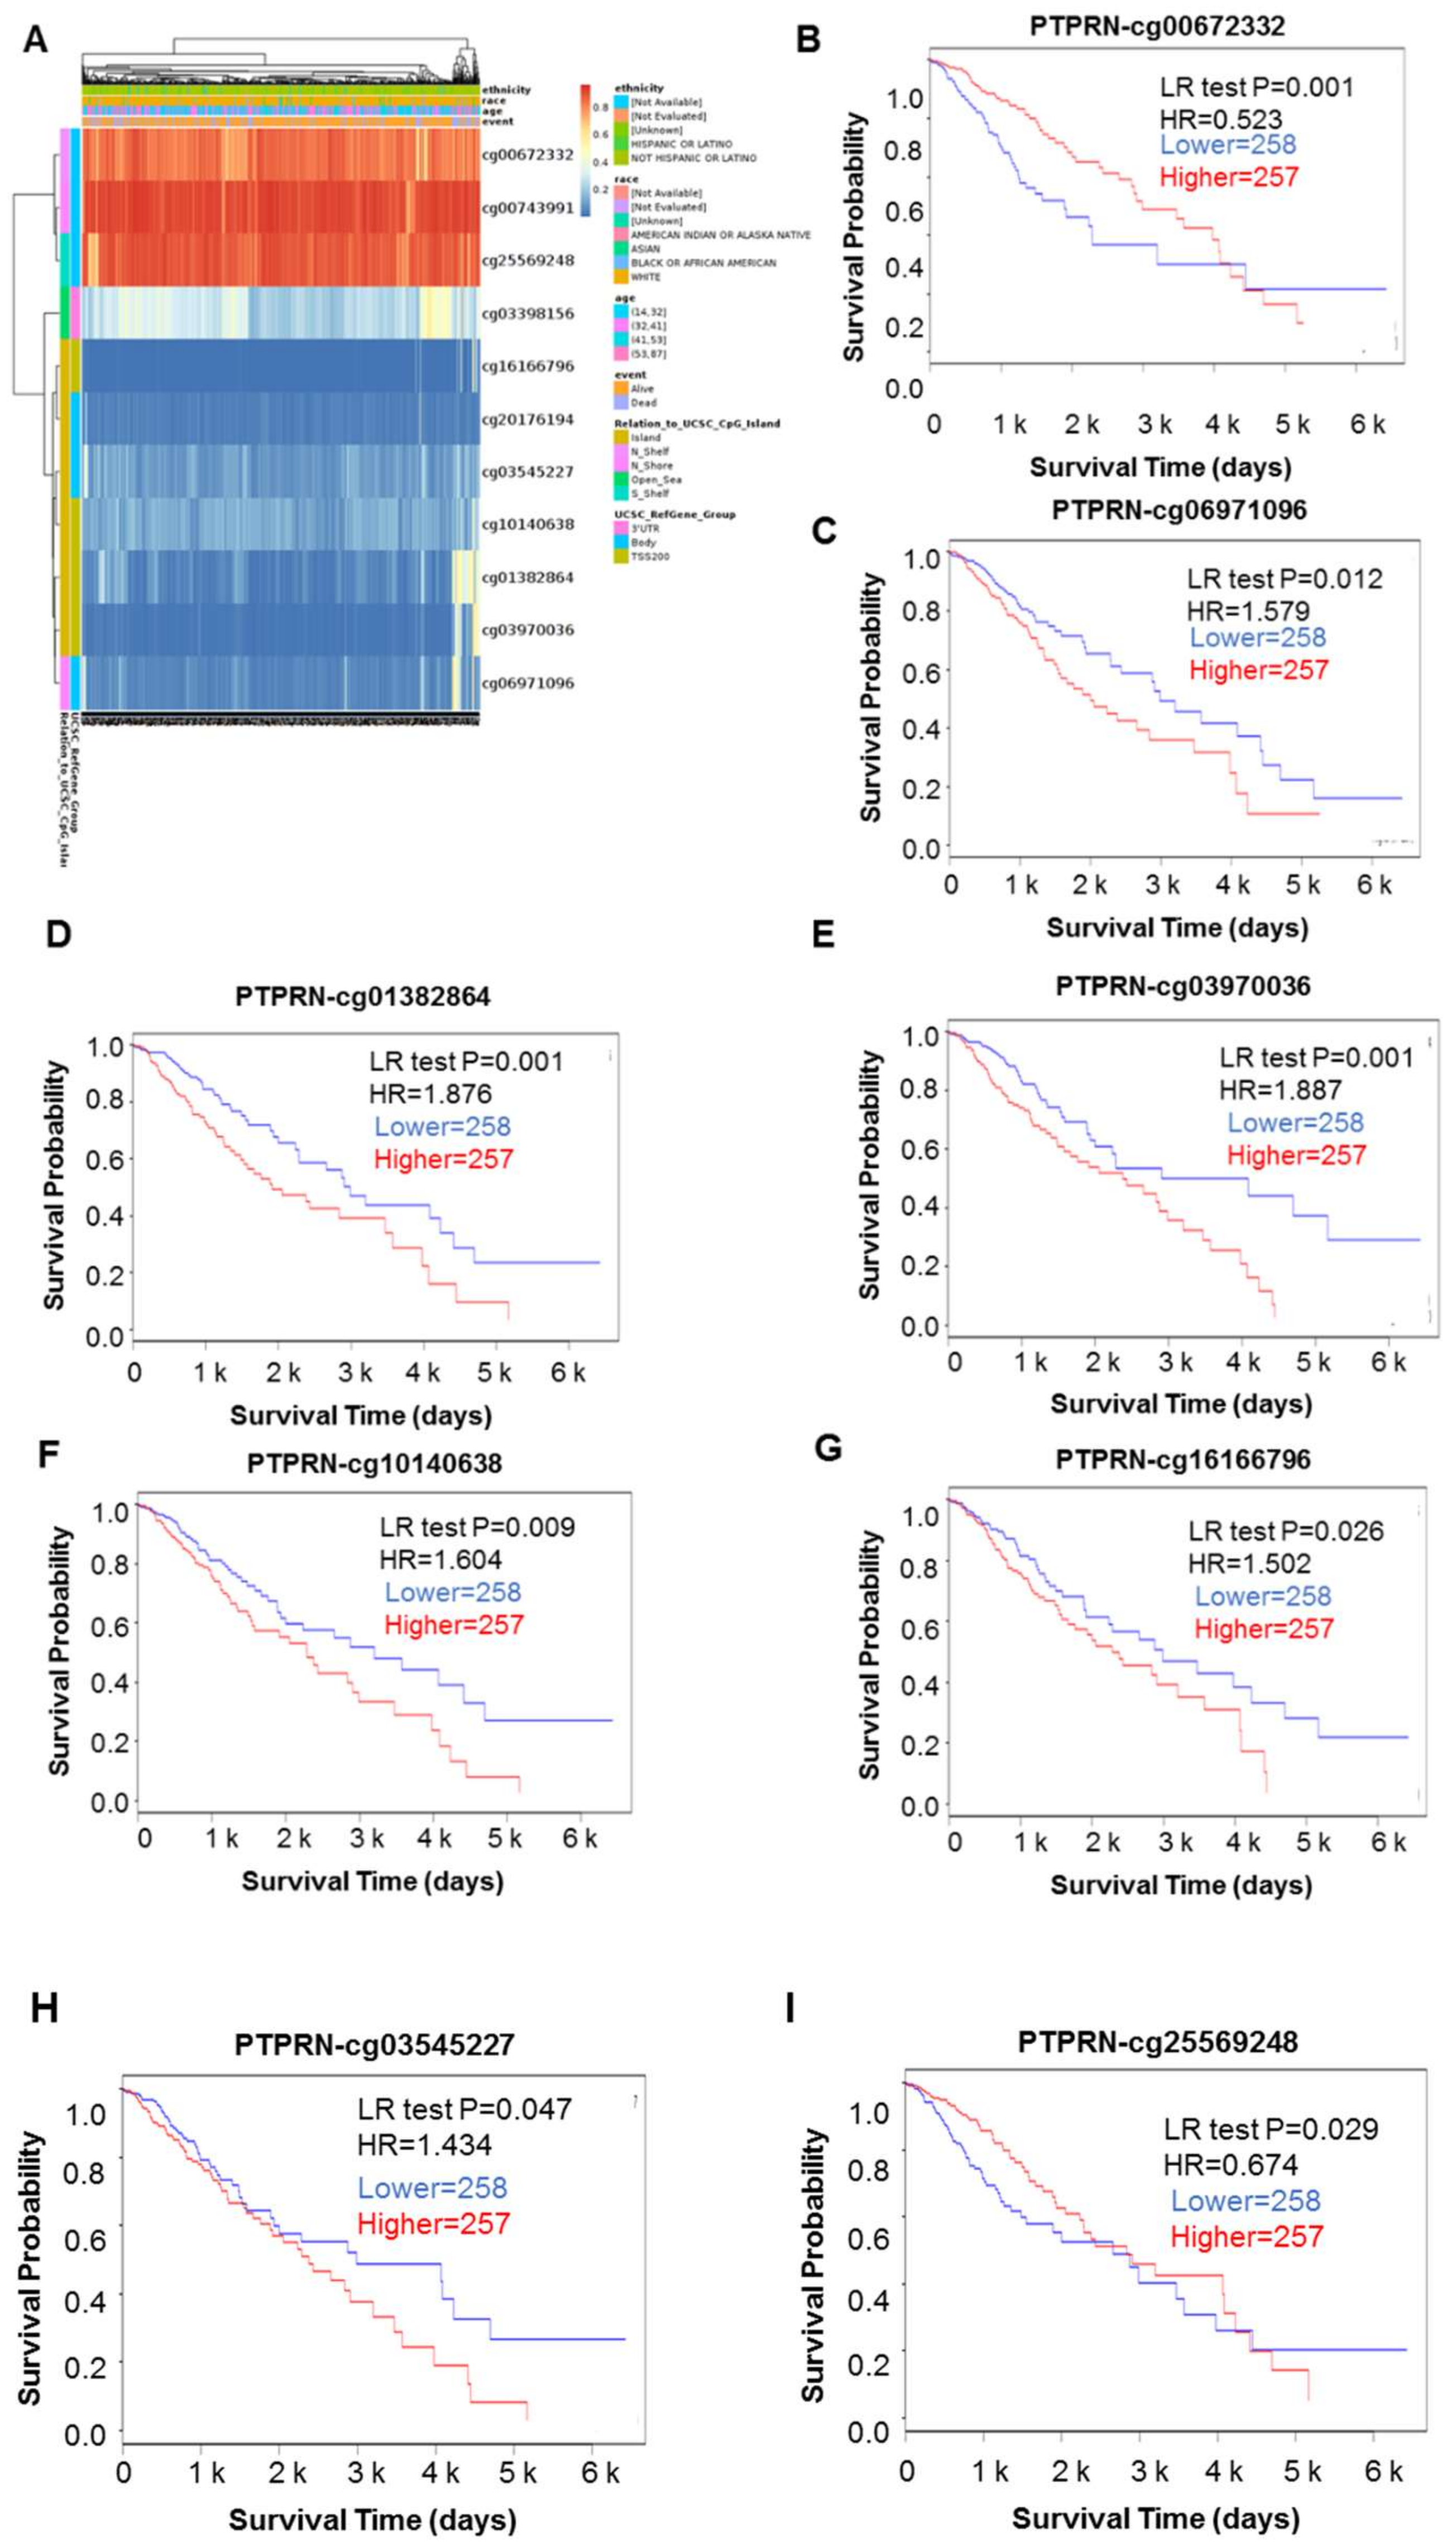
3.2. DNA Mythylation Analysis of the PTPRN Gene in LGG
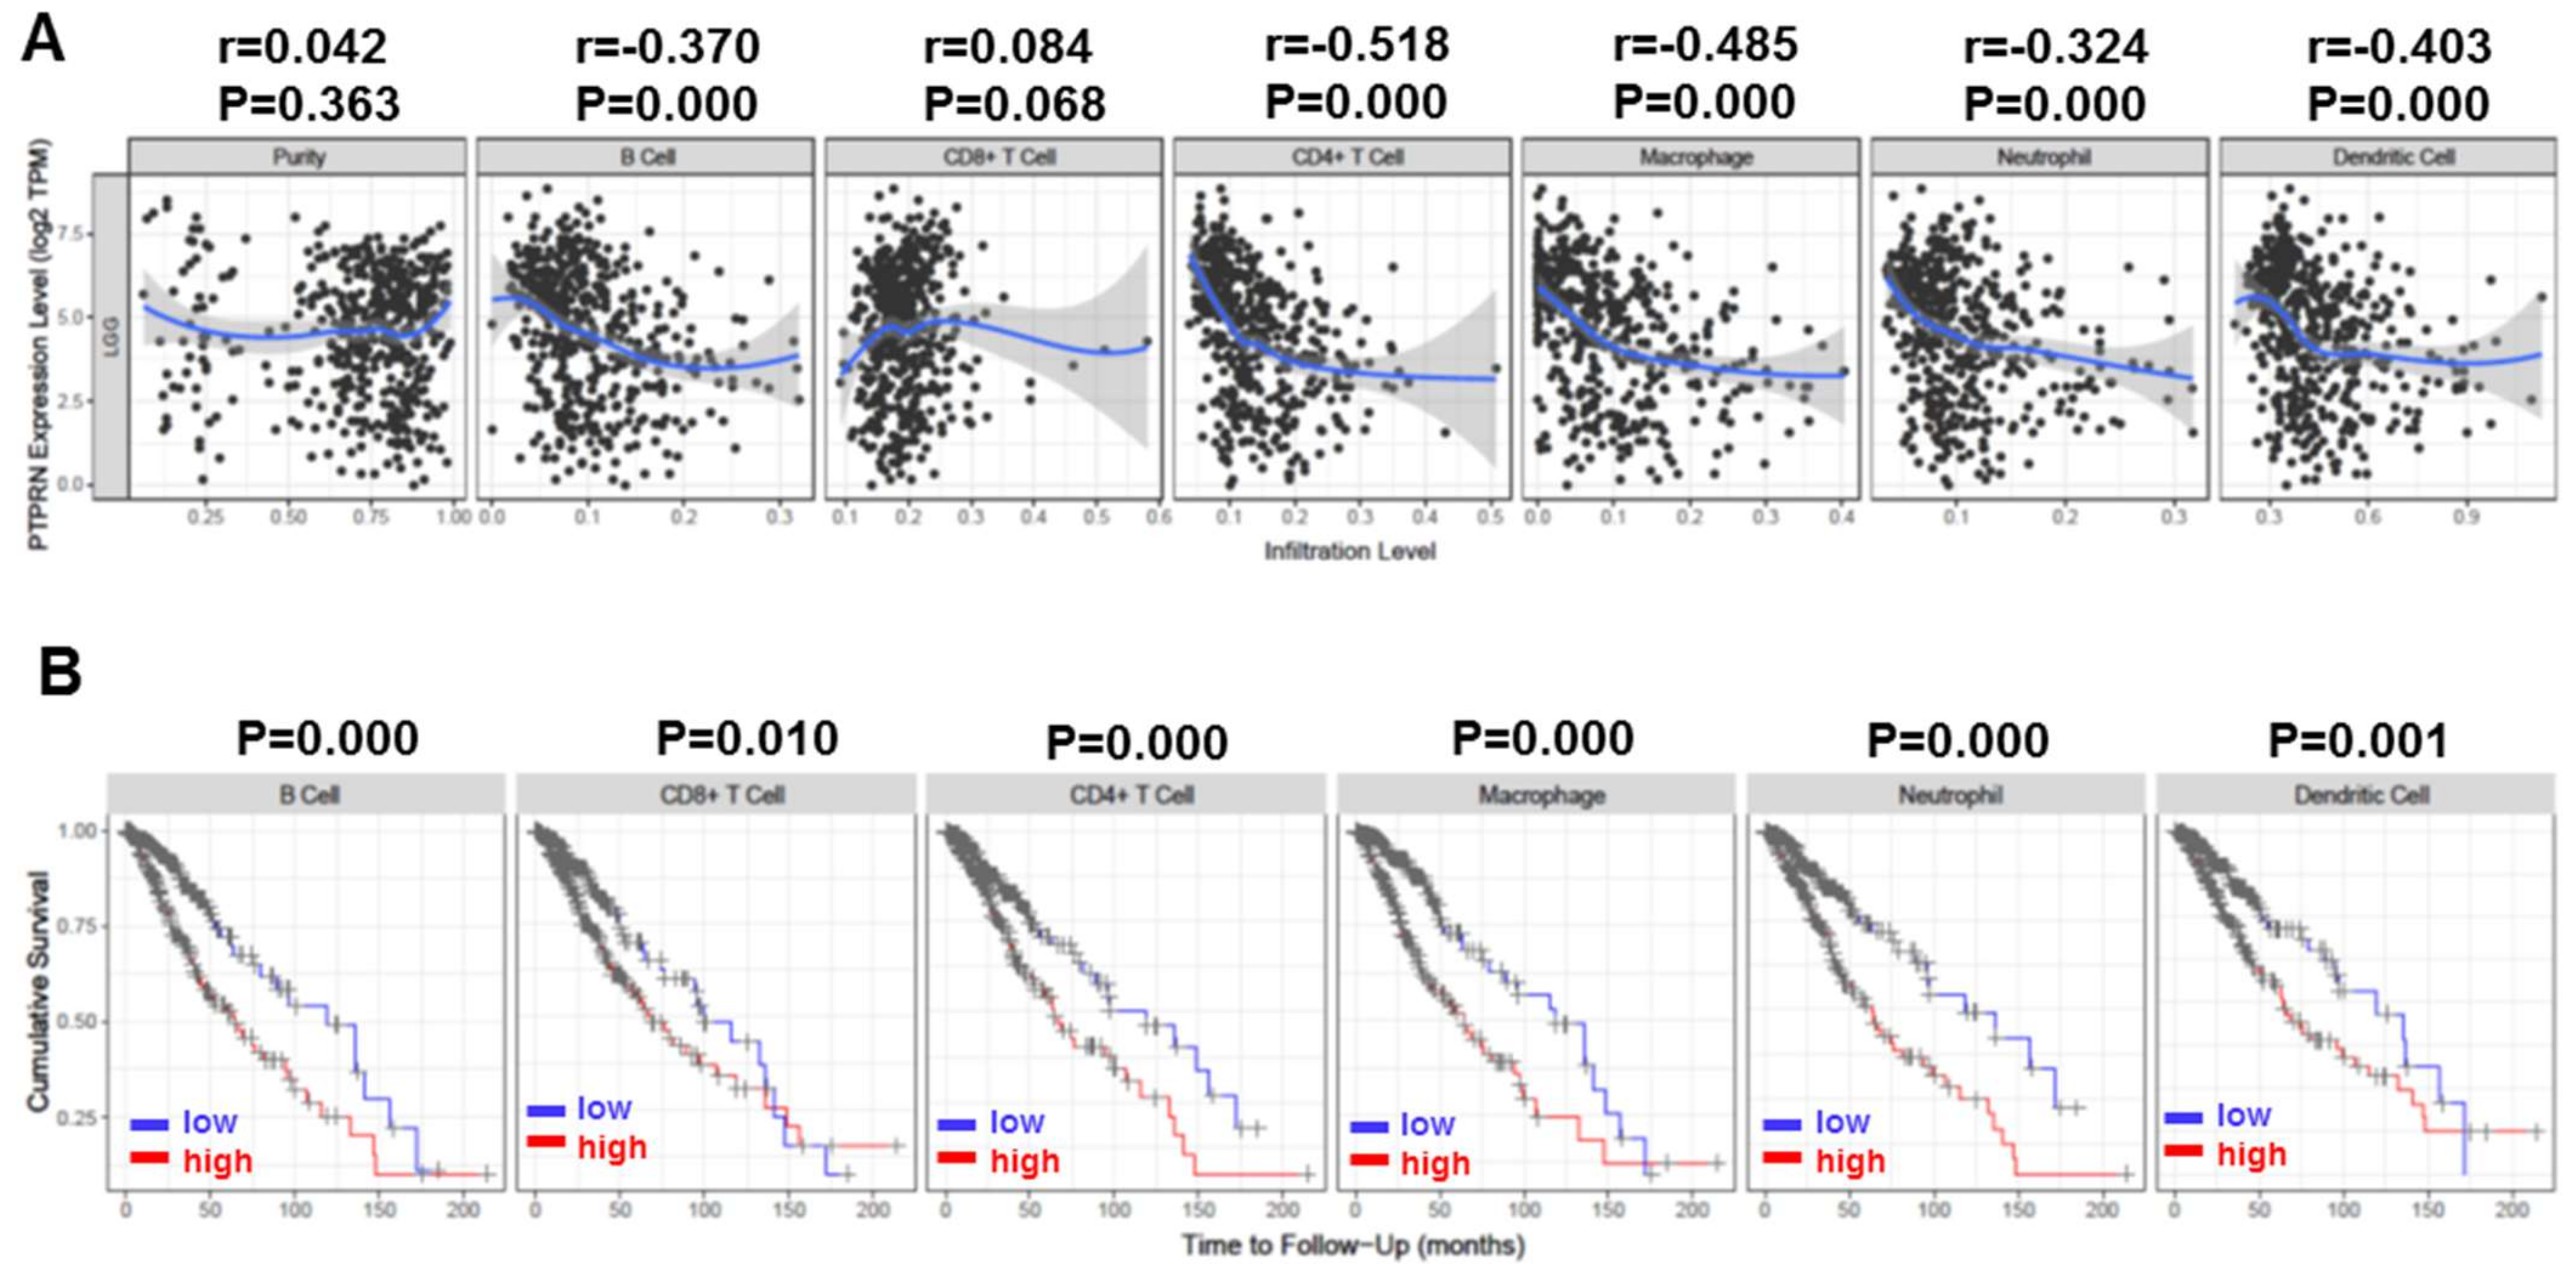
3.3. Correlation of PTPRN Expression with Immune Infiltration Level and Cumulative Survival in LGG
3.4. Gene Sets Enriched in PTPRN Expression Phenotype
4. Discussion
5. Conclusions
Author Contributions
Funding
Institutional Review Board Statement
Informed Consent Statement
Data Availability Statement
Conflicts of Interest
Abbreviations
References
- Louis, D.N.; Perry, A.; Wesseling, P.A.-O.; Brat, D.A.-O.; Cree, I.A.; Figarella-Branger, D.; Hawkins, C.; Ng, H.K.; Pfister, S.M.; Reifenberger, G.; et al. The 2021 WHO Classification of Tumors of the Central Nervous System: A summary. Neuro-Oncology 2021, 23, 1231–1251. [Google Scholar] [CrossRef] [PubMed]
- D’Amico, A.G.; Maugeri, G.; Vanella, L.; Pittalà, V.; Reglodi, D.; D’Agata, V. Multimodal Role of PACAP in Glioblastoma. Brain Sci. 2021, 11, 994. [Google Scholar] [CrossRef] [PubMed]
- Werner, J.M.; Schweinsberg, V.; Schroeter, M.; von Reutern, B.; Malter, M.P.; Schlaak, M.; Fink, G.R.; Mauch, C.; Galldiks, N. Successful Treatment of Myasthenia Gravis Following PD-1/CTLA-4 Combination Checkpoint Blockade in a Patient with Metastatic Melanoma. Front. Oncol. 2019, 9, 84. [Google Scholar] [CrossRef]
- Brahmer, J.R.; Govindan, R.; Anders, R.A.; Antonia, S.J.; Sagorsky, S.; Davies, M.J.; Dubinett, S.M.; Ferris, A.; Gandhi, L.; Garon, E.B.; et al. The Society for Immunotherapy of Cancer consensus statement on immunotherapy for the treatment of non-small cell lung cancer (NSCLC). J. Immunother. Cancer 2018, 6, 75. [Google Scholar] [CrossRef] [PubMed]
- Litak, J.; Grajkowska, W.; Szumiło, J.; Krukow, P.; Maciejewski, R.; Roliński, J.; Grochowski, C. PD-L1 Expression Correlated with p53 Expression in Pediatric Glioblastoma Multiforme. Brain Sci. 2021, 11, 262. [Google Scholar] [CrossRef]
- Bingle, L.; Brown, N.J.; Lewis, C.E. The role of tumour-associated macrophages in tumour progression: Implications for new anticancer therapies. J. Pathol. 2002, 196, 254–265. [Google Scholar] [CrossRef]
- Eckel-Passow, J.E.; Lachance, D.H.; Molinaro, A.M.; Walsh, K.M.; Decker, P.A.; Sicotte, H.; Pekmezci, M.; Rice, T.; Kosel, M.L.; Smirnov, I.V. Glioma groups based on 1p/19q, IDH, and TERT promoter mutations in tumors. N. Engl. J. Med. 2015, 372, 2499–2508. [Google Scholar] [CrossRef] [Green Version]
- Specchia, F.M.C.; Monticelli, M.; Zeppa, P.; Bianconi, A.; Zenga, F.; Altieri, R.; Pugliese, B.; Di Perna, G.; Cofano, F.; Tartara, F.; et al. Let Me See: Correlation between 5-ALA Fluorescence and Molecular Pathways in Glioblastoma: A Single Center Experience. Brain Sci. 2021, 11, 795. [Google Scholar] [CrossRef]
- Torkko, J.M.; Primo, M.E.; Dirkx, R.; Friedrich, A.; Viehrig, A.; Vergari, E.; Borgonovo, B.; Sönmez, A.; Wegbrod, C.; Lachnit, M.; et al. Stability of proICA512/IA-2 and Its Targeting to Insulin Secretory Granules Require β4-Sheet-Mediated Dimerization of Its Ectodomain in the Endoplasmic Reticulum. Mol. Cell. Biol. 2015, 35, 914–927. [Google Scholar] [CrossRef] [Green Version]
- Wang, D.; Tang, F.; Liu, X.; Fan, Y.S.; Zheng, Y.; Zhuang, H.; Chen, B.D.; Zhuo, J.; Wang, B. Expression and Tumor-Promoting Effect of Tyrosine Phosphatase Receptor Type N (PTPRN) in Human Glioma. Front. Oncol. 2021, 11, 676287. [Google Scholar] [CrossRef]
- Fu, Z.; Gilbert, E.R.; Liu, D.M. Regulation of Insulin Synthesis and Secretion and Pancreatic Beta-Cell Dysfunction in Diabetes. Curr. Diabetes Rev. 2013, 9, 25–53. [Google Scholar] [CrossRef] [PubMed]
- Bauerschlag, D.O.; Ammerpohl, O.; Brautigam, K.; Schem, C.; Lin, Q.; Weigel, M.T.; Hilpert, F.; Arnold, N.; Maass, N.; Meinhold-Heerlein, I.; et al. Progression-Free Survival in Ovarian Cancer Is Reflected in Epigenetic DNA Methylation Profiles. Oncology 2011, 80, 12–20. [Google Scholar] [CrossRef] [PubMed]
- Liang, H.; Xiao, J.; Zhou, Z.; Wu, J.; Ge, F.; Li, Z.; Zhang, H.; Sun, J.; Li, F.; Liu, R.; et al. Hypoxia induces miR-153 through the IRE1α-XBP1 pathway to fine tune the HIF1α/VEGFA axis in breast cancer angiogenesis. Oncogene 2018, 37, 1961–1975. [Google Scholar] [CrossRef] [PubMed] [Green Version]
- Shergalis, A.; Bankhead, A.; Luesakul, U.; Muangsin, N.; Neamati, N. Current Challenges and Opportunities in Treating Glioblastoma. Pharmacol. Rev. 2018, 70, 412–445. [Google Scholar] [CrossRef] [Green Version]
- Yin, W.; Tang, G.H.; Zhou, Q.W.; Cao, Y.D.; Li, H.X.; Fu, X.Y.; Wu, Z.P.; Jiang, X.J. Expression Profile Analysis Identifies a Novel Five-Gene Signature to Improve Prognosis Prediction of Glioblastoma. Front. Genet. 2019, 10, 419. [Google Scholar] [CrossRef]
- Zhangyuan, G.Y.; Yin, Y.; Zhang, W.J.; Yu, W.W.; Jin, K.P.; Wang, F.; Huang, R.Y.; Shen, H.Y.; Wang, X.C.; Sun, B.C. Prognostic Value of Phosphotyrosine Phosphatases in Hepatocellular Carcinoma. Cell. Physiol. Biochem. 2018, 46, 2335–2346. [Google Scholar] [CrossRef] [Green Version]
- Liu, J.; Lichtenberg, T.; Hoadley, K.A.; Poisson, L.M.; Lazar, A.J.; Cherniack, A.D.; Kovatich, A.J.; Benz, C.C.; Levine, D.A.; Lee, A.V.; et al. An Integrated TCGA Pan-Cancer Clinical Data Resource to Drive High-Quality Survival Outcome Analytics. Cell 2018, 173, 400–416. [Google Scholar] [CrossRef] [Green Version]
- Ceccarelli, M.; Barthel, F.P.; Malta, T.M.; Sabedot, T.S.; Salama, S.R.; Murray, B.A.; Morozova, O.; Newton, Y.; Radenbaugh, A.; Pagnotta, S.M.; et al. Molecular Profiling Reveals Biologically Discrete Subsets and Pathways of Progression in Diffuse Glioma. Cell 2016, 164, 550–563. [Google Scholar] [CrossRef] [Green Version]
- Anuraga, G.; Wang, W.-J.; Phan, N.N.; An Ton, N.T.; Ta, H.D.K.; Berenice Prayugo, F.; Minh Xuan, D.T.; Ku, S.-C.; Wu, Y.-F.; Andriani, V.; et al. Potential Prognostic Biomarkers of NIMA (Never in Mitosis, Gene A)-Related Kinase (NEK) Family Members in Breast Cancer. J. Pers. Med. 2021, 11, 1089. [Google Scholar] [CrossRef]
- Modhukur, V.; Iljasenko, T.; Metsalu, T.; Lokk, K.; Laisk-Podar, T.; Vilo, J. MethSurv: A web tool to perform multivariable survival analysis using DNA methylation data. Epigenomics 2018, 10, 277–288. [Google Scholar] [CrossRef] [Green Version]
- Zhang, Y.J.; Yu, C.R. Prognostic characterization of OAS1/OAS2/OAS3/OASL in breast cancer. BMC Cancer 2020, 20, 575. [Google Scholar] [CrossRef] [PubMed]
- Li, T.W.; Fan, J.Y.; Wang, B.B.; Traugh, N.; Chen, Q.M.; Liu, J.S.; Li, B.; Liu, X.S. TIMER: A Web Server for Comprehensive Analysis of Tumor-Infiltrating Immune Cells. Cancer Res. 2017, 77, E108–E110. [Google Scholar] [CrossRef] [PubMed] [Green Version]
- Subramanian, A.; Kuehn, H.; Gould, J.; Tamayo, P.; Mesirov, J.P. GSEA-P: A desktop application for Gene Set Enrichment Analysis. Bioinformatics 2007, 23, 3251–3253. [Google Scholar] [CrossRef] [PubMed]
- Harashima, S.-I.; Horiuchi, T.; Wang, Y.; Notkins, A.L.; Seino, Y.; Inagaki, N. Sorting nexin 19 regulates the number of dense core vesicles in pancreatic β-cells. J. Diabetes Investig. 2012, 3, 52–61. [Google Scholar] [CrossRef] [Green Version]
- Kawasaki, E.; Eisenbarth, G.S.; Wasmeier, C.; Hutton, J.C. Autoantibodies to protein tyrosine phosphatase-like proteins in type I diabetes—Overlapping specificities to phogrin and ICA512/IA-2. Diabetes 1996, 45, 1344–1349. [Google Scholar] [CrossRef]
- Hermel, J.-M.; Dirkx, R.; Solimena, M. Post-translational modifications of ICA512, a receptor tyrosine phosphatase-like protein of secretory granules. Eur. J. Neurosci. 1999, 11, 2609–2620. [Google Scholar] [CrossRef]
- Zhu, X.P.; Pan, S.; Li, R.; Chen, Z.B.; Xie, X.Y.; Han, D.Q.; Lv, S.Q.; Huang, Y.K. Novel Biomarker Genes for Prognosis of Survival and Treatment of Glioma. Front. Oncol. 2021, 11, 49. [Google Scholar] [CrossRef]


| Characteristics | Total | HR(95% CI) | p Value | |
|---|---|---|---|---|
| Age (≤40 vs. >40) | 527 | 3.245 (2.039–5.164) |  | <0.001 |
| WHO grade (G2 vs. G3) | 466 | 2.163 (1.355–3.450) | 0.001 | |
| Histological type (Astrocytoma vs. Oligodendroglioma) | 527 | 0.988 (0.624–1.564) | 0.958 | |
| IDH status (WT vs. Mut) | 524 | 0.391 (0.241–0.635) | <0.001 | |
| 1p/19q codeletion (codel vs. non-codel) | 527 | 1.731 (0.924–3.241) | 0.087 | |
| Primary therapy outcome (PD&SD vs. PR&CR) | 457 | 0.254 (0.134–0.481) | <0.001 | |
| PTPRN (High vs. Low) | 527 | 0.872 (0.781–0.974) | 0.016 |
| Gene-CpG | HR | LR Test p-Value |
|---|---|---|
| PTPRN-Body-N_Shelf-cg00672332 | 0.523 | 0.000 * |
| PTPRN-Body-N_Shore-cg00743991 | 0.817 | 0.260 |
| PTPRN-Body-N_Shore-cg06971096 | 1.579 | 0.012 * |
| PTPRN-TSS200-Island-cg01382864 | 1.876 | 0.001 * |
| PTPRN-TSS200-Island-cg03970036 | 1.887 | 0.001 * |
| PTPRN-TSS200-Island-cg10140638 | 1.604 | 0.009 * |
| PTPRN-TSS200-Island-cg16166796 | 1.502 | 0.026 * |
| PTPRN-Body-Island-cg03545227 | 1.434 | 0.047 * |
| PTPRN-Body-Island-cg20176194 | 1.001 | 1.000 |
| PTPRN-3’UTR-Open_Sea-cg03398156 | 0.873 | 0.450 |
| PTPRN-Body-S_Shelf-cg25569248 | 0.674 | 0.029 * |
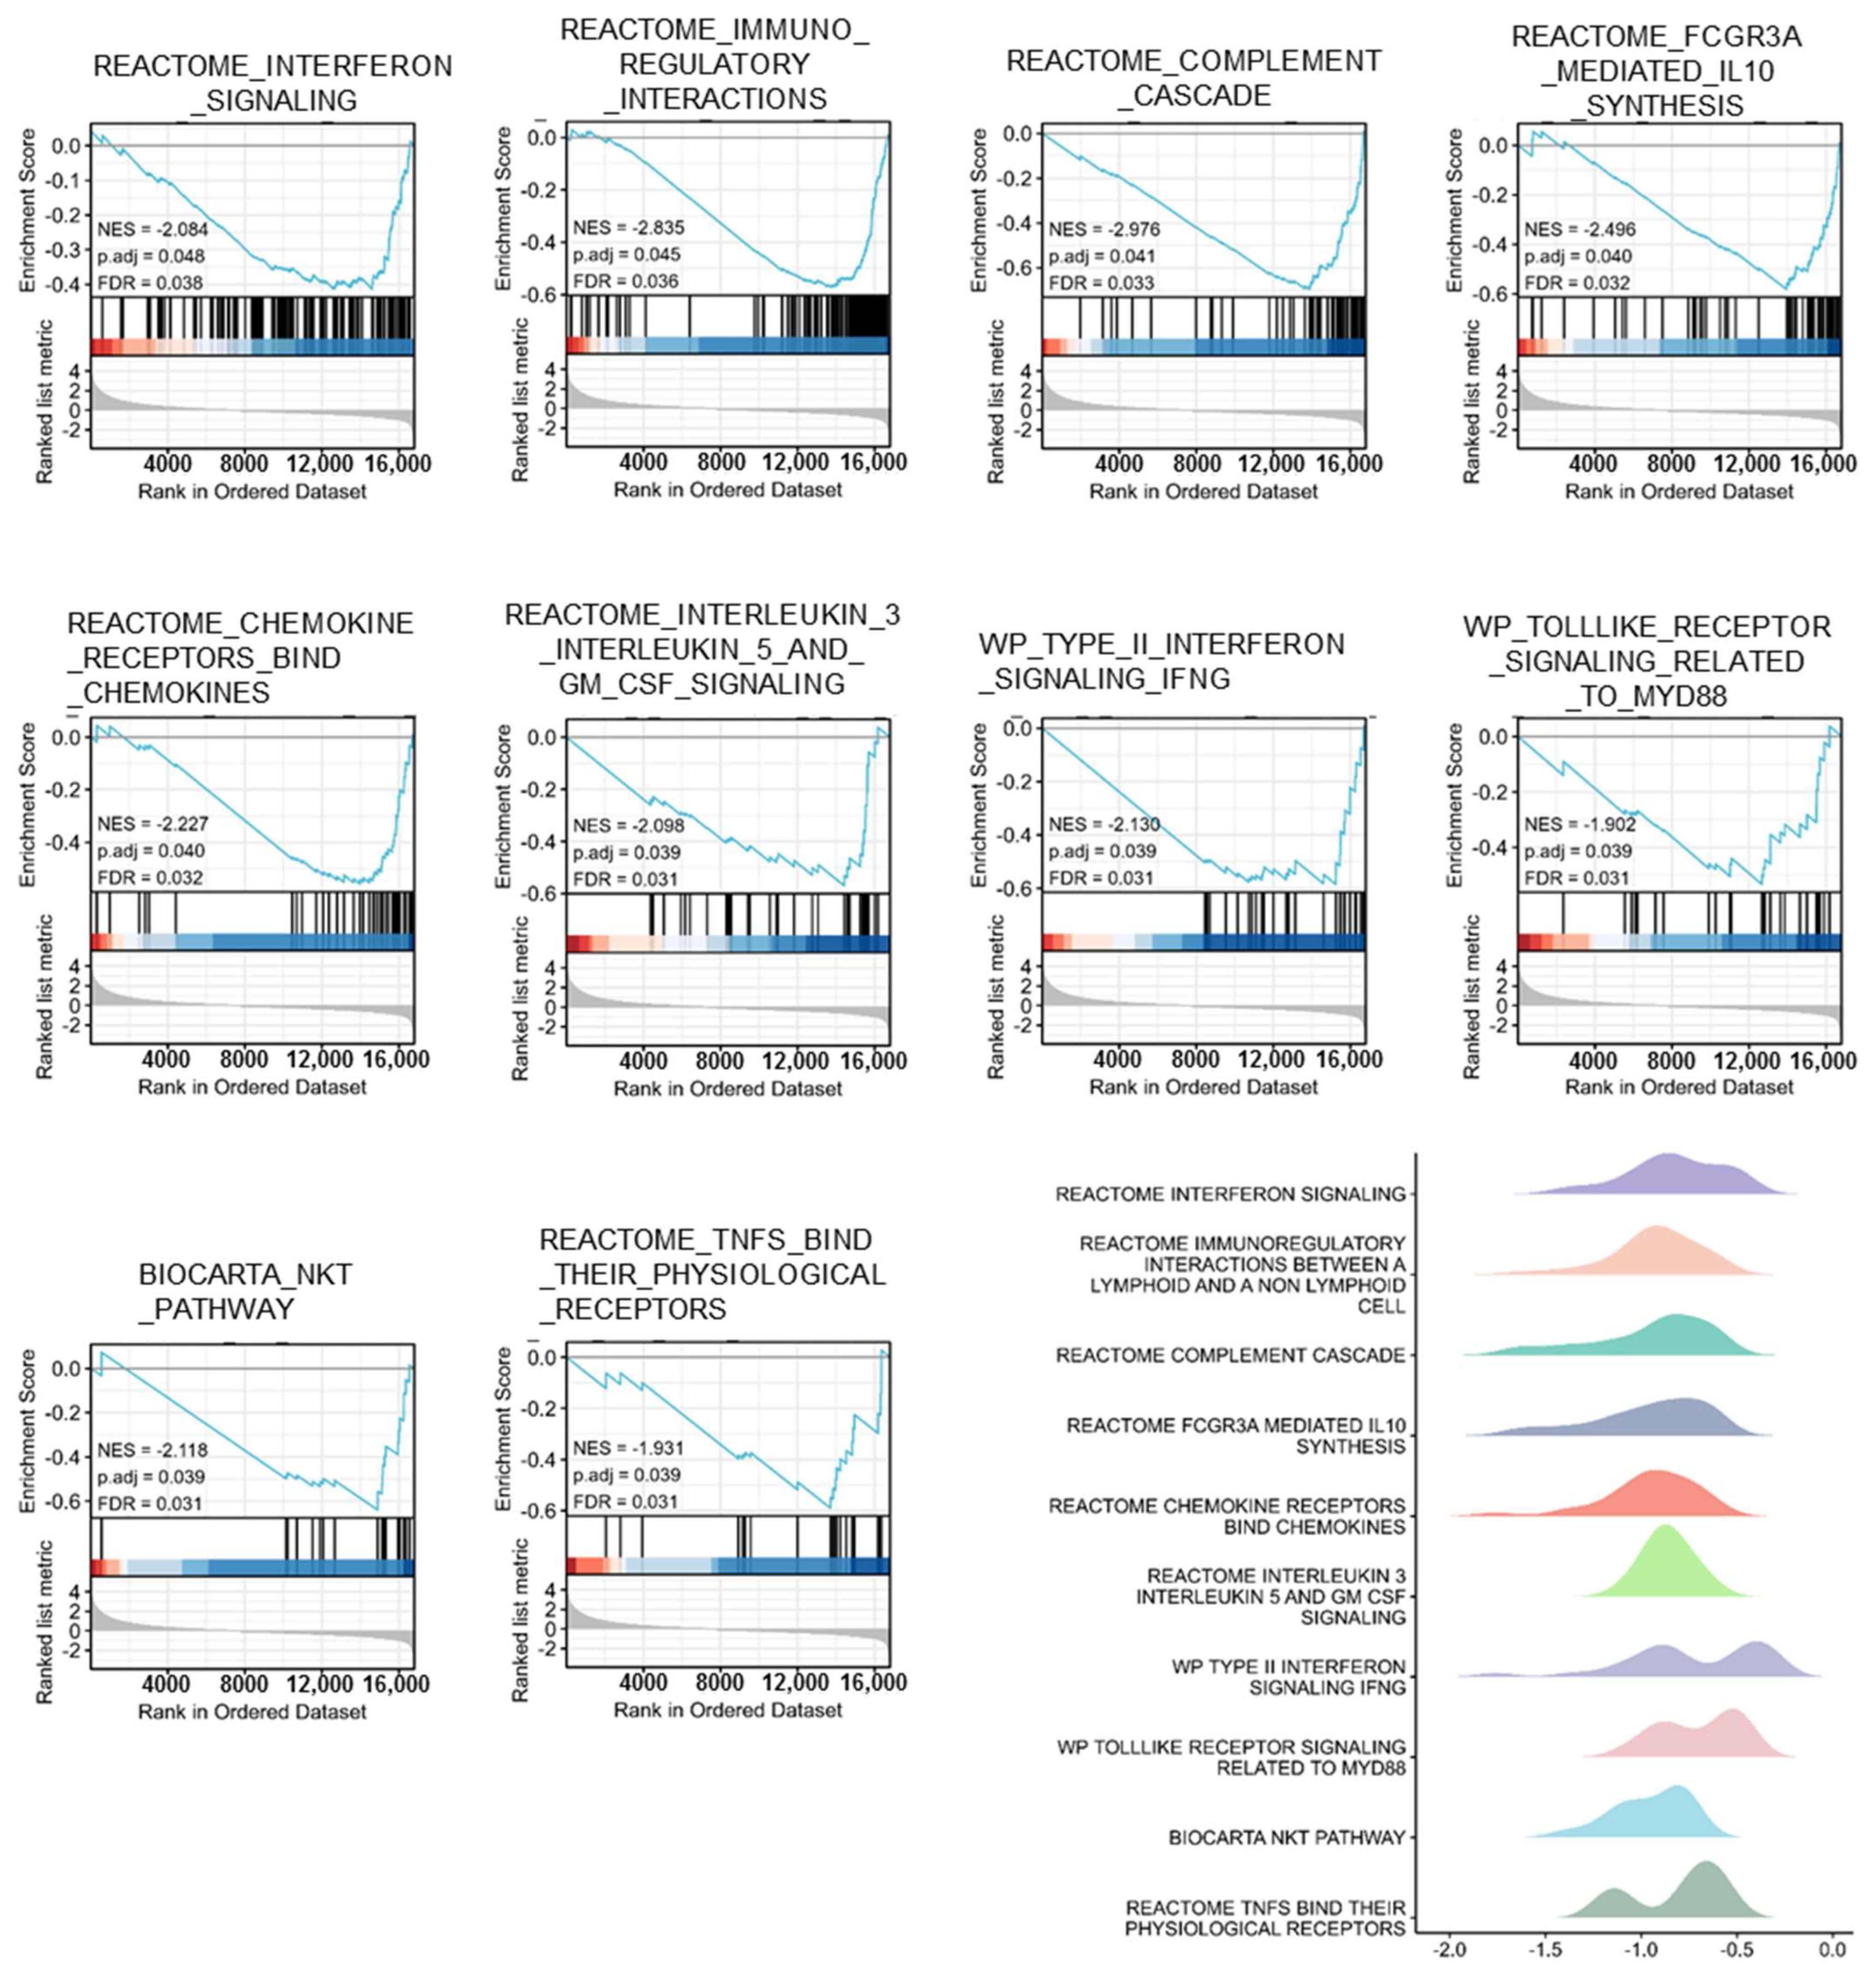
| ID | NES | p. Adjust | FDR |
|---|---|---|---|
| REACTOME_INTERFERON_SIGNALING | −2.084 | 0.048 | 0.038 |
| REACTOME_IMMUNOREGULATORY_INTERACTIONS_BETWEEN_A_LYMPHOID_AND_A_NON_LYMPHOID_CELL | −2.835 | 0.045 | 0.036 |
| REACTOME_COMPLEMENT_CASCADE | −2.976 | 0.041 | 0.033 |
| REACTOME_FCGR3A_MEDIATED_IL10_SYNTHESIS | −2.496 | 0.04 | 0.032 |
| REACTOME_CHEMOKINE_RECEPTORS_BIND_CHEMOKINES | −2.227 | 0.04 | 0.032 |
| REACTOME_INTERLEUKIN_3_INTERLEUKIN_5_AND_GM_CSF_SIGNALING | −2.098 | 0.039 | 0.031 |
| WP_TYPE_II_INTERFERON_SIGNALING_IFNG | −2.13 | 0.039 | 0.031 |
| WP_TOLLLIKE_RECEPTOR_SIGNALING_RELATED_TO_MYD88 | −1.902 | 0.039 | 0.031 |
| BIOCARTA_NKT_PATHWAY | −2.118 | 0.039 | 0.031 |
| REACTOME_TNFS_BIND_THEIR_PHYSIOLOGICAL_RECEPTORS | −1.931 | 0.039 | 0.031 |
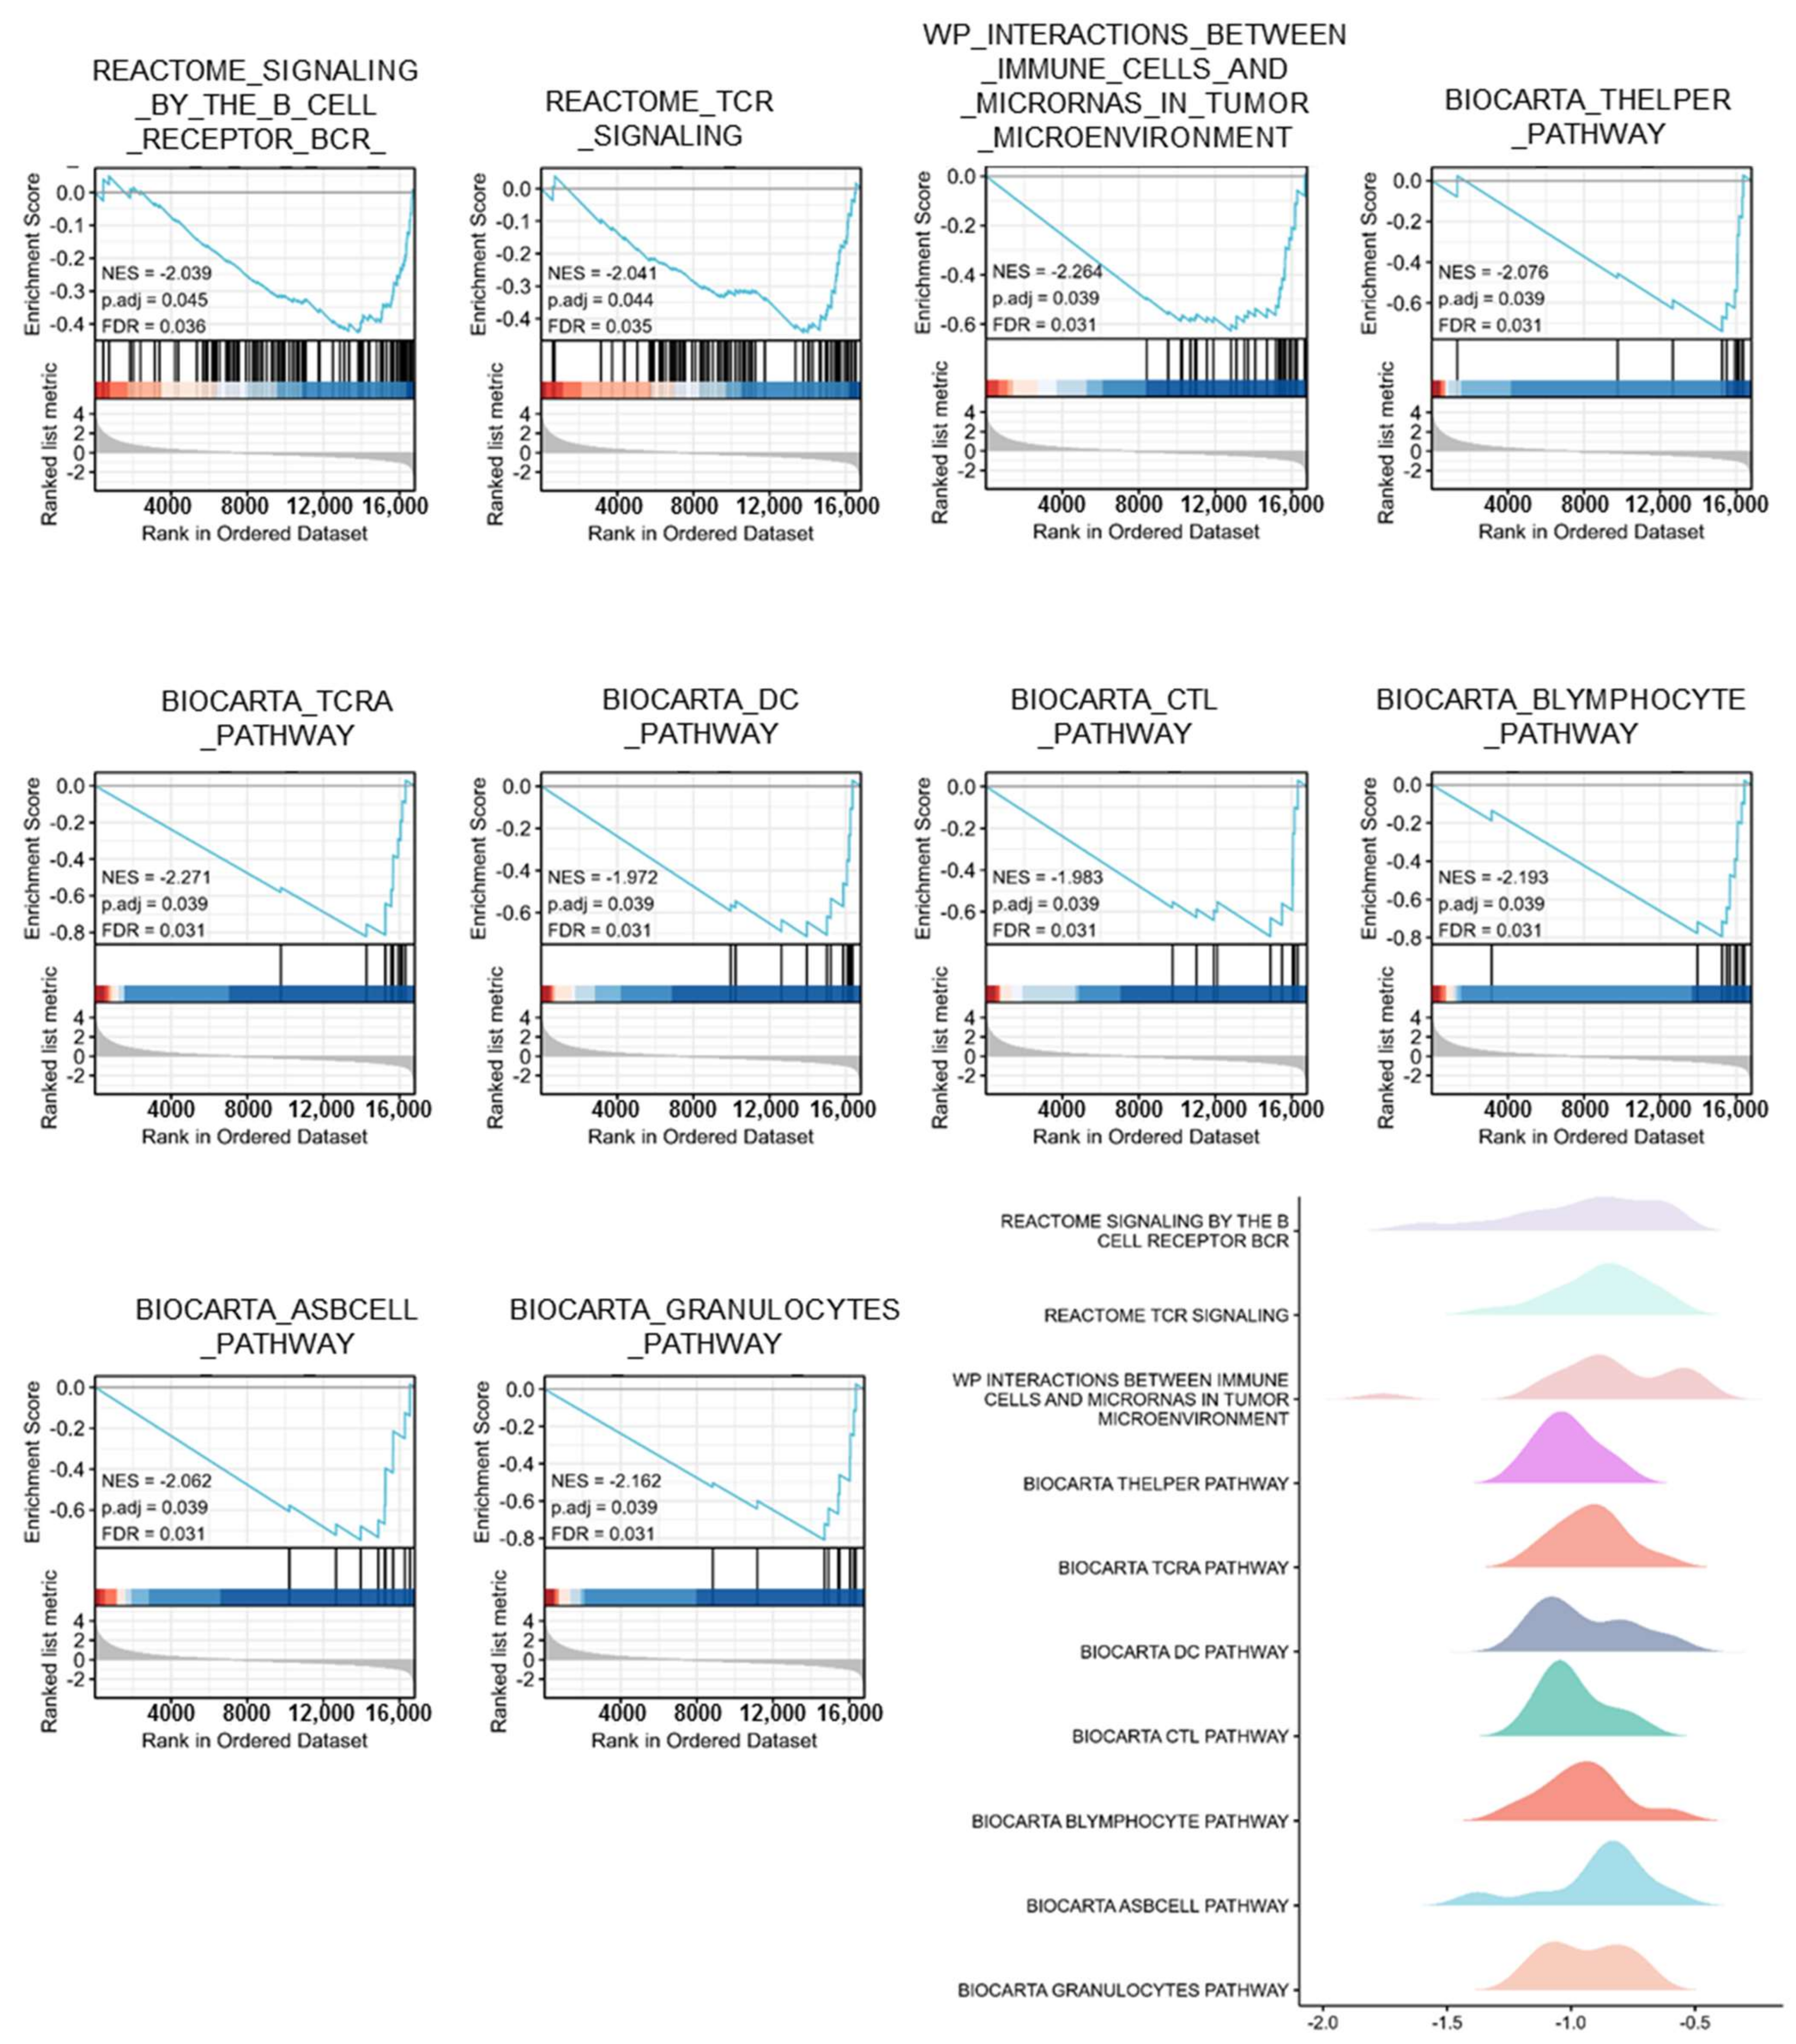
| ID | NES | p. Adjust | FDR |
|---|---|---|---|
| REACTOME_SIGNALING_BY_THE_B_CELL_RECEPTOR_BCR_ | −2.039 | 0.045 | 0.036 |
| REACTOME_TCR_SIGNALING | −2.041 | 0.044 | 0.035 |
| WP_INTERACTIONS_BETWEEN_IMMUNE_CELLS_AND_MICRORNAS_IN_TUMOR_MICROENVIRONMENT | −2.264 | 0.039 | 0.031 |
| BIOCARTA_THELPER_PATHWAY | −2.076 | 0.039 | 0.031 |
| BIOCARTA_TCRA_PATHWAY | −2.271 | 0.039 | 0.031 |
| BIOCARTA_DC_PATHWAY | −1.972 | 0.039 | 0.031 |
| BIOCARTA_CTL_PATHWAY | −1.983 | 0.039 | 0.031 |
| BIOCARTA_BLYMPHOCYTE_PATHWAY | −2.193 | 0.039 | 0.031 |
| BIOCARTA_ASBCELL_PATHWAY | −2.062 | 0.039 | 0.031 |
| BIOCARTA_GRANULOCYTES_PATHWAY | −2.162 | 0.039 | 0.031 |
Publisher’s Note: MDPI stays neutral with regard to jurisdictional claims in published maps and institutional affiliations. |
© 2022 by the authors. Licensee MDPI, Basel, Switzerland. This article is an open access article distributed under the terms and conditions of the Creative Commons Attribution (CC BY) license (https://creativecommons.org/licenses/by/4.0/).
Share and Cite
Li, P.; Chen, F.; Yao, C.; Zhu, K.; Zhang, B.; Zheng, Z. PTPRN Serves as a Prognostic Biomarker and Correlated with Immune Infiltrates in Low Grade Glioma. Brain Sci. 2022, 12, 763. https://doi.org/10.3390/brainsci12060763
Li P, Chen F, Yao C, Zhu K, Zhang B, Zheng Z. PTPRN Serves as a Prognostic Biomarker and Correlated with Immune Infiltrates in Low Grade Glioma. Brain Sciences. 2022; 12(6):763. https://doi.org/10.3390/brainsci12060763
Chicago/Turabian StyleLi, Peng, Fanfan Chen, Chen Yao, Kezhou Zhu, Bei Zhang, and Zelong Zheng. 2022. "PTPRN Serves as a Prognostic Biomarker and Correlated with Immune Infiltrates in Low Grade Glioma" Brain Sciences 12, no. 6: 763. https://doi.org/10.3390/brainsci12060763