
Lower Posterior Cingulate N-Acetylaspartate to Creatine Level in Early Detection of Biologically Defined Alzheimer’s Disease


Abstract
:1. Introduction
2. Materials and Methods
2.1. Subjects
2.2. Biomarker Group Classifications
2.3. PET Acquisition and Analysis
2.4. MRI Acquisition and Analysis
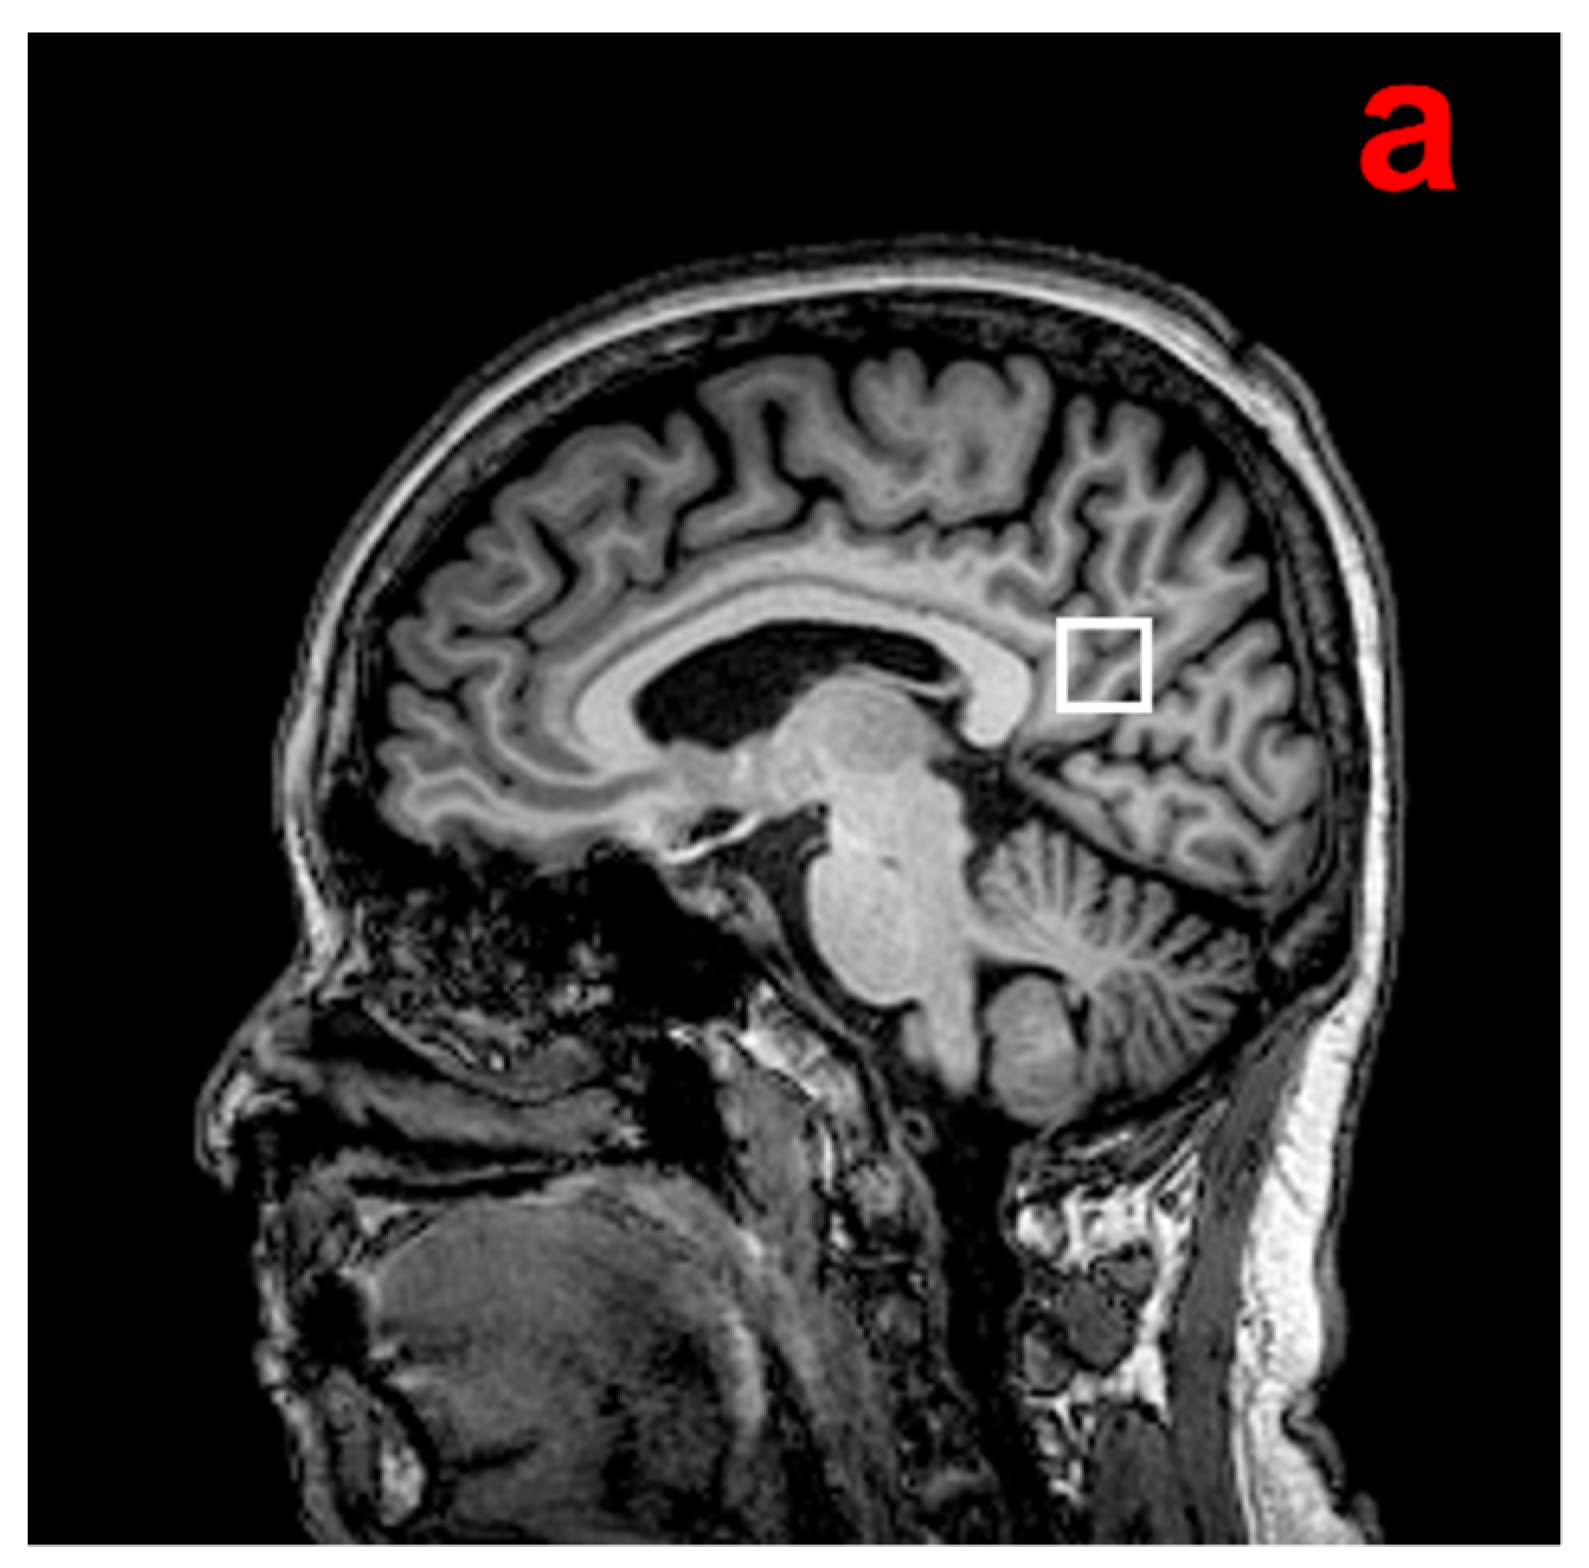
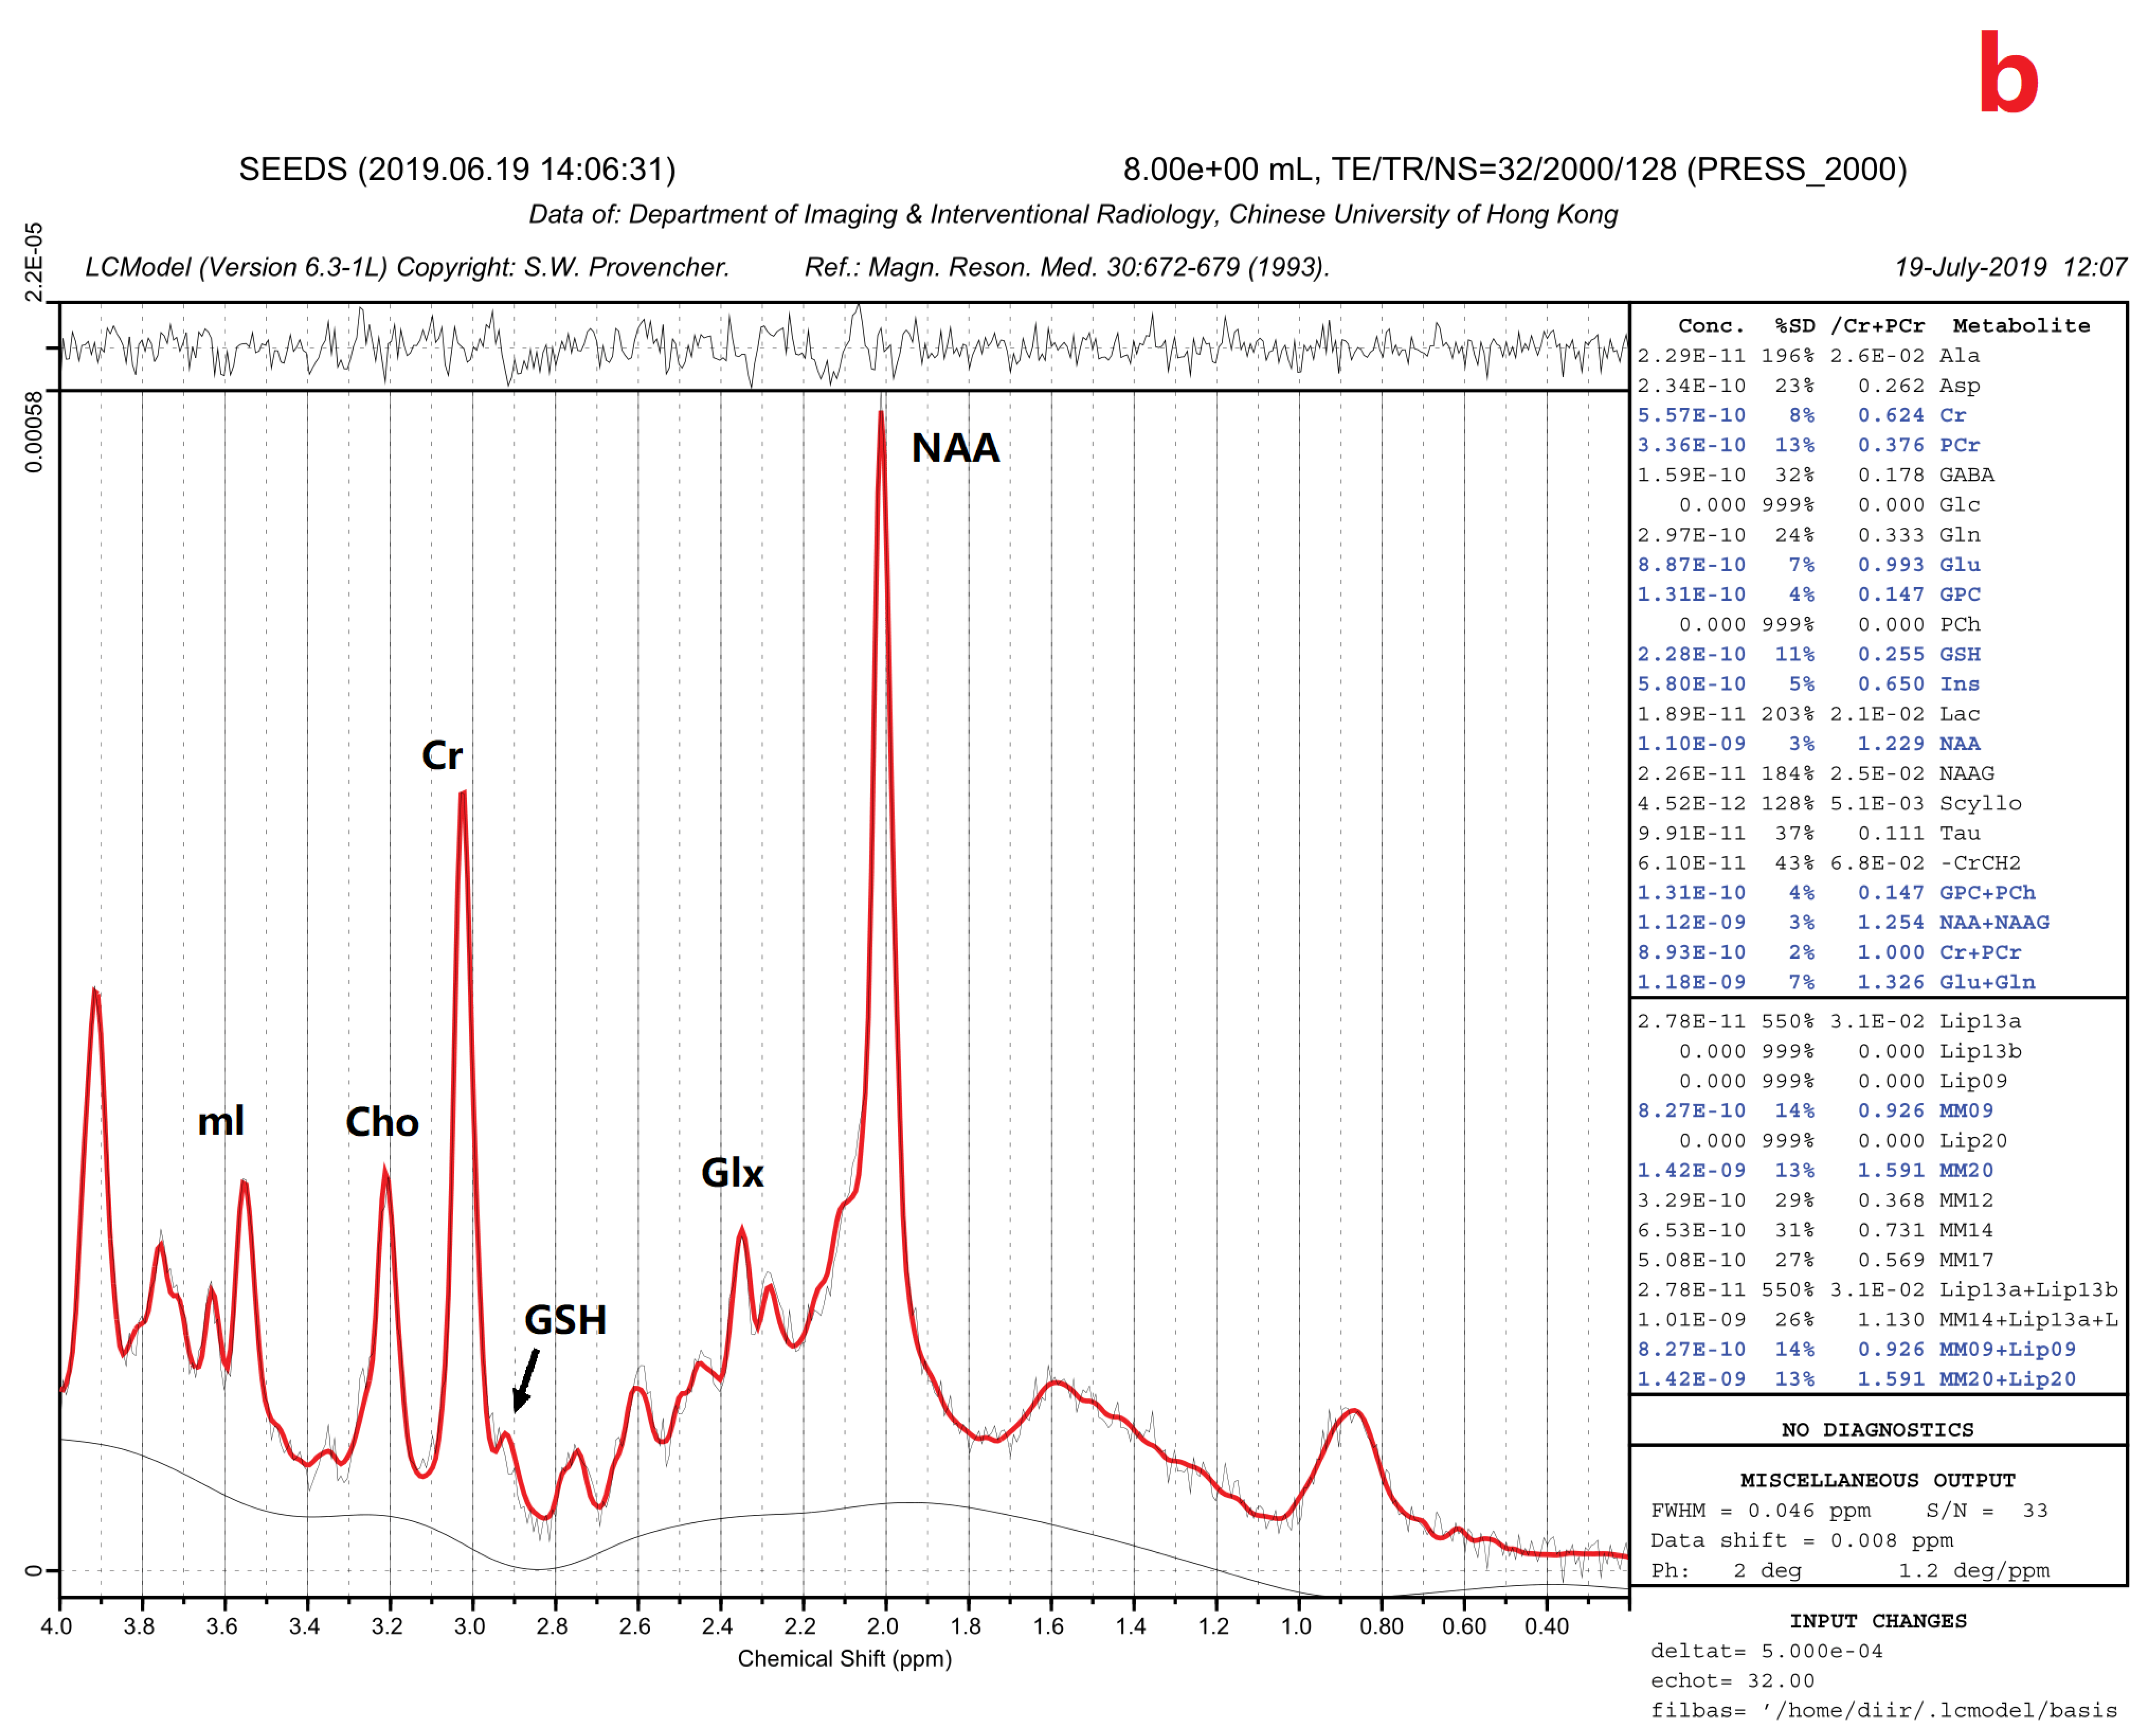
2.5. 1H-MRS Acquisition and Analysis
2.6. Statistical Analysis
3. Results
3.1. Demographics
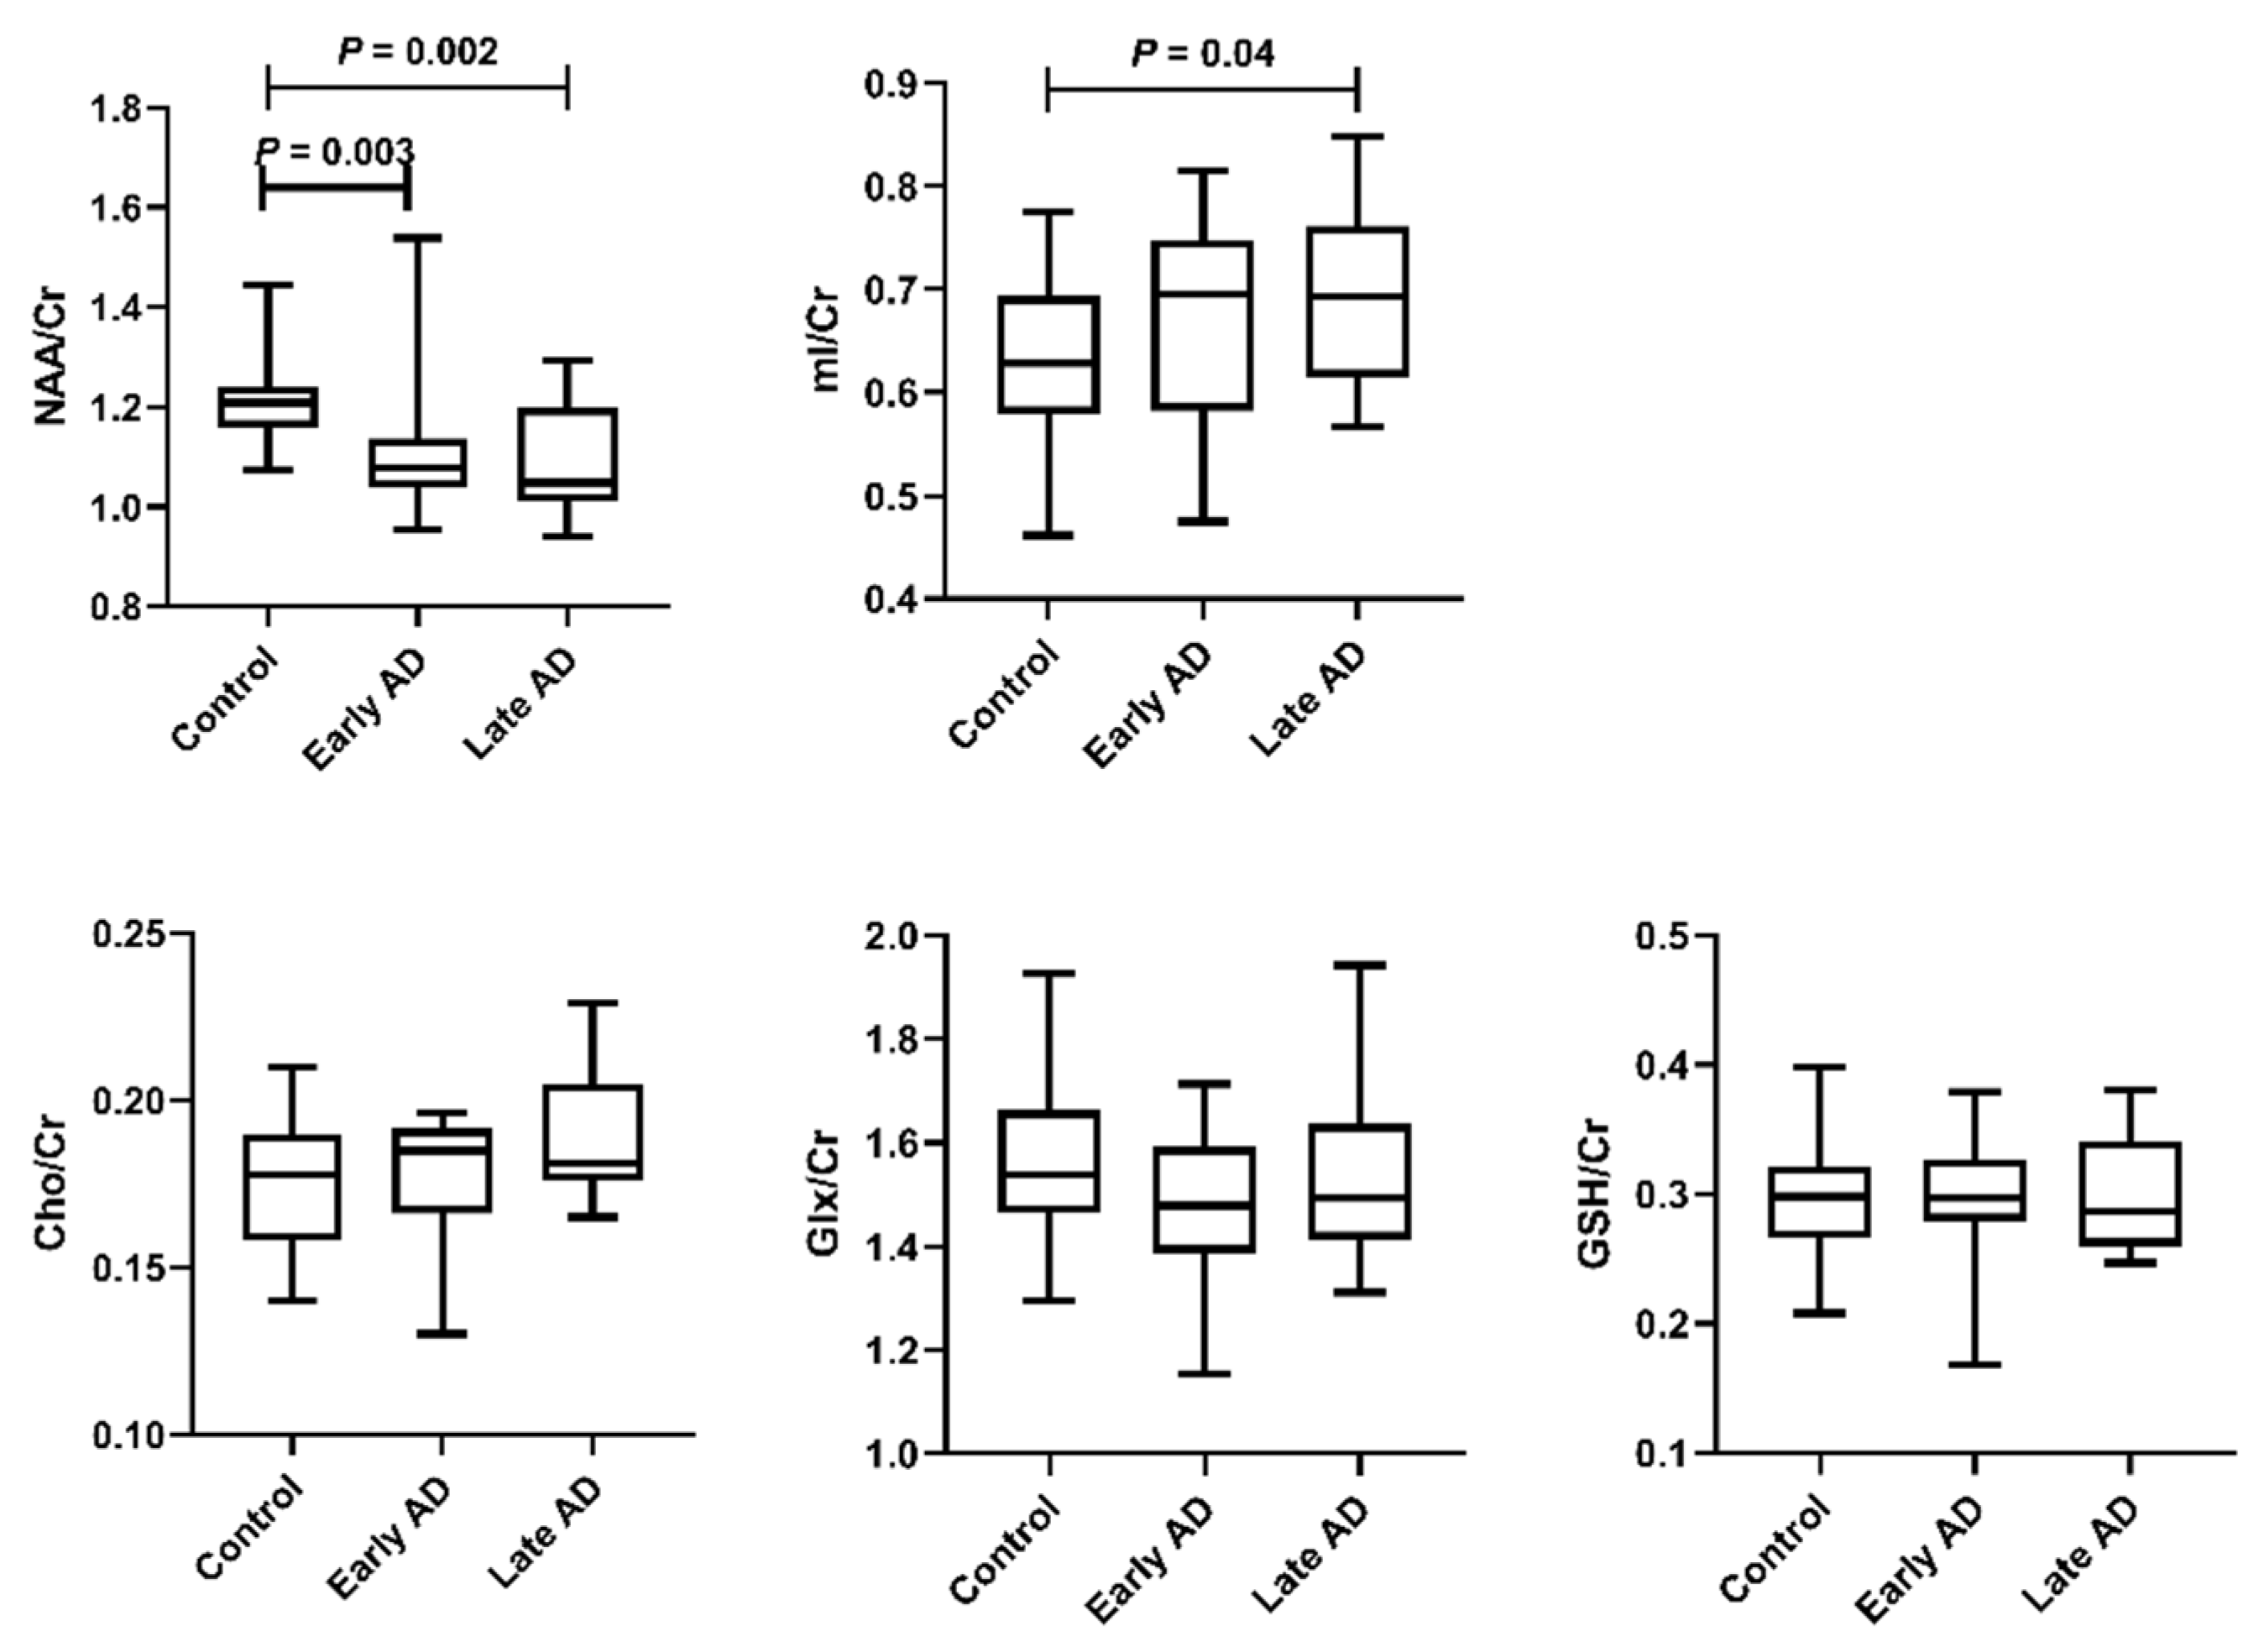
3.2. 1H-MRS Results
3.3. Correlations of 1H-MRS Metabolite Ratios with Aβ and Tau
3.4. ROC Analysis
4. Discussion
5. Conclusions
Author Contributions
Funding
Institutional Review Board Statement
Informed Consent Statement
Data Availability Statement
Conflicts of Interest
References
- Hyman, B.T.; Phelps, C.H.; Beach, T.G.; Bigio, E.H.; Cairns, N.J.; Carrillo, M.C.; Dickson, D.W.; Duyckaerts, C.; Frosch, M.P.; Masliah, E.; et al. National Institute on Aging-Alzheimer’s Association guidelines for the neuropathologic assessment of Alzheimer’s disease. Alzheimer’s Dement. 2012, 8, 1–13. [Google Scholar] [CrossRef] [PubMed] [Green Version]
- Jack, C.R., Jr.; Wiste, H.J.; Schwarz, C.G.; Lowe, V.J.; Senjem, M.L.; Vemuri, P.; Weigand, S.D.; Therneau, T.M.; Knopman, D.S.; Gunter, J.L.; et al. Longitudinal tau PET in ageing and Alzheimer’s disease. Brain 2018, 141, 1517–1528. [Google Scholar] [CrossRef] [PubMed] [Green Version]
- Scheltens, P.; De Strooper, B.; Kivipelto, M.; Holstege, H.; Chételat, G.; Teunissen, C.E.; Cummings, J.; van der Flier, W.M. Alzheimer’s disease. Lancet 2021, 397, 1577–1590. [Google Scholar] [CrossRef]
- van de Pol, L.A.; Hensel, A.; Barkhof, F.; Gertz, H.J.; Scheltens, P.; van der Flier, W.M. Hippocampal atrophy in Alzheimer disease: Age matters. Neurology 2006, 66, 236–238. [Google Scholar] [CrossRef] [PubMed]
- Pini, L.; Pievani, M.; Bocchetta, M.; Altomare, D.; Bosco, P.; Cavedo, E.; Galluzzi, S.; Marizzoni, M.; Frisoni, G.B. Brain atrophy in Alzheimer’s disease and aging. Ageing Res. Rev. 2016, 30, 25–48. [Google Scholar] [CrossRef]
- Hampel, H.; O’Bryant, S.E.; Molinuevo, J.L.; Zetterberg, H.; Masters, C.L.; Lista, S.; Kiddle, S.J.; Batrla, R.; Blennow, K. Blood-based biomarkers for Alzheimer disease: Mapping the road to the clinic. Nat. Rev. Neurol. 2018, 14, 639–652. [Google Scholar] [CrossRef]
- Waragai, M.; Moriya, M.; Nojo, T. Decreased N-Acetyl Aspartate/Myo-Inositol Ratio in the Posterior Cingulate Cortex Shown by Magnetic Resonance Spectroscopy May Be One of the Risk Markers of Preclinical Alzheimer’s Disease: A 7-Year Follow-Up Study. J. Alzheimers Dis. 2017, 60, 1411–1427. [Google Scholar] [CrossRef] [Green Version]
- Mitolo, M.; Stanzani-Maserati, M.; Capellari, S.; Testa, C.; Rucci, P.; Poda, R.; Oppi, F.; Gallassi, R.; Sambati, L.; Rizzo, G.; et al. Predicting conversion from mild cognitive impairment to Alzheimer’s disease using brain 1H-MRS and volumetric changes: A two- year retrospective follow-up study. NeuroImage Clin. 2019, 23, 101843. [Google Scholar] [CrossRef]
- Nelson, P.T.; Head, E.; Schmitt, F.A.; Davis, P.R.; Neltner, J.H.; Jicha, G.A.; Abner, E.L.; Smith, C.D.; Van Eldik, L.J.; Kryscio, R.J.; et al. Alzheimer’s disease is not “brain aging”: Neuropathological, genetic, and epidemiological human studies. Acta Neuropathol. 2011, 121, 571–587. [Google Scholar] [CrossRef] [Green Version]
- Bennett, D.A.; Schneider, J.A.; Arvanitakis, Z.; Kelly, J.F.; Aggarwal, N.T.; Shah, R.C.; Wilson, R.S. Neuropathology of older persons without cognitive impairment from two community-based studies. Neurology 2006, 66, 1837–1844. [Google Scholar] [CrossRef]
- Jack, C.R.; Bennett, D.A.; Blennow, K.; Carrillo, M.C.; Dunn, B.; Haeberlein, S.B.; Holtzman, D.M.; Jagust, W.; Jessen, F.; Karlawish, J.; et al. NIA-AA Research Framework: Toward a biological definition of Alzheimer’s disease. Alzheimer’s Dement. 2018, 14, 535–562. [Google Scholar] [CrossRef] [PubMed]
- Chan, A.S.; Kwok, I. Hong Kong List Learning Test; Chinese University of Hong Kong: Hong Kong, 2006. [Google Scholar]
- Wong, A.; Law, L.S.; Liu, W.; Wang, Z.; Lo, E.S.; Lau, A.; Wong, L.K.; Mok, V.C. Montreal cognitive assessment: One cutoff never fits all. Stroke 2015, 46, 3547–3550. [Google Scholar] [CrossRef] [PubMed]
- Scheltens, P.; Leys, D.; Barkhof, F.; Huglo, D.; Weinstein, H.; Vermersch, P.; Kuiper, M.; Steinling, M.; Wolters, E.C.; Valk, J. Atrophy of medial temporal lobes on MRI in “probable” Alzheimer’s disease and normal ageing: Diagnostic value and neuropsychological correlates. J. Neurol. Neurosurg. Psychiatry 1992, 55, 967–972. [Google Scholar] [CrossRef] [PubMed]
- Pereira, J.B.; Cavallin, L.; Spulber, G.; Aguilar, C.; Mecocci, P.; Vellas, B.; Tsolaki, M.; Kłoszewska, I.; Soininen, H.; Spenger, C. Influence of age, disease onset and ApoE4 on visual medial temporal lobe atrophy cut-offs. J. Intern. Med. 2014, 275, 317–330. [Google Scholar] [CrossRef] [PubMed]
- Minoshima, S.; Giordani, B.; Berent, S.; Frey, K.A.; Foster, N.L.; Kuhl, D.E. Metabolic reduction in the posterior cingulate cortex in very early Alzheimer’s disease. Ann. Neurol. 1997, 42, 85–94. [Google Scholar] [CrossRef] [Green Version]
- Provencher, S.W. Automatic quantitation of localized in vivo 1H spectra with LCModel. NMR Biomed. 2001, 14, 260–264. [Google Scholar] [CrossRef]
- Voevodskaya, O.; Poulakis, K.; Sundgren, P.; Westen, D.v.; Palmqvist, S.; Wahlund, L.-O.; Stomrud, E.; Hansson, O.; Westman, E.; Swedish BioFINDER Study Group. Brain myoinositol as a potential marker of amyloid-related pathology: A longitudinal study. Neurology 2019, 92, e395–e405. [Google Scholar] [CrossRef] [Green Version]
- Youden, W.J. Index for rating diagnostic tests. Cancer 1950, 3, 32–35. [Google Scholar] [CrossRef]
- DeLong, E.R.; DeLong, D.M.; Clarke-Pearson, D.L. Comparing the areas under two or more correlated receiver operating characteristic curves: A nonparametric approach. Biometrics 1988, 44, 837–845. [Google Scholar] [CrossRef]
- Wong, D.; Atiya, S.; Fogarty, J.; Montero-Odasso, M.; Pasternak, S.H.; Brymer, C.; Borrie, M.J.; Bartha, R. Reduced Hippocampal Glutamate and Posterior Cingulate N-Acetyl Aspartate in Mild Cognitive Impairment and Alzheimer’s Disease Is Associated with Episodic Memory Performance and White Matter Integrity in the Cingulum: A Pilot Study. J. Alzheimers Dis. 2020, 73, 1385–1405. [Google Scholar] [CrossRef]
- Bittner, D.M.; Heinze, H.-J.; Kaufmann, J. Association of 1H-MR Spectroscopy and Cerebrospinal Fluid Biomarkers in Alzheimer’s Disease: Diverging Behavior at Three Different Brain Regions. J. Alzheimers Dis. 2013, 36, 155–163. [Google Scholar] [CrossRef] [PubMed]
- Piersson, A.D.; Mohamad, M.; Rajab, F.; Suppiah, S. Cerebrospinal Fluid Amyloid Beta, Tau Levels, Apolipoprotein, and 1H-MRS Brain Metabolites in Alzheimer’s Disease: A Systematic Review. Acad. Radiol. 2021, 28, 1447–1463. [Google Scholar] [CrossRef] [PubMed]
- Clark, J.B. N-Acetyl Aspartate: A Marker for Neuronal Loss or Mitochondrial Dysfunction. Dev. Neurosci. 1998, 20, 271–276. [Google Scholar] [CrossRef]
- Heneka, M.T.; Carson, M.J.; Khoury, J.E.; Landreth, G.E.; Brosseron, F.; Feinstein, D.L.; Jacobs, A.H.; Wyss-Coray, T.; Vitorica, J.; Ransohoff, R.M.; et al. Neuroinflammation in Alzheimer’s disease. Lancet Neurol. 2015, 14, 388–405. [Google Scholar] [CrossRef] [Green Version]
- Voevodskaya, O.; Sundgren, P.C.; Strandberg, O.; Zetterberg, H.; Minthon, L.; Blennow, K.; Wahlund, L.-O.; Westman, E.; Hansson, O.; For the Swedish BioFINDER study group. Myo-inositol changes precede amyloid pathology and relate to APOE genotype in Alzheimer disease. Neurology 2016, 86, 1754–1761. [Google Scholar] [CrossRef] [Green Version]
- Kantarci, K.; Knopman, D.S.; Dickson, D.W.; Parisi, J.E.; Whitwell, J.L.; Weigand, S.D.; Josephs, K.A.; Boeve, B.F.; Petersen, R.C.; Jack, C.R. Alzheimer Disease: Postmortem Neuropathologic Correlates of Antemortem 1H MR Spectroscopy Metabolite Measurements1. Radiology 2008, 248, 210–220. [Google Scholar] [CrossRef] [PubMed]
- Kantarci, K.; Jack, C.R.; Xu, Y.C.; Campeau, N.G.; O’Brien, P.C.; Smith, G.E.; Ivnik, R.J.; Boeve, B.F.; Kokmen, E.; Tangalos, E.G.; et al. Regional metabolic patterns in mild cognitive impairment and Alzheimer’s disease: A 1H MRS study. Neurology 2000, 55, 210–217. [Google Scholar] [CrossRef] [PubMed] [Green Version]
- Kantarci, K.; Petersen, R.C.; Boeve, B.F.; Knopman, D.S.; Tang-Wai, D.F.; O’Brien, P.C.; Weigand, S.D.; Edland, S.D.; Smith, G.E.; Ivnik, R.J.; et al. 1H MR spectroscopy in common dementias. Neurology 2004, 63, 1393–1398. [Google Scholar] [CrossRef] [Green Version]
- Kantarci, K.; Reynolds, G.; Petersen, R.C.; Boeve, B.F.; Knopman, D.S.; Edland, S.D.; Smith, G.E.; Ivnik, R.J.; Tangalos, E.G.; Jack, C.R. Proton MR Spectroscopy in Mild Cognitive Impairment and Alzheimer Disease: Comparison of 1.5 and 3 T. Am. J. Neuroradiol. 2003, 24, 843–849. [Google Scholar]
- Antuono, P.G.; Jones, J.L.; Wang, Y.; Li, S.-J. Decreased glutamate + glutamine in Alzheimer’s disease detected in vivo with 1H-MRS at 0.5 T. Neurology 2001, 56, 737–742. [Google Scholar] [CrossRef]
- Fayed, N.; Modrego, P.J.; Rojas-Salinas, G.; Aguilar, K. Brain Glutamate Levels Are Decreased in Alzheimer’s Disease: A Magnetic Resonance Spectroscopy Study. Am. J. Alzheimer’s Dis. Other Dement. 2011, 26, 450–456. [Google Scholar] [CrossRef] [PubMed]
- Hattori, N.; Abe, K.; Sakoda, S.; Sawada, T. Proton MR spectroscopic study at 3 Tesla on glutamate/glutamine in Alzheimer’s disease. Neuroreport 2002, 13, 183–186. [Google Scholar] [CrossRef] [PubMed]
- Duffy, S.L.; Lagopoulos, J.; Hickie, I.B.; Diamond, K.; Graeber, M.B.; Lewis, S.J.G.; Naismith, S.L. Glutathione relates to neuropsychological functioning in mild cognitive impairment. Alzheimer’s Dement. 2014, 10, 67–75. [Google Scholar] [CrossRef] [PubMed]
- Mandal, P.K.; Tripathi, M.; Sugunan, S. Brain oxidative stress: Detection and mapping of anti-oxidant marker ‘Glutathione’ in different brain regions of healthy male/female, MCI and Alzheimer patients using non-invasive magnetic resonance spectroscopy. Biochem. Biophys. Res. Commun. 2012, 417, 43–48. [Google Scholar] [CrossRef] [PubMed]


| Control (n = 37) | Early AD (n = 16) | Late AD (n = 15) | p Value | |
|---|---|---|---|---|
| CU/CI (n/n) | 37/0 | 4/12 | 0/15 | <0.001 a,b |
| Female, n (%) | 21 (56.8%) | 11 (68.8%) | 11 (73.3%) | 0.46 |
| Age (years) | 64.9 (6.4) | 66.9 (8.9) | 70.5 (5.5) | 0.04 b |
| Education (years) | 9.9 (3.7) | 10.7 (1.1) | 9.4 (1.1) | 0.78 |
| HKLLT Z-score | 0.25 (−1.08, 0.71) | −1.80 (−2.19, −0.91) | −2.03 (−2.24, −2.03) | <0.001 a,b |
| MoCA | 25.58 (3.55) | 21.81 (5.88) | 15.07 (4.61) | <0.001 b,c |
| Global PIB retention | 1.26 (0.05) | 1.58 (0.17) | 1.68 (0.20) | <0.001 a,b |
| Global T807 SUVR | 1.03 (0.07) | 1.23 (0.22) | 1.27 (0.19) | <0.001 a,b |
| Hippocampal fraction (%) | 0.58 (0.09) | 0.50 (0.07) | 0.40 (0.05) | <0.001 b,c |
| Global PIB Retention | Global T807 SUVR | |||
|---|---|---|---|---|
| r | p | r | p | |
| NAA/Cr | −0.47 * | <0.001 | −0.51 * | <0.001 |
| mI/Cr | 0.39 * | 0.001 | 0.47 * | <0.001 |
| AUC (95% CI) | SE | p Value | Optimal Cutoff † | Accuracy (%) | Sensitivity (%) | Specificity (%) | |
|---|---|---|---|---|---|---|---|
| Control vs. Early AD (n/n = 37/16) | |||||||
| HF | 0.72 (0.56–0.87) | 0.08 | 0.01 * | 0.49 | 81.1 | 43.8 | 97.3 |
| NAA/Cr | 0.80 (0.63–0.97) | 0.09 | <0.001 * | 1.14 | 83.0 | 81.3 | 83.8 |
| mI/Cr | 0.63 (0.45–0.81) | 0.09 | 0.14 | 0.67 | 67.9 | 62.5 | 70.3 |
| Control vs. Late AD (n/n = 37/15) | |||||||
| HF | 0.99 (0.96–1) | 0.01 | <0.001 * | 0.45 | 96.2 | 93.3 | 97.3 |
| NAA/Cr | 0.79 (0.62–0.96) | 0.08 | <0.01 * | 1.07 | 88.5 | 60.0 | 100 |
| mI/Cr | 0.70 (0.54–0.86) | 0.08 | 0.02 * | 0.66 | 67.3 | 66.7 | 67.6 |
| Early AD vs. Late AD (n/n = 16/15) | |||||||
| HF | 0.86 (0.73–0.99) | 0.07 | <0.01 * | 0.44 | 80.7 | 86.7 | 75.0 |
| NAA/Cr | 0.56 (0.35–0.77) | 0.11 | 0.11 | 1.07 | 61.3 | 60.0 | 62.5 |
| mI/Cr | 0.57 (0.36–0.77) | 0.11 | 0.51 | 0.73 | 61.3 | 46.7 | 75.0 |
| Control vs. Early AD in the CU group (n/n = 37/4) | |||||||
| HF | 0.68 (0.43–0.94) | 0.13 | 0.24 | 0.60 | 41.5 | 100 | 35.1 |
| NAA/Cr | 0.96 (0.88–1) | 0.04 | <0.01 * | 1.14 | 85.4 | 100 | 83.8 |
| mI/Cr | 0.69 (0.51–0.87) | 0.09 | 0.27 | 0.63 | 53.7 | 100 | 48.6 |
Publisher’s Note: MDPI stays neutral with regard to jurisdictional claims in published maps and institutional affiliations. |
© 2022 by the authors. Licensee MDPI, Basel, Switzerland. This article is an open access article distributed under the terms and conditions of the Creative Commons Attribution (CC BY) license (https://creativecommons.org/licenses/by/4.0/).
Share and Cite
Chen, Q.; Abrigo, J.; Liu, W.; Han, E.Y.; Yeung, D.K.W.; Shi, L.; Au, L.W.C.; Deng, M.; Chen, S.; Leung, E.Y.L.; et al. Lower Posterior Cingulate N-Acetylaspartate to Creatine Level in Early Detection of Biologically Defined Alzheimer’s Disease. Brain Sci. 2022, 12, 722. https://doi.org/10.3390/brainsci12060722
Chen Q, Abrigo J, Liu W, Han EY, Yeung DKW, Shi L, Au LWC, Deng M, Chen S, Leung EYL, et al. Lower Posterior Cingulate N-Acetylaspartate to Creatine Level in Early Detection of Biologically Defined Alzheimer’s Disease. Brain Sciences. 2022; 12(6):722. https://doi.org/10.3390/brainsci12060722
Chicago/Turabian StyleChen, Qianyun, Jill Abrigo, Wanting Liu, Elyia Yixun Han, David Ka Wai Yeung, Lin Shi, Lisa Wing Chi Au, Min Deng, Sirong Chen, Eric Yim Lung Leung, and et al. 2022. "Lower Posterior Cingulate N-Acetylaspartate to Creatine Level in Early Detection of Biologically Defined Alzheimer’s Disease" Brain Sciences 12, no. 6: 722. https://doi.org/10.3390/brainsci12060722