
Stress Evaluation by Hemoglobin Concentration Change Using Mobile NIRS


Abstract
:1. Introduction
2. Materials and Methods
2.1. Subjects and Methods
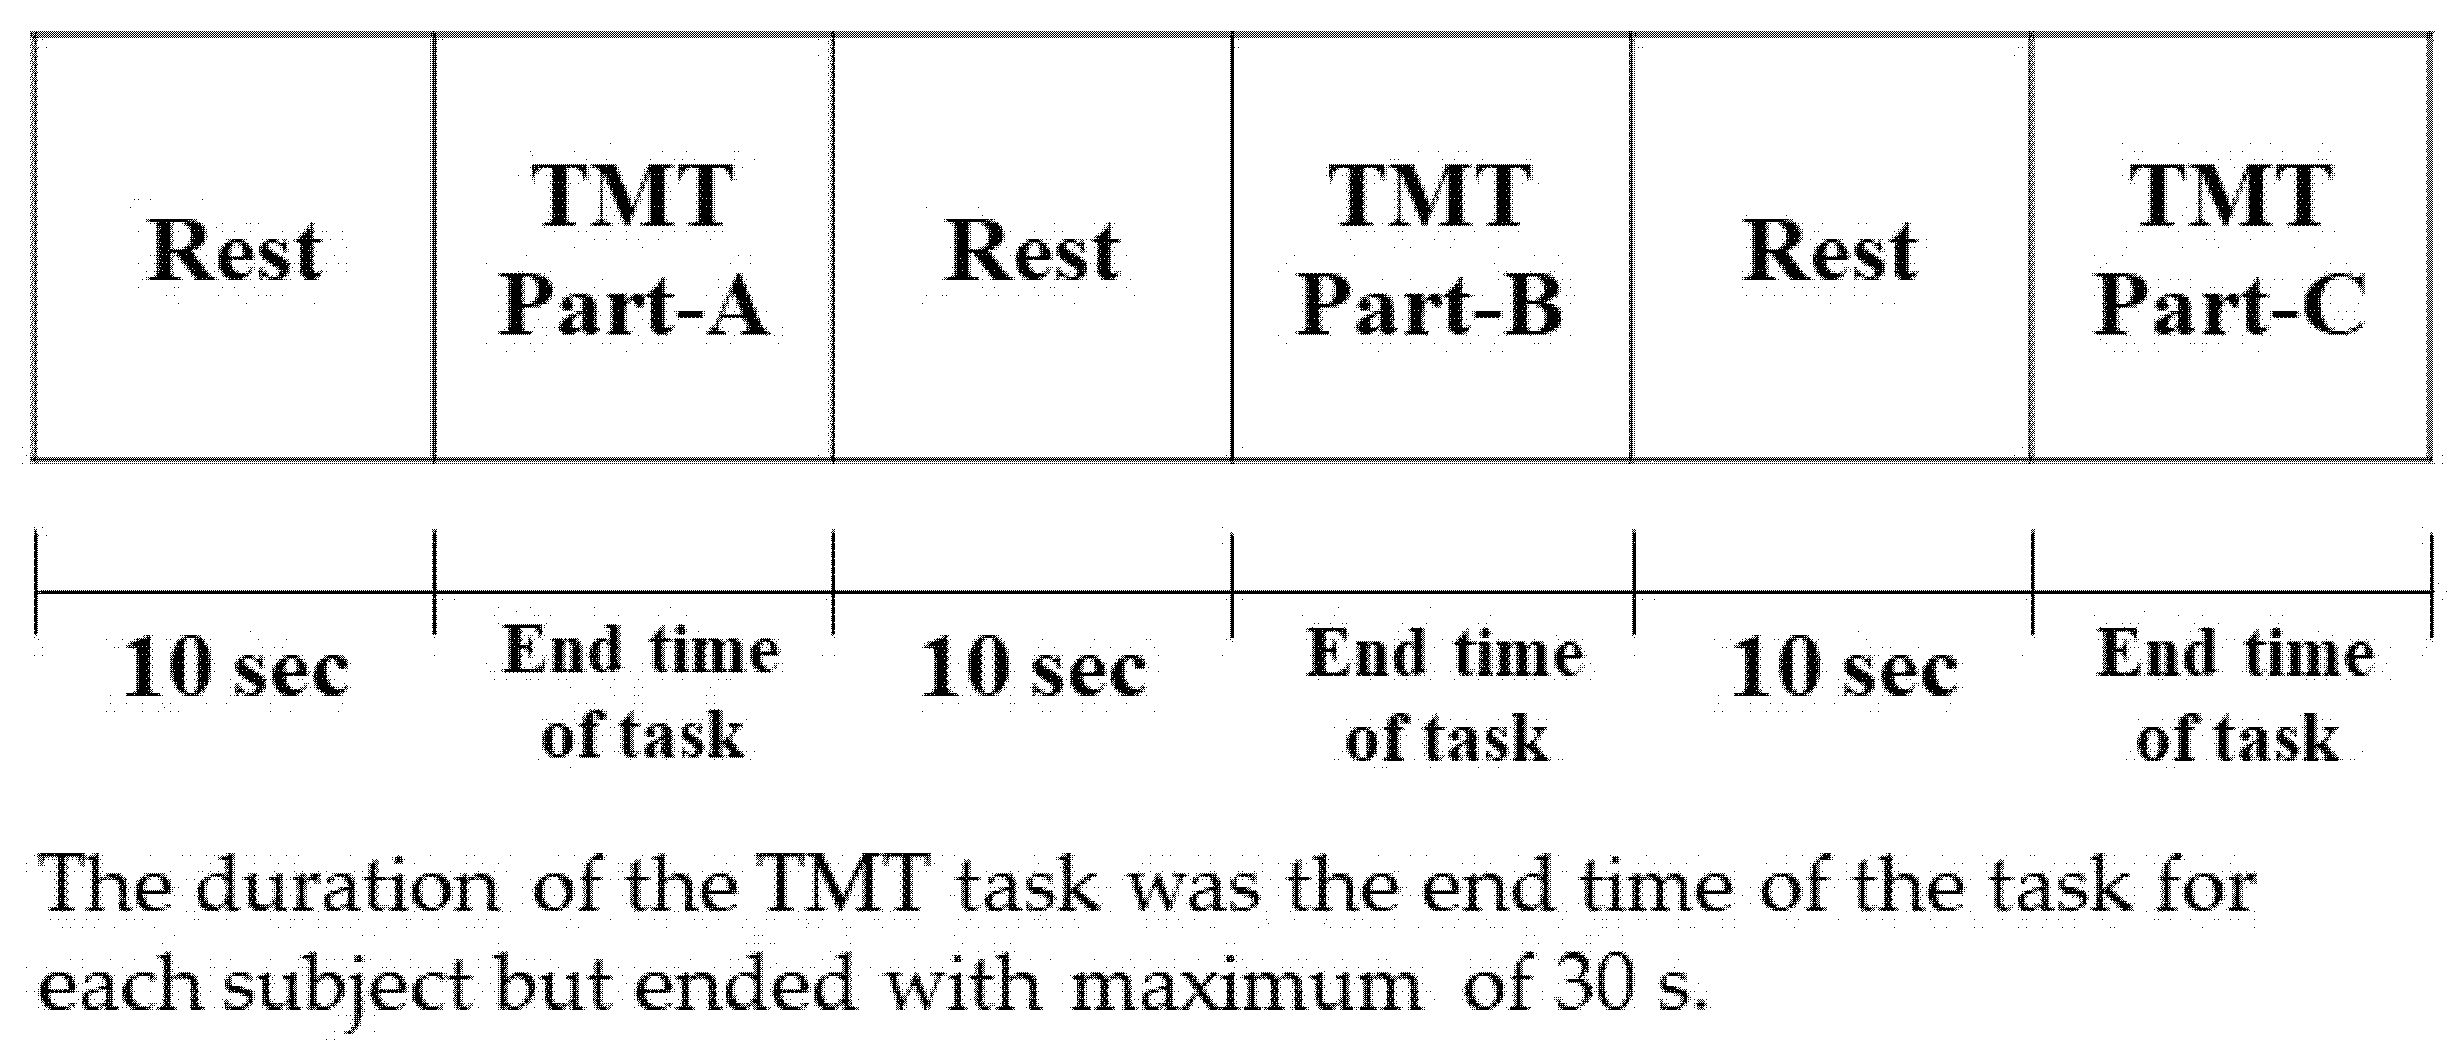
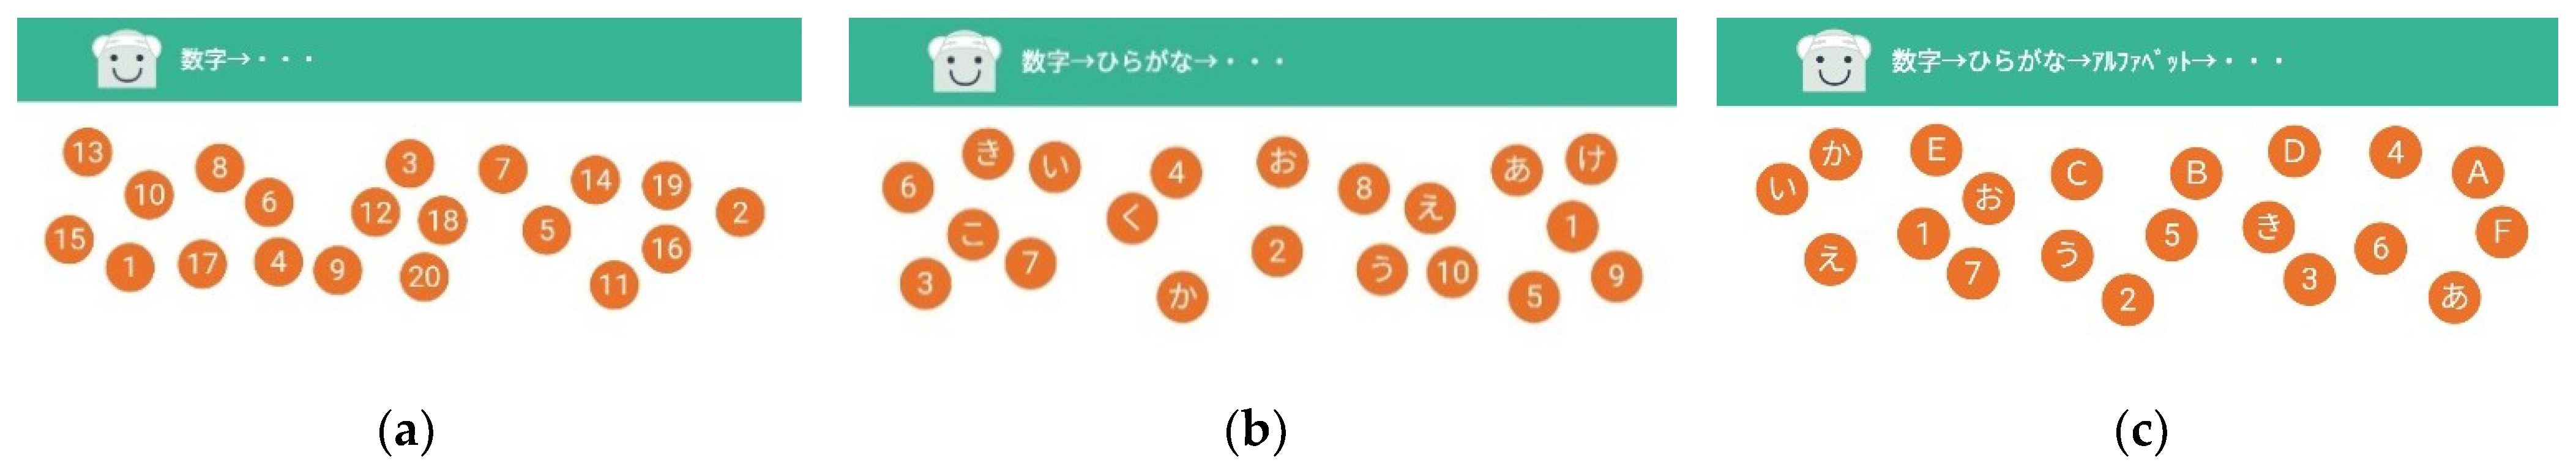
2.2. TMT
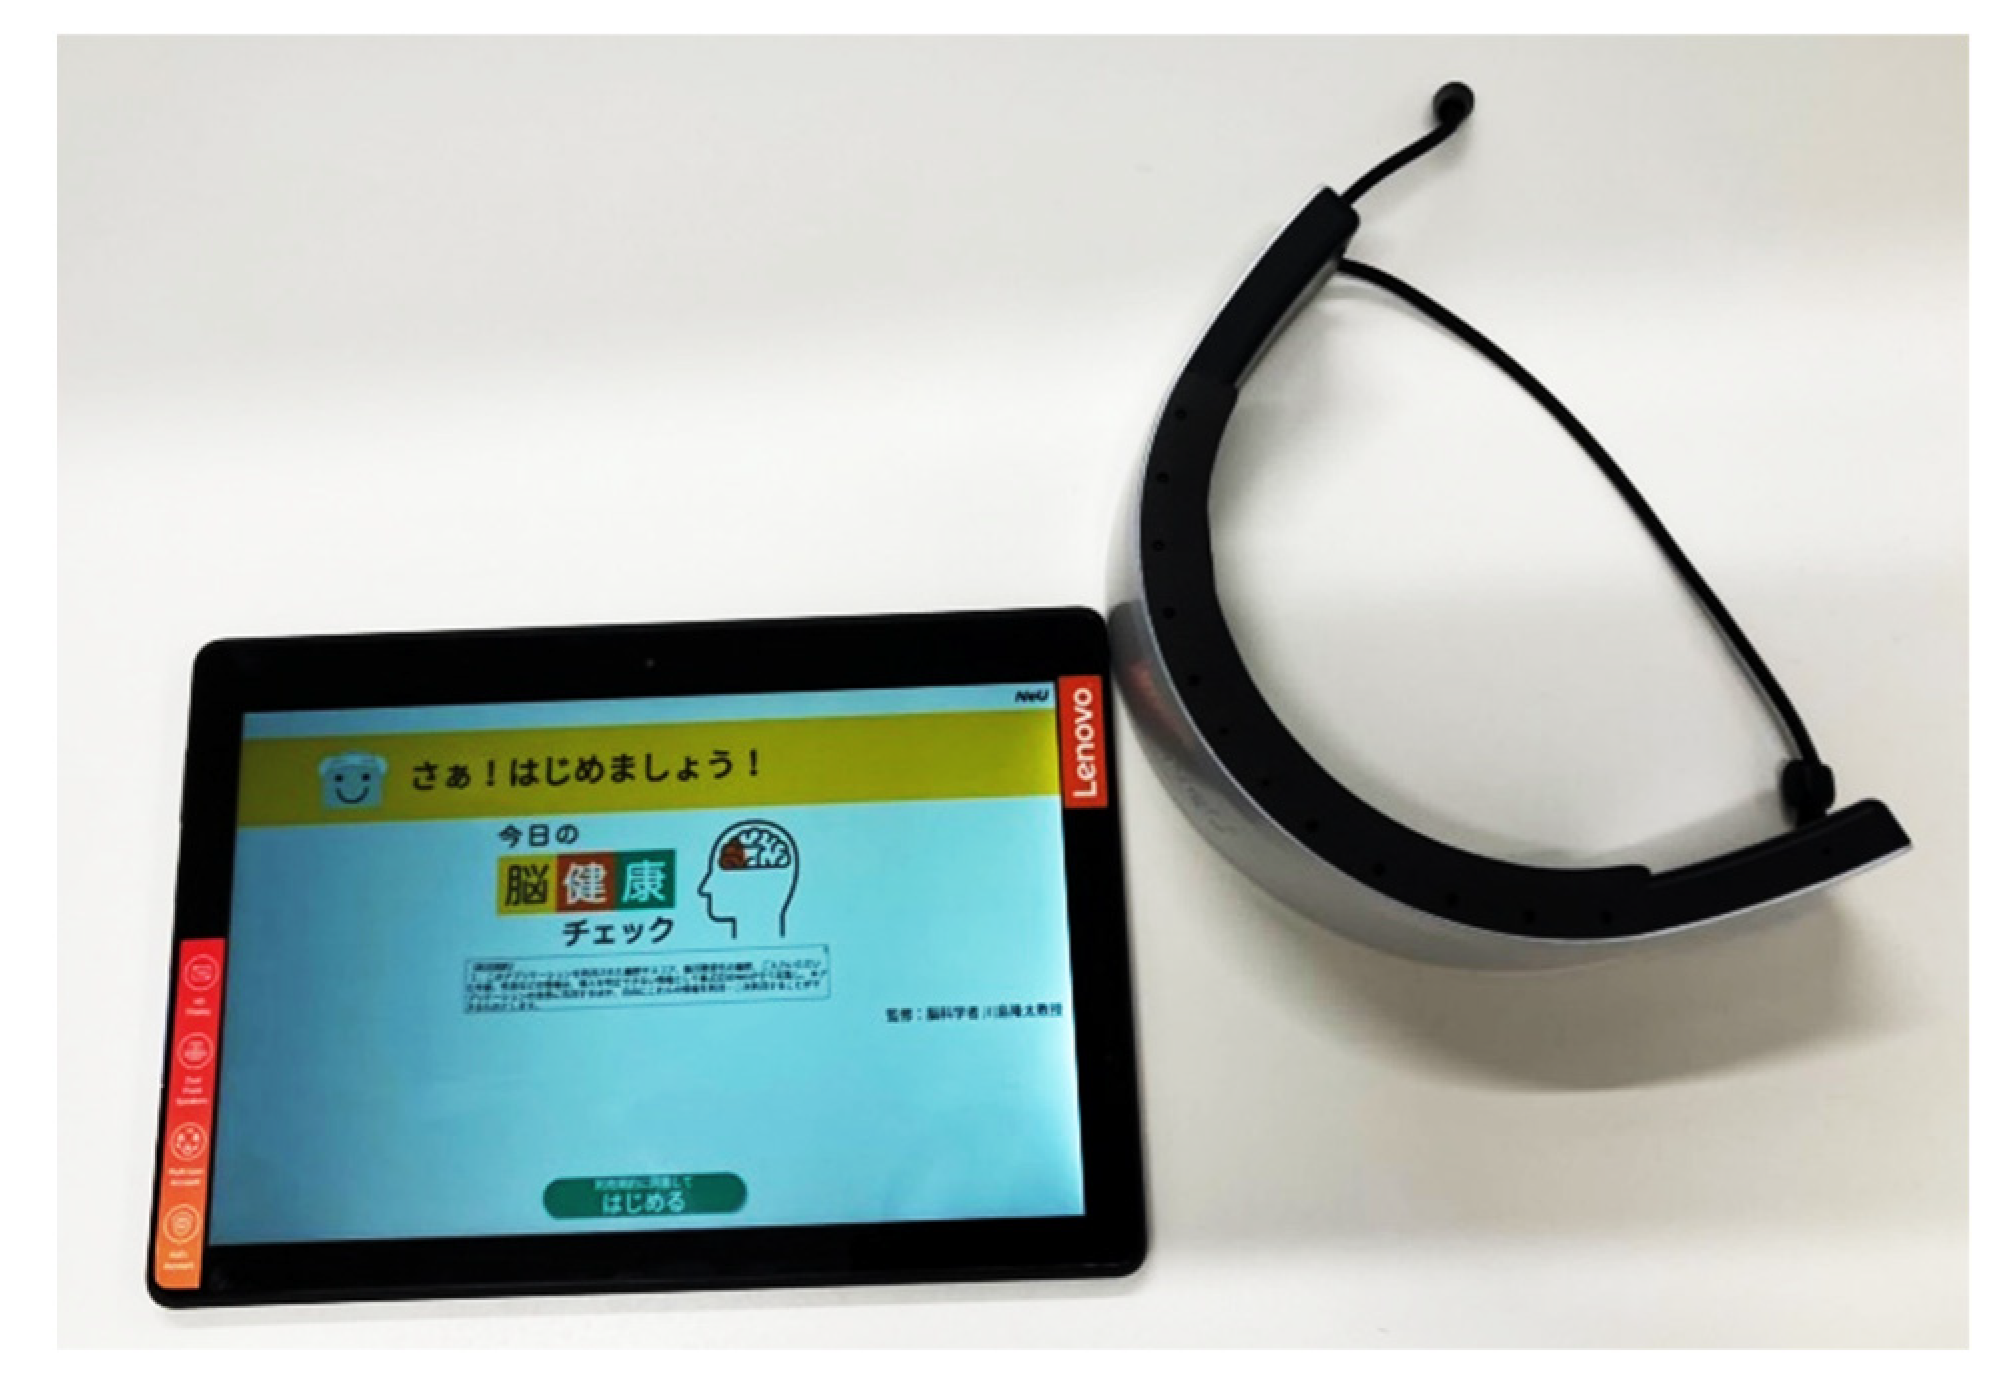
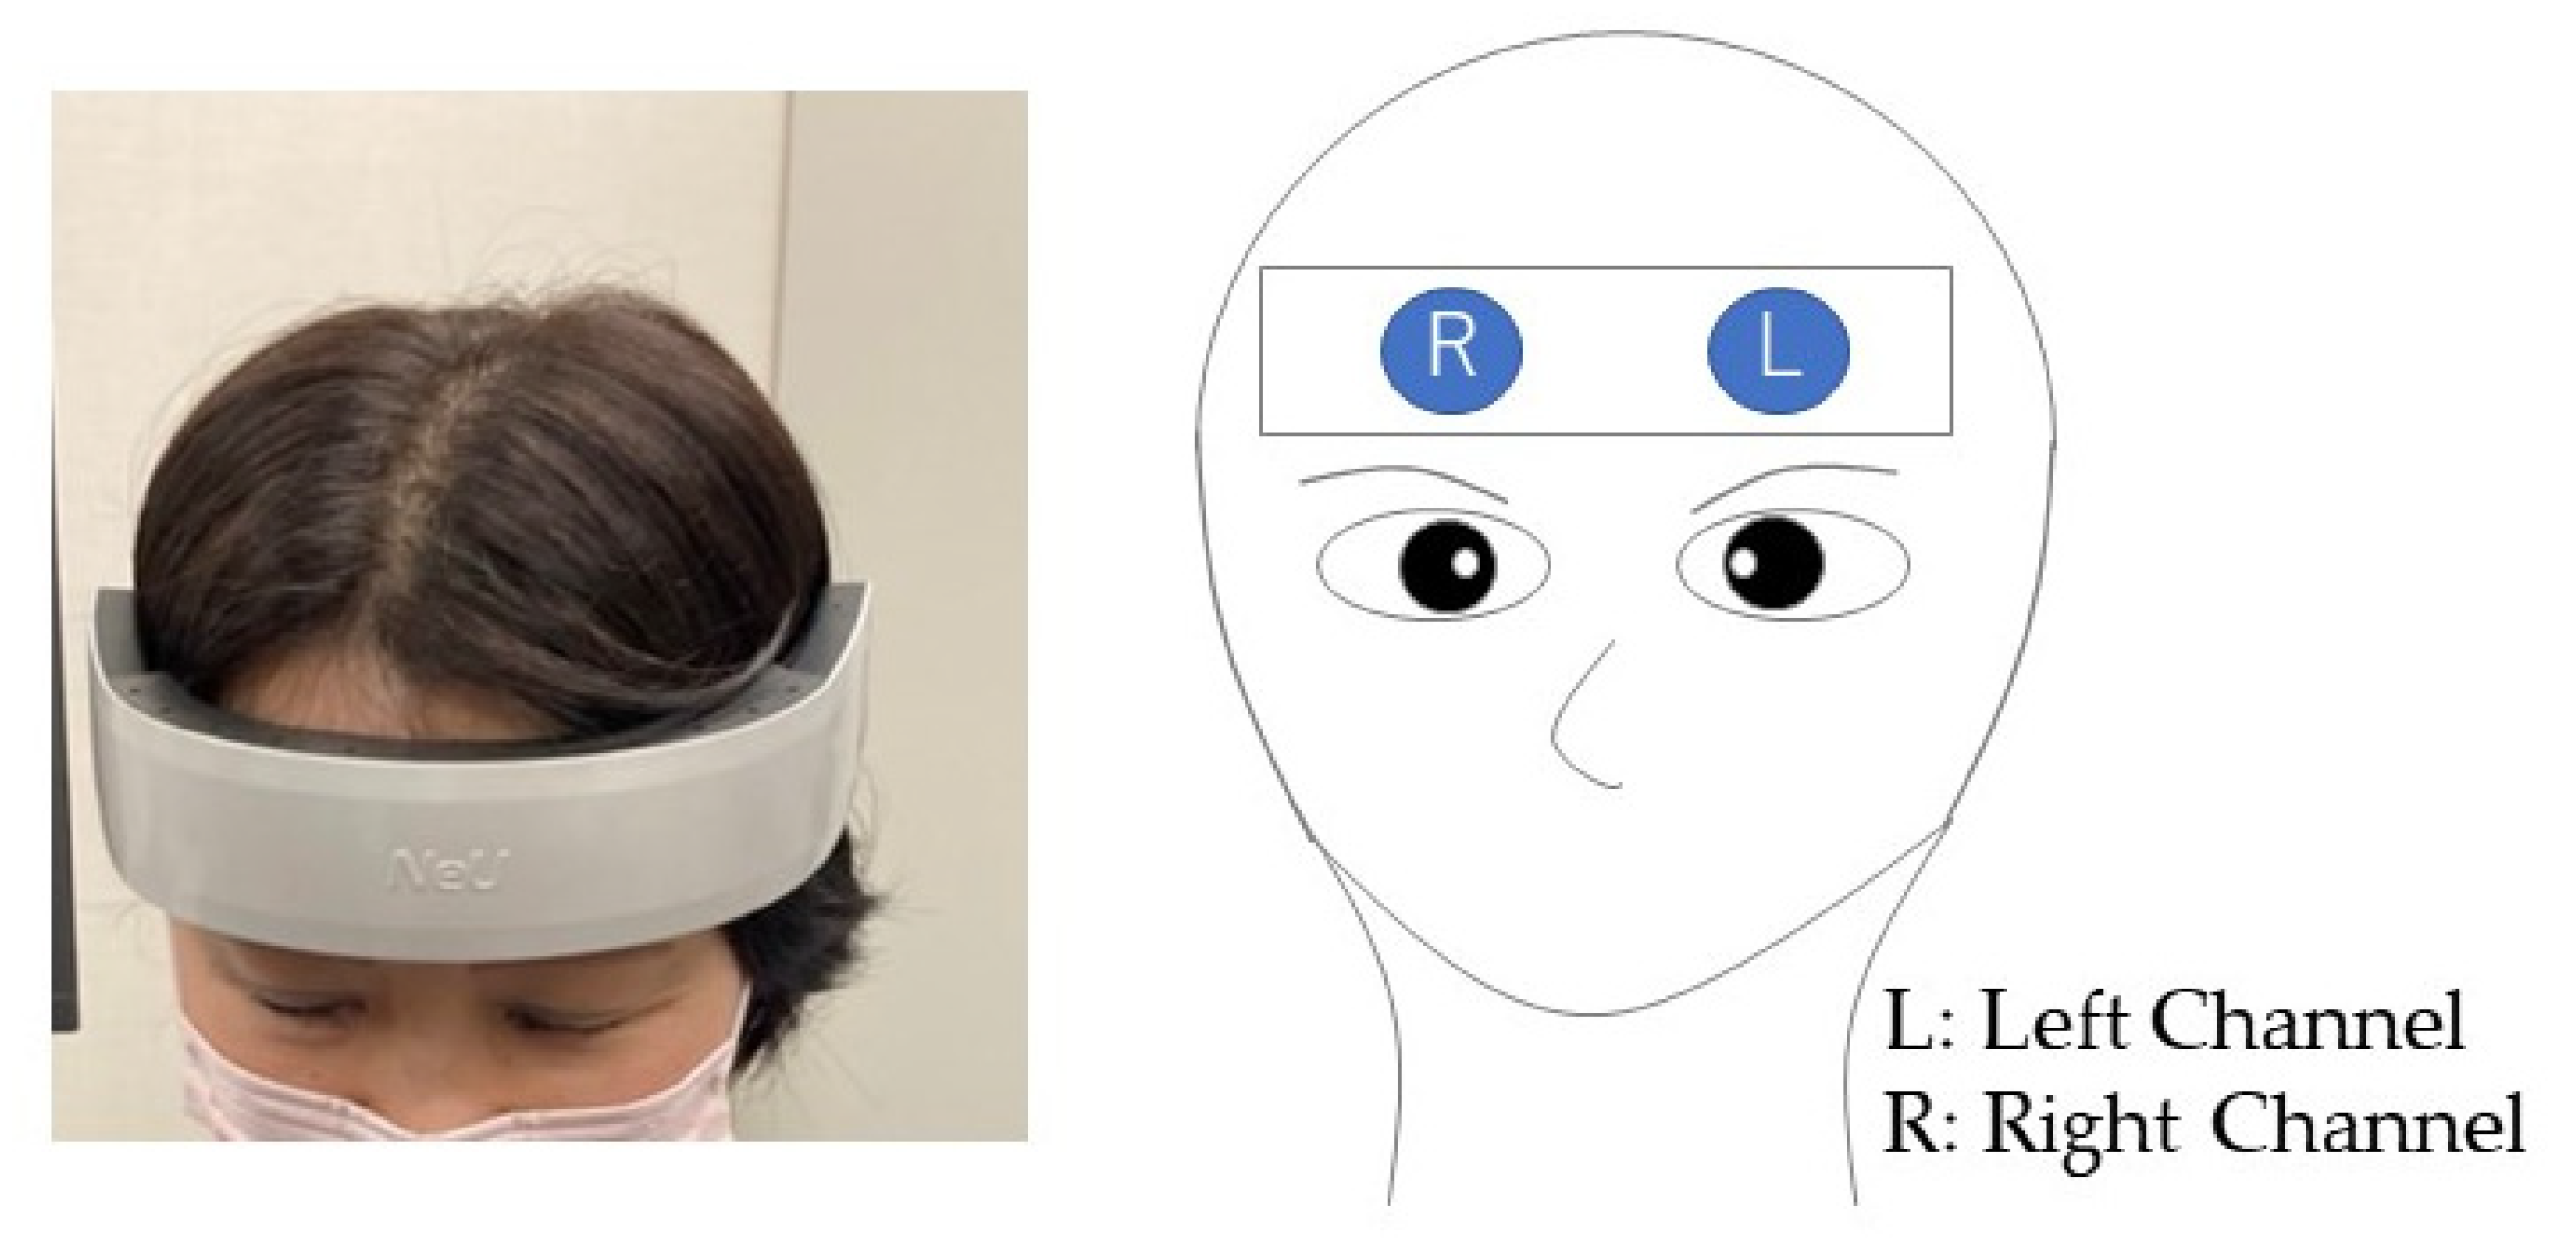
2.3. HOT-2000
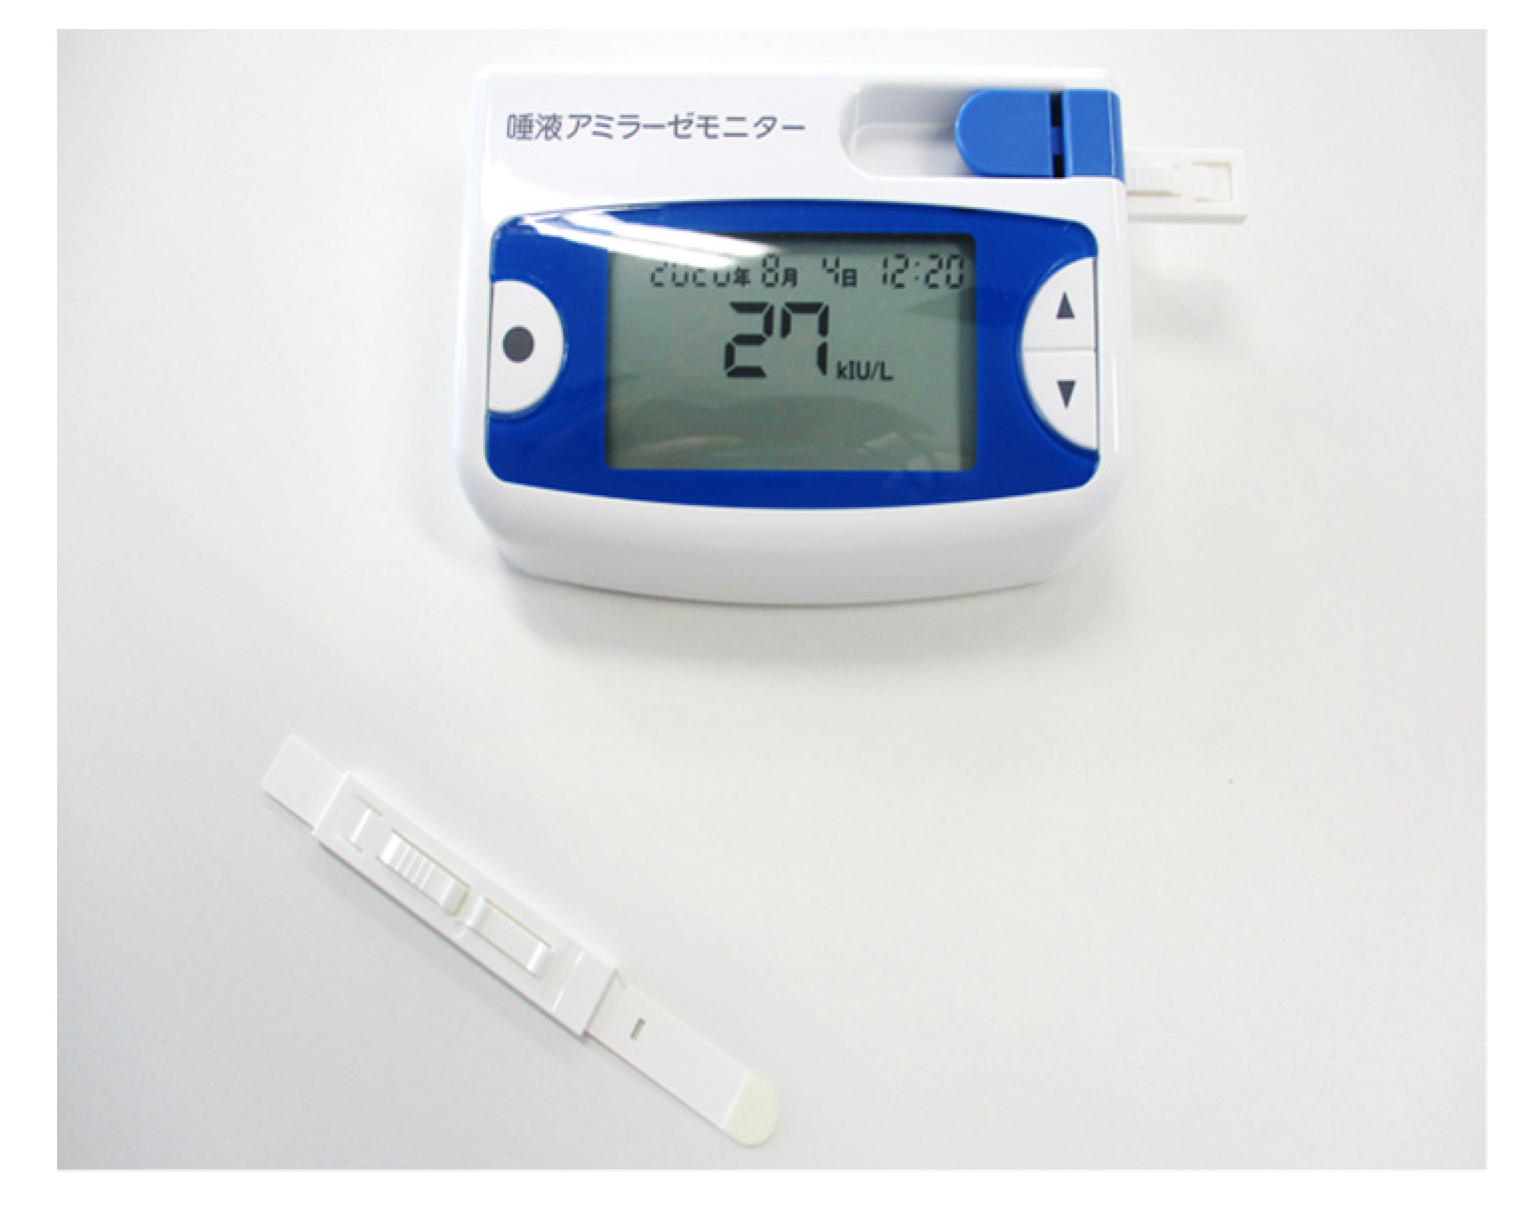
2.4. Salivary Amylase Monitor
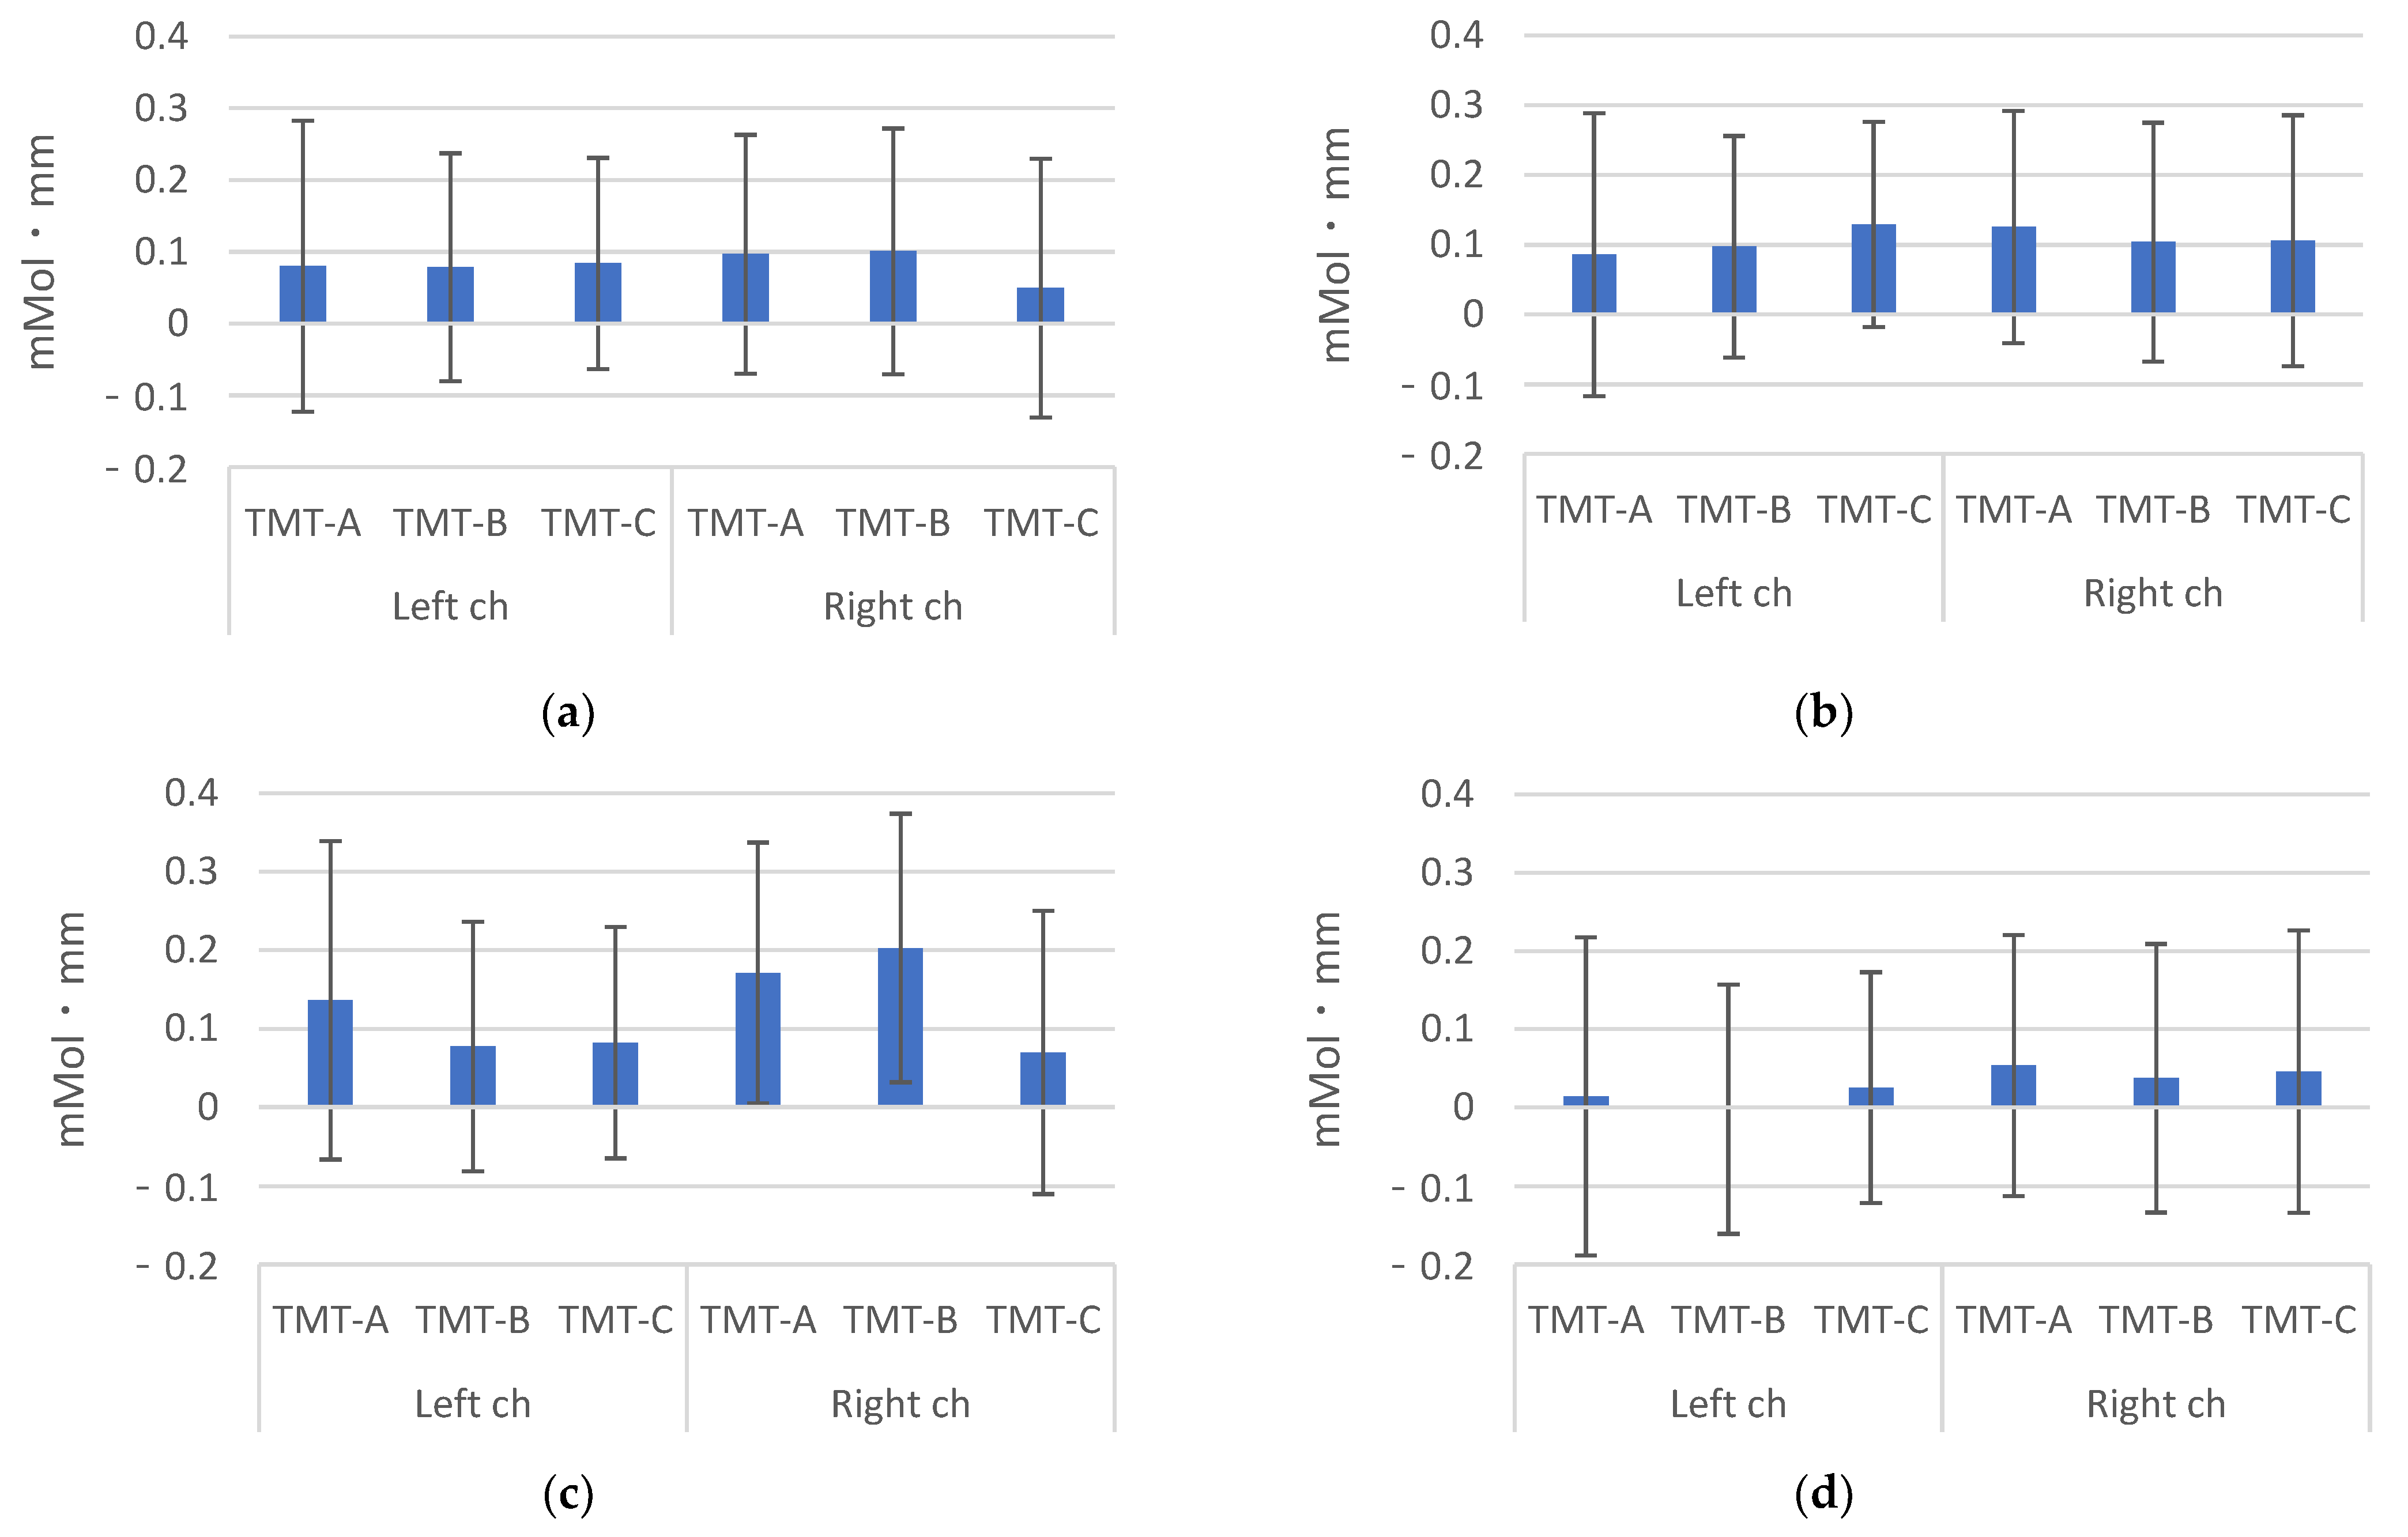
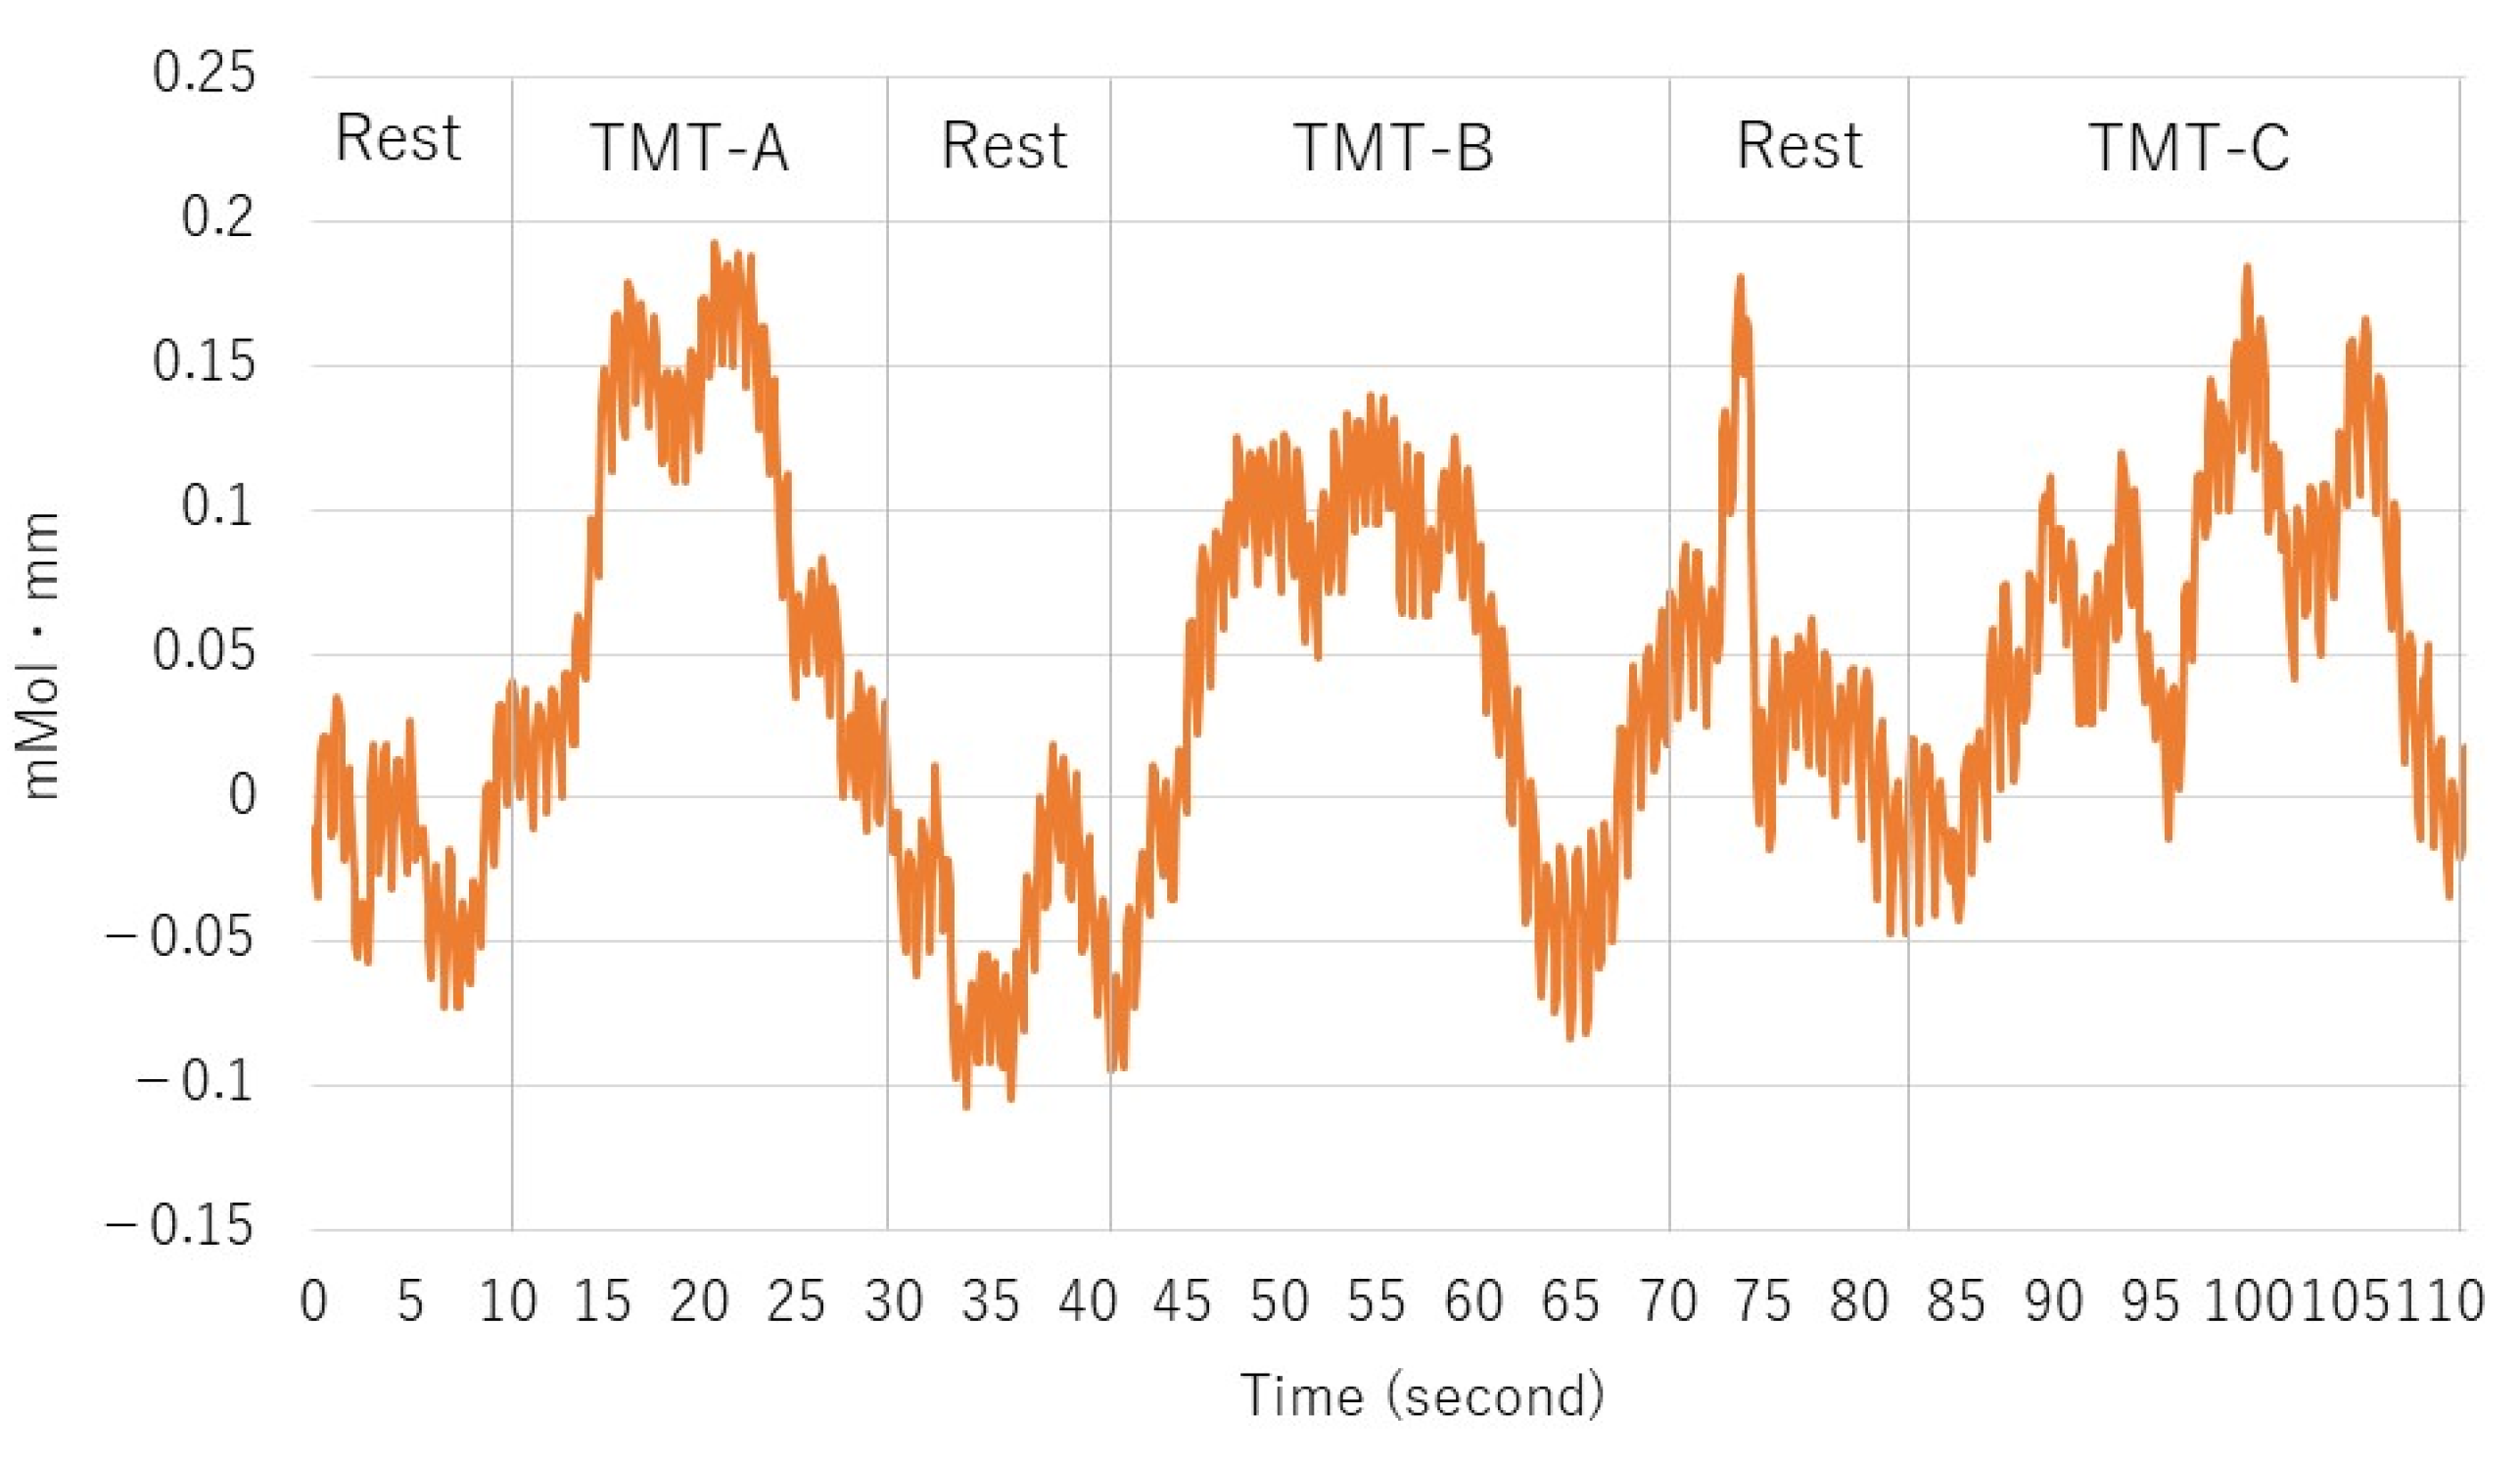
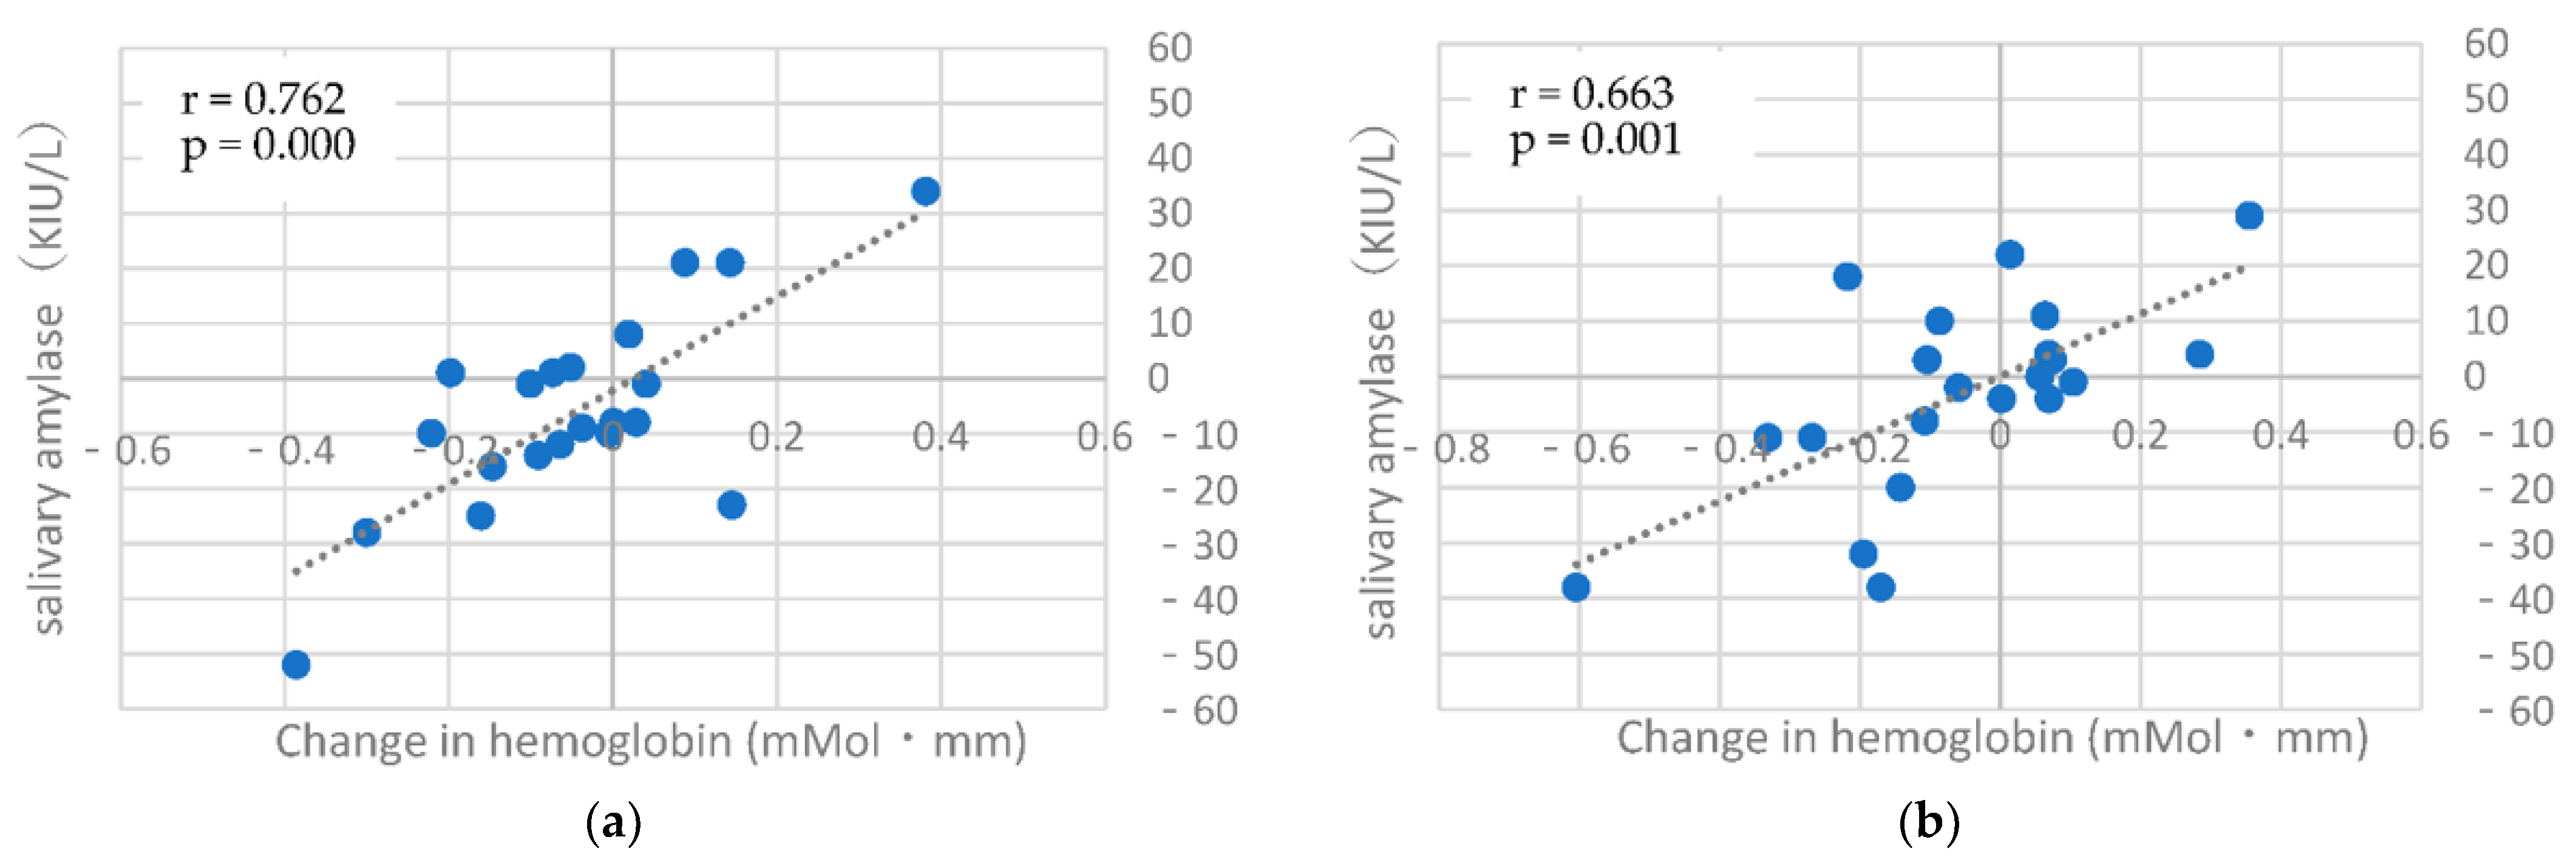
3. Results
4. Discussion
5. Conclusions
Author Contributions
Funding
Institutional Review Board Statement
Informed Consent Statement
Data Availability Statement
Conflicts of Interest
References
- McEwen, B.; Sapolsky, R. Stress and your health. J. Clin. Endocrinol. Metab. 2006, 91, E2. [Google Scholar] [CrossRef] [Green Version]
- Yaribeygi, H.; Panahi, Y.; Sahraei, H.; Johnston, T.P.; Sahebkar, A. The impact of stress on body function: A review. Excli. J. 2017, 16, 1057–1072. [Google Scholar] [CrossRef] [PubMed]
- Kuldeep, D.; Shyma, K.L.; Maryam, D.; Hari, A.S.; Ashok, M.; Rekha, K.; Kumaragurubaran, K.; Ruchi, T.; Yatoo, M.I.; Prakash, B.; et al. Biomarkers in Stress Related Diseases/Disorders: Diagnostic, Prognostic, and Therapeutic Values. Front. Mol. Biosci. 2019, 6, 91. [Google Scholar] [CrossRef]
- Nida, A.; Urs, M.N. Salivary Alpha-Amylase as a Biomarker of Stress in Behavioral Medicine. Int. J. Behav. Med. 2020, 27, 337–342. [Google Scholar] [CrossRef] [Green Version]
- Giannakakis, G.; Pediaditis, M.; Manousos, D.; Kazantzaki, E.; Chiarugi, F.; Simos, P.G.; Marias, K.; Tsiknakis, M. Stress and anxiety detection using facial cues from videos. Biomed. Signal Process. Control 2017, 31, 89–101. [Google Scholar] [CrossRef]
- Kim, H.G.; Cheon, E.J.; Bai, D.S.; Lee, Y.H.; Koo, B.H. Stress and heart rate variability: A meta-analysis and review of the literature. Psychiatry Investig. 2018, 15, 235–245. [Google Scholar] [CrossRef] [Green Version]
- Minakuchi, E.; Ohnishi, E.; Ohnishi, J.; Sakamoto, S.; Hori, M.; Motomura, M.; Hoshino, J.; Murakami, K.; Kawaguchi, T. Evaluation of mental stress by physiological indices derived from finger plethysmography. J. Physiol. Anthropol. 2013, 32, 17. [Google Scholar] [CrossRef] [Green Version]
- Ishii, Y.; Ogata, H.; Takano, H.; Ohnishi, H.; Mukai, T.; Yagi, T. Study on mental stress using near-infrared spectroscopy, electroencephalography, and peripheral arterial tonometry. Annu. Int. Conf. IEEE Eng. Med. Biol. Soc. 2008, 2008, 4992–4995. [Google Scholar] [CrossRef]
- Nagasawa, Y.; Ishida, M.; Komuro, Y.; Ushioda, S.; Hu, L.; Sakatani, K. Relationship between cerebral blood oxygenation and electrical activity during mental stress tasks: Simultaneous measurements of NIRS and EEG. Adv. Exp. Med. Biol. 2020, 1232, 99–104. [Google Scholar] [CrossRef]
- Asano, T.; Mitsukura, Y. Evaluation of stress accumulation using the EEG and NIRS. In Proceedings of the 2017 IEEE International Symposium on Signal Processing and Information Technology (ISSPIT), Bilbao, Spain, 18–20 December 2017. [Google Scholar] [CrossRef]
- Tanida, M.; Katsuyama, M.; Sakatani, K. Effects of fragrance administration on stress-induced prefrontal cortex activity and sebum secretion in the facial skin. Neurosci. Lett. 2008, 432, 157–161. [Google Scholar] [CrossRef]
- Tanida, M.; Katsuyama, M.; Sakatani, K. Relation between mental stress-induced prefrontal cortex activity and skin conditions: A near-infrared spectroscopy study. Brain Res. 2007, 1184, 210–216. [Google Scholar] [CrossRef] [PubMed]
- Seghier, M.L. Laterality index in functional MRI: Methodological issues. Magn. Reson. Imaging. 2008, 26, 594–601. [Google Scholar] [CrossRef] [PubMed]
- Muir, R.T.; Lam, B.; Honjo, K.; Harry, R.D.; McNeely, A.A.; Gao, F.Q.; Ramirez, J.; Scott, C.J.M.; Ganda, A.; Zhao, J.; et al. Trail making test elucidates neural substrates of specific poststroke executive dysfunctions. Stroke 2015, 46, 2755–2761. [Google Scholar] [CrossRef] [PubMed] [Green Version]
- Tombaugh, T.N. Trail making test A and B: Normative data stratified by age and education. Arch. Clin. Neuropsychol. 2004, 19, 203–214. [Google Scholar] [CrossRef]
- Giovagnoli, A.R.; Pesce, M.D.; Mascheroni, S.; Simoncelli, M.; Laiacona, M.; Capitani, E. Trail making test: Normative values from 287 normal adult controls. Ital. J. Neurol. Sci. 1996, 17, 305–309. [Google Scholar] [CrossRef]
- Lin, Z.; Tam, F.; Churchill, N.W.; Lin, F.H.; MacIntosh, B.J.; Schweizer, T.A.; Graham, S.J. Trail making test performance using a touch-sensitive tablet: Behavioral kinematics and electroencephalography. Front. Hum. Neurosci. 2021, 15, 663463. [Google Scholar] [CrossRef]
- Arakawa, T.; Hibi, R.; Fujishiro, T. Psychophysical assessment of a driver’s mental state in autonomous vehicles. Transp. Res. A Policy Pract. 2019, 124, 587–610. [Google Scholar] [CrossRef]
- Komuro, Y.; Sato, Y.; Lin, L.; Tang, Z.; Hu, L.; Sakatani, K. Reliability of wearable two channel CW-NIRS in measurements of brain function. Adv. Exp. Med. Biol. 2018, 1072, 301–305. [Google Scholar] [CrossRef]
- Takai, N.; Yamaguchi, M.; Aragaki, T.; Eto, K.; Uchihashi, K.; Nishikawa, Y. Effect of psychological stress on the salivary cortisol and amylase levels in healthy young adults. Arch. Oral Biol. 2004, 49, 963–968. [Google Scholar] [CrossRef]
- Nater, U.M.; La Marca, R.; Florin, L.; Moses, A.; Langhans, W.; Koller, M.M.; Ehlert, U. Stress-induced changes in human salivary alpha-amylase activity—associations with adrenergic activity. Psychoneuroendocrinology 2006, 31, 49–58. [Google Scholar] [CrossRef]
- Gaudino, E.A.; Geisler, M.W.; Squires, N.K. Construct validity in the trail making test: What makes part B harder? J. Clin. Exp. Neuropsychol. 1995, 17, 529–535. [Google Scholar] [CrossRef] [PubMed]
- Schroeter, M.L.; Zysset, S.; Kruggel, F.; von Cramon, D.Y. Age dependency of the hemodynamic response as measured by functional near-infrared spectroscopy. Neuroimage 2003, 19, 555–564. [Google Scholar] [CrossRef]
- Ichikawa, H.; Kitazono, J.; Nagata, K.; Manda, A.; Shimamura, K.; Sakuta, R.; Okada, M.; Yamaguchi, M.K.; Kanazawa, S.; Kakigi, R. Novel method to classify hemodynamic response obtained using multi-channel fNIRS measurements into two groups: Exploring the combinations of channels. Front. Hum. Neurosci. 2014, 8, 480. [Google Scholar] [CrossRef] [PubMed] [Green Version]
- Brugnera, A.; Zarbo, C.; Adorni, R.; Tasca, G.A.; Rabboni, M.; Bondi, E.; Compare, A.; Sakatani, K. Cortical and cardiovascular responses to acute stressors and their relations with psychological distress. Int. J. Psychophysiol. 2017, 114, 38–46. [Google Scholar] [CrossRef]
- Mandel, A.L.; des Gachons, C.P.; Plank, K.L.; Alarcon, S.; Breslin, P.A.S. Individual differences in AMY1 gene copy number, salivary α-amylase levels, and the perception of oral starch. PLoS ONE 2010, 5, e13352. [Google Scholar] [CrossRef] [PubMed]


| Salivary Amylase (KIU/L) | TMT-A (Time) | TMT-B (Time) | TMT-C (Time) | |
|---|---|---|---|---|
| First measurement | 17.2 ± 9.1 | 16.7 ± 3.3 | 24.2 ± 5.4 | 29.9 ± 1.2 |
| Second measurement | 23.9 ± 12.8 | 15.9 ± 2.1 | 23.2 ± 4.1 | 29.0 ± 2.2 |
| Third measurement | 17.8 ± 14.3 | 16.0 ± 2.1 | 22.8 ± 4.2 | 27.2 ± 3.6 |
| Fourth measurement | 15.4 ± 13.8 | 16.4 ± 2.5 | 23.7 ± 7.2 | 28.0 ± 3.0 |
| TMT-A Left | TMT-B Left | TMT-C Left | TMT-A Right | TMT-B Right | TMT-C Right | |
|---|---|---|---|---|---|---|
| First measurement | 0.063 | 0.424 | 0.256 | 0.063 | 0.277 | 0.148 |
| Second measurement | 0.358 | 0.315 | 0.417 | 0.342 | 0.373 | 0.613 * |
| Third measurement | 0.031 | −0.159 | 0.226 | −0.191 | −0.416 | 0.123 |
| Fourth measurement | 0.295 | 0.123 | 0.374 | −0.044 | −0.182 | 0.143 |
| TMT-A Left | TMT-B Left | TMT-C Left | TMT-A Right | TMT-B Right | TMT-C Right | |
|---|---|---|---|---|---|---|
| 1–2 | −0.304 | −0.157 | 0.188 | 0.053 | 0.039 | 0.486 |
| 2–3 | −0.006 | 0.265 | 0.762 ** | −0.032 | −0.189 | 0.602 ** |
| 3–4 | 0.252 | 0.126 | 0.663 ** | 0.014 | −0.310 | 0.242 |
| LI (First) | LI (Second) | LI (Third) | LI (Fourth) | LI (1–2) | LI (2–3) | LI (3–4) | |
|---|---|---|---|---|---|---|---|
| TMT-A | 0.109 | 0.539 * | 0.059 | 0.032 | 0.469 | 0.637 * | 0.134 |
| TMT-B | 0.090 | 0.172 | −0.347 | 0.117 | 0.140 | 0.349 | −0.074 |
| TMT-C | 0.108 | 0.142 | −0.133 | −0.036 | 0.075 | −0.079 | 0.069 |
Publisher’s Note: MDPI stays neutral with regard to jurisdictional claims in published maps and institutional affiliations. |
© 2022 by the authors. Licensee MDPI, Basel, Switzerland. This article is an open access article distributed under the terms and conditions of the Creative Commons Attribution (CC BY) license (https://creativecommons.org/licenses/by/4.0/).
Share and Cite
Takahashi, S.; Sakurai, N.; Kasai, S.; Kodama, N. Stress Evaluation by Hemoglobin Concentration Change Using Mobile NIRS. Brain Sci. 2022, 12, 488. https://doi.org/10.3390/brainsci12040488
Takahashi S, Sakurai N, Kasai S, Kodama N. Stress Evaluation by Hemoglobin Concentration Change Using Mobile NIRS. Brain Sciences. 2022; 12(4):488. https://doi.org/10.3390/brainsci12040488
Chicago/Turabian StyleTakahashi, Shingo, Noriko Sakurai, Satoshi Kasai, and Naoki Kodama. 2022. "Stress Evaluation by Hemoglobin Concentration Change Using Mobile NIRS" Brain Sciences 12, no. 4: 488. https://doi.org/10.3390/brainsci12040488