
Parietal Gamma Band Oscillation Induced by Self-Hand Recognition

 and
and 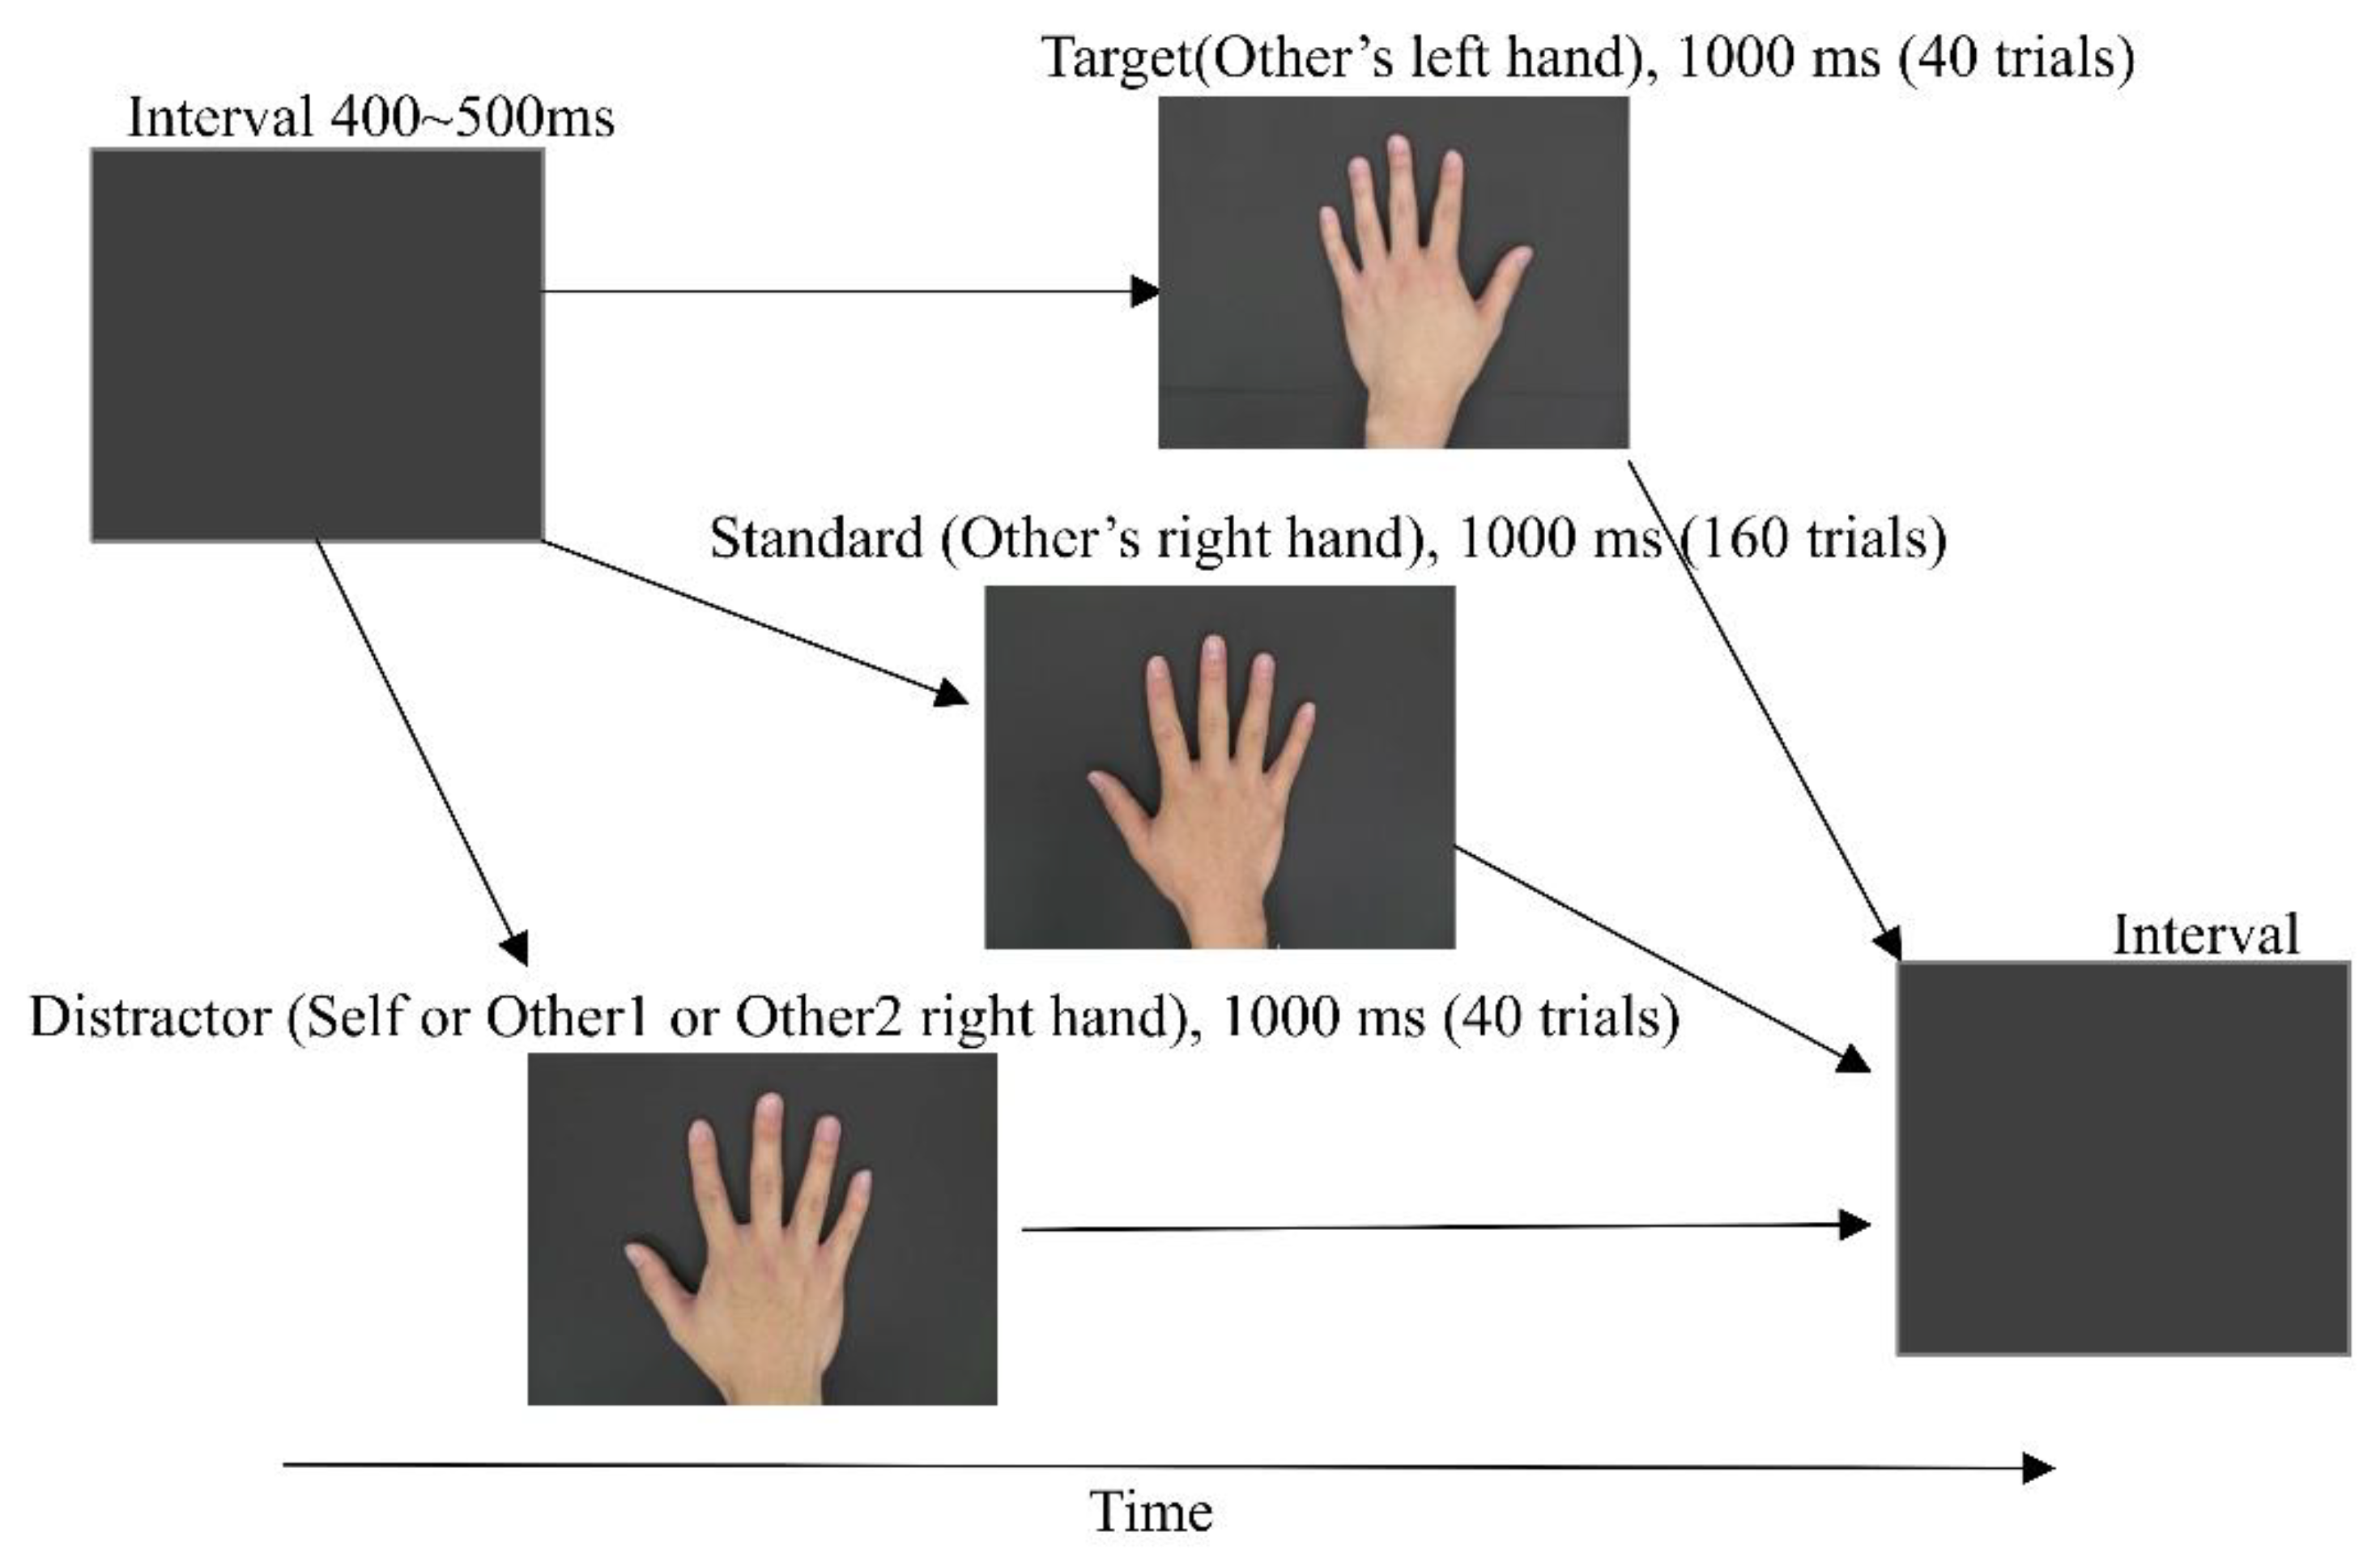
Abstract
:1. Introduction
2. Materials and Methods
2.1. Subjects
2.2. External Stimuli
2.3. ERP Designs
2.4. ERP Recording
2.5. Signal Averaging
2.6. Time-Frequency Analysis
2.7. Statistical Analysis
3. Results
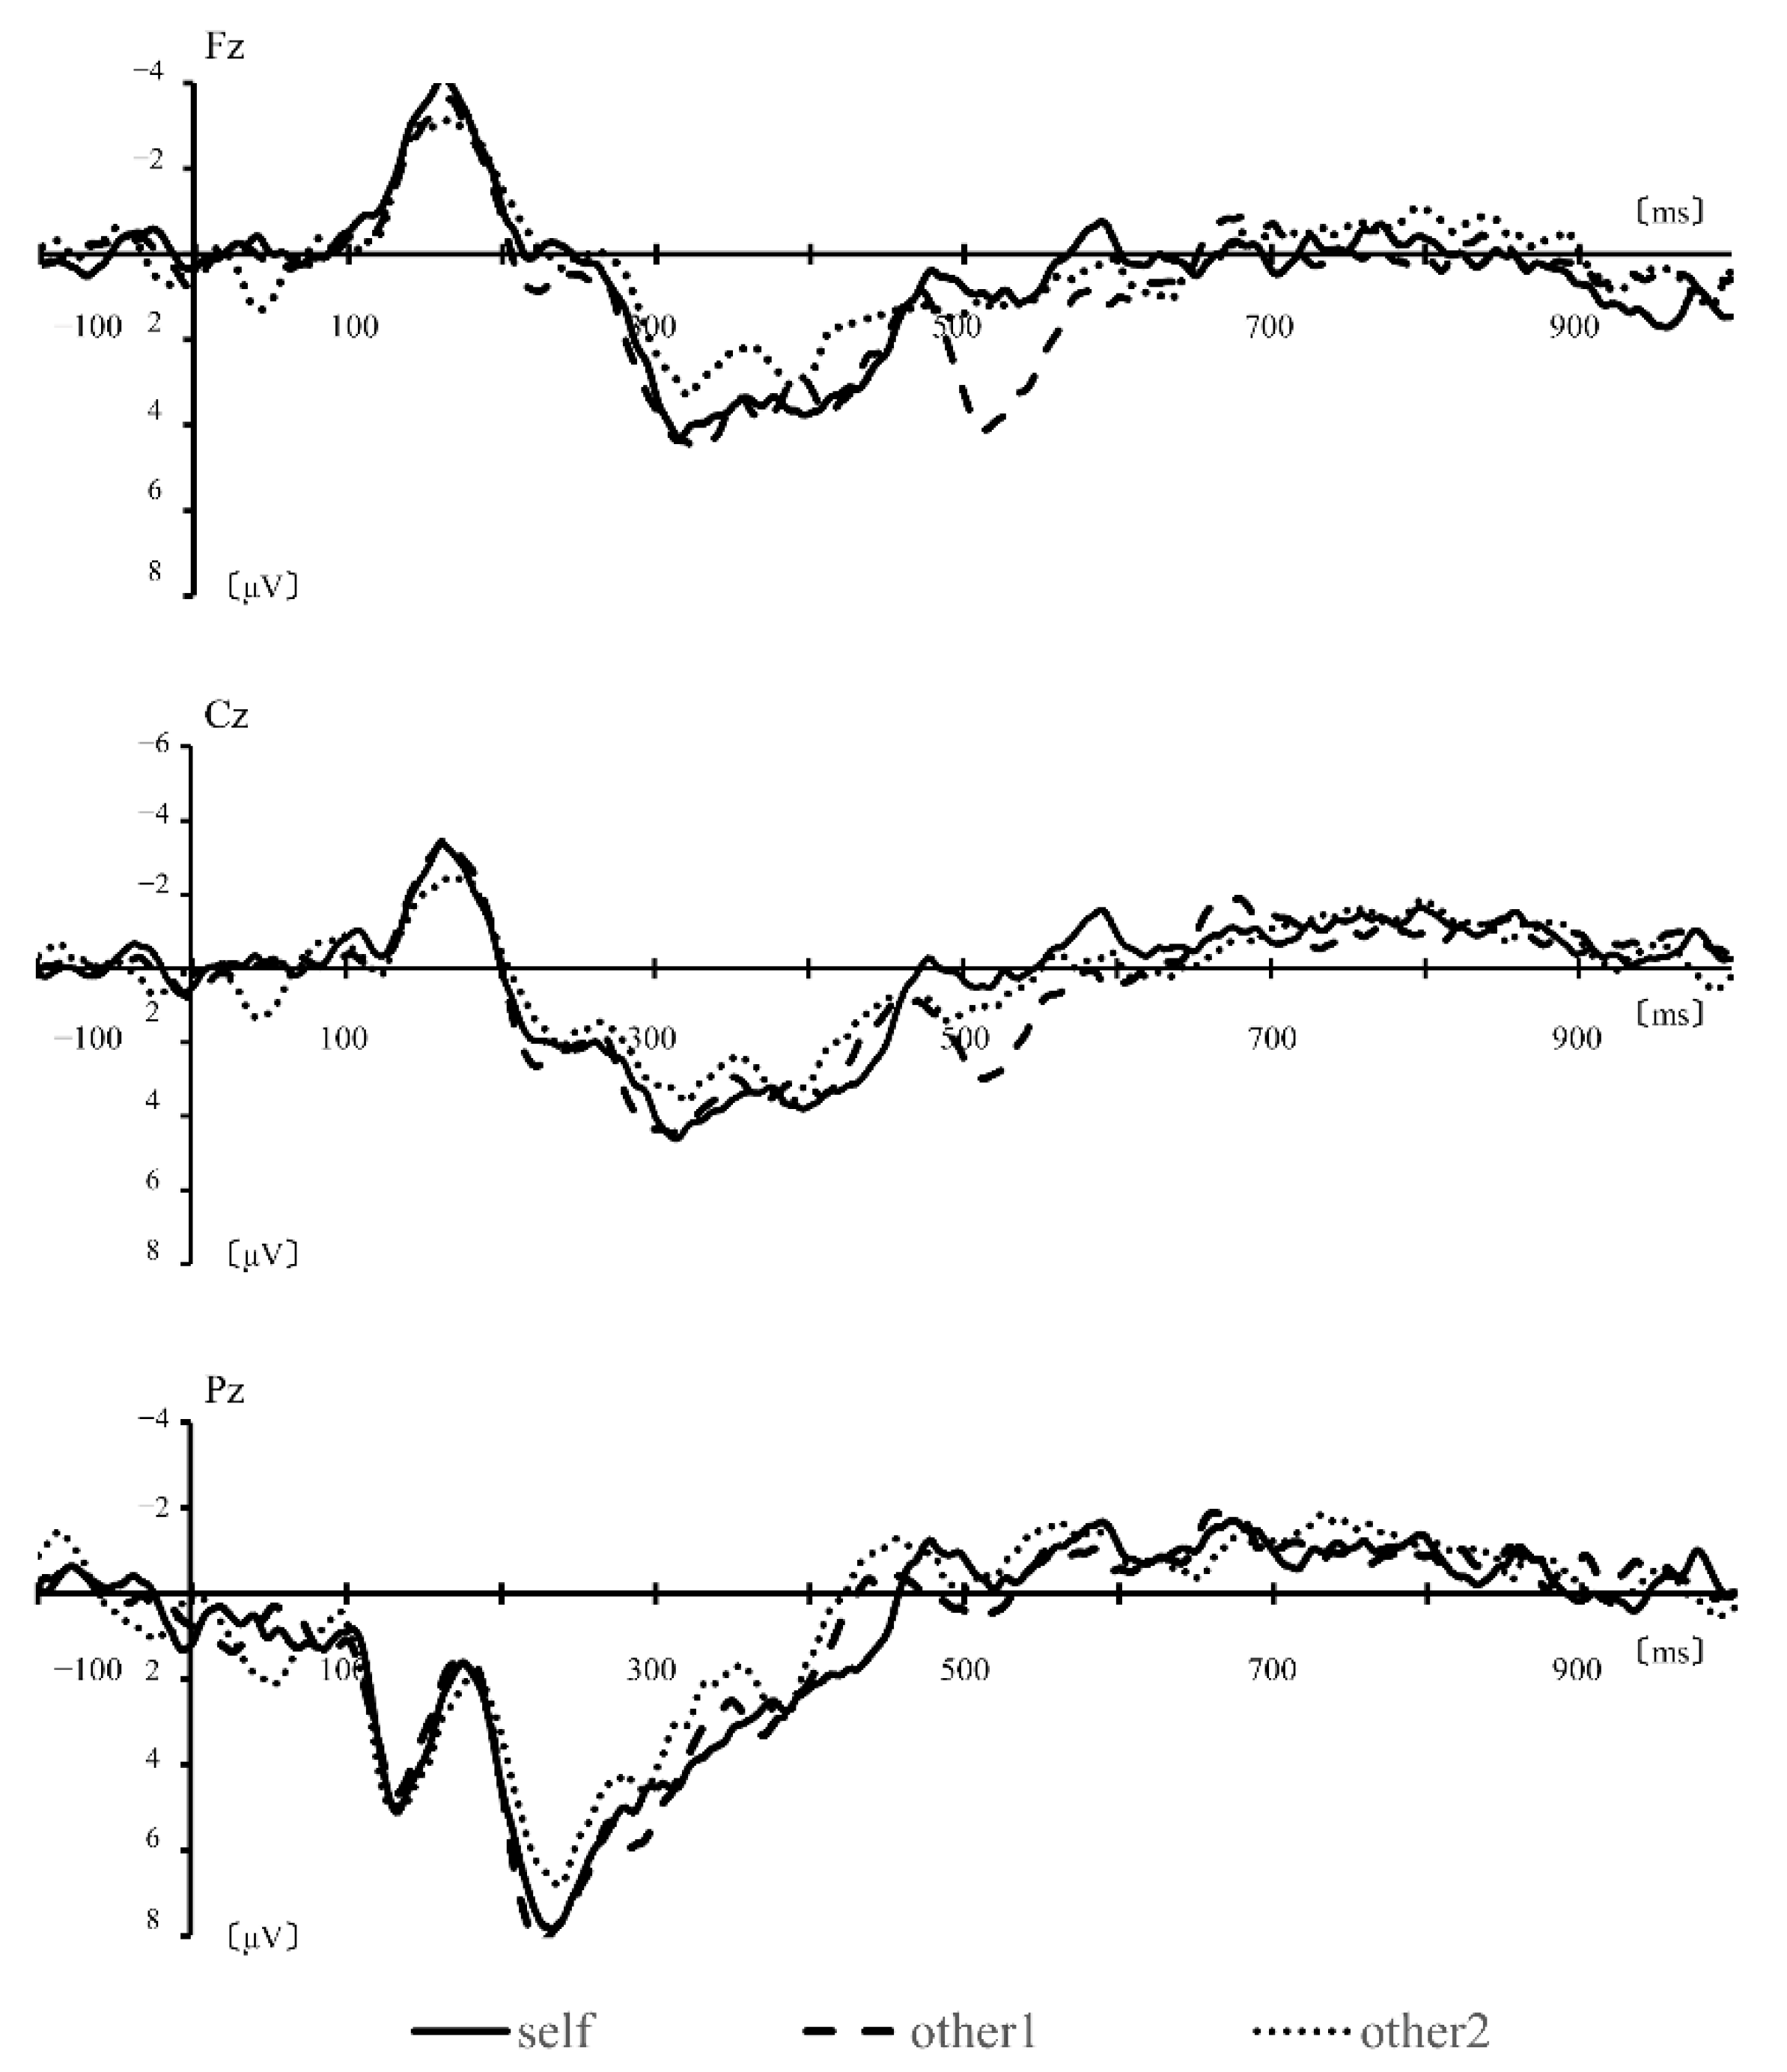
3.1. Simple Averaging Analysis
3.2. Time-Frequency Analysis
4. Discussion
5. Conclusions
Author Contributions
Funding
Institutional Review Board Statement
Informed Consent Statement
Data Availability Statement
Conflicts of Interest
References
- Rogers, T.B.; Kuiper, N.A.; Kirker, W.S. Self-reference and the encoding of personal information. J. Pers. Soc. Psychol. 1977, 35, 677–688. [Google Scholar] [CrossRef]
- Williams, D.M.; Nicholson, T.; Grainger, C. The Self-Reference Effect on Perception: Undiminished in Adults with Autism and No Relation to Autism Traits. Autism Res. 2018, 11, 331–341. [Google Scholar] [CrossRef] [Green Version]
- Yamamoto, K.; Masumoto, K. Brief Report: Memory for Self-Performed Actions in Adults with Autism Spectrum Disorder: Why Does Memory of Self Decline in ASD? J. Autism Dev. Disord. 2018, 48, 3216–3222. [Google Scholar] [CrossRef]
- Fuentes-Claramonte, P.; Martin-Subero, M.; Salgado-Pineda, P.; Santo-Angles, A.; Argila-Plaza, I.; Salavert, J.; Arévalo, A.; Bosque, C.; Sarri, C.; Guerrero-Pedraza, A.; et al. Brain imaging correlates of self- and other-reflection in schizophrenia. Neuroimage Clin. 2020, 25, 102134. [Google Scholar] [CrossRef]
- Green, M.F.; Horan, W.P.; Lee, J. Social cognition in schizophrenia. Nat. Rev. Neurosci. 2015, 16, 620–631. [Google Scholar] [CrossRef]
- Butti, N.; Montirosso, R.; Giusti, L.; Piccinini, L.; Borgatti, R.; Urgesi, C. Early Brain Damage Affects Body Schema and Person Perception Abilities in Children and Adolescents with Spastic Diplegia. Neural. Plast. 2019, 2019, 1678984. [Google Scholar] [CrossRef] [Green Version]
- Candini, M.; Farinelli, M.; Ferri, F.; Avanzi, S.; Cevolani, D.; Gallese, V.; Northoff, G.; Frassinetti, F. Implicit and Explicit Routes to Recognize the Own Body: Evidence from Brain Damaged Patients. Front. Hum. Neurosci. 2016, 10, 405. [Google Scholar] [CrossRef] [Green Version]
- Feinberg, T.E.; Venneri, A.; Simone, A.M.; Fan, Y.; Northoff, G. The neuroanatomy of asomatognosia and somatoparaphrenia. J. Neurol. Neurosurg. Psychiatry 2010, 81, 276–281. [Google Scholar] [CrossRef] [Green Version]
- Vallar, G.; Ronchi, R. Somatoparaphrenia: A body delusion. A review of the neuropsychological literature. Exp. Brain Res. 2009, 192, 533–551. [Google Scholar] [CrossRef]
- Jenkinson, P.M.; Haggard, P.; Ferreira, N.C.; Fotopoulou, A. Body ownership and attention in the mirror: Insights from somatoparaphrenia and the rubber hand illusion. Neuropsychologia 2013, 51, 1453–1462. [Google Scholar] [CrossRef]
- Aoyama, T.; Kaneko, F.; Hayami, T.; Shibata, E. The effects of kinesthetic illusory sensation induced by a visual stimulus on the corticomotor excitability of the leg muscles. Neurosci. Lett. 2012, 514, 106–109. [Google Scholar] [CrossRef]
- Kaneko, F.; Yasojima, T.; Kizuka, T. Kinesthetic illusory feeling induced by a finger movement movie effects on corticomotor excitability. Neuroscience 2007, 149, 976–984. [Google Scholar] [CrossRef]
- Kaneko, F.; Blanchard, C.; Lebar, N.; Nazarian, B.; Kavounoudias, A.; Romaiguère, P. Brain Regions Associated to a Kinesthetic Illusion Evoked by Watching a Video of One’s Own Moving Hand. PLoS ONE 2015, 10, e0131970. [Google Scholar] [CrossRef]
- Bentin, S.; Allison, T.; Puce, A.; Perez, E.; McCarthy, G. Electrophysiological Studies of Face Perception in Humans. J. Cogn. Neurosci. 1996, 8, 551–565. [Google Scholar] [CrossRef] [Green Version]
- Eimer, M. Effects of face inversion on the structural encoding and recognition of faces. Evidence from event-related brain potentials. Brain Res. Cogn. Brain Res. 2000, 10, 145–158. [Google Scholar] [CrossRef]
- Itier, R.J.; Taylor, M.J. N170 or N1? Spatiotemporal differences between object and face processing using ERPs. Cereb. Cortex. 2004, 14, 132–142. [Google Scholar] [CrossRef] [Green Version]
- Gunji, A.; Inagaki, M.; Inoue, Y.; Takeshima, Y.; Kaga, M. Event-related potentials of self-face recognition in children with pervasive developmental disorders. Brain Dev. 2009, 31, 139–147. [Google Scholar] [CrossRef]
- Sui, J.; Zhu, Y.; Han, S. Self-face recognition in attended and unattended conditions: An event-related brain potential study. Neuroreport 2006, 17, 423–427. [Google Scholar] [CrossRef]
- Zhu, M.; Luo, J.; Zhao, N.; Hu, Y.; Yan, L.; Gao, X. The temporal primacy of self-related stimuli and negative stimuli: An ERP-based comparative study. Soc. Neurosci. 2016, 11, 507–514. [Google Scholar] [CrossRef]
- Ishii, R.; Canuet, L.; Aoki, Y.; Hata, M.; Iwase, M.; Ikeda, S.; Nishida, K.; Ikeda, M. Healthy and Pathological Brain Aging: From the Perspective of Oscillations, Functional Connectivity, and Signal Complexity. Neuropsychobiology 2017, 75, 151–161. [Google Scholar] [CrossRef]
- Frassinetti, F.; Maini, M.; Romualdi, S.; Galante, E.; Avanzi, S. Is it mine? Hemispheric asymmetries in corporeal self-recognition. J. Cogn. Neurosci. 2008, 20, 1507–1516. [Google Scholar] [CrossRef]
- Frassinetti, F.; Maini, M.; Benassi, M.; Avanzi, S.; Cantagallo, A.; Farnè, A. Selective impairment of self-body-parts processing in right brain-damaged patients. Cortex 2010, 46, 322–328. [Google Scholar] [CrossRef]
- Sanabria, D.; Madrid, E.; Aranda, C.; Ruz, M. Attentional orienting to own and others’ hands. Exp. Brain Res. 2015, 233, 2347–2355. [Google Scholar] [CrossRef]
- Su, Y.; Chen, A.; Yin, H.; Qiu, J.; Lv, J.; Wei, D.; Tian, F.; Tu, S.; Wang, T. Spatiotemporal cortical activation underlying self-referencial processing evoked by self-hand. Biol. Psychol. 2010, 85, 219–225. [Google Scholar] [CrossRef]
- Berlucchi, G.; Aglioti, S.M. The body in the brain revisited. Exp. Brain Res. 2010, 200, 25–35. [Google Scholar] [CrossRef]
- Giabbiconi, C.M.; Jurilj, V.; Gruber, T.; Vocks, S. Steady-state visually evoked potential correlates of human body perception. Exp. Brain Res. 2016, 234, 3133–3143. [Google Scholar] [CrossRef]
- Meeren, H.K.; de Gelder, B.; Ahlfors, S.P.; Hämäläinen, M.S.; Hadjikhani, N. Different cortical dynamics in face and body perception: An MEG study. PLoS ONE 2013, 8, e71408. [Google Scholar] [CrossRef]
- Myers, A.; Sowden, P.T. Your hand or mine? The extrastriate body area. Neuroimage 2008, 42, 1669–1677. [Google Scholar] [CrossRef] [Green Version]
- Hodzic, A.; Muckli, L.; Singer, W.; Stirn, A. Cortical responses to self and others. Hum. Brain Mapp. 2009, 30, 951–962. [Google Scholar] [CrossRef]
- Bertrand, O.; Tallon-Baudry, C. Oscillatory gamma activity in humans: A possible role for object representation. Int. J. Psychophysiol. 2000, 38, 211–223. [Google Scholar] [CrossRef]
- Pfurtscheller, G. Event-related synchronization (ERS): An electrophysiological correlate of cortical areas at rest. Electroencephalogr. Clin. Neurophysiol. 1992, 83, 62–69. [Google Scholar] [CrossRef]
- Ben-Simon, E.; Podlipsky, I.; Arieli, A.; Zhdanov, A.; Hendler, T. Never resting brain: Simultaneous representation of two alpha related processes in humans. PLoS ONE 2008, 3, e3984. [Google Scholar] [CrossRef] [Green Version]
- Chen, J.L.; Ros, T.; Gruzelier, J.H. Dynamic changes of ICA-derived EEG functional connectivity in the resting state. Hum. Brain Mapp. 2013, 34, 852–868. [Google Scholar] [CrossRef]
- Sadaghiani, S.; Scheeringa, R.; Lehongre, K.; Morillon, B.; Giraud, A.L.; D’Esposito, M.; Kleinschmidt, A.K. α-band phase synchrony is related to activity in the fronto-parietal adaptive control network. J. Neurosci. 2012, 32, 14305–14310. [Google Scholar] [CrossRef]
- Knyazev, G.G. Extraversion and anterior vs. posterior DMN activity during self-referential thoughts. Front. Hum. Neurosci. 2013, 6, 348. [Google Scholar] [CrossRef] [Green Version]
- Foster, B.L.; Dastjerdi, M.; Parvizi, J. Neural populations in human posteromedial cortex display opposing responses during memory and numerical processing. Proc. Natl. Acad. Sci. USA 2012, 109, 15514–15519. [Google Scholar] [CrossRef] [Green Version]
- Mu, Y.; Han, S. Neural oscillations dissociate between self-related attentional orientation versus evaluation. Neuroimage 2013, 67, 247–256. [Google Scholar] [CrossRef]
- Ishii, R.; Canuet, L.; Herdman, A.; Gunji, A.; Iwase, M.; Takahashi, H.; Nakahachi, T.; Hirata, M.; Robinson, S.E.; Pantev, C.; et al. Cortical oscillatory power changes during auditory oddball task revealed by spatially filtered magnetoencephalography. Clin. Neurophysiol. 2009, 120, 497–504. [Google Scholar] [CrossRef]
- Polich, J. Updating P300: An integrative theory of P3a and P3b. Clin. Neurophysiol. 2007, 118, 2128–2148. [Google Scholar] [CrossRef] [Green Version]
- Hoechstetter, K.; Bornfleth, H.; Weckesser, D.; Ille, N.; Berg, P.; Scherg, M. BESA source coherence: A new method to study cortical oscillatory coupling. Brain Topogr. 2004, 16, 233–238. [Google Scholar] [CrossRef]
- Maris, E.; Oostenveld, R. Nonparametric statistical testing of EEG- and MEG-data. J. Neurosci. Methods 2007, 164, 177–190. [Google Scholar] [CrossRef] [PubMed]
- Maris, E. Statistical testing in electrophysiological studies. Psychophysiology 2012, 49, 549–565. [Google Scholar] [CrossRef] [PubMed]
- Romero, R.; Polich, J. P3(00) habituation from auditory and visual stimuli. Physiol Behav. 1996, 59, 517–522. [Google Scholar] [CrossRef]
- Iijima, M.; Mase, R.; Osawa, M.; Shimizu, S.; Uchiyama, S. Event-Related Synchronization and Desynchronization of High-Frequency Electroencephalographic Activity during a Visual Go/No-Go Paradigm. Neuropsychobiology 2015, 71, 17–24. [Google Scholar] [CrossRef] [PubMed]
- Ikeda, S.; Mizuno-Matsumoto, Y.; Canuet, L.; Ishii, R.; Aoki, Y.; Hata, M.; Katsimichas, T.; Pascual-Marqui, R.D.; Hayashi, T.; Okamoto, E.; et al. Emotion Regulation of Neuroticism: Emotional Information Processing Related to Psychosomatic State Evaluated by Electroencephalography and Exact Low-Resolution Brain Electromagnetic Tomography. Neuropsychobiology 2015, 71, 34–41. [Google Scholar] [CrossRef] [PubMed] [Green Version]
- Darvas, F.; Rao, R.P.; Murias, M. Localized high gamma motor oscillations respond to perceived biologic motion. J. Clin. Neurophysiol. 2013, 30, 299–307. [Google Scholar] [CrossRef] [Green Version]
- Smith, M.M.; Weaver, K.E.; Grabowski, T.J.; Rao, R.P.; Darvas, F. Non-invasive detection of high gamma band activity during motor imagery. Front. Hum. Neurosci. 2014, 8, 817. [Google Scholar] [CrossRef]
- Ball, T.; Demandt, E.; Mutschler, I.; Neitzel, E.; Mehring, C.; Vogt, K.; Aertsen, A.; Schulze-Bonhage, A. Movement related activity in the high gamma range of the human EEG. Neuroimage 2008, 41, 302–310. [Google Scholar] [CrossRef]
- Darvas, F.; Scherer, R.; Ojemann, J.G.; Rao, R.P.; Miller, K.J.; Sorensen, L.B. High gamma mapping using EEG. Neuroimage 2010, 49, 930–938. [Google Scholar] [CrossRef] [Green Version]
- de Lange, F.P.; Jensen, O.; Bauer, M.; Toni, I. Interactions between posterior gamma and frontal alpha/beta oscillations during imagined actions. Front. Hum. Neurosci. 2008, 2, 7. [Google Scholar] [CrossRef] [Green Version]
- van Wijk, B.C.; Litvak, V.; Friston, K.J.; Daffertshofer, A. Nonlinear coupling between occipital and motor cortex during motor imagery: A dynamic causal modeling study. Neuroimage 2013, 71, 104–113. [Google Scholar] [CrossRef]
- Alzueta, E.; Melcón, M.; Jensen, O.; Capilla, A. The ‘Narcissus Effect’: Top-down alpha-beta band modulation of face-related brain areas during self-face processing. Neuroimage 2020, 213, 116754. [Google Scholar] [CrossRef]
- Miyakoshi, M.; Kanayama, N.; Iidaka, T.; Ohira, H. EEG evidence of face-specific visual self-representation. Neuroimage 2010, 50, 1666–1675. [Google Scholar] [CrossRef] [PubMed]
- Kang, J.H.; Kim, S.J.; Cho, Y.S.; Kim, S.P. Modulation of Alpha Oscillations in the Human EEG with Facial Preference. PLoS ONE 2015, 10, e0138153. [Google Scholar] [CrossRef] [PubMed]
- Park, J.; Kim, H.; Sohn, J.W.; Choi, J.R.; Kim, S.P. EEG Beta Oscillations in the Temporoparietal Area Related to the Accuracy in Estimating Others’ Preference. Front. Hum. Neurosci. 2018, 12, 43. [Google Scholar] [CrossRef] [Green Version]
- Cramer, S.C.; Orr, E.L.; Cohen, M.J.; Lacourse, M.G. Effects of motor imagery training after chronic, complete spinal cord injury. Exp. Brain Res. 2007, 177, 233–242. [Google Scholar] [CrossRef] [PubMed] [Green Version]
- Page, S.J.; Levine, P.; Leonard, A. Mental practice in chronic stroke: Results of a randomized, placebo-controlled trial. Stroke 2007, 38, 1293–1297. [Google Scholar] [CrossRef] [Green Version]
- Inada, T.; Kaneko, F.; Hayami, T. Effect of kinesthetic illusion induced by visual stimulation on muscular output function after short-term immobilization. J. Electromyogr. Kinesiol. 2016, 27, 66–72. [Google Scholar] [CrossRef]


Publisher’s Note: MDPI stays neutral with regard to jurisdictional claims in published maps and institutional affiliations. |
© 2022 by the authors. Licensee MDPI, Basel, Switzerland. This article is an open access article distributed under the terms and conditions of the Creative Commons Attribution (CC BY) license (https://creativecommons.org/licenses/by/4.0/).
Share and Cite
Ueda, M.; Ueno, K.; Inamoto, T.; Shiroma, C.; Hata, M.; Ishii, R.; Naito, Y. Parietal Gamma Band Oscillation Induced by Self-Hand Recognition. Brain Sci. 2022, 12, 272. https://doi.org/10.3390/brainsci12020272
Ueda M, Ueno K, Inamoto T, Shiroma C, Hata M, Ishii R, Naito Y. Parietal Gamma Band Oscillation Induced by Self-Hand Recognition. Brain Sciences. 2022; 12(2):272. https://doi.org/10.3390/brainsci12020272
Chicago/Turabian StyleUeda, Masaya, Keita Ueno, Takashi Inamoto, China Shiroma, Masahiro Hata, Ryouhei Ishii, and Yasuo Naito. 2022. "Parietal Gamma Band Oscillation Induced by Self-Hand Recognition" Brain Sciences 12, no. 2: 272. https://doi.org/10.3390/brainsci12020272