Author Contributions
Conceptualization, I.H., and S.-J.P.; methodology, I.H., and S.-J.P.; software, I.H.; validation, I.H., and S.-J.P.; formal analysis, I.H.; investigation, I.H.; resources, S.-J.P.; data curation, I.H.; writing—original draft preparation, I.H.; writing—review and editing, I.H., S.-J.P.; visualization, I.H.; supervision, S.-J.P.; project administration, S.-J.P.; funding acquisition, S.-J.P. All authors have read and agreed to the published version of the manuscript.
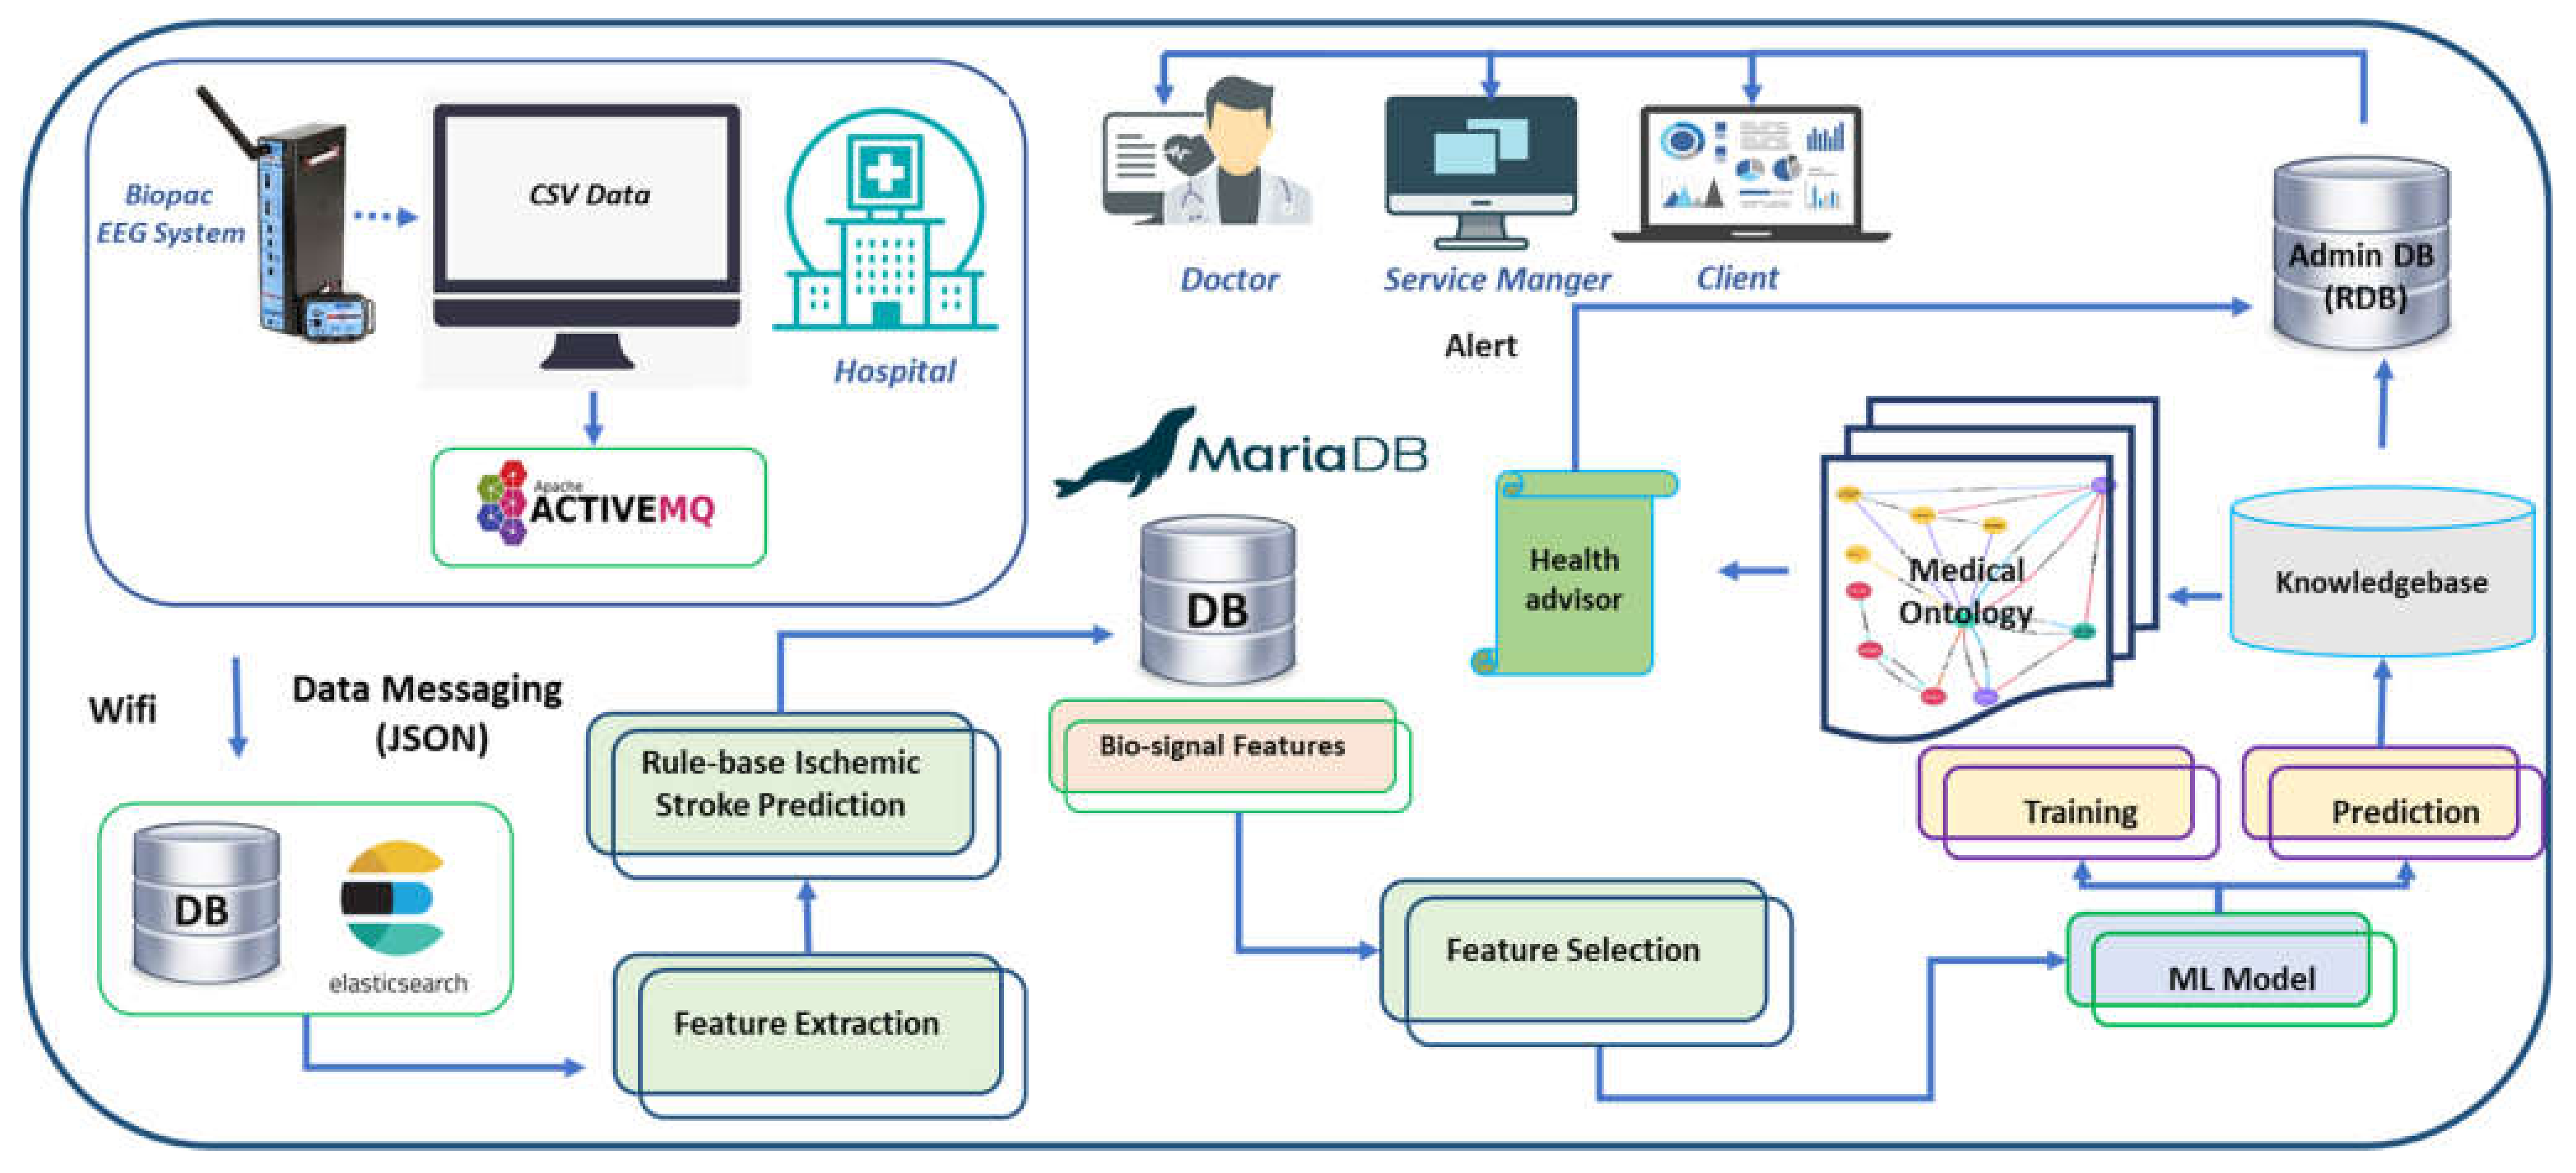
Figure 1.
The architecture of the data acquisition framework of the stroke patient monitoring system. Wireless EEG device sends the brainwave of the patients to a nearby computer through Bluetooth communication. EEG data is initially stored in CSV format and then converted to JSON format. An API transfers JSON format EEG HL7 V2 messages to the webserver using ActiveMQ. Feature extraction algorithms extract the neurological features, and rule-based disease prediction labels the data with the possible diseases. The machine-learning model learns and predicts the neural impairment status. Hospitals and clients can monitor the signals and access the health advice through their dedicated portals.
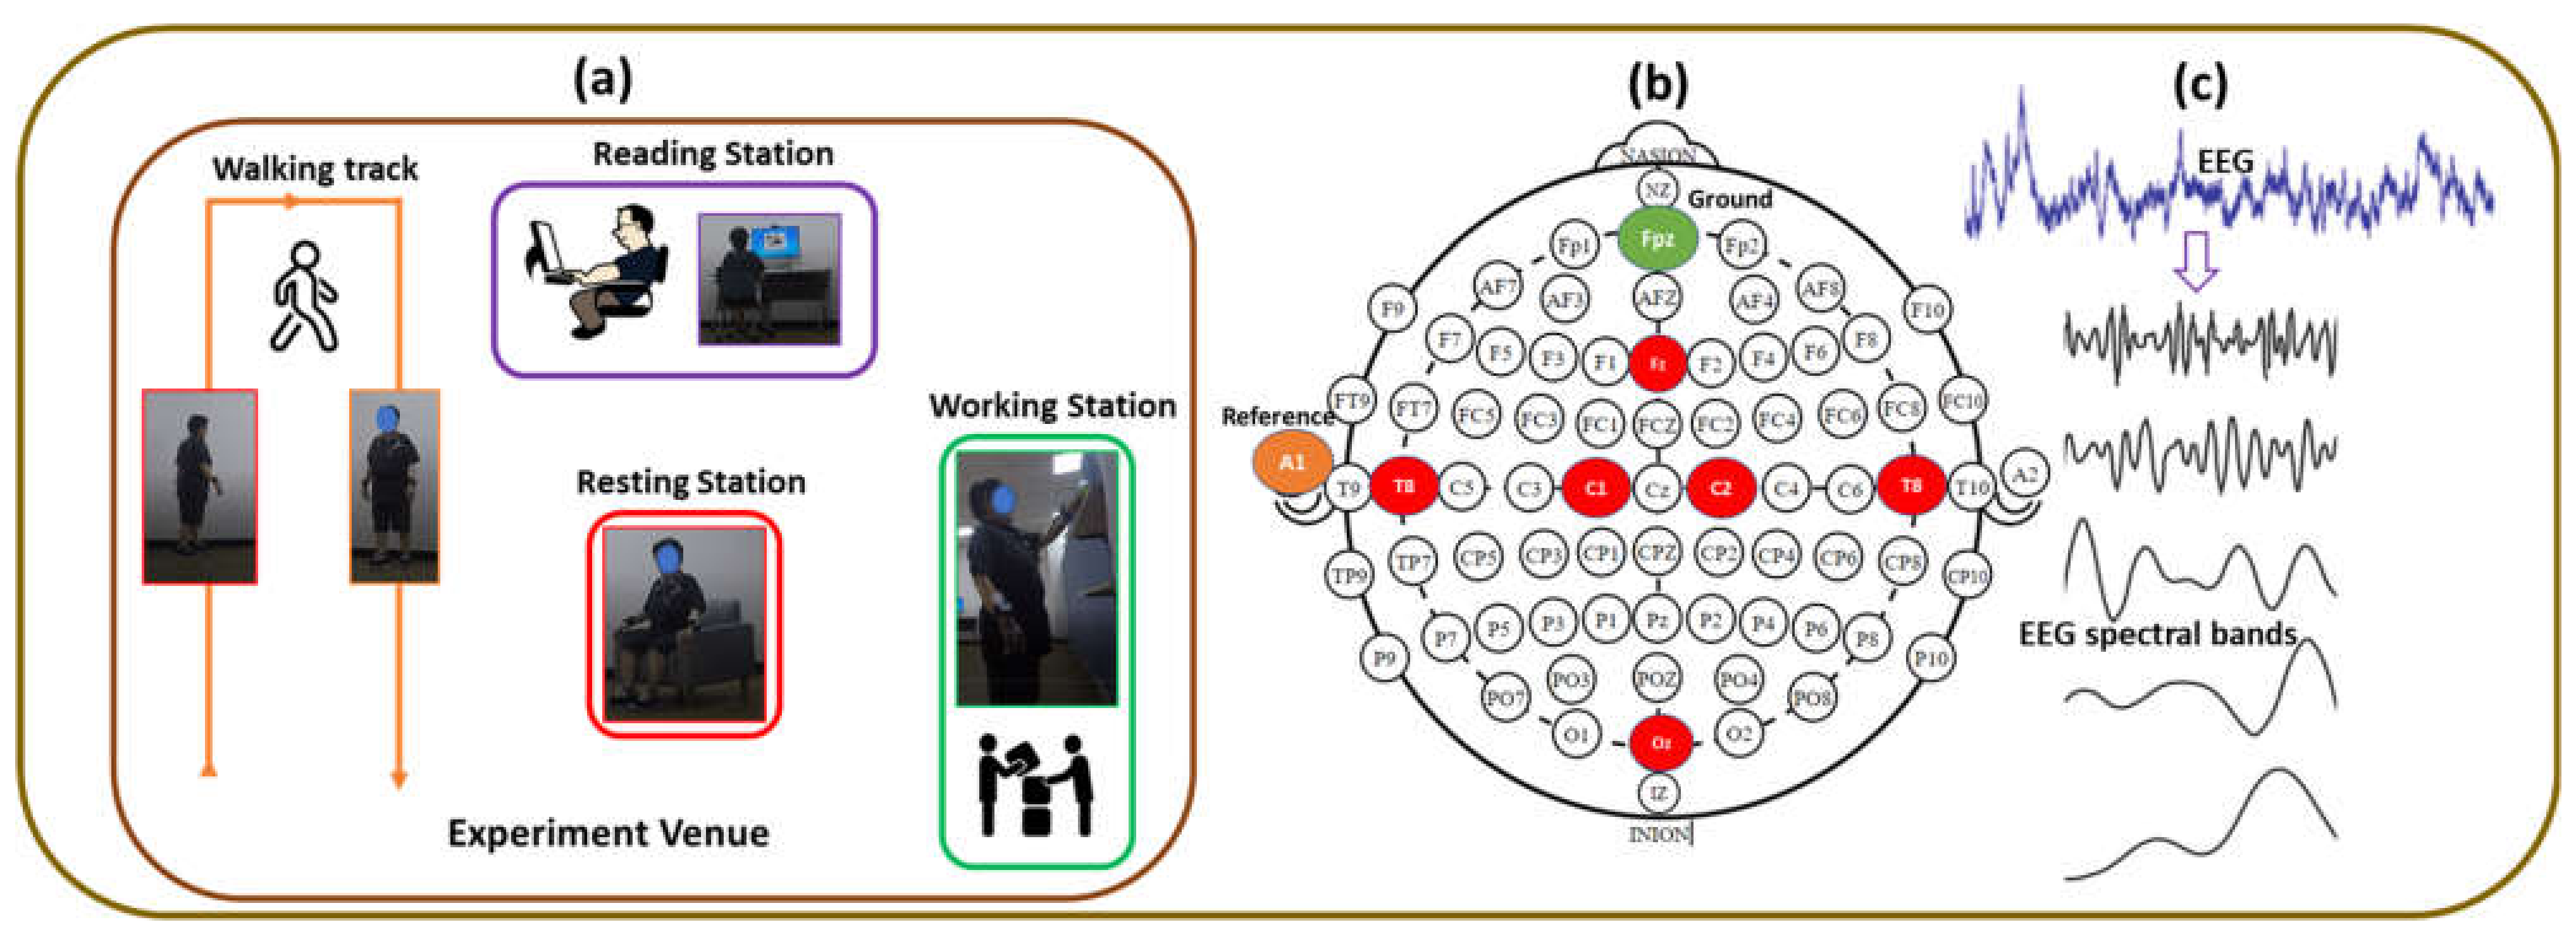
Figure 2.
EEG Signal Processing and electrode positions and layout. (a) Experimental scenario, (b) six-channel EEG, reference and ground electrodes position based on Standard 10–20 EEG system, (c) EEG Signal Processing.
Figure 2.
EEG Signal Processing and electrode positions and layout. (a) Experimental scenario, (b) six-channel EEG, reference and ground electrodes position based on Standard 10–20 EEG system, (c) EEG Signal Processing.
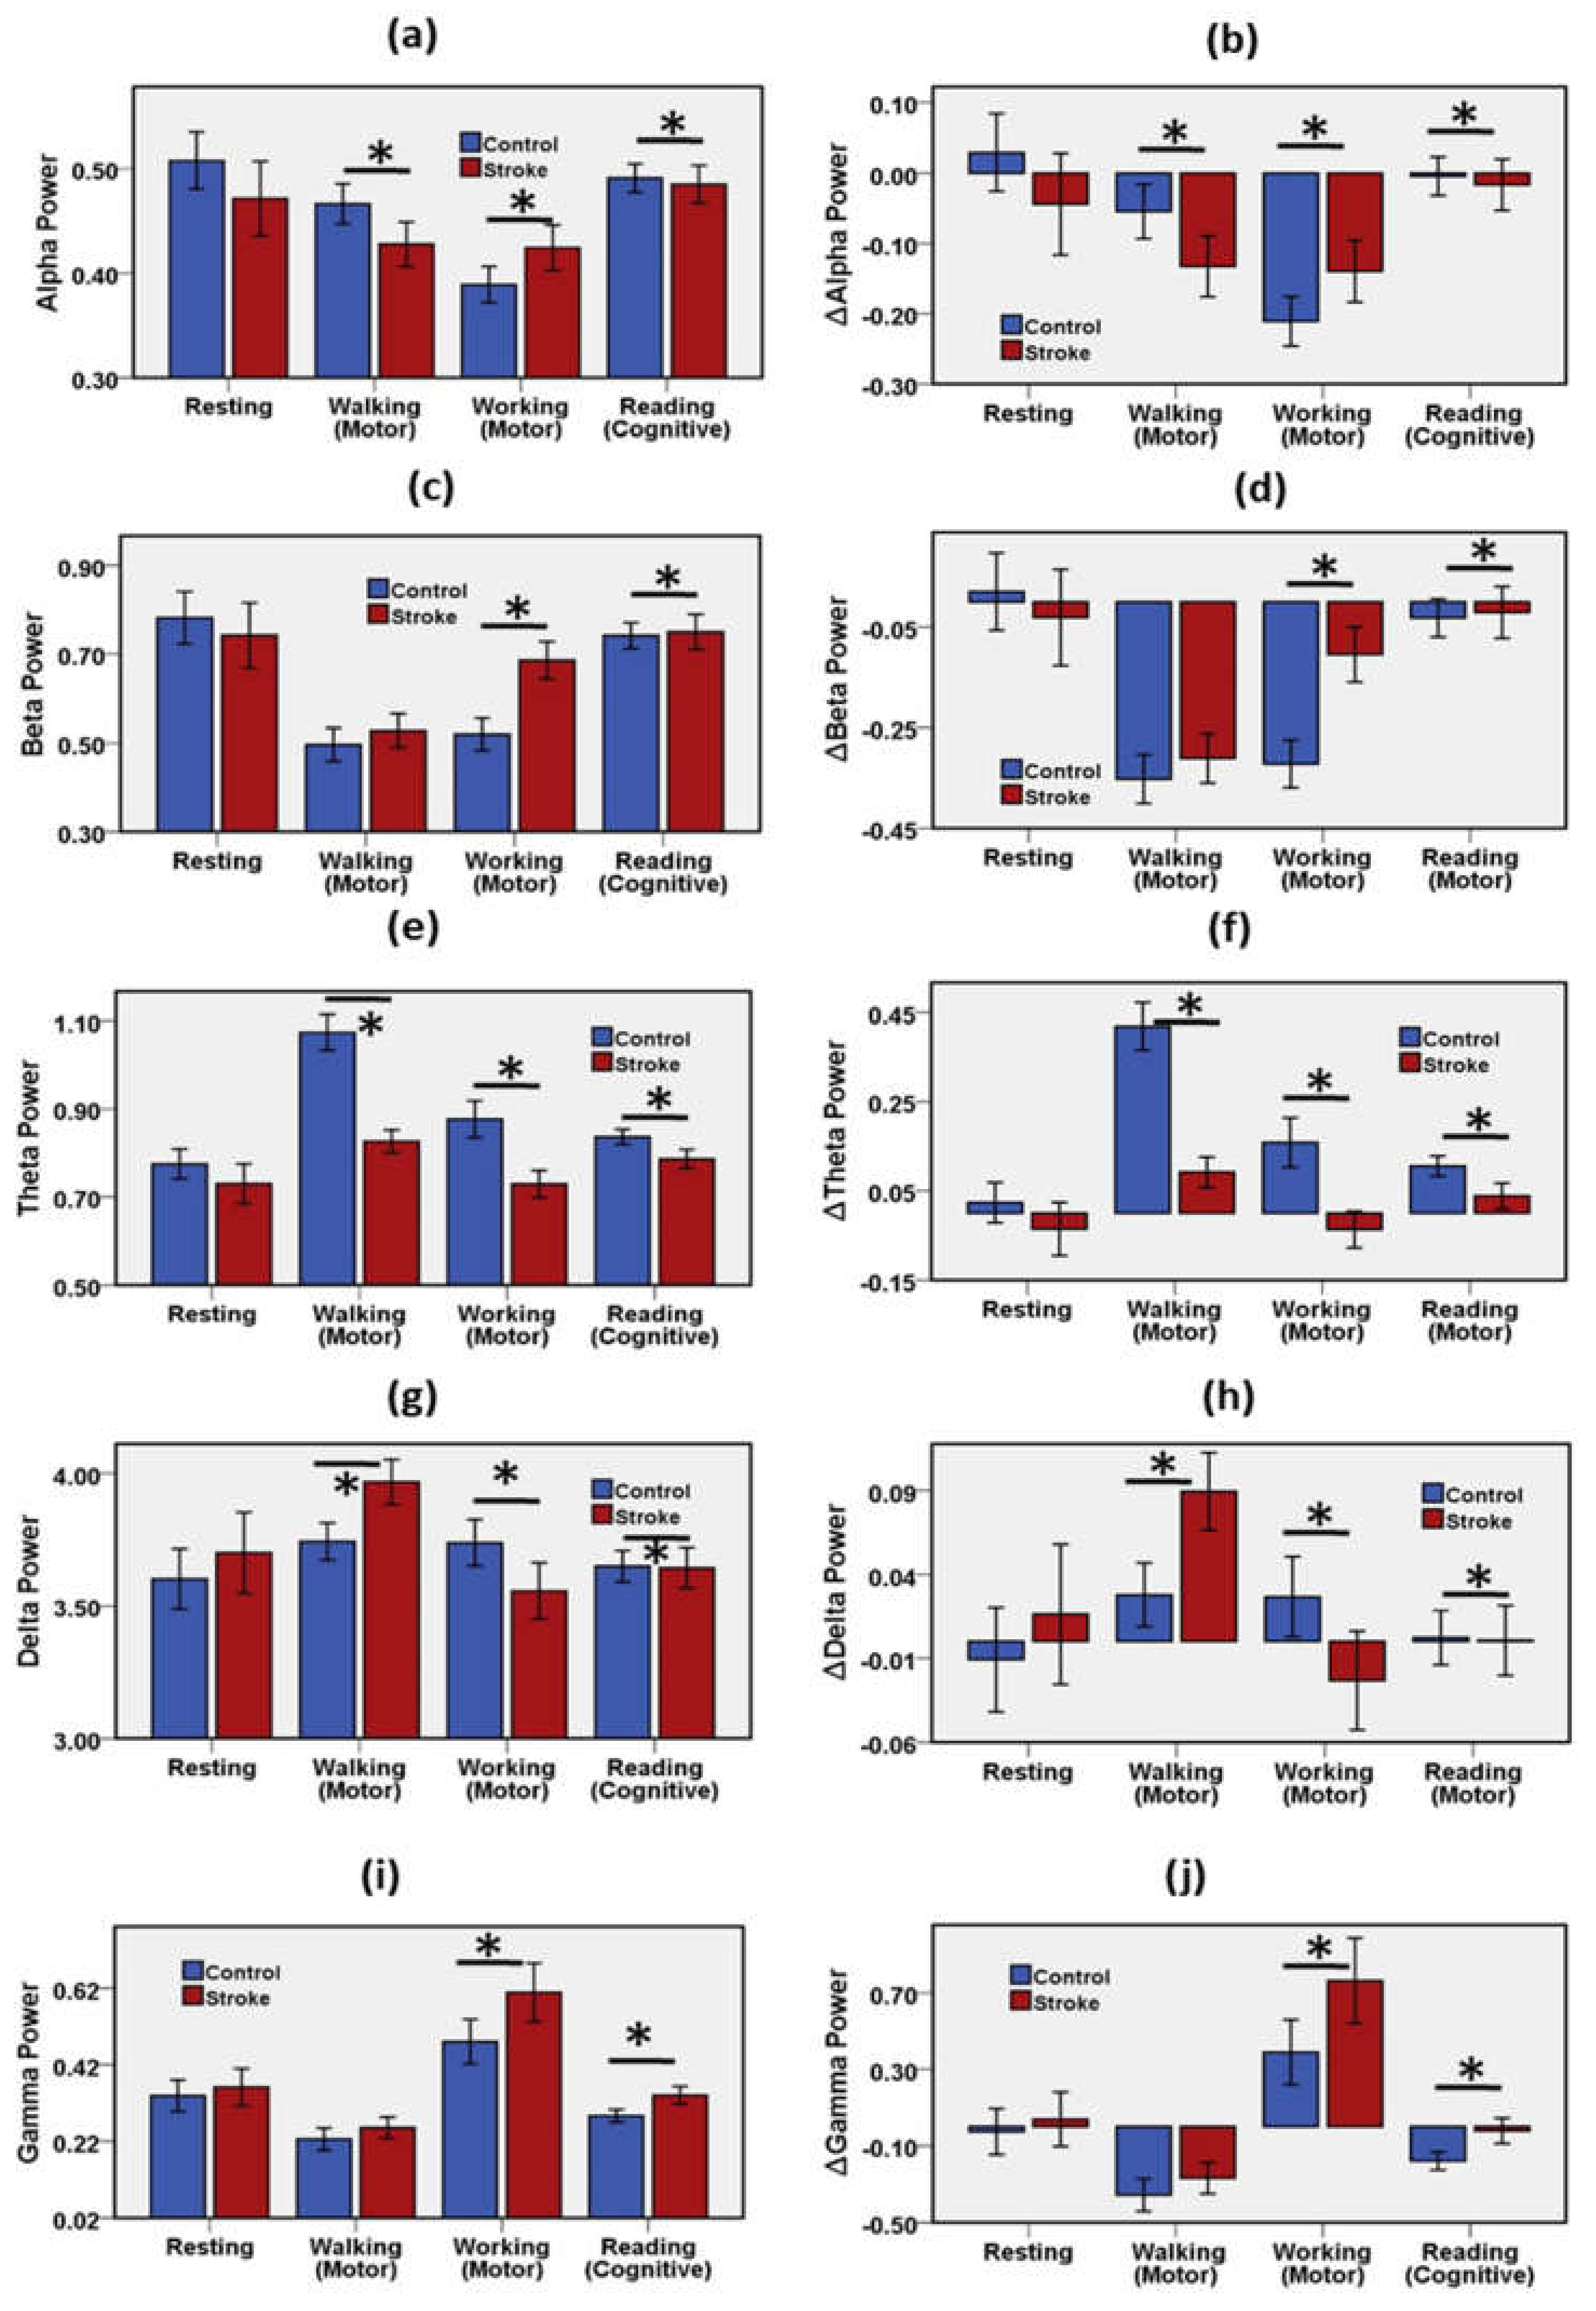
Figure 3.
Mean and error bar of (a) RP Alpha, (b) change of Alpha relative to baseline, (c) RP Beta, (d) change of Beta relative to baseline, (e) RP Theta, (f) change of Theta relative to baseline, (g) RP Delta, (h) change of Delta relative to baseline, (i) RP Gamma, (j) change of Gamma relative to the baseline of the stroke group and the control group during resting, motor, and cognitive tasks. Error bar shows 95% confidence interval. * (p < 0.05) indicates a significant difference. Resting state was considered as baseline. RP = Relative Power.
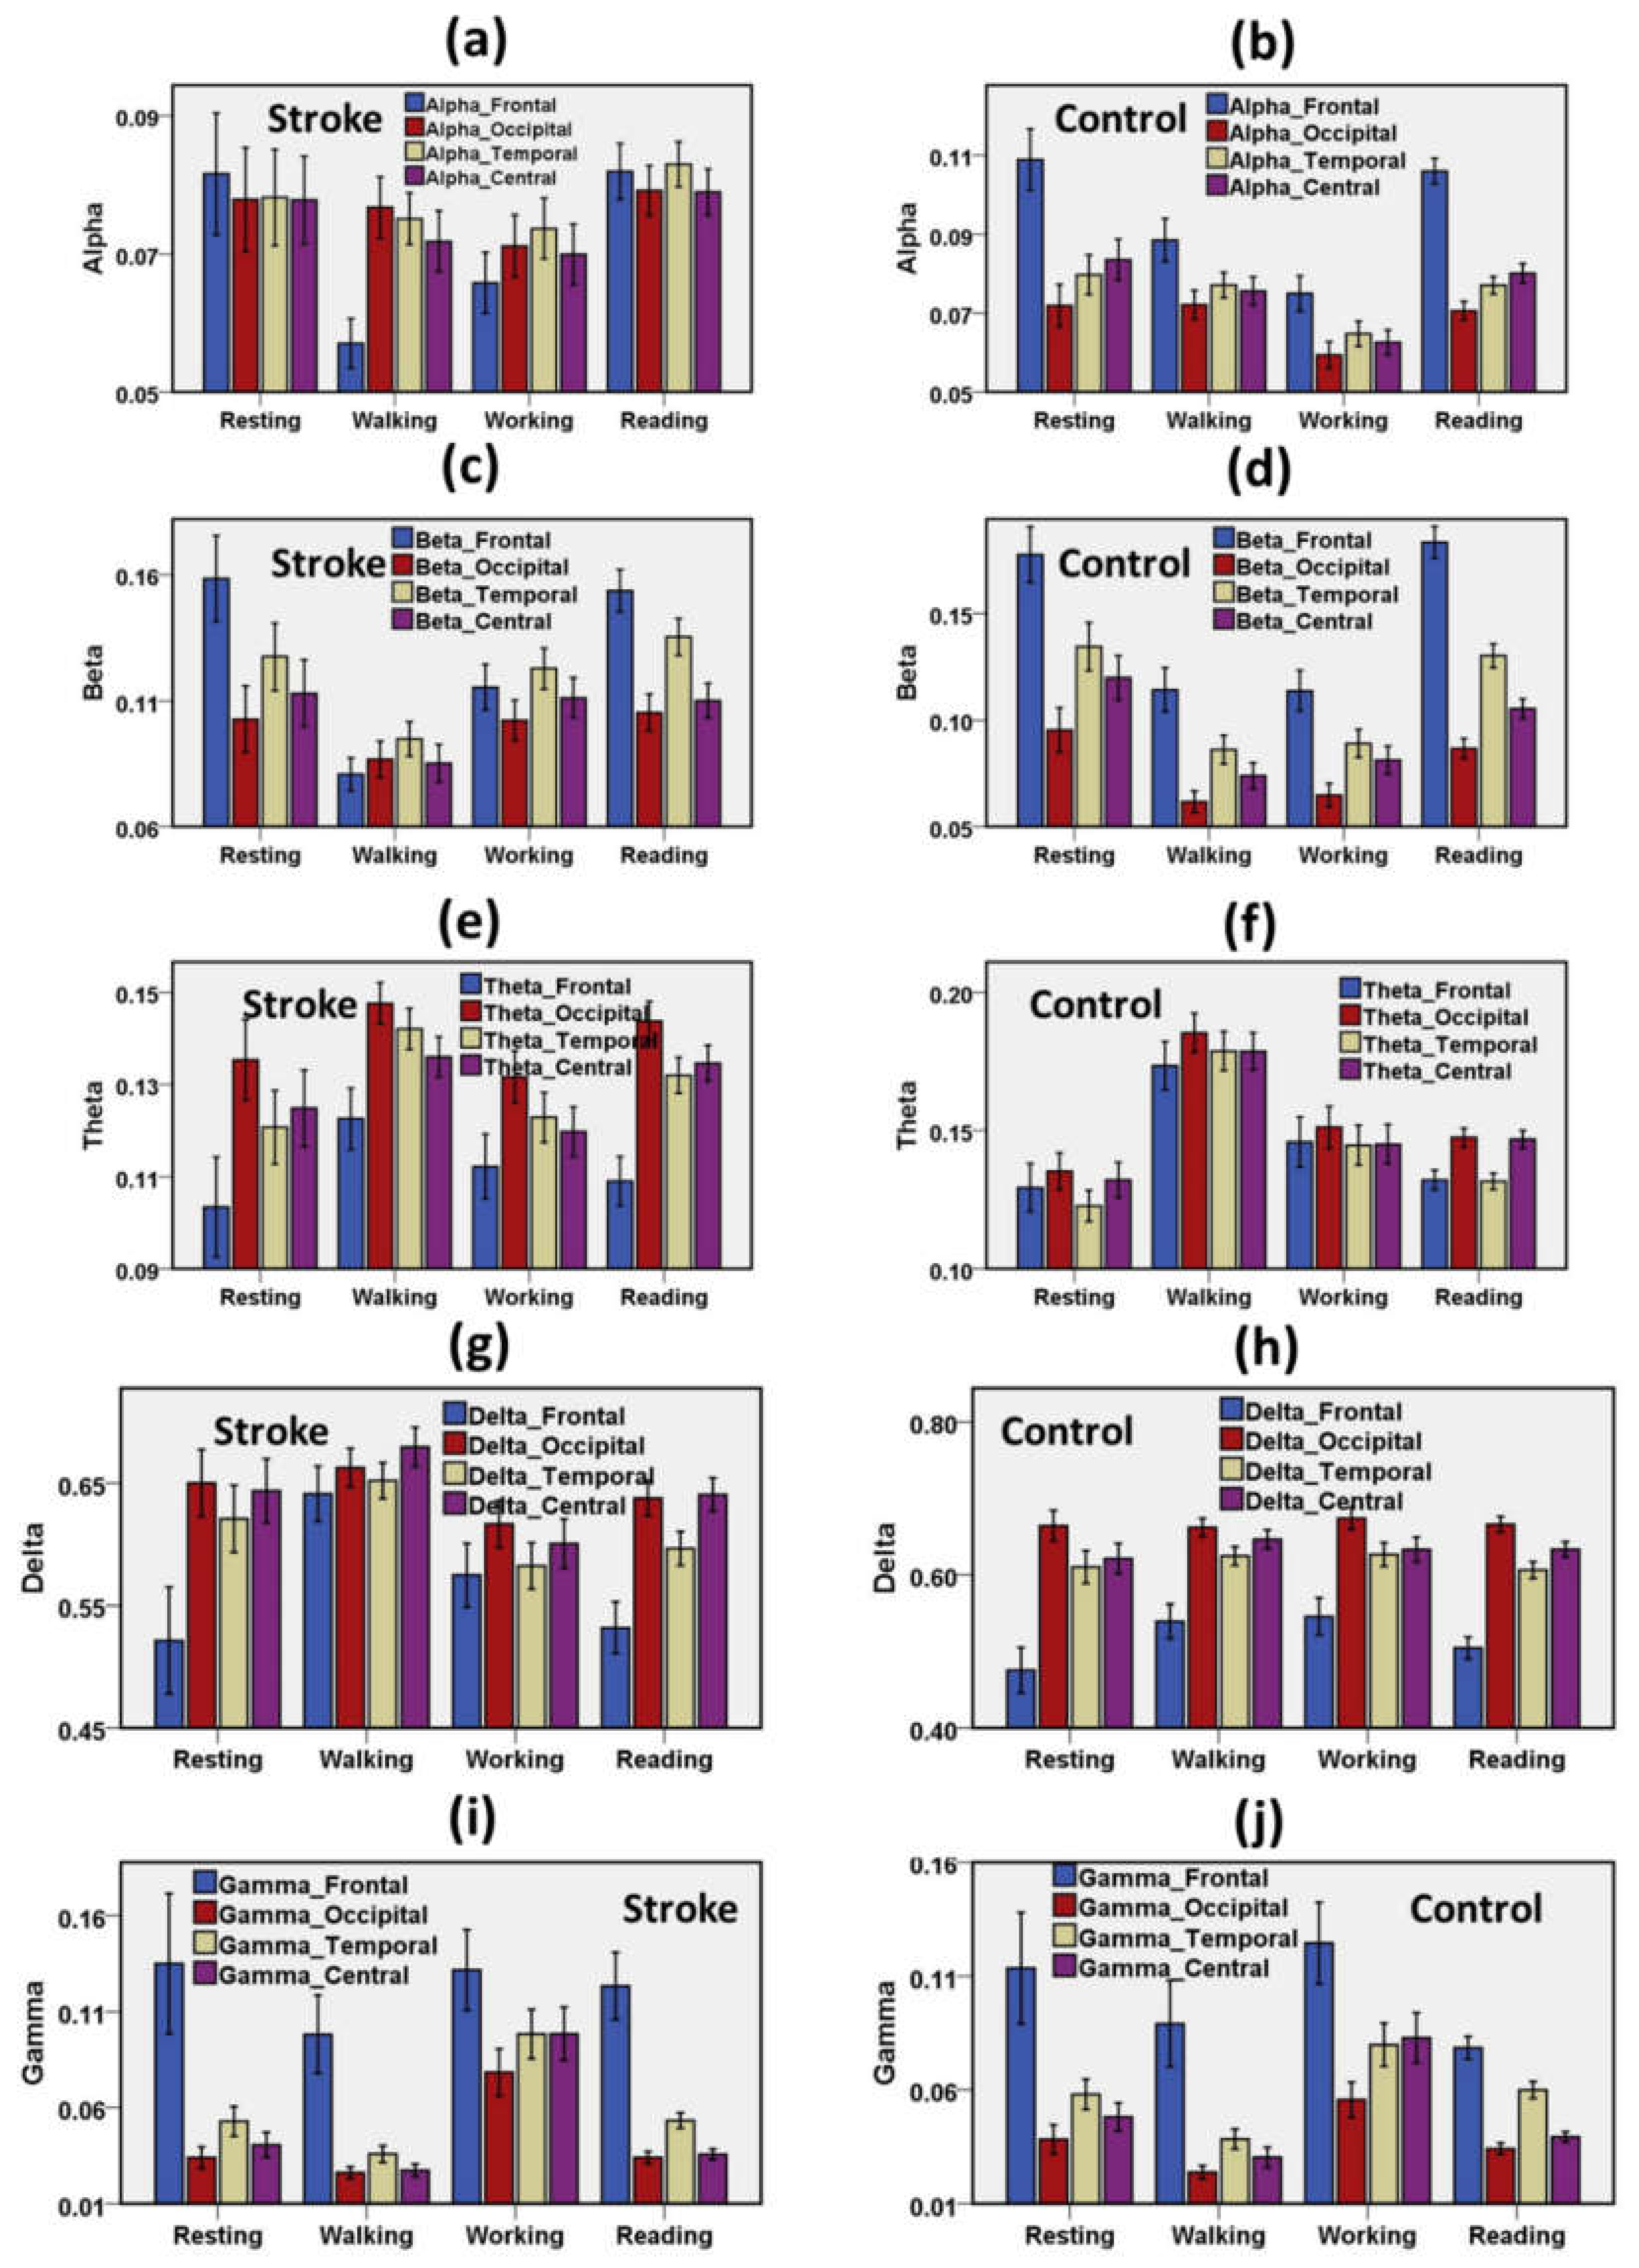
Figure 4.
Distribution of spectral waves on the cortical regions (frontal lobe, central lobe, temporal lobe, occipital lobe) during resting, motor, and cognitive tasks. (a) RP Alpha of stroke group (b) RP Alpha of the control group, (c) RP Beta of stroke group (d) RP Beta of the control group, (e) RP Theta of stroke group (f) RP Theta of the control group, (g) RP Delta of stroke group (h) RP Delta of the control group, (i) RP Gamma of stroke group (j) RP Gamma of the control group. Error bar shows 95% confidence interval. RP = Relative Power.
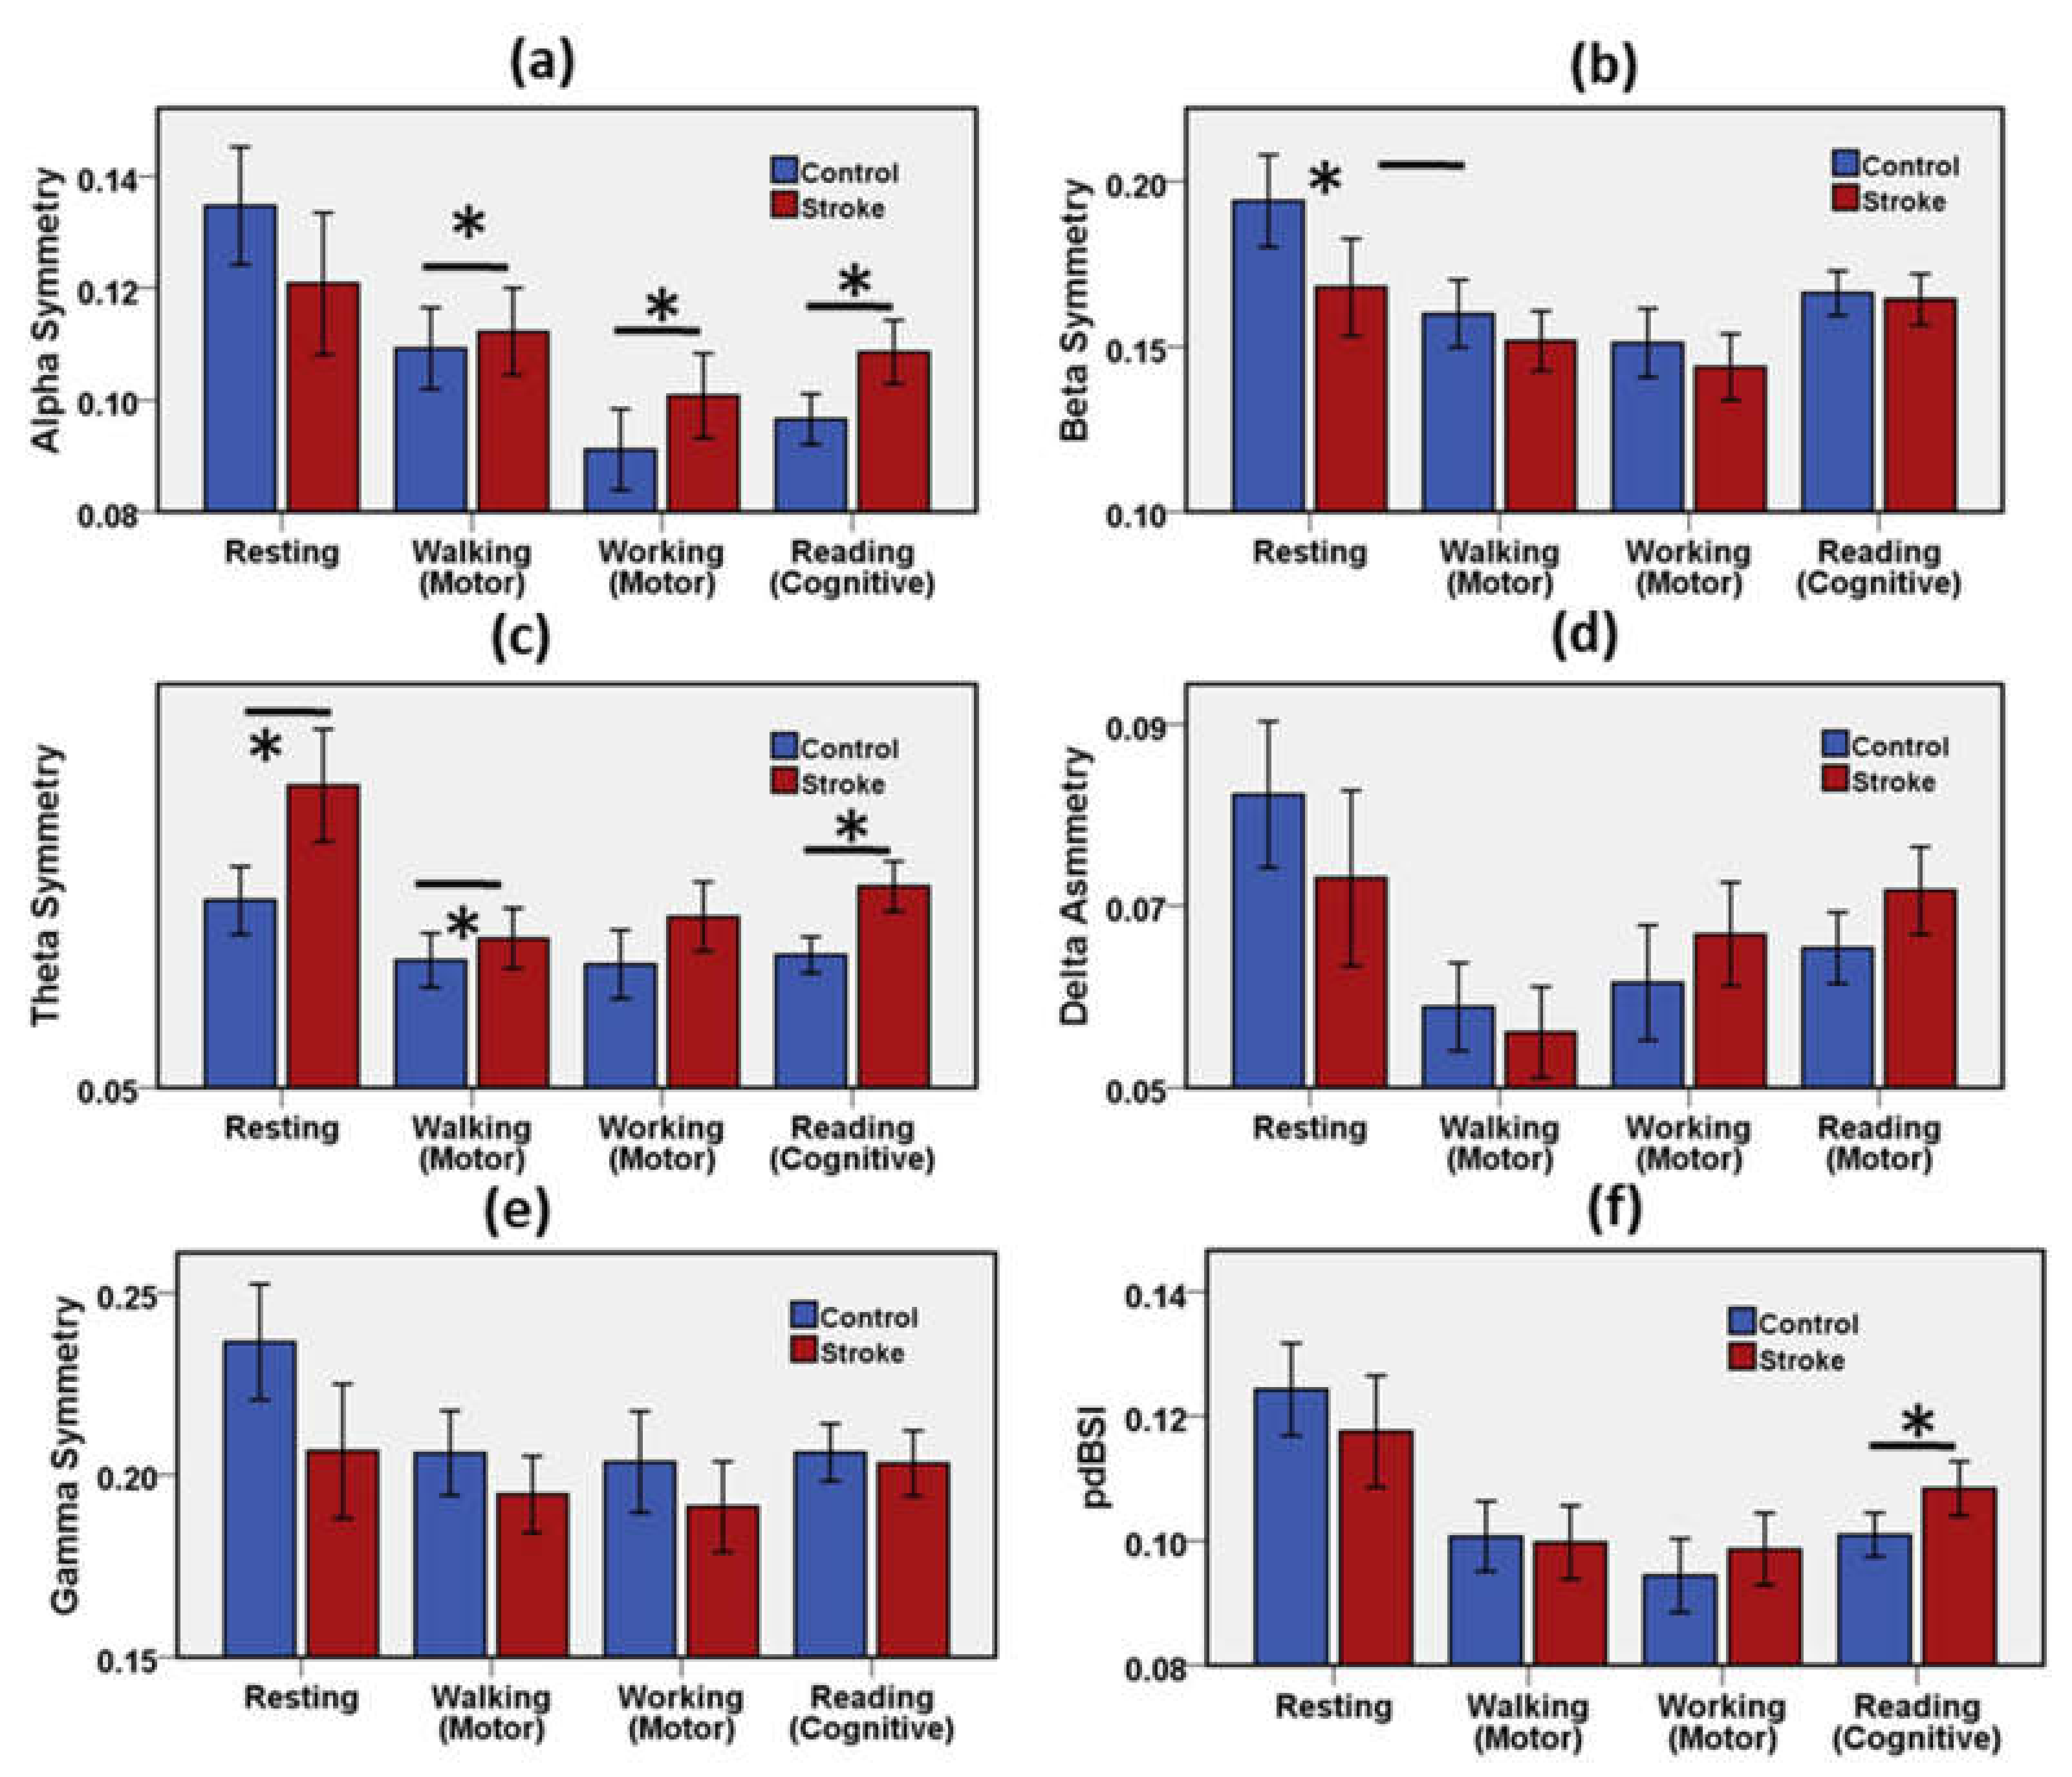
Figure 5.
Mean and error bar of (a) Alpha asymmetry, (b) Beta asymmetry (c) Theta asymmetry, (d) Delta asymmetry (e) Gamma asymmetry, (f) pdBSI of the stroke group and the control group during resting, motor, and cognitive tasks. Error bar shows 95% confidence interval. * (p < 0.05) indicates a significant difference.
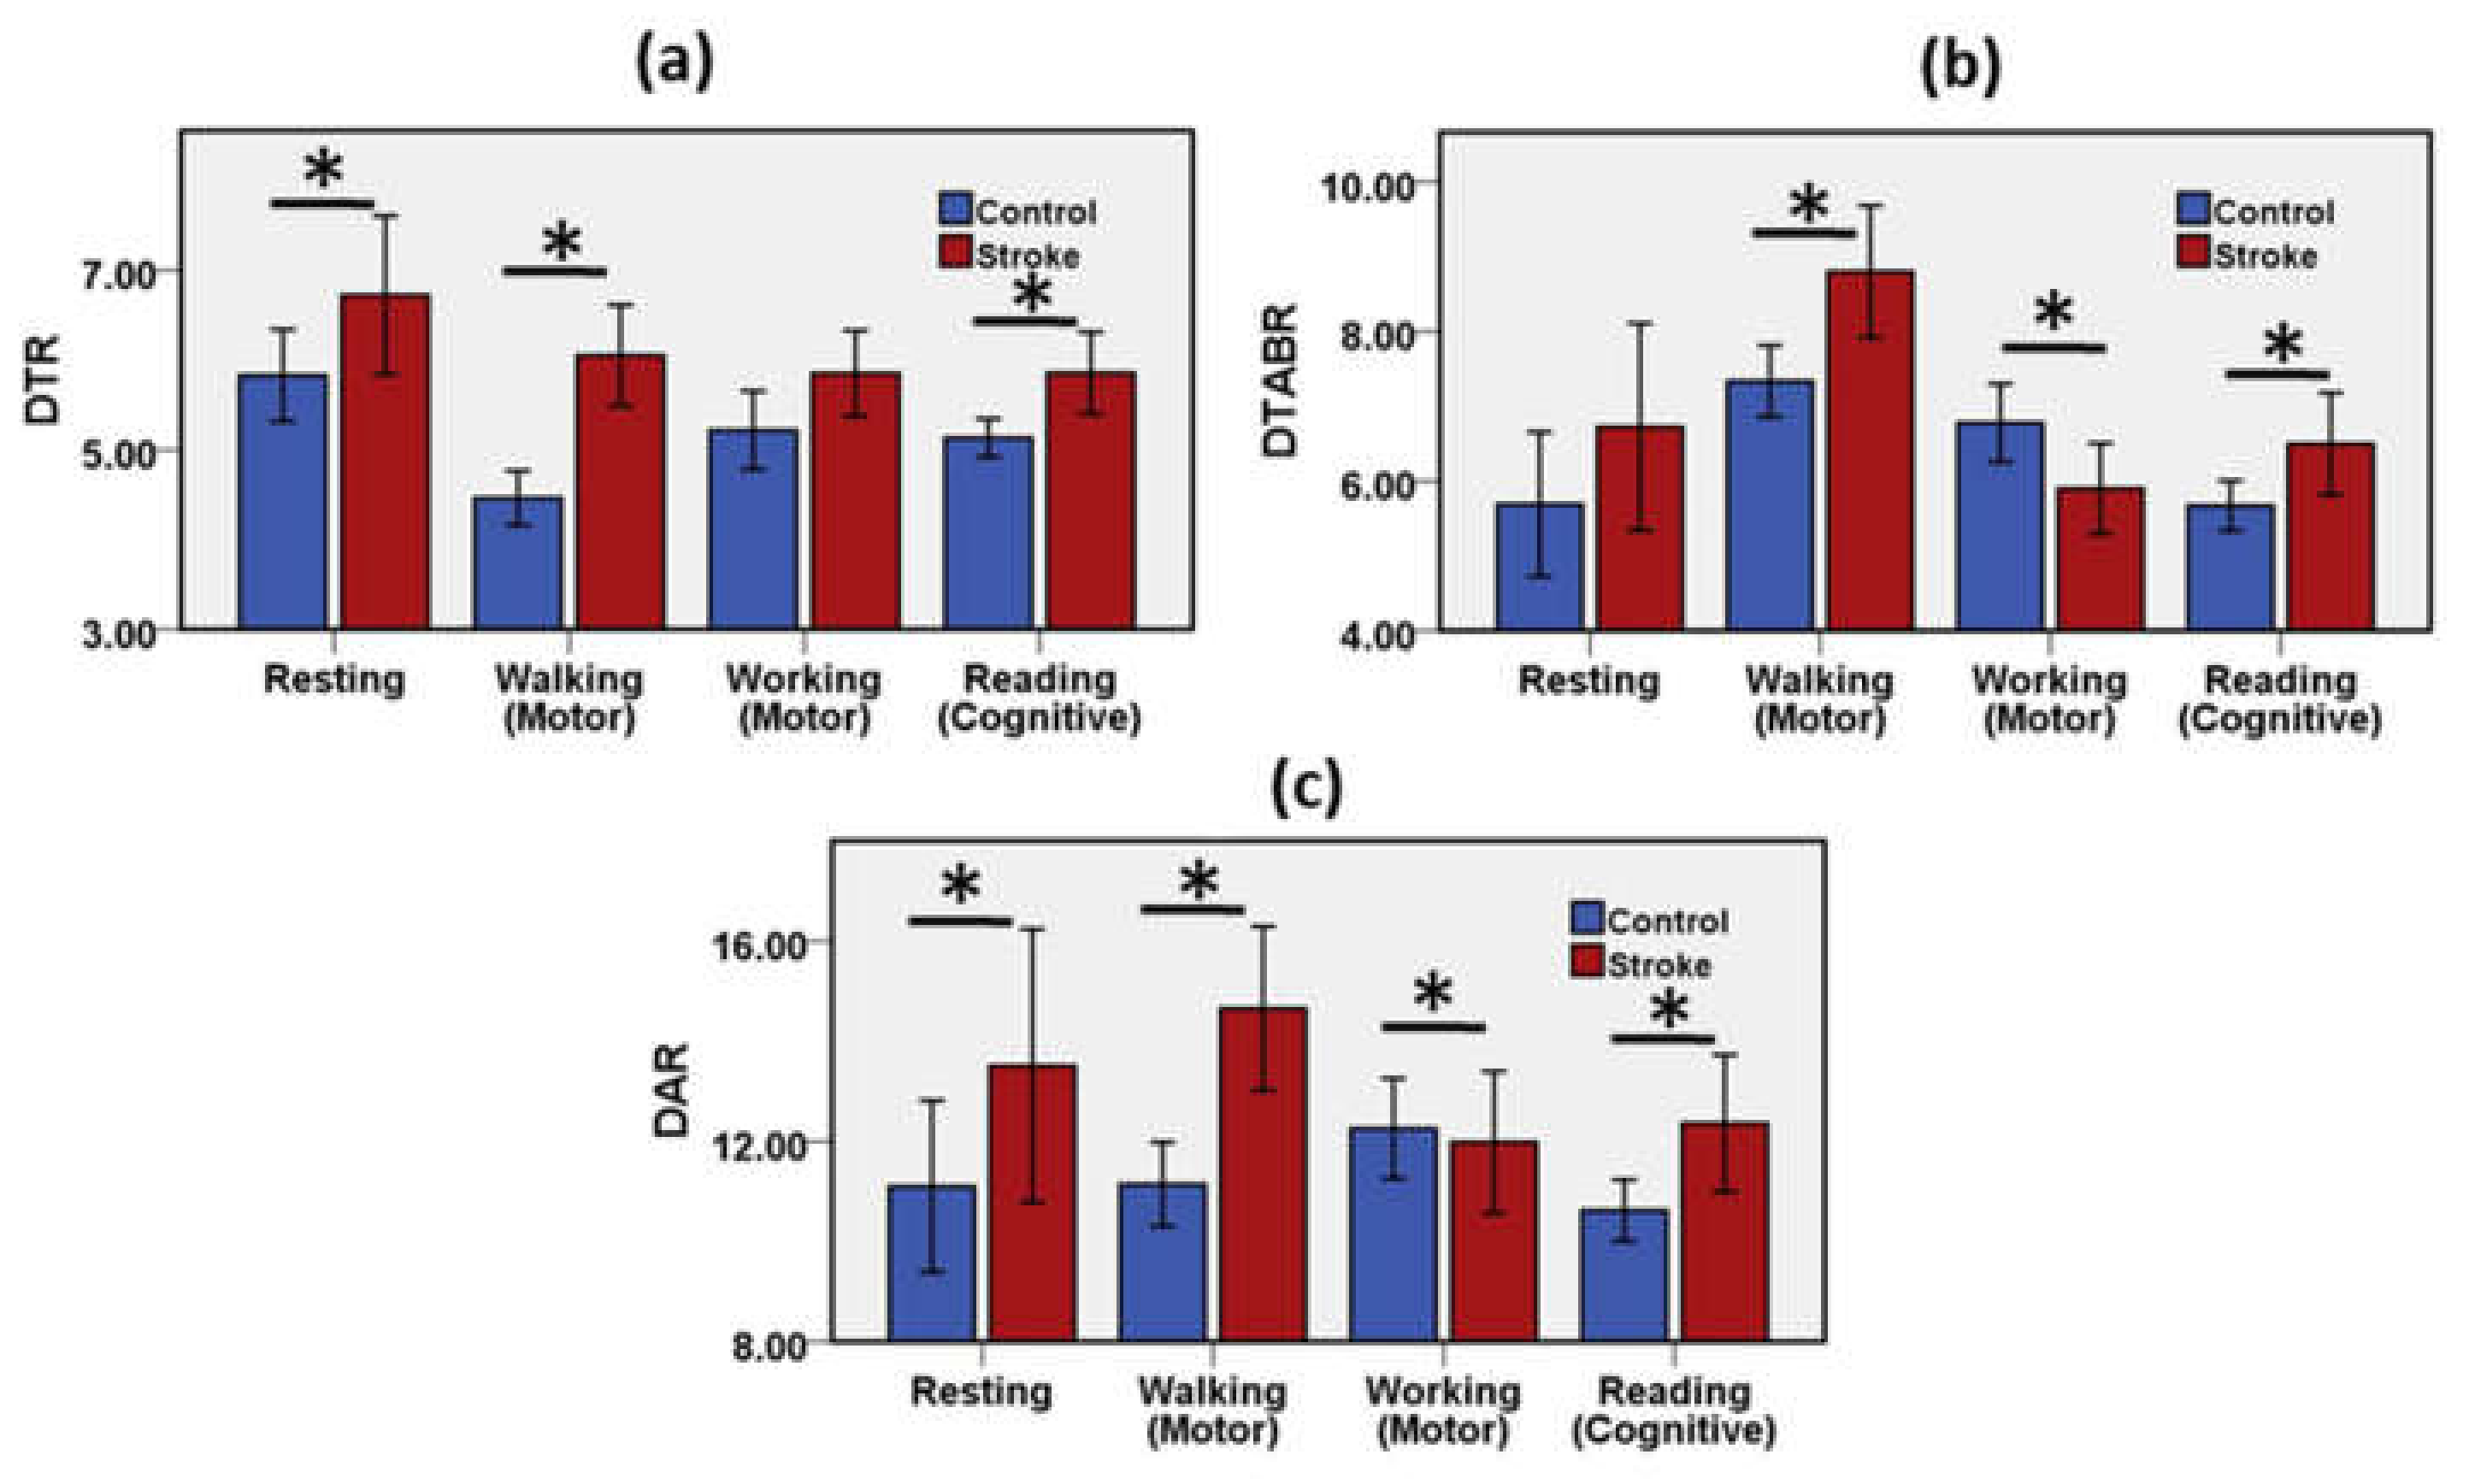
Figure 6.
Mean and error bar of (a) DTR, (b) DTABR, (c) DAR of the stroke group and the control group during resting, motor, and cognitive tasks. Error bar shows 95% confidence interval. * (p < 0.05) indicates a significant difference.
Figure 6.
Mean and error bar of (a) DTR, (b) DTABR, (c) DAR of the stroke group and the control group during resting, motor, and cognitive tasks. Error bar shows 95% confidence interval. * (p < 0.05) indicates a significant difference.
Figure 7.
Variation of EEG spectral features, the ratios of power features and pdBSI band-specific components with mental workload. (a) Spectral RP with the mental workload for stroke group, (b) spectral RP with the mental workload for the control group, (c) frequency-band power ratios with the mental workload for stroke group, (d) frequency-band power ratios with the mental workload for the control group, (e) spectral components of pdBSI with the mental workload for stroke group, (f) spectral components of pdBSI with the mental workload for the control group.
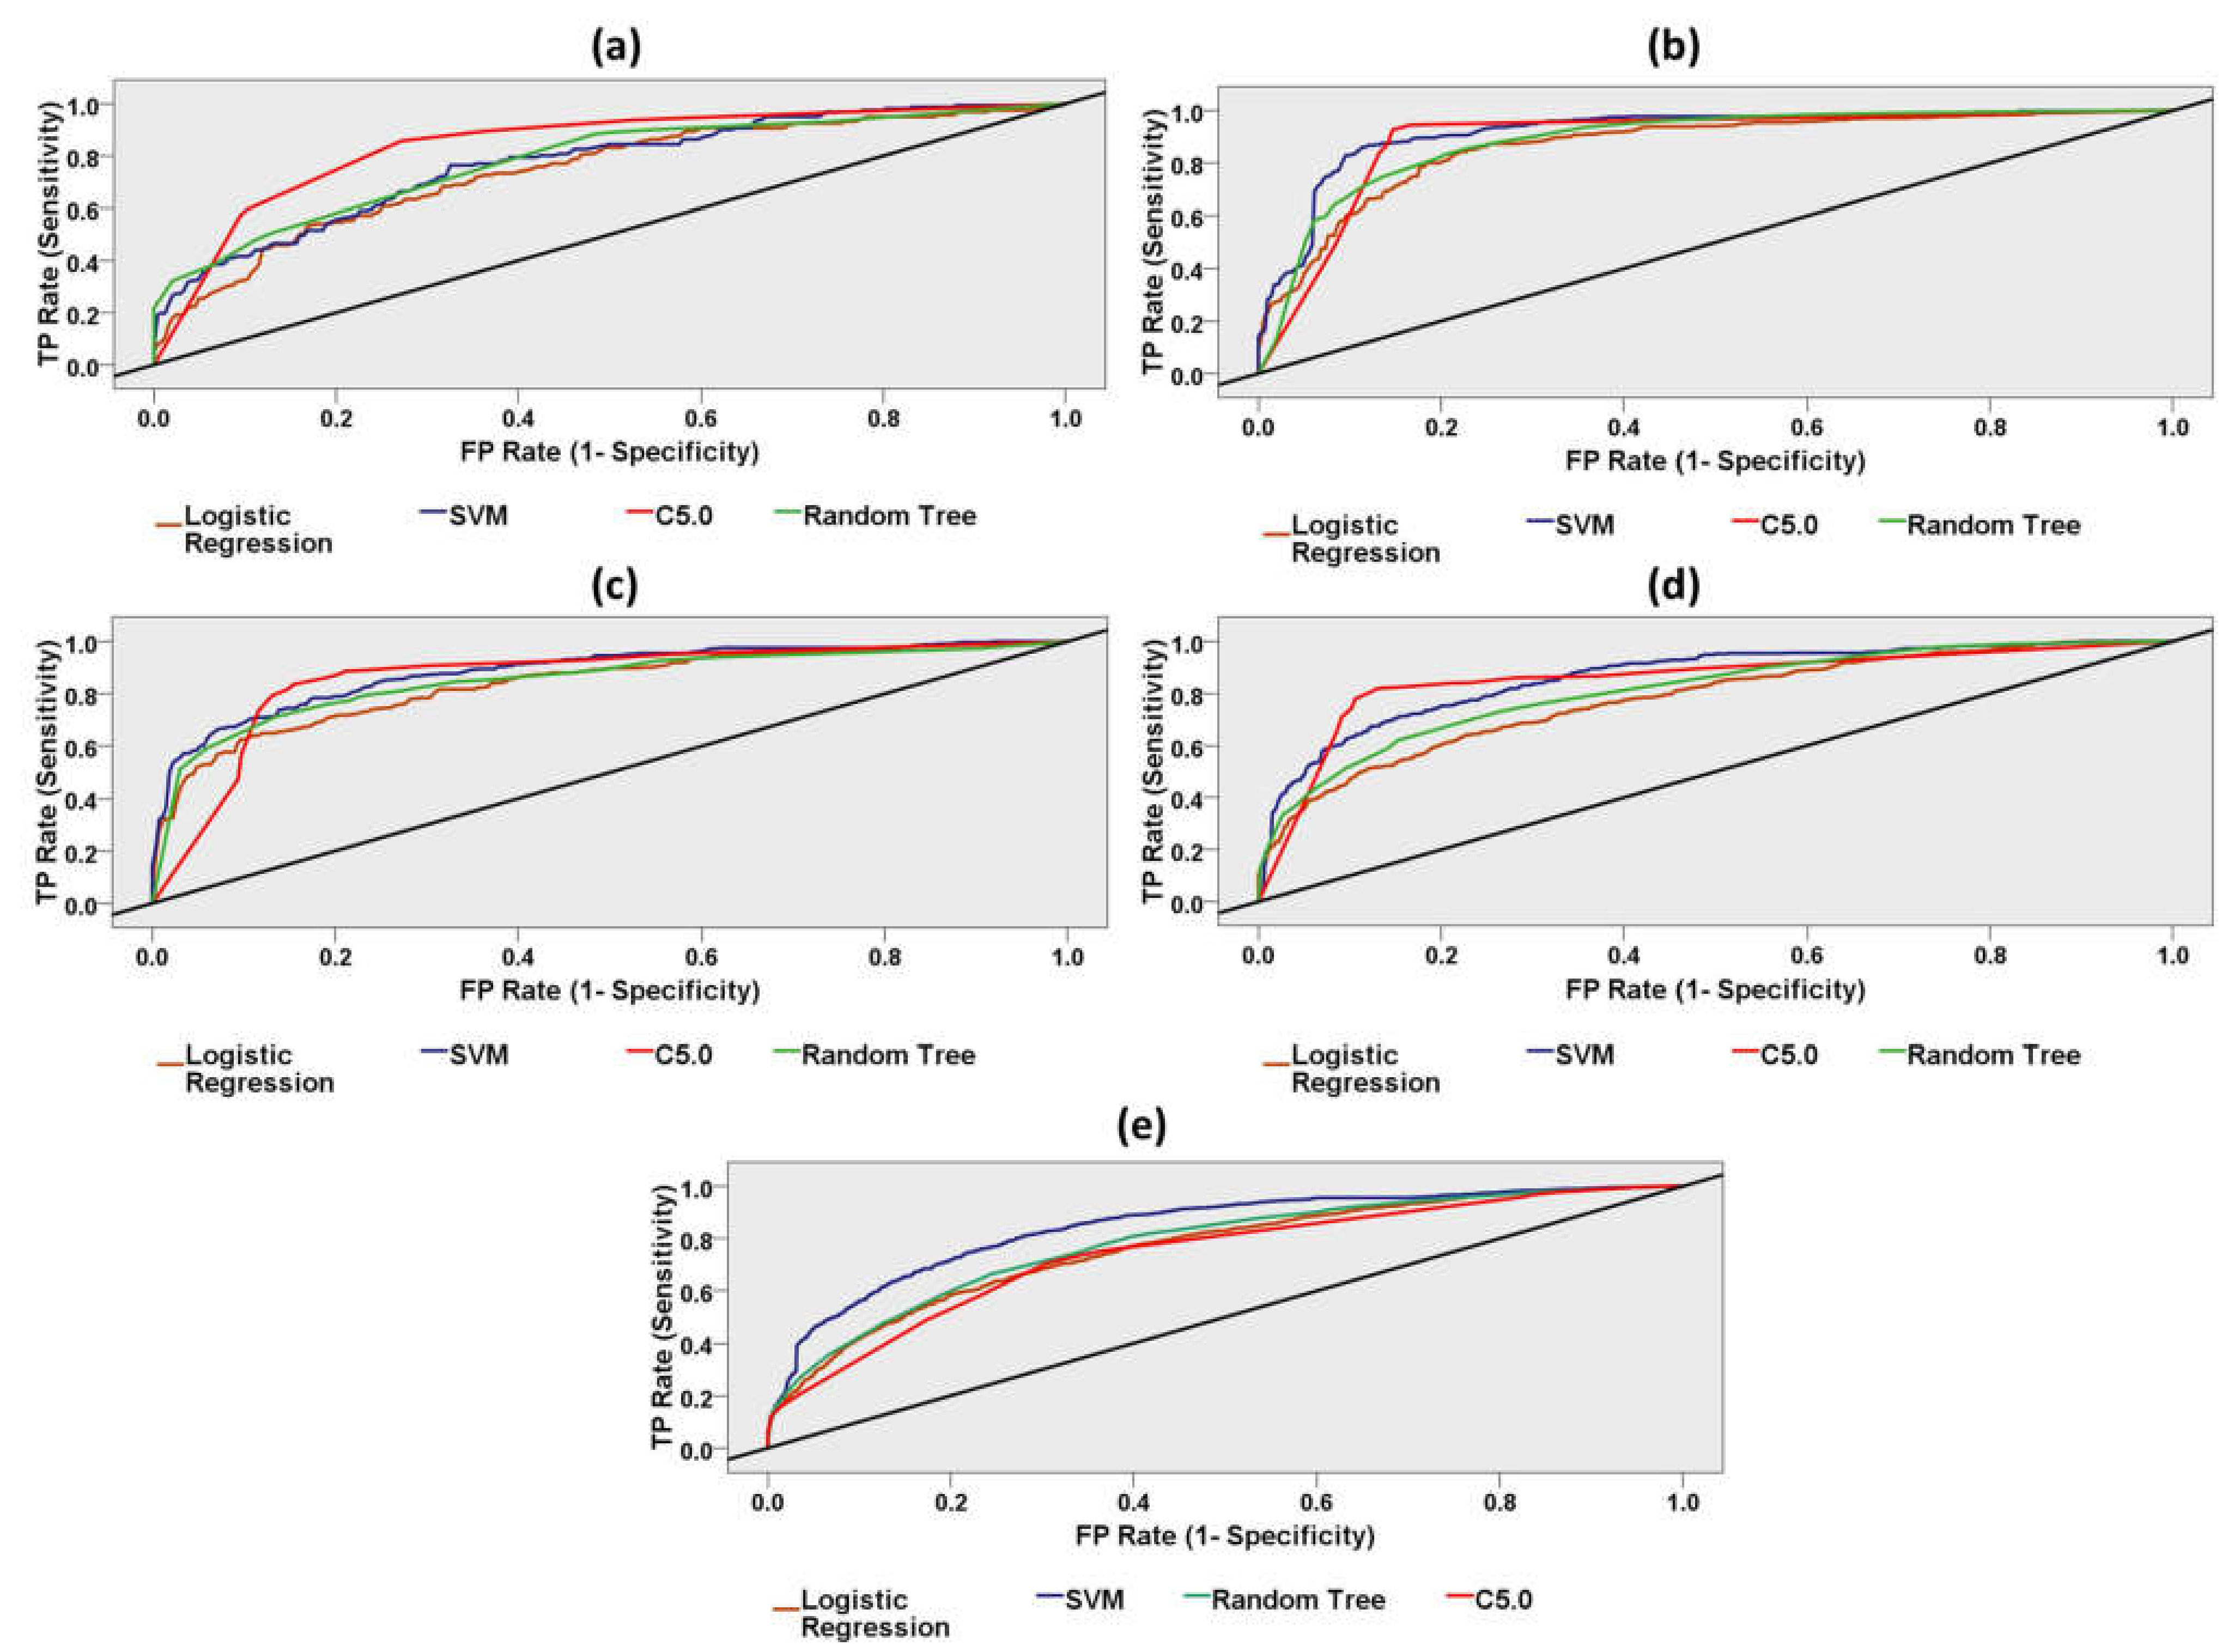
Figure 8.
Receiver Operating Characteristic (ROC) curves for four different machine-learning models (Support Vector Machine, Random Trees, Logistic Regression, C5.0). (a) ROC curve for resting dataset, (b) ROC curve for walking dataset, (c) ROC curve for working dataset, (d) ROC curve for reading dataset, (e) ROC curve for task-independent entire dataset. The area under the ROC curve (AUC) is an indicator of prediction accuracy. C5.0 classified the cognitive reading dataset with the highest AUC (86%) and highest accuracy (ACC: 85%). The diagonal black line is the reference line.
Table 1.
Results of the classification performance of different machine-learning models using the resting dataset.
Table 1.
Results of the classification performance of different machine-learning models using the resting dataset.
| Model | Accuracy | Sensitivity | Specificity | Precision | Negative Predictive Value | AUC | Gini |
|---|
| SVM | 0.71 | 0.45 | 0.87 | 0.70 | 0.71 | 0.77 | 0.54 |
| Random Tree | 0.73 | 0.48 | 0.89 | 0.74 | 0.72 | 0.78 | 0.56 |
| Logistic Regression | 0.70 | 0.54 | 0.80 | 0.64 | 0.72 | 0.74 | 0.48 |
| C5.0 | 0.78 | 0.60 | 0.90 | 0.79 | 0.77 | 0.84 | 0.69 |
Table 2.
Results of the classification performance of different machine-learning models using the walking dataset.
Table 2.
Results of the classification performance of different machine-learning models using the walking dataset.
| Model | Accuracy | Sensitivity | Specificity | Precision | Negative Predictive Value | AUC | Gini |
|---|
| SVM | 0.86 | 0.90 | 0.81 | 0.85 | 0.87 | 0.92 | 0.84 |
| Random Tree | 0.82 | 0.86 | 0.77 | 0.82 | 0.82 | 0.89 | 0.78 |
| Logistic Regression | 0.81 | 0.84 | 0.78 | 0.82 | 0.81 | 0.87 | 0.73 |
| C5.0 | 0.89 | 0.94 | 0.84 | 0.88 | 0.92 | 0.90 | 0.79 |
Table 3.
Results of the classification performance of different machine-learning models using the working dataset.
Table 3.
Results of the classification performance of different machine-learning models using the working dataset.
| Model | Accuracy | Sensitivity | Specificity | Precision | Negative Predictive Value | AUC | Gini |
|---|
| SVM | 0.80 | 0.82 | 0.77 | 0.82 | 0.78 | 0.88 | 0.77 |
| Random Tree | 0.78 | 0.79 | 0.78 | 0.81 | 0.74 | 0.85 | 0.70 |
| Logistic Regression | 0.75 | 0.79 | 0.69 | 0.76 | 0.73 | 0.84 | 0.67 |
| C5.0 | 0.84 | 0.89 | 0.79 | 0.84 | 0.85 | 0.87 | 0.73 |
Table 4.
Results of the classification performance of different machine-learning models using the cogitative reading dataset.
Table 4.
Results of the classification performance of different machine-learning models using the cogitative reading dataset.
| Model | Accuracy | Sensitivity | Specificity | Precision | Negative Predictive Value | AUC | Gini |
|---|
| SVM | 0.78 | 0.71 | 0.84 | 0.78 | 0.79 | 0.86 | 0.72 |
| Random Tree | 0.75 | 0.62 | 0.85 | 0.76 | 0.74 | 0.81 | 0.62 |
| Logistic Regression | 0.71 | 0.61 | 0.79 | 0.70 | 0.72 | 0.78 | 0.56 |
| C5.0 | 0.85 | 0.82 | 0.87 | 0.83 | 0.86 | 0.86 | 0.71 |
Table 5.
Results of the classification performance of different machine-learning models using the task-independent entire dataset.
Table 5.
Results of the classification performance of different machine-learning models using the task-independent entire dataset.
| Model | Accuracy | Sensitivity | Specificity | Precision | Negative Predictive Value | AUC | Gini |
|---|
| SVM | 0.76 | 0.73 | 0.79 | 0.77 | 0.76 | 0.84 | 0.69 |
| Random Tree | 0.70 | 0.74 | 0.66 | 0.68 | 0.73 | 0.78 | 0.56 |
| Logistic Regression | 0.69 | 0.67 | 0.71 | 0.69 | 0.70 | 0.76 | 0.53 |
| C5.0 | 0.70 | 0.71 | 0.69 | 0.69 | 0.71 | 0.74 | 0.49 |
Table 6.
Comparative study of methodologies and results between proposed work and previous works.
Table 6.
Comparative study of methodologies and results between proposed work and previous works.
| Study | EEG Time after Stroke Onset | Study Sample | EEG Features of Neurological Outcome | Main Findings |
|---|
| Finnigan et al. [26] | 46–52 h | Thirteen stroke patients | DAR; relative alpha; DTABR | DAR was correlated with 30-day NIHSS |
| Sheorajpanday et al. [30] | <6 months | One hundred and ten stroke patients | DTABR, pdBSI | DTABR and pdBSI were correlated with the Modified Rankin scale and disability after six months after stroke |
| Finnigan et al. [16] | <24 h | Twenty-eight healthy control and eighteen stroke patients | QEEG indices (power of delta, theta, alpha, and/or beta bands), DAR | EEG power of delta, theta, alpha, and/or beta bands differed highly significantly between acute stroke (IS) and control; DAR demonstrated the highest accuracy for discriminating between acute IS patients and controls. |
| Aminov et al. [7] | <72 h | Twenty-four stroke patients | DTR, RP theta, RP delta, and DAR | DTR, RP theta, RP delta, and DAR were correlated with 90-day MoCA scores. |
| Proposed work | <3 months | Forty-eight stroke patients and seventy-five healthy adults | EEG indices (power of delta, theta, alpha bands), DAR, DTR | EEG indices (power of delta, theta, alpha bands), DAR, DTR were discriminative biomarkers in the resting, motor, and cognitive reading task. |


