Connectivity Patterns of Deep Brain Stimulation Targets in Patients with Gilles de la Tourette Syndrome


 ,
,
Abstract
:
1. Introduction
2. Materials and Methods
2.1. Patient Data and Study Design
2.2. Volume of Tissue Activated and Seed Regions
2.3. Probabilistic Tractography
2.4. Statistical Analysis
3. Results
3.1. Patient Data
3.2. Connectivity Analysis
3.2.1. Image Processing Based on Patient-Specific Data
Streamline Count
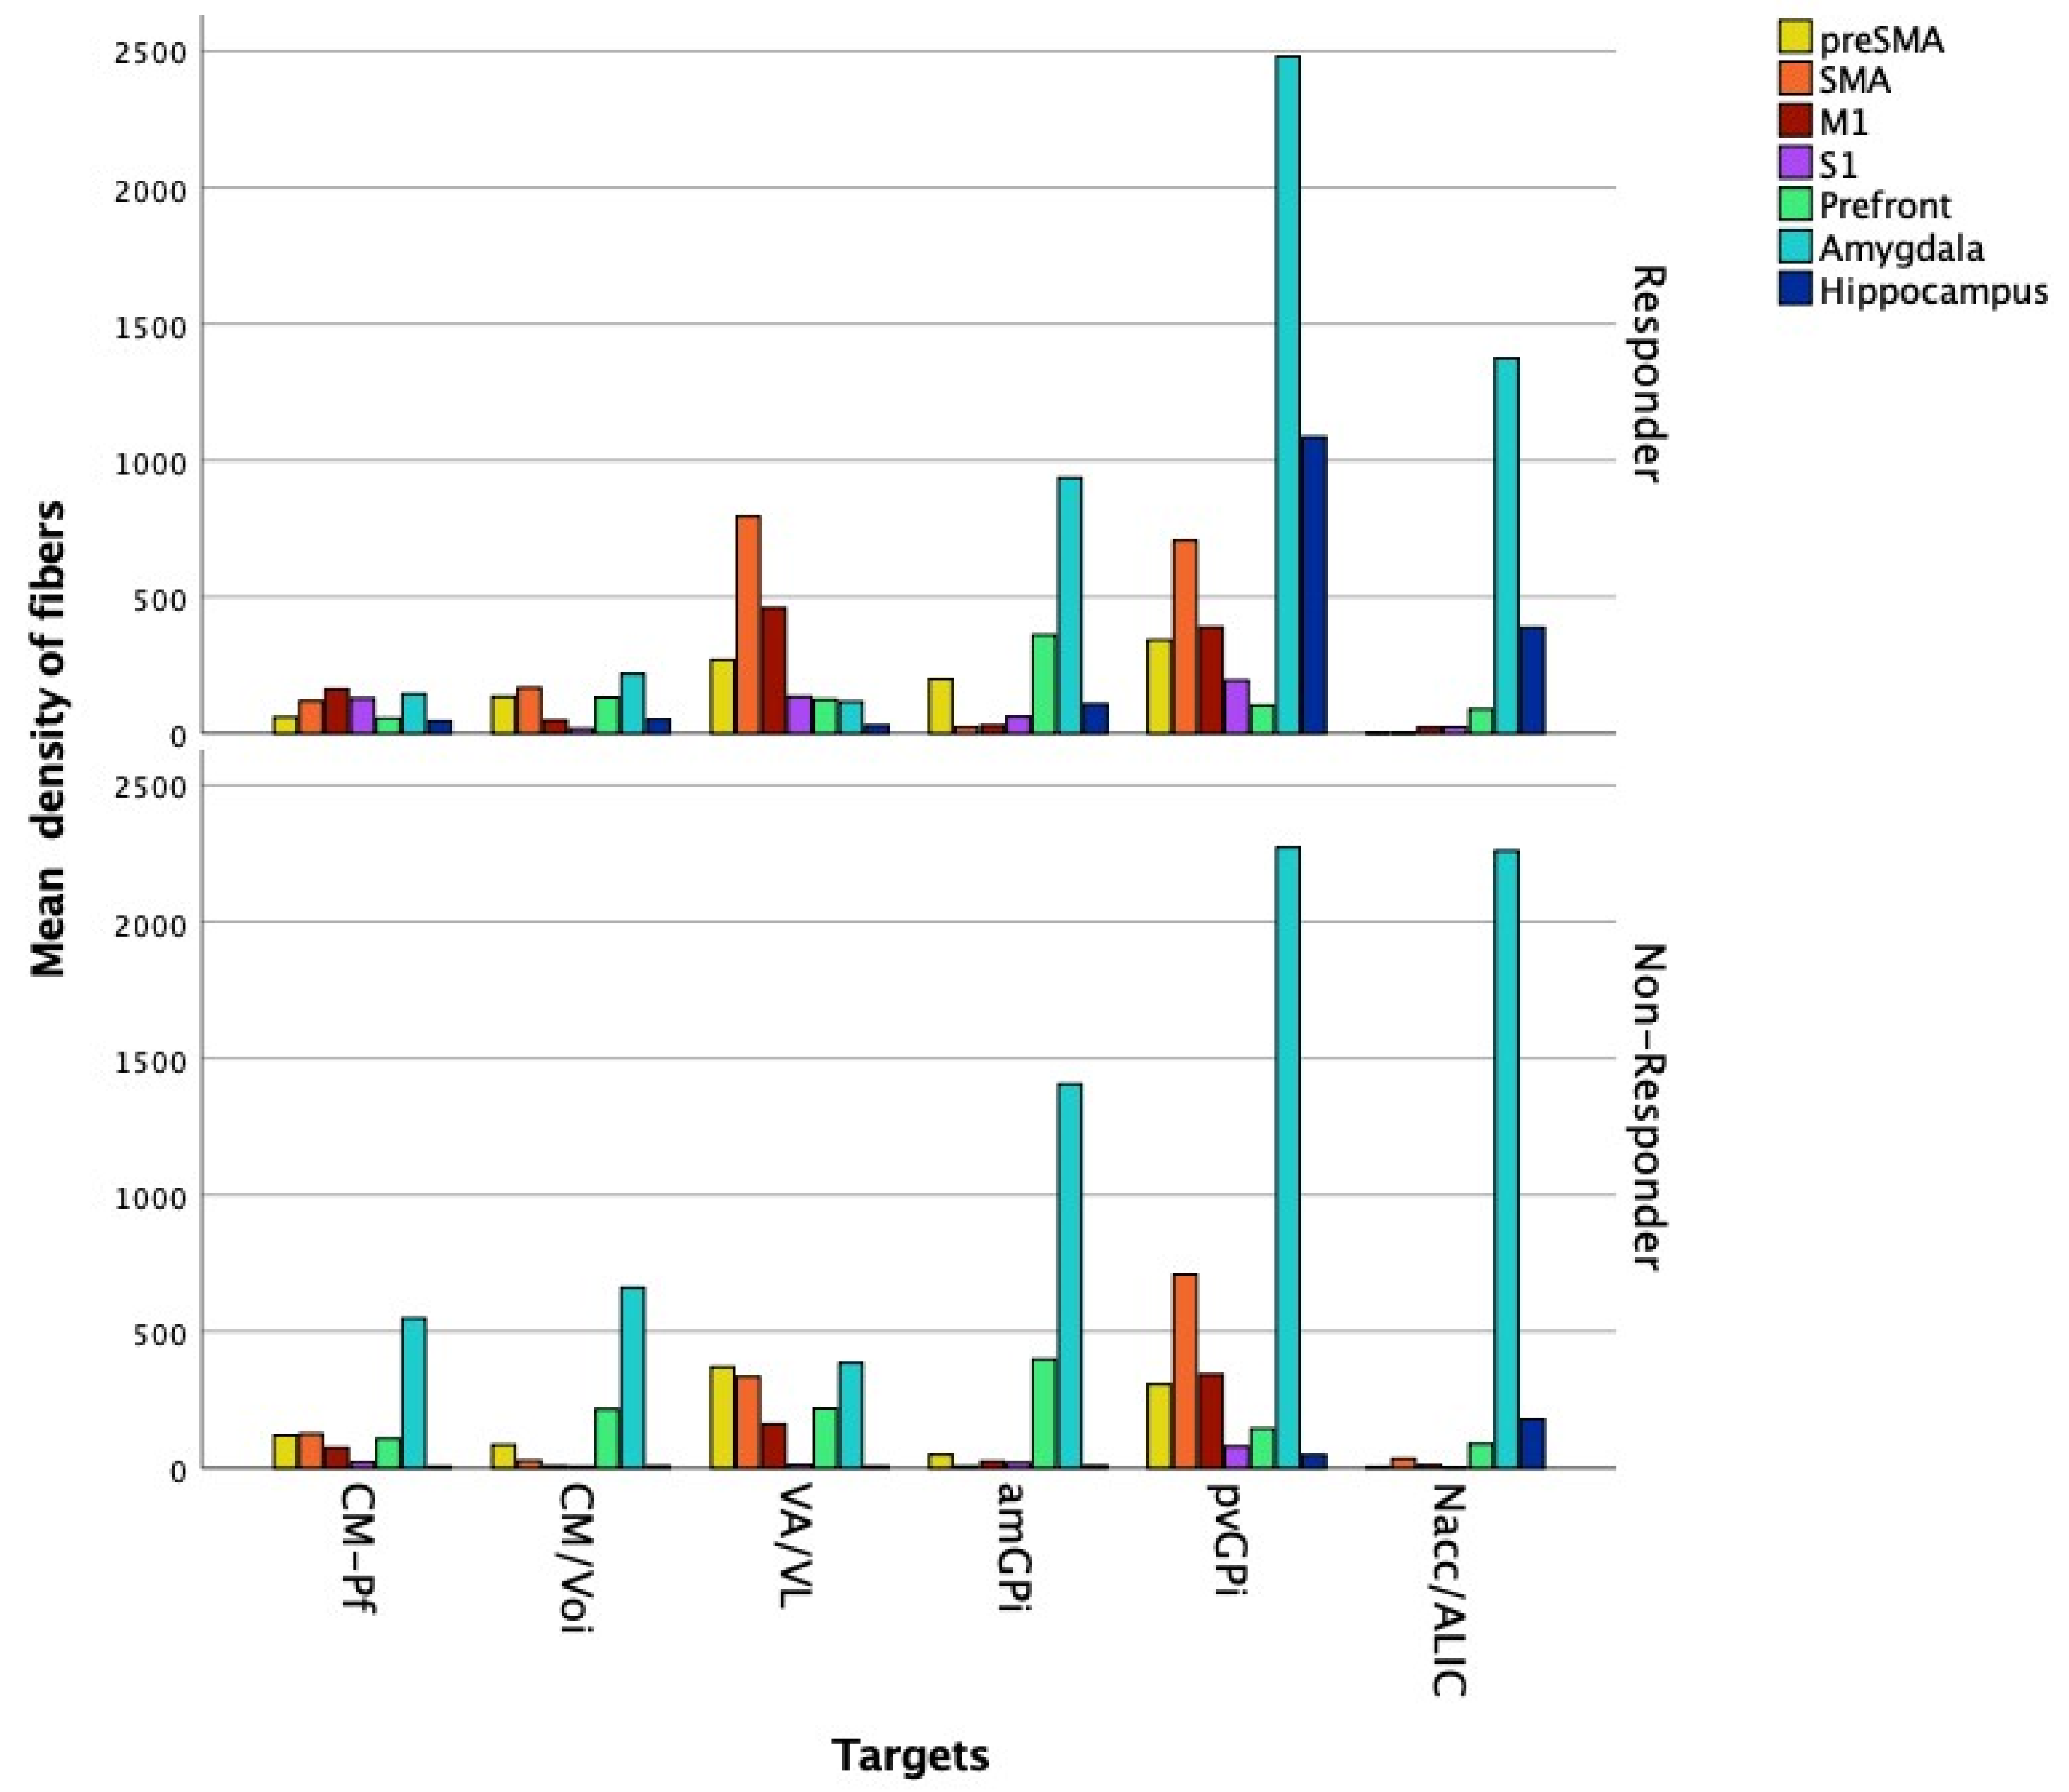
Fiber Density
3.2.2. Image Processing Based on a Normative Connectome
4. Discussion
5. Conclusions
Author Contributions
Funding
Institutional Review Board Statement
Informed Consent Statement
Data Availability Statement
Conflicts of Interest
References
- American Psychiatric Association. Diagnostic and Statistical Manual of Mental Disorders, 5th ed.; American Psychiatric Association Publishing: Arlington, VA, USA, 2013. [Google Scholar]
- Leckman, J.F.; Zhang, H.; Vitale, A.; Lahnin, F.; Lynch, K.; Bondi, C.; Kim, Y.-S.; Peterson, B.S. Course of tic severity in Tourette syndrome: The first two decades. Pediatrics 1998, 102, 14–19. [Google Scholar] [CrossRef] [PubMed]
- Pappert, E.J.; Goetz, C.G.; Louis, E.D. Objective assessments of longitudinal outcome in Gilles de la Tourette’s syndrome. Neurology 2003, 61, 936–940. [Google Scholar] [CrossRef] [PubMed]
- Cath, D.C.; Hedderly, T.; Ludolph, A.G.; Stern, J.S.; Murphy, T.; Hartmann, A.; Czernecki, V.; Robertson, M.M.; Martino, D.; Munchau, A.; et al. European clinical guidelines for Tourette Syndrome and other tic disorders. Part I: Assessment. Eur. Child Adolesc. Psychiatry 2011, 20, 155–171. [Google Scholar] [CrossRef] [PubMed] [Green Version]
- Robertson, M.M. Tourette syndrome, associated conditions and the complexities of treatment. Brain 2000, 123, 425–462. [Google Scholar] [CrossRef] [Green Version]
- Church, J.A.; Fair, D.A.; Dosenbach, N.U.F.; Cohen, A.L.; Miezin, F.M.; Petersen, S.E.; Schlaggar, B.L. Control networks in paediatric Tourette syndrome show immature and anomalous patterns of functional connectivity. Brain 2009, 132, 225–238. [Google Scholar] [CrossRef]
- Worbe, Y.; Malherbe, C.; Hartmann, A.; Pélégrini-Issac, M.; Messé, A.; Vidailhet, M.; Lehéricy, S.; Benali, H. Functional immaturity of cortico-basal ganglia networks in Gilles de la Tourette syndrome. Brain 2012, 135, 1937–1946. [Google Scholar] [CrossRef] [Green Version]
- Cheng, B.; Braass, H.; Ganos, C.; Treszl, A.; Biermann-Ruben, K.; Hummel, F.C.; Müller-Vahl, K.; Schnitzler, A.; Gerloff, C.; Münchau, A.; et al. Altered intrahemispheric structural connectivity in Gilles de la Tourette syndrome. NeuroImage Clin. 2014, 4, 174–181. [Google Scholar] [CrossRef] [Green Version]
- Shprecher, D.; Kurlan, R. The management of tics. Mov. Disord. 2009, 24, 15–24. [Google Scholar] [CrossRef]
- Vandewalle, V.; van der Linden, C.; Groenewegen, H.J.; Caemaert, J. Stereotactic treatment of Gilles de la Tourette syndrome by high frequency stimulation of thalamus. Lancet 1999, 353, 724. [Google Scholar] [CrossRef]
- Visser-Vandewalle, V.; Temel, Y.; Boon, P.; Vreeling, F.; Colle, H.; Hoogland, G.; Groenewegen, H.J.; van der Linden, C. Chronic bilateral thalamicstimulation: A new therapeutic approach in intractable Tourette syndrome. Report of three cases. J. Neurosurg. 2003, 99, 1094–1100. [Google Scholar] [CrossRef] [Green Version]
- Houeto, J.; Karachi, C.; Mallet, L.; Pillon, B.; Yelnik, J.; Mesnage, V.; Welter, M.L.; Navarro, S.; Pelissolo, A.; Damier, P.; et al. Tourette’s syndrome and deep brain stimulation. J. Neurol. Neurosurg. Psychiatry 2005, 76, 992–995. [Google Scholar] [CrossRef] [PubMed] [Green Version]
- Diederich, N.J.; Kalteis, K.; Stamenkovic, M.; Pieri, V.; Alesch, F. Efficient internal pallidal stimulation in Gilles de la Tourette syndrome: A case report. Mov. Disord. 2005, 20, 1496–1520. [Google Scholar] [CrossRef] [PubMed]
- Huys, D.; Bartsch, C.; Hoester, P.; Lenartz, D.; Maarouf, M.; Daumann, J.; Mai, J.K.; Klosterkötter, J.; Hunsche, S.; Visser-Vandewalle, V.; et al. Motor improvement and emotional stabilization in patients with Tourette syndrome after deep brain stimulation of the ventral anterior and ventrolateral motor part of the thalamus. Biol. Psychiatry 2016, 79, 392–401. [Google Scholar] [CrossRef] [PubMed]
- Kuhn, J.; Lenartz, D.; Mai, J.K.; Huff, W.; Lee, S.-H.; Koulousakis, A.; Klosterkötter, J.; Sturm, V. Deep brain stimulation of the nucleus accumbens and the internal capsule in therapeutically refractory Tourette-syndrome. J. Neurol. 2007, 254, 963–965. [Google Scholar] [CrossRef] [PubMed]
- Piedimonte, F.; Andreani, J.C.M.; Piedimonte, L.; Graff, P.; Bacaro, V.; Micheli, F.; Vilela Filho, O. Behavioral and motor improvement after deep brain stimulation of the globus pallidus externus in a case of Tourette’s syndrome. Neuromodulation 2013, 16, 55–58. [Google Scholar] [CrossRef] [PubMed]
- Martinez-Torres, I.; Hariz, M.I.; Zrinzo, L.; Foltynie, T.; Limousin, P. Improvement of tics after subthalamic deep brain stimulation. Neurology 2009, 72, 1787–1789. [Google Scholar] [CrossRef] [Green Version]
- Baldermann, J.C.; Schüller, T.; Huys, D.; Becker, I.; Timmermann, L.; Jessen, F.; Visser-Vandewalle, V.; Kuhn, J. Deep brain stimulation for Tourette-syndrome: A systematic review and meta-analysis. Brain Stimul. 2016, 9, 296–304. [Google Scholar] [CrossRef]
- Johnson, K.A.; Fletcher, P.T.; Servello, D.; Bona, A.; Porta, M.; Ostrem, J.L.; Bardinet, E.; Welter, M.-L.; Lozano, A.M.; Baldermann, J.C.; et al. Image-based analysis and long-term clinical outcomes of deep brain stimulation for Tourette syndrome: A multisite study. J. Neurol. Neurosurg. Psychiatry 2019, 90, 1078–1090. [Google Scholar] [CrossRef]
- Brito, M.; Teixeira, M.J.; Mendes, M.M.; França, C.; Iglesio, R.; Barbosa, E.R.; Cury, R.G. Exploring the clinical outcomes after deep brain stimulation in Tourette syndrome. J. Neurol. Sci. 2019, 402, 48–51. [Google Scholar] [CrossRef]
- Andrade, P.; Heiden, P.; Hoevels, M.; Schlamann, M.; Baldermann, J.C.; Huys, D.; Visser-Vandewalle, V. Modulation of fibers to motor cortex during thalamic DBS in Tourette patients Ccrrelates with tic reduction. Brain Sci. 2020, 10, 302. [Google Scholar] [CrossRef] [PubMed]
- Johnson, K.A.; Duffley, G.; Anderson, D.N.; Ostrem, J.L.; Welter, M.-L.; Baldermann, J.C.; Kuhn, J.; Huys, D.; Visser-Vandewalle, V.; Foltynie, T.; et al. Structural connectivity predicts clinical outcomes of deep brain stimulation for Tourette syndrome. Brain 2020, 143, 2607–2623. [Google Scholar] [CrossRef] [PubMed]
- Leckman, J.F.; Riddle, M.A.; Hardin, M.T.; Ort, S.I.; Swartz, K.L.; Stevenson, J.; Cohen, D.J. The Yale Global Tic Severity Scale: Initial testing of a clinician-rated scale of tic severity. J. Am. Acad. Child Adolesc. Psychiatry 1989, 28, 566–573. [Google Scholar] [CrossRef] [PubMed]
- Ackermans, L.; Temel, Y.; Cath, D.; van der Linden, C.; Bruggeman, R.; Kleijer, M.; Nederveen, P.; Schruers, K.; Colle, H.; Tijssen, M.A.J.; et al. Deep brain stimulation in Tourette’s syndrome: Two targets? Mov. Disord. 2006, 21, 709–713. [Google Scholar] [CrossRef] [PubMed]
- Welter, M.-L.; Mallet, L.; Houeto, J.-L.; Karachi, C.; Czernecki, V.; Cornu, P.; Navarro, S.; Pidoux, B.; Dormont, D.; Bardinet, E.; et al. Internal pallidal and thalamic stimulation in patients with Tourette syndrome. Arch. Neurol. 2008, 65, 952–957. [Google Scholar] [CrossRef] [PubMed] [Green Version]
- Smeets, A.Y.J.M.; Duits, A.A.; Plantinga, B.R.; Leentjens, A.F.G.; Oosterloo, M.; Visser-Vandewalle, V.; Temel, Y.; Ackermans, L. Deep Brain Stimulation of the internal globus pallidus in refractory Tourette Syndrome. Clin. Neurol. Neurosurg. 2016, 142, 54–59. [Google Scholar] [CrossRef] [PubMed]
- Shaded, J.; Poysky, J.; Kenney, C.; Simpson, R.; Jankovic, J. GPi deep brain stimulation for Tourette syndrome improves tics and psychiatric comorbidities. Neurology 2007, 68, 159–160. [Google Scholar] [CrossRef] [PubMed]
- Neuner, I.; Podoll, K.; Lenartz, D.; Sturm, V.; Schneider, F. Deep Brain Stimulation in the nucleus accumbens for intractable Tourette’s syndrome: Follow-up report of 36 months. Biol. Psychiatry 2009, 65, e5–e6. [Google Scholar] [CrossRef] [PubMed]
- Fonov, V.; Evans, A.C.; Botteron, K.; Almli, C.R.; McKinstry, R.C.; Collins, D.L. Unbiased average age-appropiate atlases for pediatric studies. NeuroImage 2011, 54, 313–327. [Google Scholar] [CrossRef] [Green Version]
- Tustison, N.J.; Avants, B.B.; Gee, J.C. Learning image-based spatial transformations via convolutional neural networks: A review. Magn. Reson. Imaging 2019, 64, 142–153. [Google Scholar] [CrossRef]
- Draginski, B.; Martino, D.; Cavanna, A.E.; Hutton, C.; Orth, M.; Robertson, M.M.; Critchley, H.D.; Frackowiak, R.S. Multispectral brain morphometry in Tourette syndrome persisting into adulthood. Brain 2010, 133, 3661–3675. [Google Scholar] [CrossRef] [Green Version]
- Mayka, M.A.; Corcos, D.M.; Leurgans, S.E.; Vaillancourt, D.E. Three-dimensional locations and boundaries of motor and premotor cortices as defined by functional brain imaging: A meta-analysis. NeuroImage 2006, 31, 1453–1474. [Google Scholar] [CrossRef] [PubMed] [Green Version]
- Xiao, Y.; Fonov, V.; Chakravarty, M.M.; Bériault, S.; Al-Subaie, F.; Sadikot, A.; Pike, G.B.; Bertrand, G.; Collins, D.L. A dataset of multi-contrast population-averaged brain MRI atlases of a Parkinson׳s disease cohort. NeuroImage 2017, 12, 370–379. [Google Scholar] [CrossRef] [PubMed]
- Andersson, J.L.R.; Skare, S.; Ashburner, J. How to correct susceptibility distortions in spin-echo echo-planar images: Application to diffusion tensor imaging. NeuroImage 2003, 20, 870–888. [Google Scholar] [CrossRef]
- Andersson, J.L.R.; Sotiropoulos, S.N. Non-parametric representation and prediction of single- and multi-shell diffusion-weighted MRI data using Gaussian processes. NeuroImage 2015, 122, 166–176. [Google Scholar] [CrossRef] [PubMed] [Green Version]
- Andersson, J.L.R.; Sotiropoulos, S.N. An integrated approach to correction for off-resonance effects and subject movement in diffusion MR imaging. NeuroImage 2016, 125, 1063–1078. [Google Scholar] [CrossRef] [Green Version]
- Smith, S.M.; Jenkinson, M.; Woolrich, M.W.; Beckmann, C.F.; Behrens, T.E.; Johansen-Berg, H.; Bannister, P.R.; De Luca, M.; Drobnjak, I.; Flitney, D.E.; et al. Advances in functional and structural MR image analysis and implementation as FSL. NeuroImage 2004, 23, S208–S219. [Google Scholar] [CrossRef] [Green Version]
- Behrens, T.E.J.; Woolrich, M.; Jenkinson, M.; Johansen-Berg, H.; Nunes, R.G.; Clare, S.; Matthews, P.M.; Brady, J.; Smith, S.M. Characterization and propagation of uncertainty in diffusion-weighted MR imaging. Magn. Reson. Med. 2003, 50, 1077–1088. [Google Scholar] [CrossRef]
- Behrens, T.E.J.; Johansen-Berg, H.; Jbabdi, S.; Rushworth, M.F.; Woolrich, M. Probabilistic diffusion tractography with multiple fibre orientations: What can we gain? NeuroImage 2007, 34, 144–155. [Google Scholar] [CrossRef]
- Setsomop, K.; Kimmlingen, R.; Eberlein, E.; Witzel, T.; Cohen-Adad, J.; McNab, J.A.; Keil, B.; Tisdall, M.D.; Hoecht, P.; Dietz, P.; et al. Pushing the limits of in vivo diffusion MRI for the Human Connectome Project. NeuroImage 2013, 80, 220–233. [Google Scholar] [CrossRef] [Green Version]
- Horn, A.; Kühn, A.A.; Merkl, A.; Shih, L.; Alterman, R.; Fox, M. Probabilistic conversion of neurosurgical DBS electrode coordinates into MNI space. NeuroImage 2017, 150, 395–404. [Google Scholar] [CrossRef]
- Rauch, S.L.; Wedig, M.M.; Wright, C.I.; Martis, B.; McMullin, K.G.; Shin, L.M.; Cannistrato, P.A.; Wilhelm, S. Functional magnetic resonance imaging study of regional brain activation during implicit sequence learning in obsessive–compulsive disorder. Biol. Psychiatry 2007, 61, 330–336. [Google Scholar] [CrossRef] [PubMed]
- Via, E.; Cardoner, N.; Pujol, J.; Alonso, P.; López-Solà, M.; Real, E.; Contreras-Rodrígues, O.; Deus, J.; Segalàs, C.; Menchón, M.; et al. Amygdala activation and symptom dimensions in obsessive–compulsive disorder. Br. J. Psychiatry 2014, 204, 61–68. [Google Scholar] [CrossRef] [PubMed] [Green Version]
- Polyanska, L.; Critchley, H.D.; Rae, C.L. Centrality of prefrontal and motor preparation cortices to Tourette Syndrome revealed by meta-analysis of task-based neuroimaging studies. NeuroImage Clin. 2017, 16, 257–267. [Google Scholar] [CrossRef]
- Horn, A.; Reich, M.; Vorwerk, J.; Li, N.; Wenzel, G.; Fang, Q.; Scmitz-Hübsch, T.; Nickl, R.; Kupsch, A.; Volkmann, J.; et al. Connectivity Predicts deep brain stimulation outcome in Parkinson disease. Ann. Neurol. 2017, 82, 67–78. [Google Scholar] [CrossRef] [PubMed]
- Baldermann, J.C.; Melzer, C.; Zapf, A.; Kohl, S.; Timmermann, L.; Tittgemeyer, M.; Huys, D.; Visser-Vandewalle, V.; Kühn, A.A.; Horn, A.; et al. Connectivity profile predictive of effective deep brain stimulation in obsessive-compulsive disorder. Biol. Psychiatry 2019, 85, 735–743. [Google Scholar] [CrossRef]
- Wang, Q.; Akram, H.; Muthuraman, M.; Gonzales-Escamilla, G.; Sheth, S.A.; Oxenford, S.; Yeh, F.-C.; Groppa, S.; Vanegas-Arroyave, N.; Zrinzo, L.; et al. Normative vs. patient-specific brain connectivity in deep brain stimulation. NeuroImage 2021, 224, 117307. [Google Scholar] [CrossRef]


| Patient Number | Frequency (Hz) | Pulse Width (µs) | Amplitude (V) |
|---|---|---|---|
| Patient 1 | 130 | 90 | 3.2 |
| Patient 2 | 100 | 90 | 3.0 |
| Patient 3 | 130 | 90 | 3.3 |
Publisher’s Note: MDPI stays neutral with regard to jurisdictional claims in published maps and institutional affiliations. |
© 2021 by the authors. Licensee MDPI, Basel, Switzerland. This article is an open access article distributed under the terms and conditions of the Creative Commons Attribution (CC BY) license (http://creativecommons.org/licenses/by/4.0/).
Share and Cite
Heiden, P.; Hoevels, M.; Bayram, D.; Baldermann, J.C.; Schüller, T.; Huys, D.; Visser-Vandewalle, V.; Andrade, P. Connectivity Patterns of Deep Brain Stimulation Targets in Patients with Gilles de la Tourette Syndrome. Brain Sci. 2021, 11, 87. https://doi.org/10.3390/brainsci11010087
Heiden P, Hoevels M, Bayram D, Baldermann JC, Schüller T, Huys D, Visser-Vandewalle V, Andrade P. Connectivity Patterns of Deep Brain Stimulation Targets in Patients with Gilles de la Tourette Syndrome. Brain Sciences. 2021; 11(1):87. https://doi.org/10.3390/brainsci11010087
Chicago/Turabian StyleHeiden, Petra, Mauritius Hoevels, Dilruba Bayram, Juan C. Baldermann, Thomas Schüller, Daniel Huys, Veerle Visser-Vandewalle, and Pablo Andrade. 2021. "Connectivity Patterns of Deep Brain Stimulation Targets in Patients with Gilles de la Tourette Syndrome" Brain Sciences 11, no. 1: 87. https://doi.org/10.3390/brainsci11010087