Validation of a Numerical Bending Model for Sandwich Beams with Textile-Reinforced Cement Faces by Means of Digital Image Correlation


 , and
, and
Abstract
:1. Introduction
2. Materials and Methods
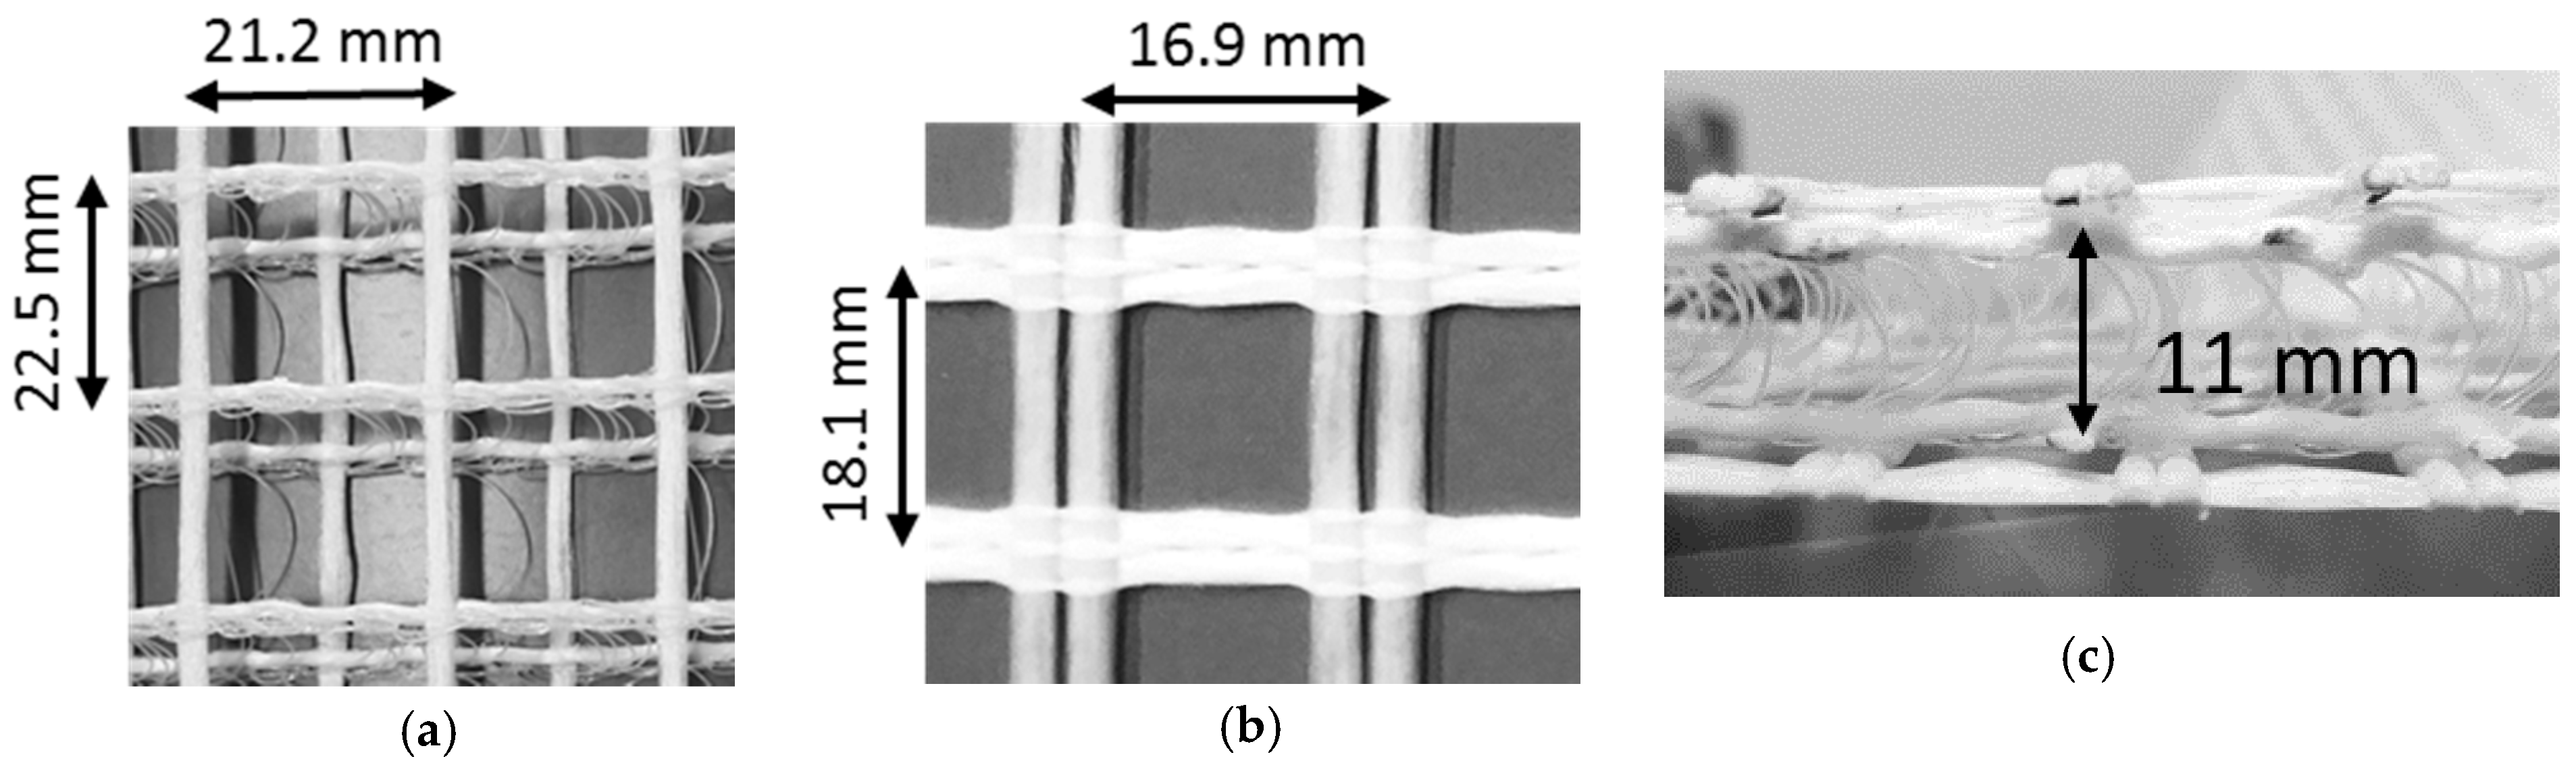
2.1. Textile-Reinforced Cement
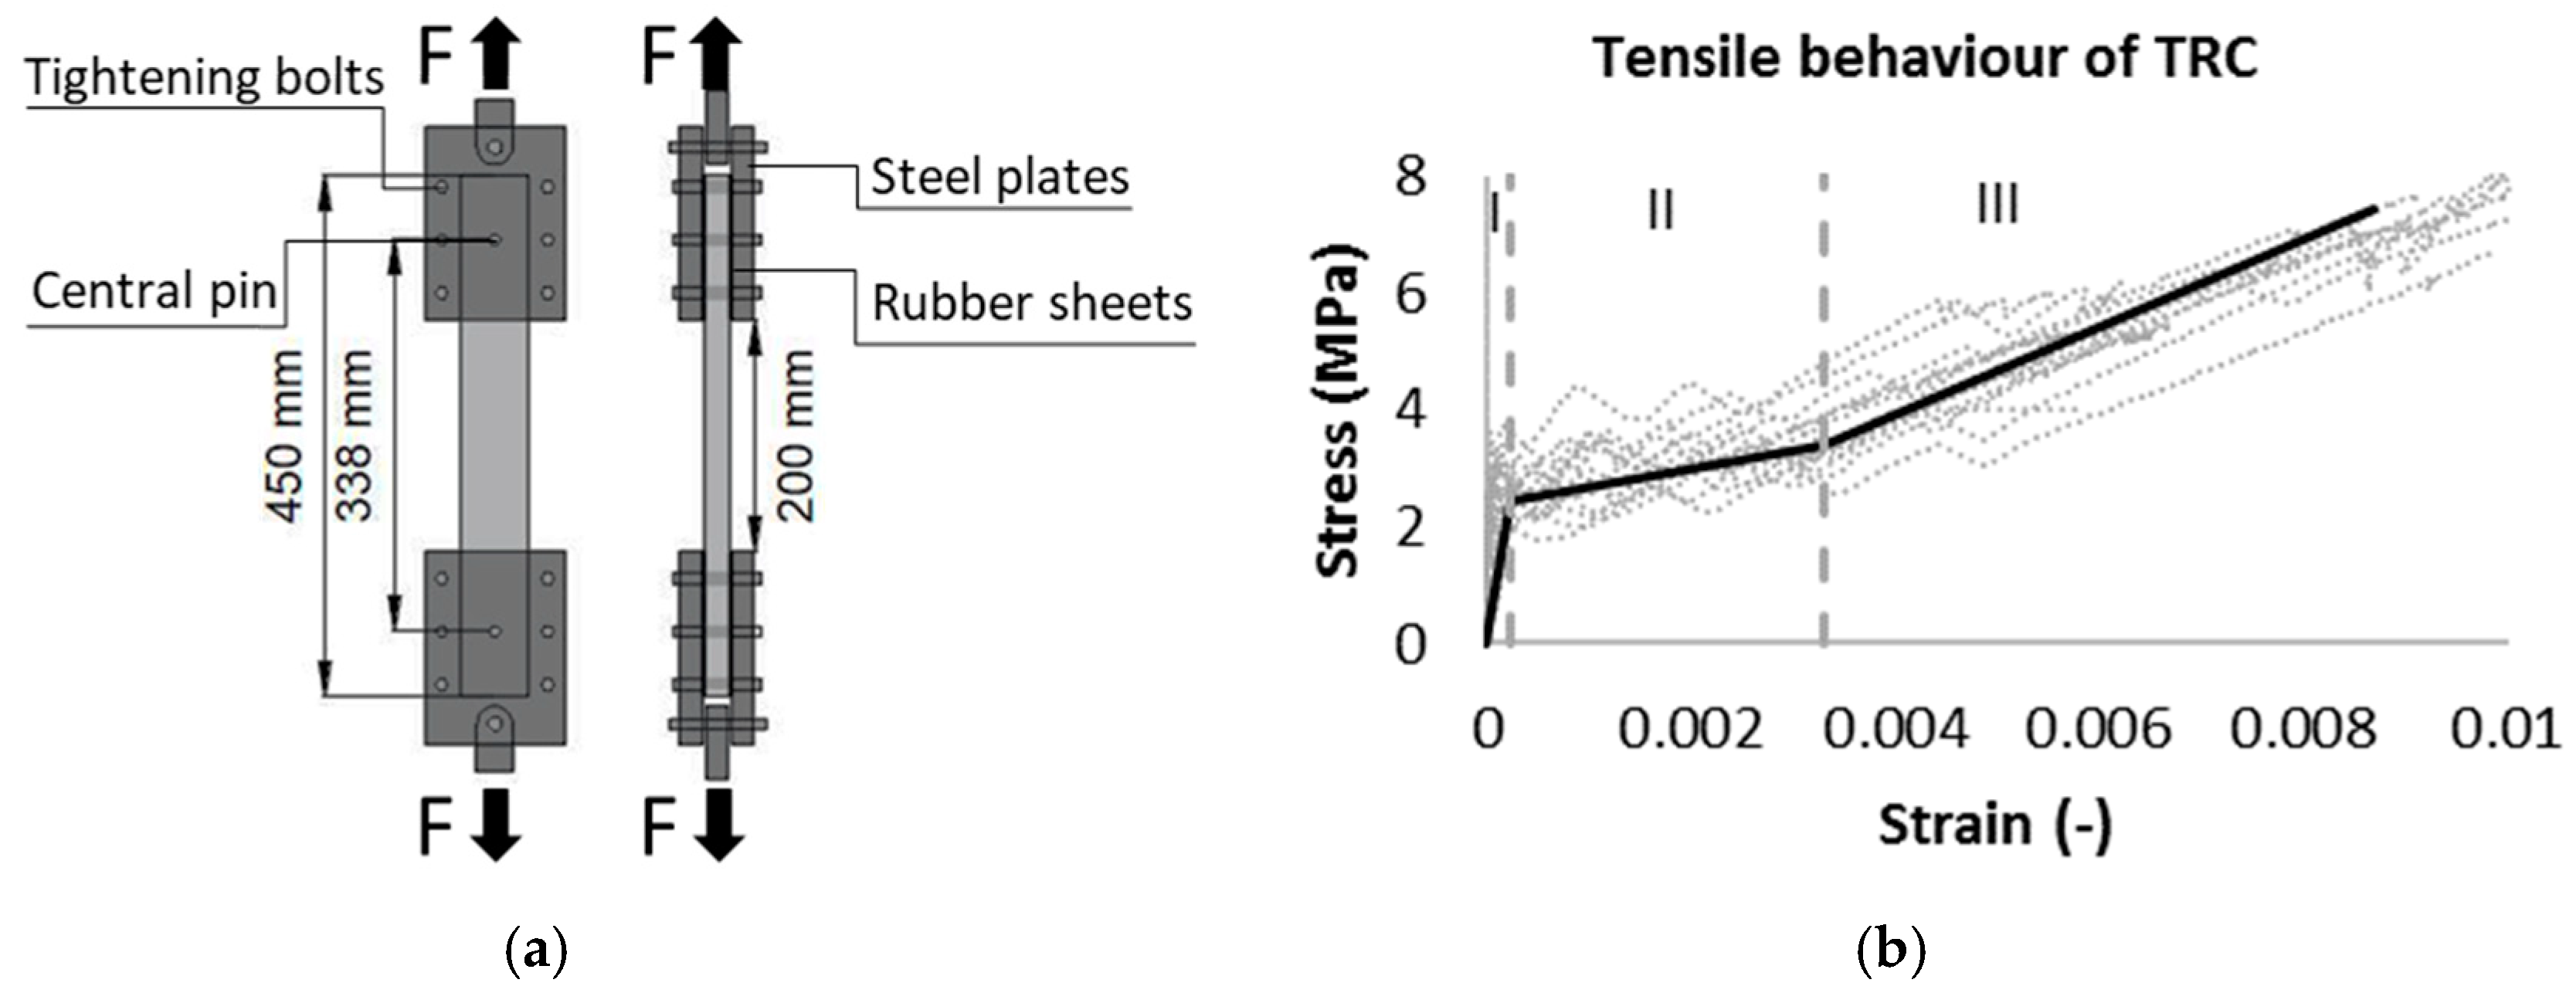
2.1.1. Tensile Behaviour of Textile-Reinforced Cement
2.2. Extruded Polystyrene Foam
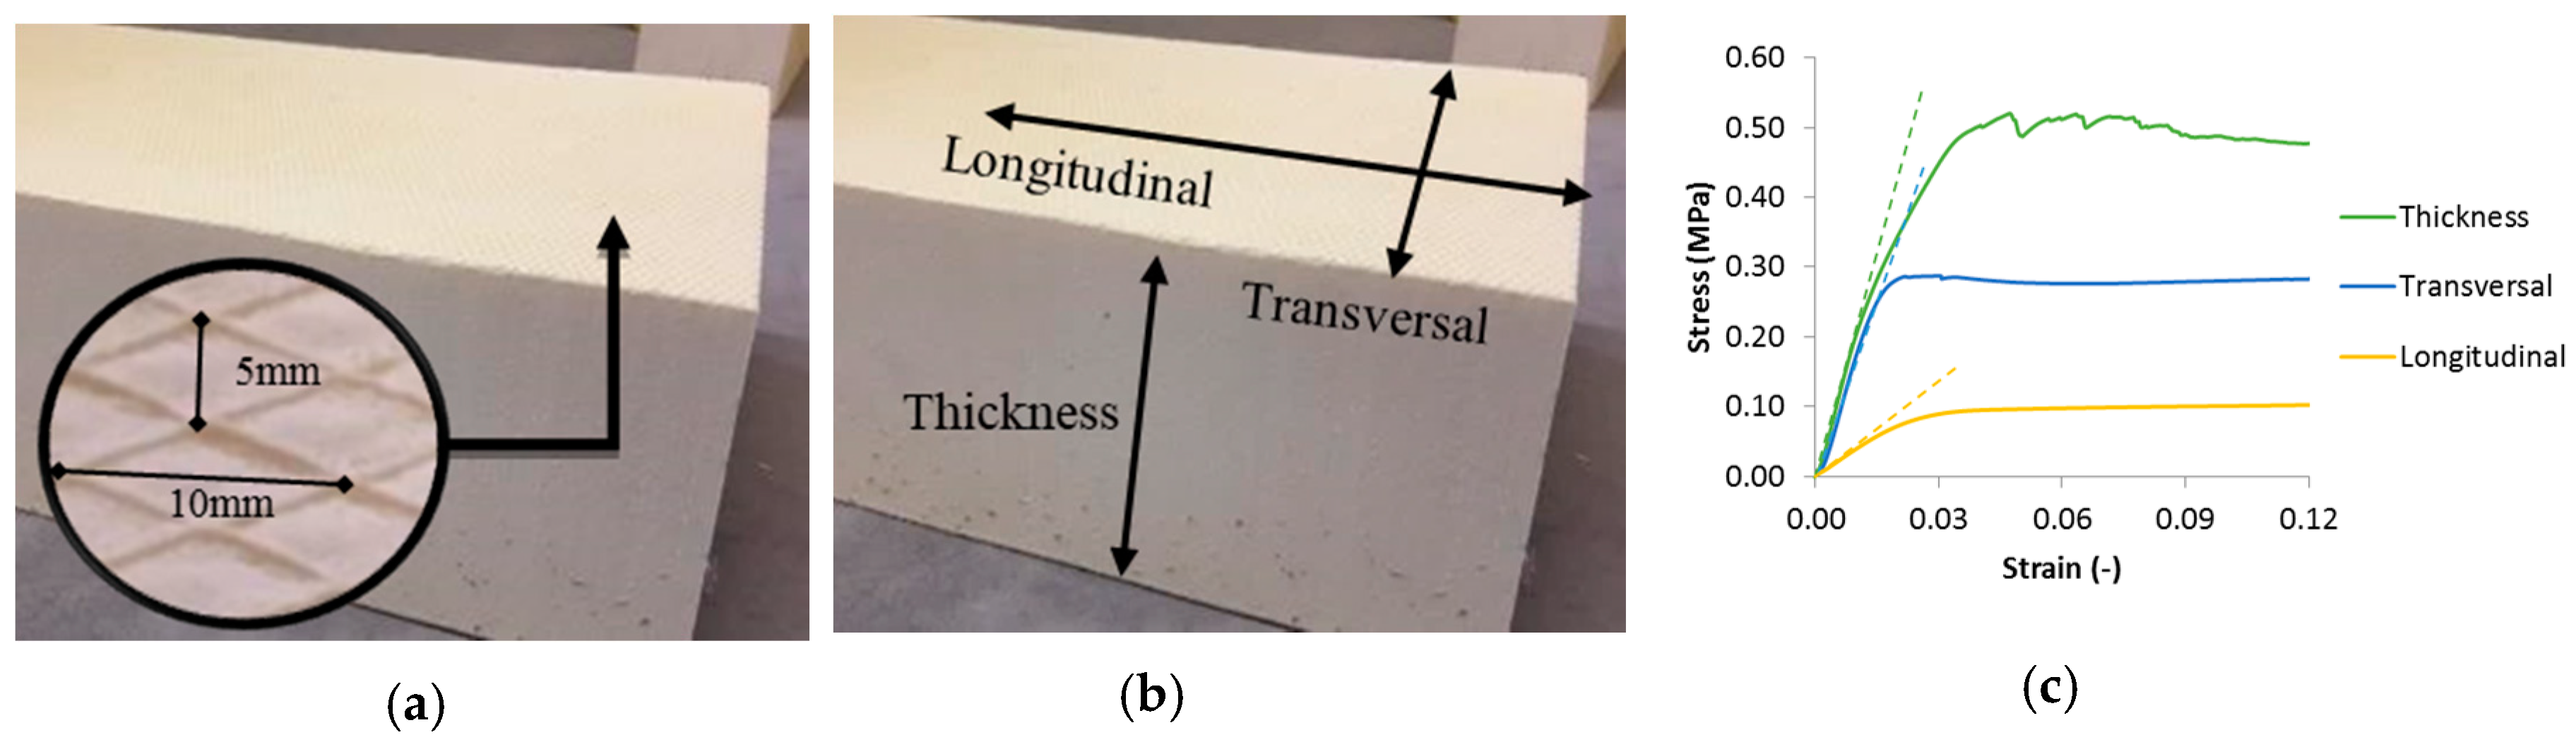
2.2.1. Compressive Behaviour of XPS
2.3. Production of Sandwich Beams
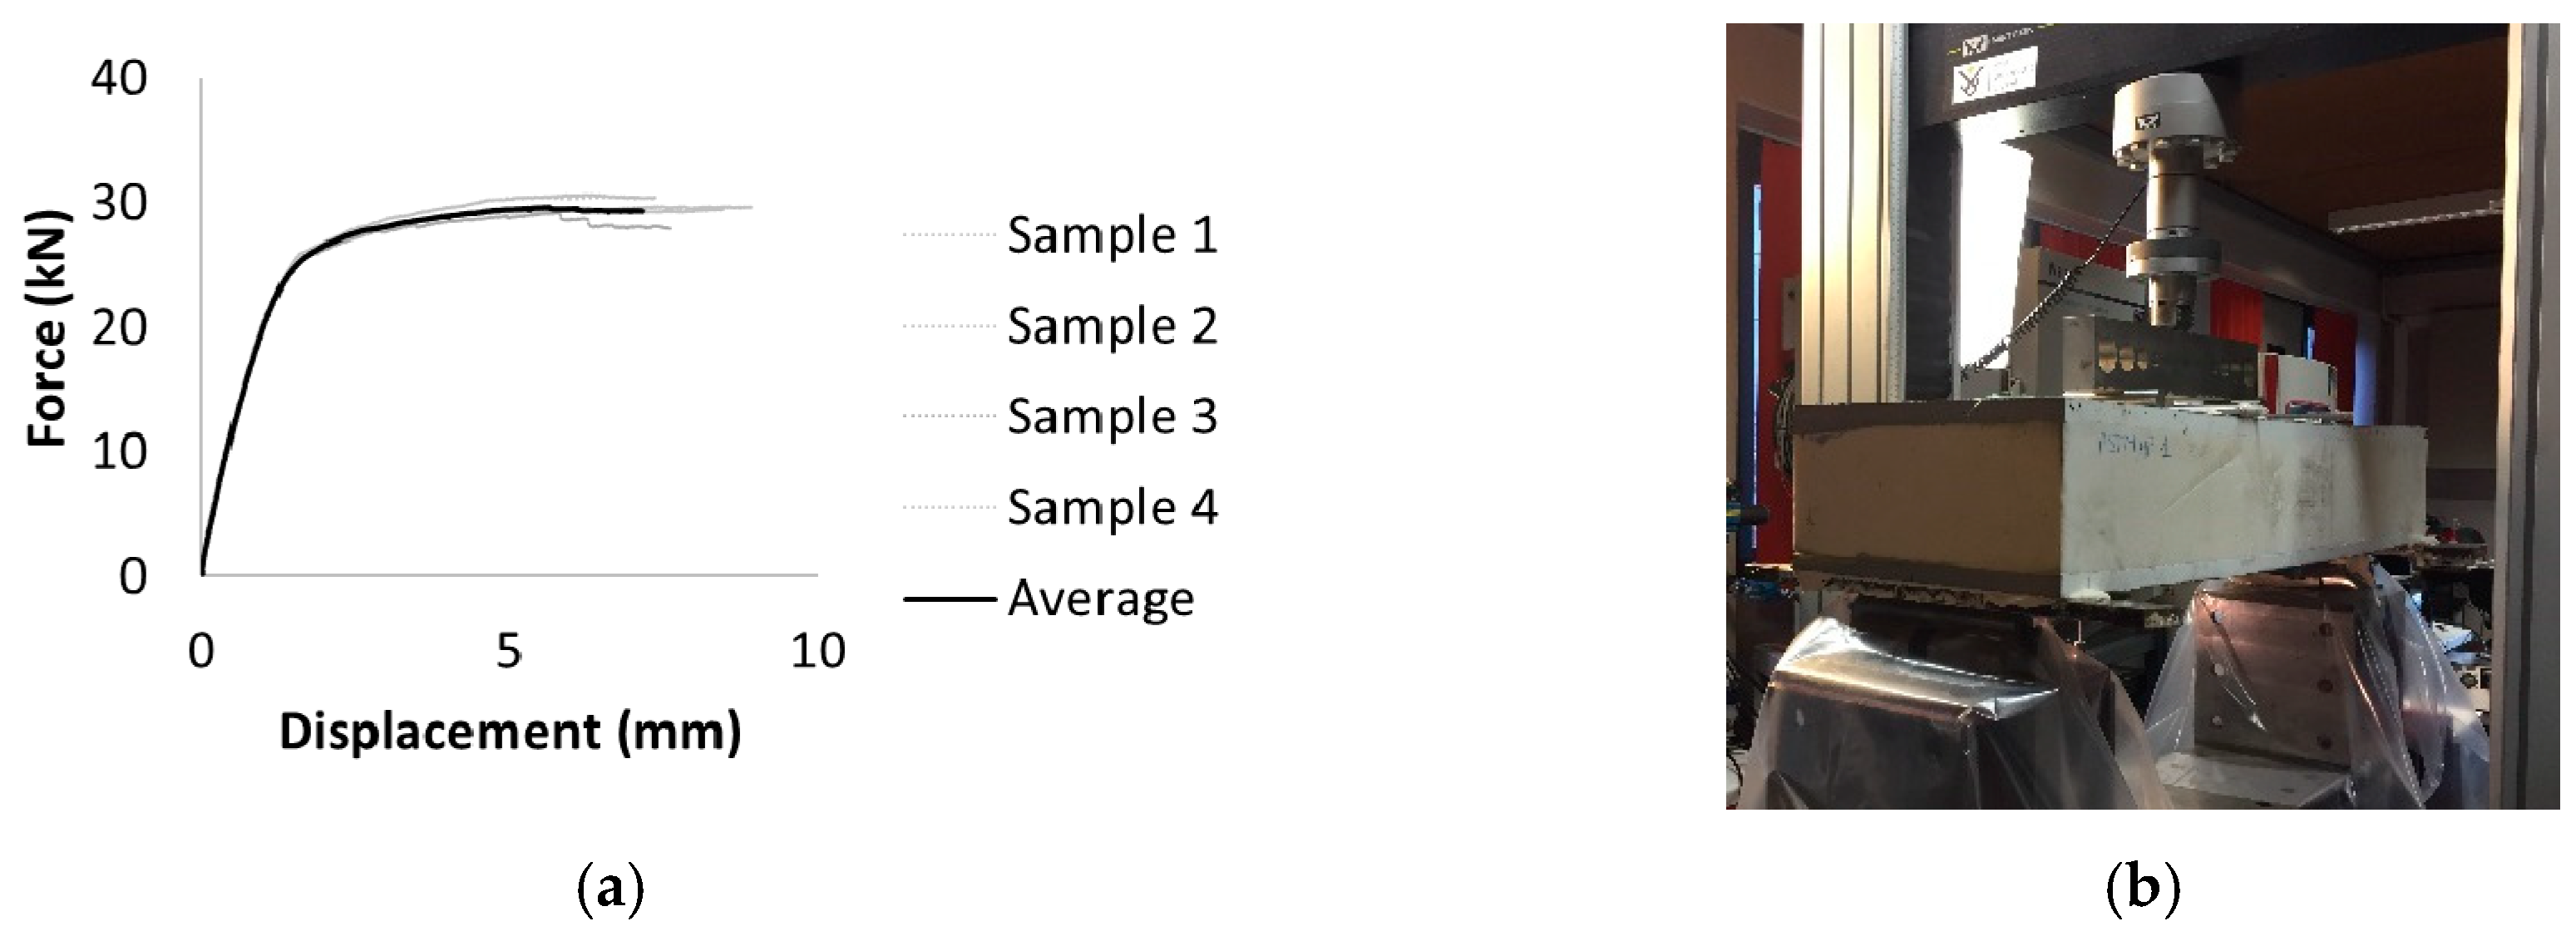
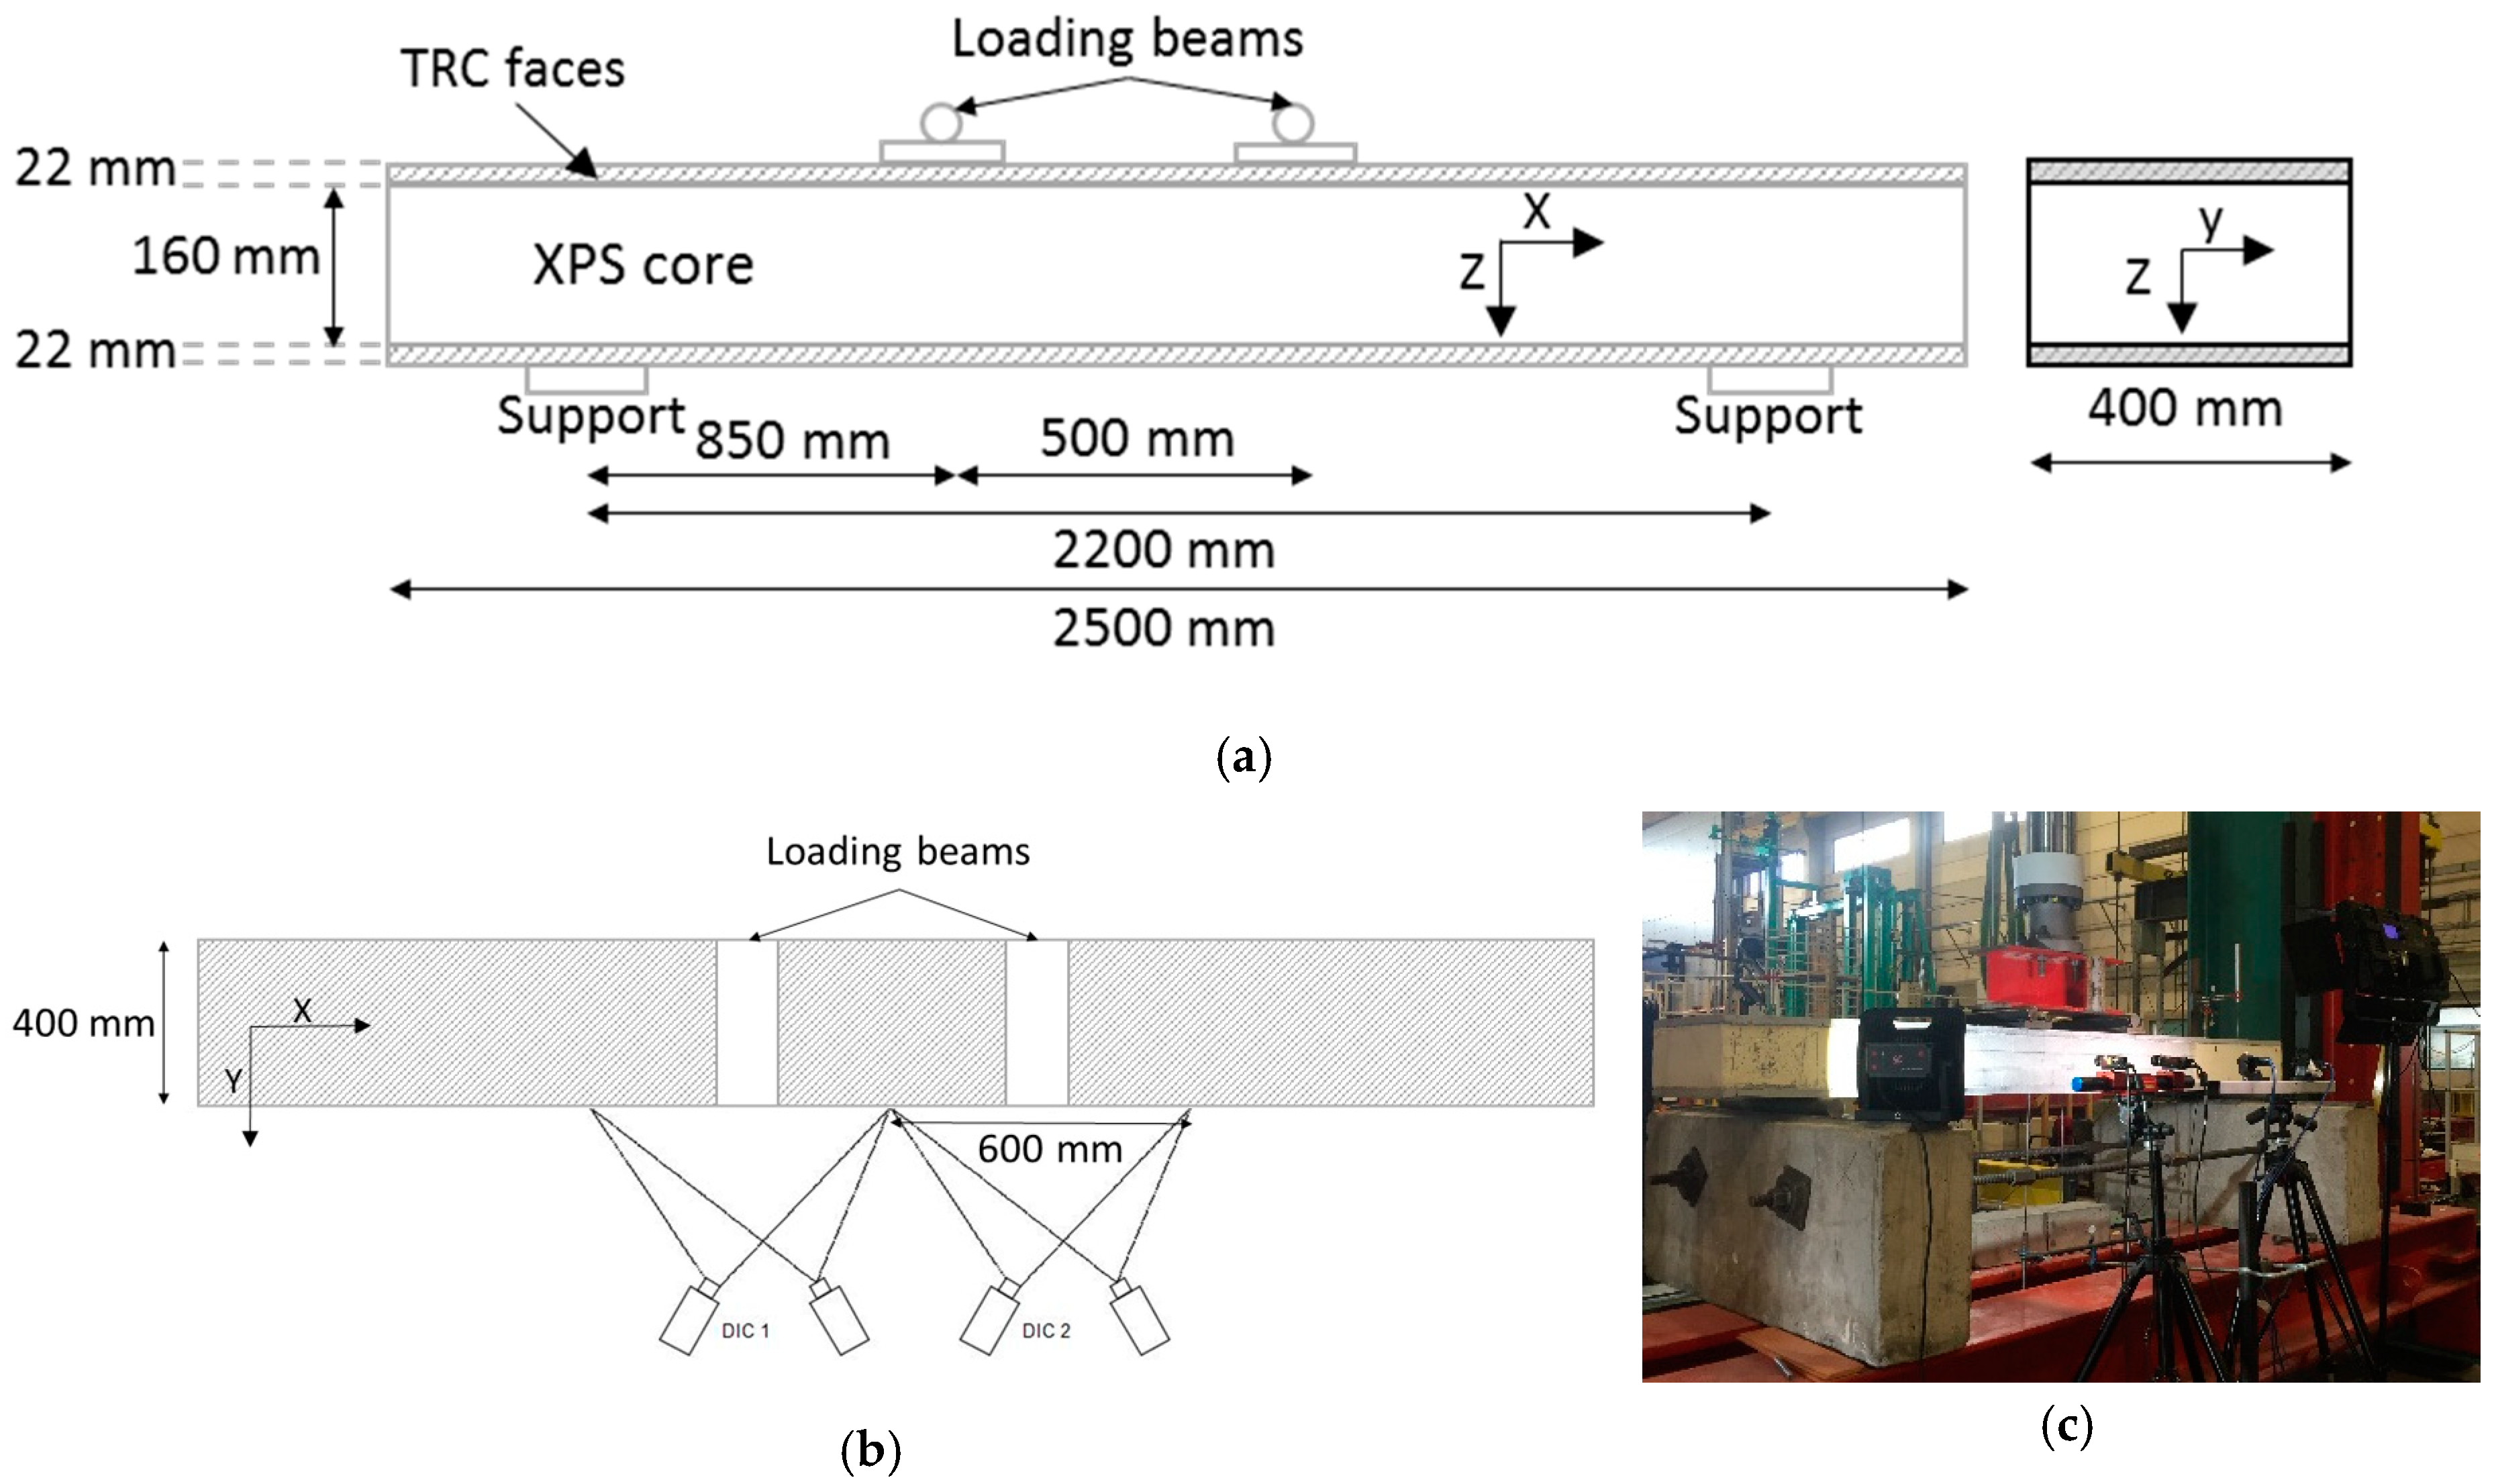
2.4. Four-Point Bending Set-Up
3. Numerical Model Definition
3.1. Material Definition
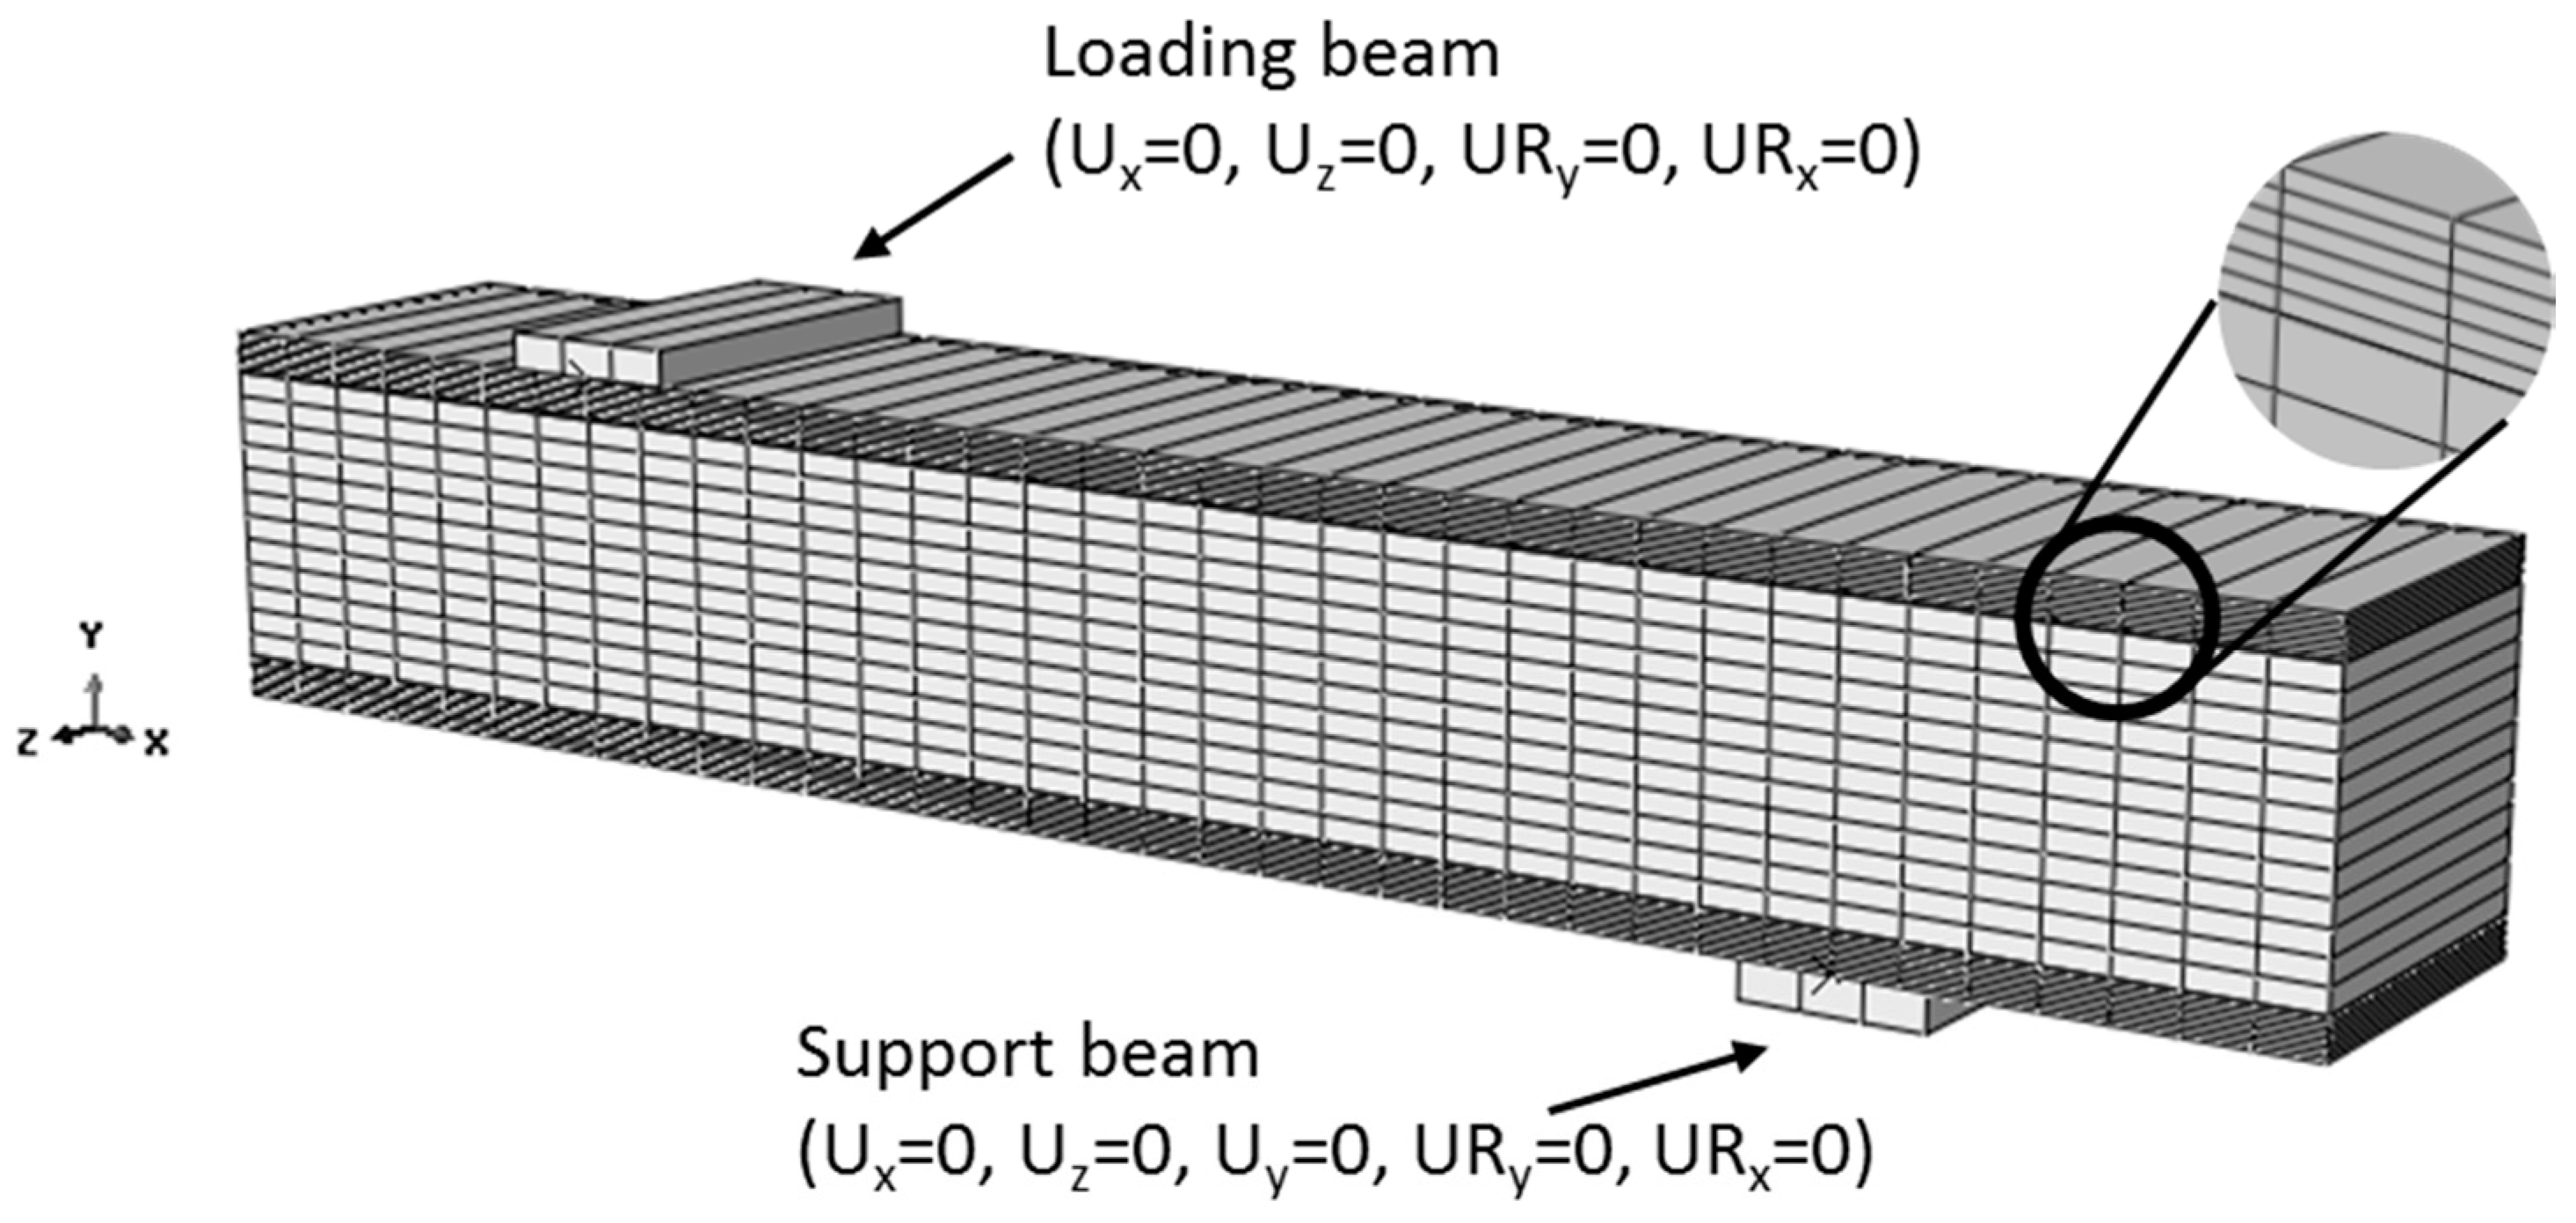
3.2. Cross Section and Boundary Conditions Modelling
4. Results and Discussion
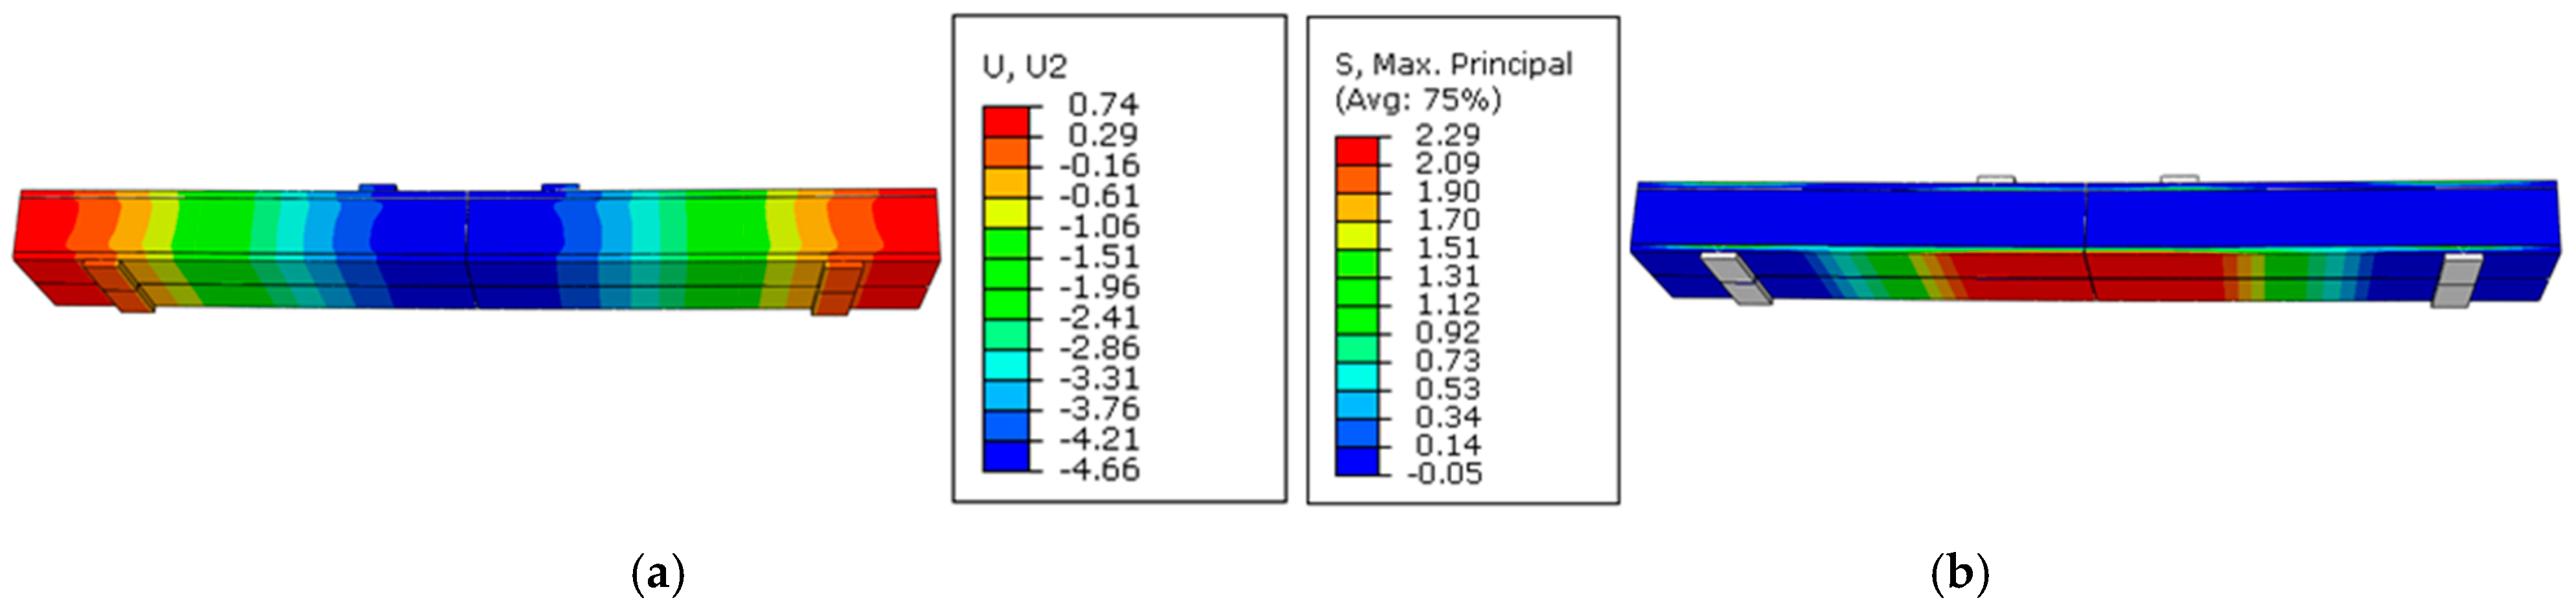
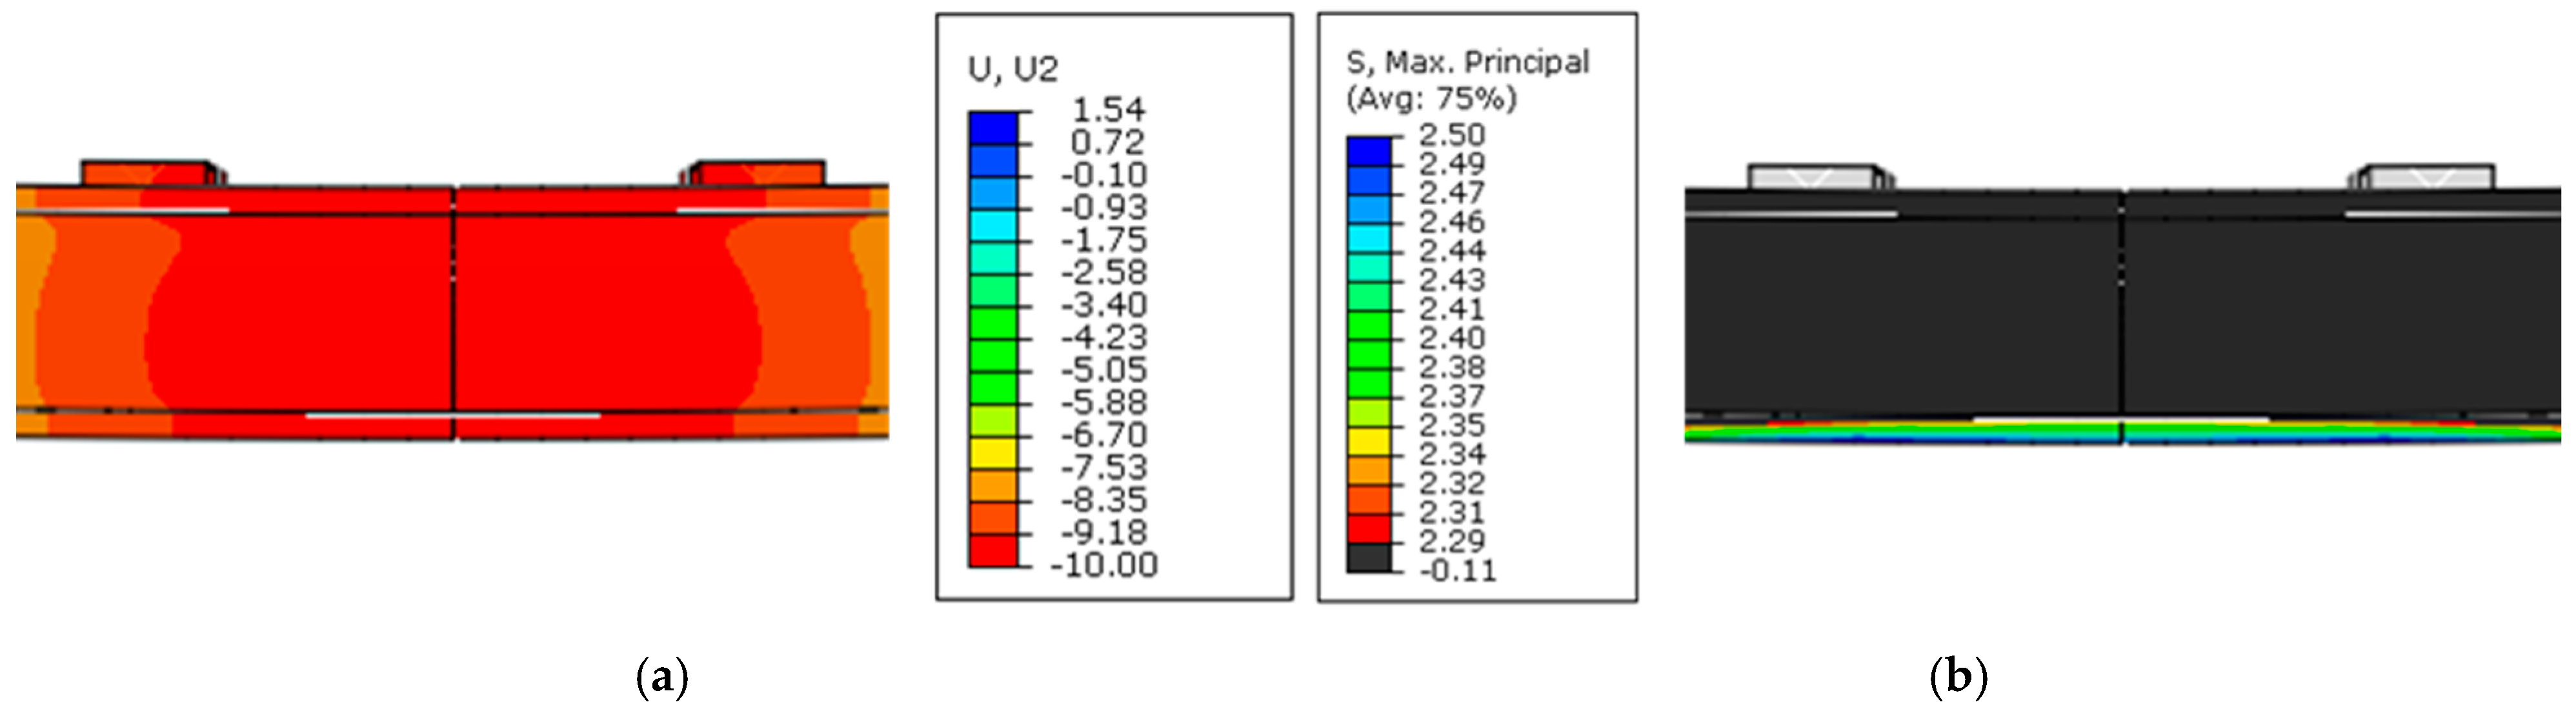
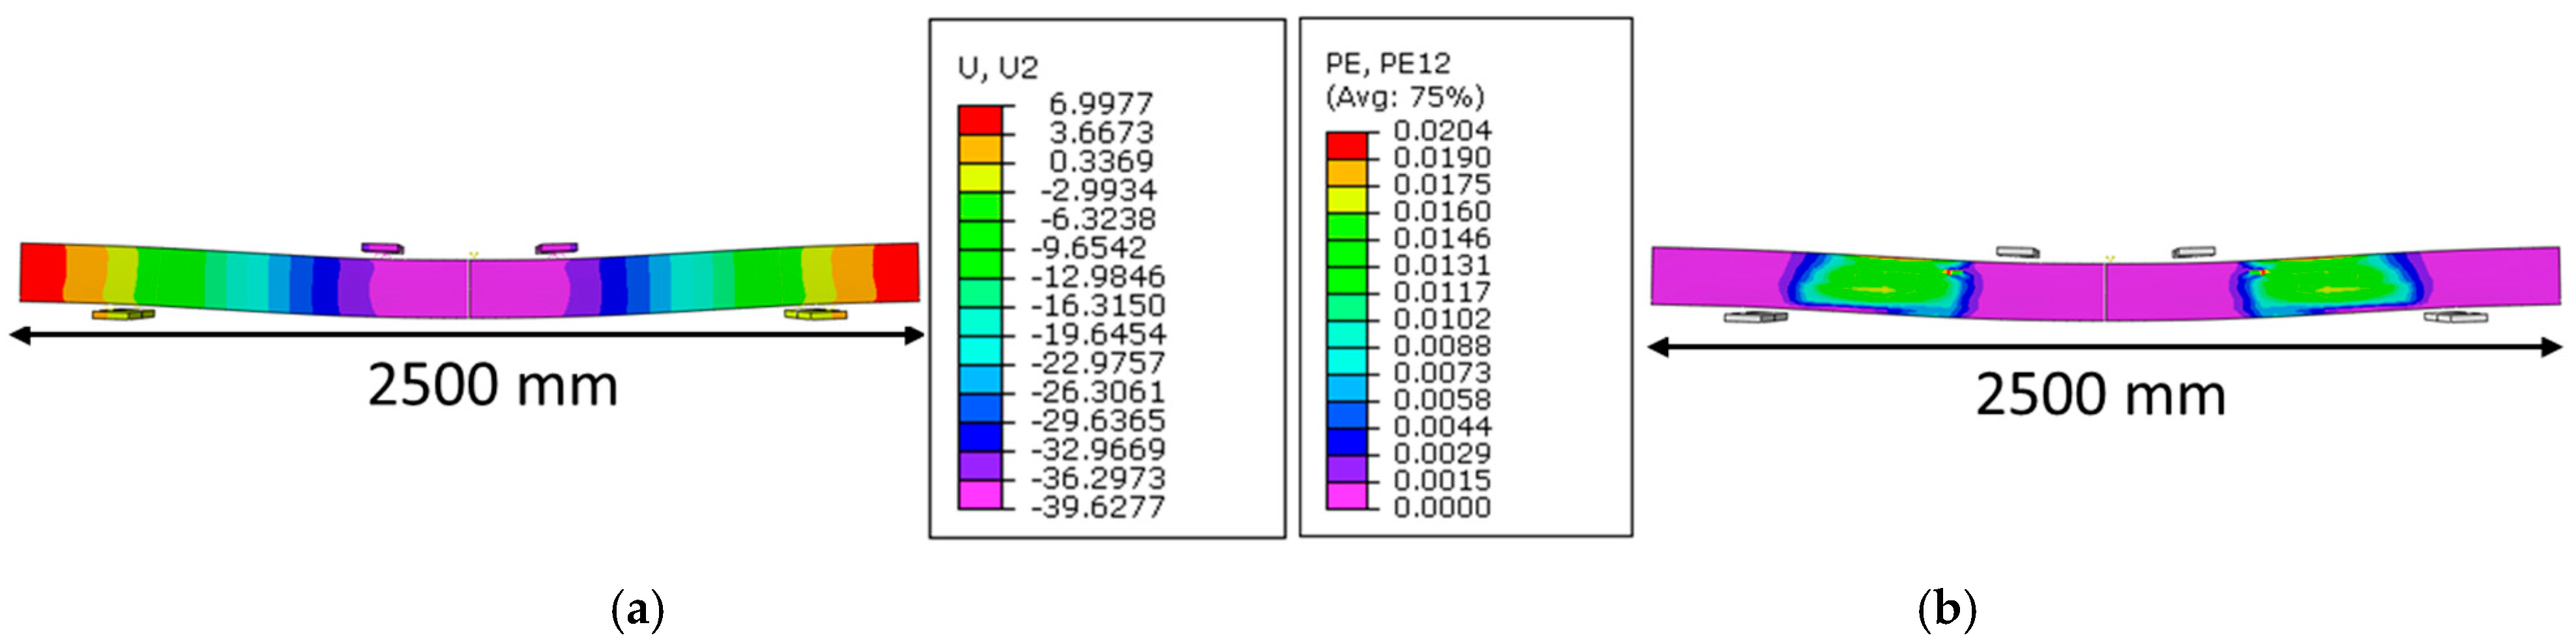
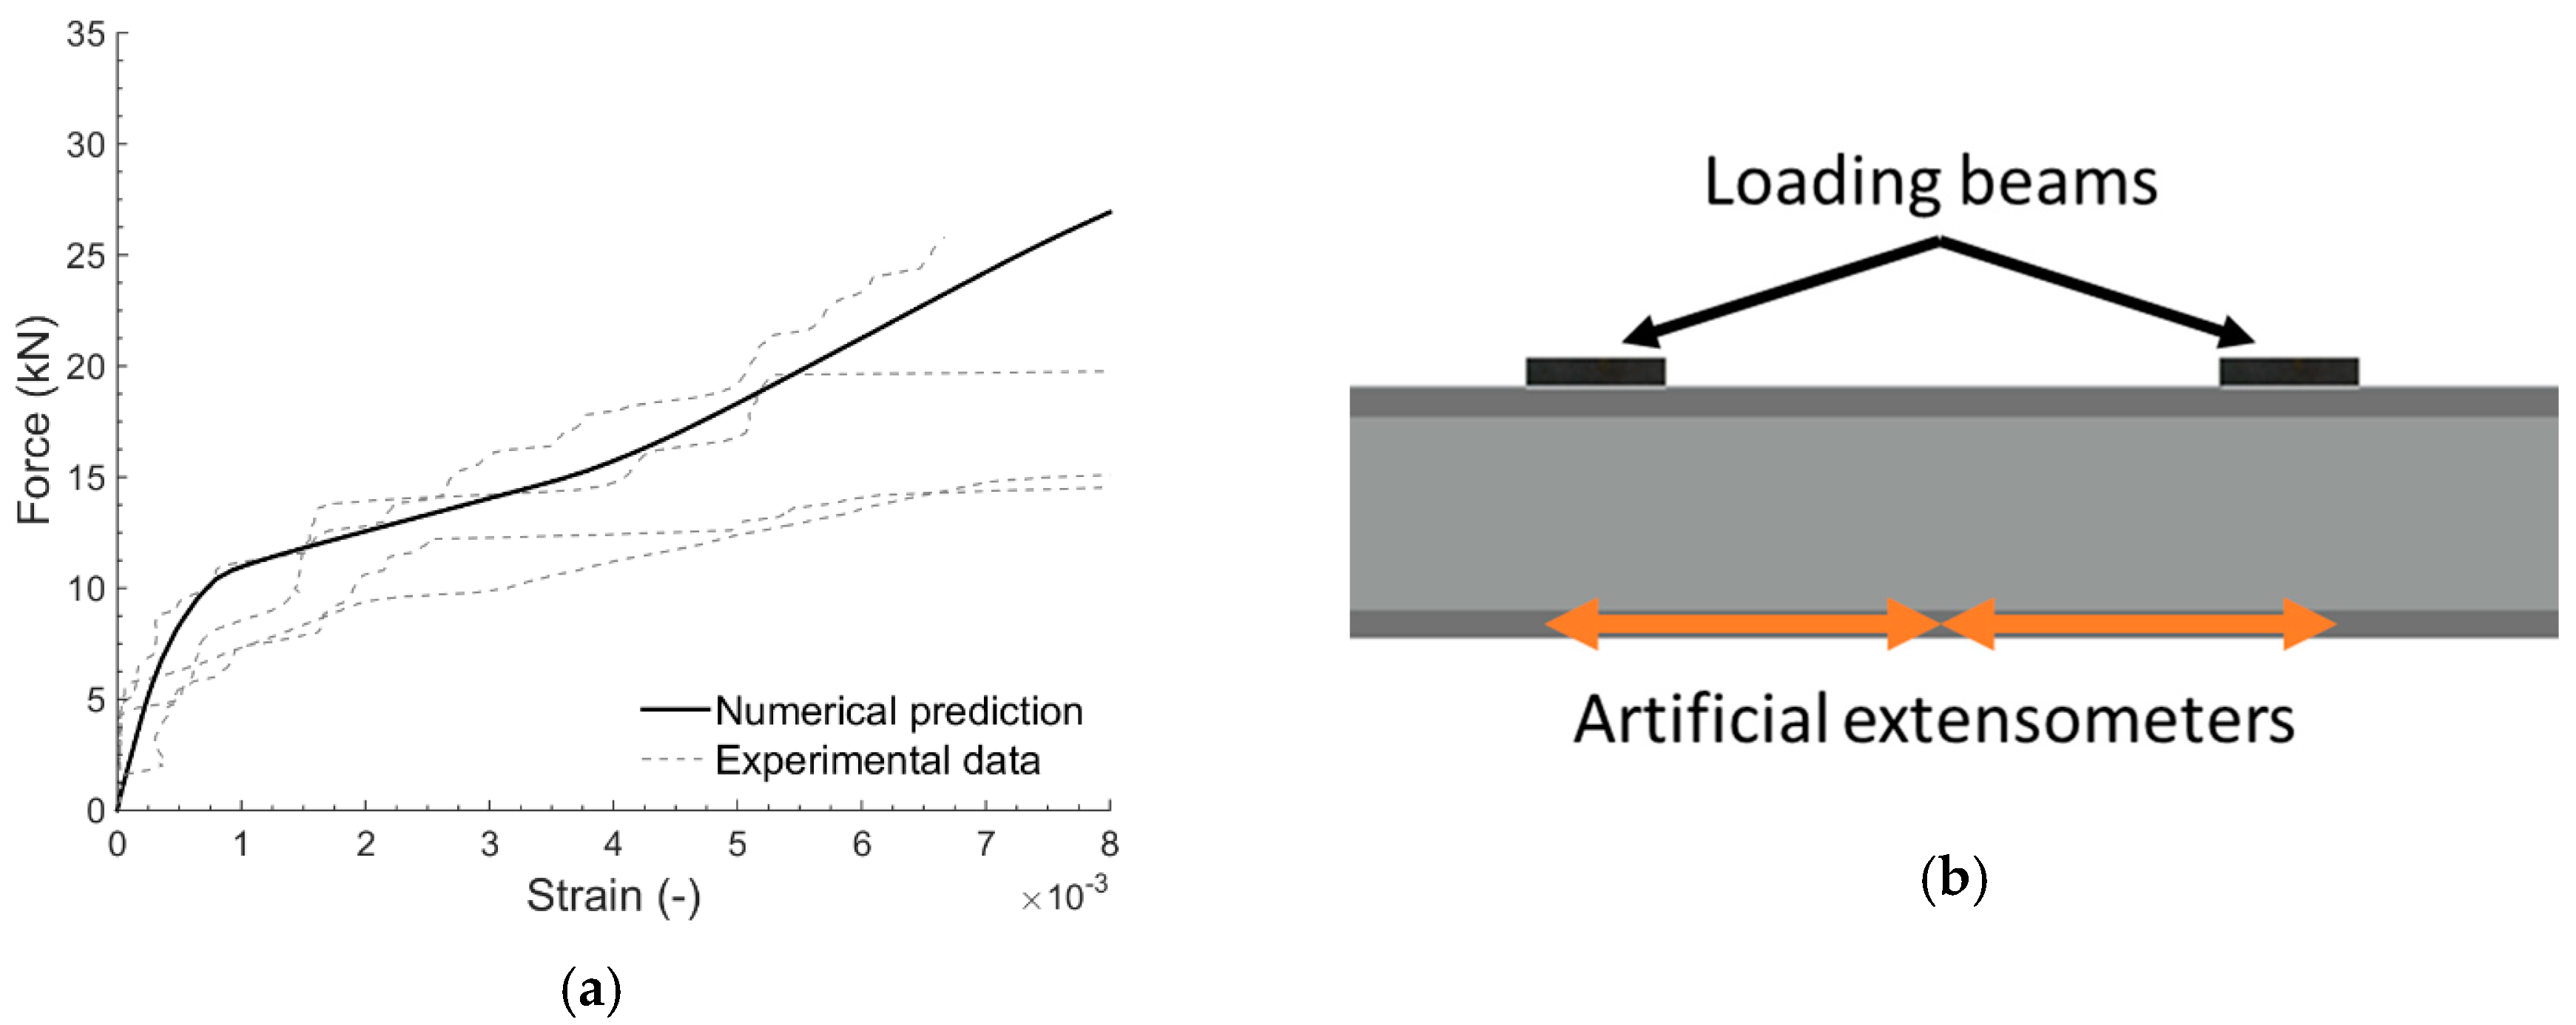
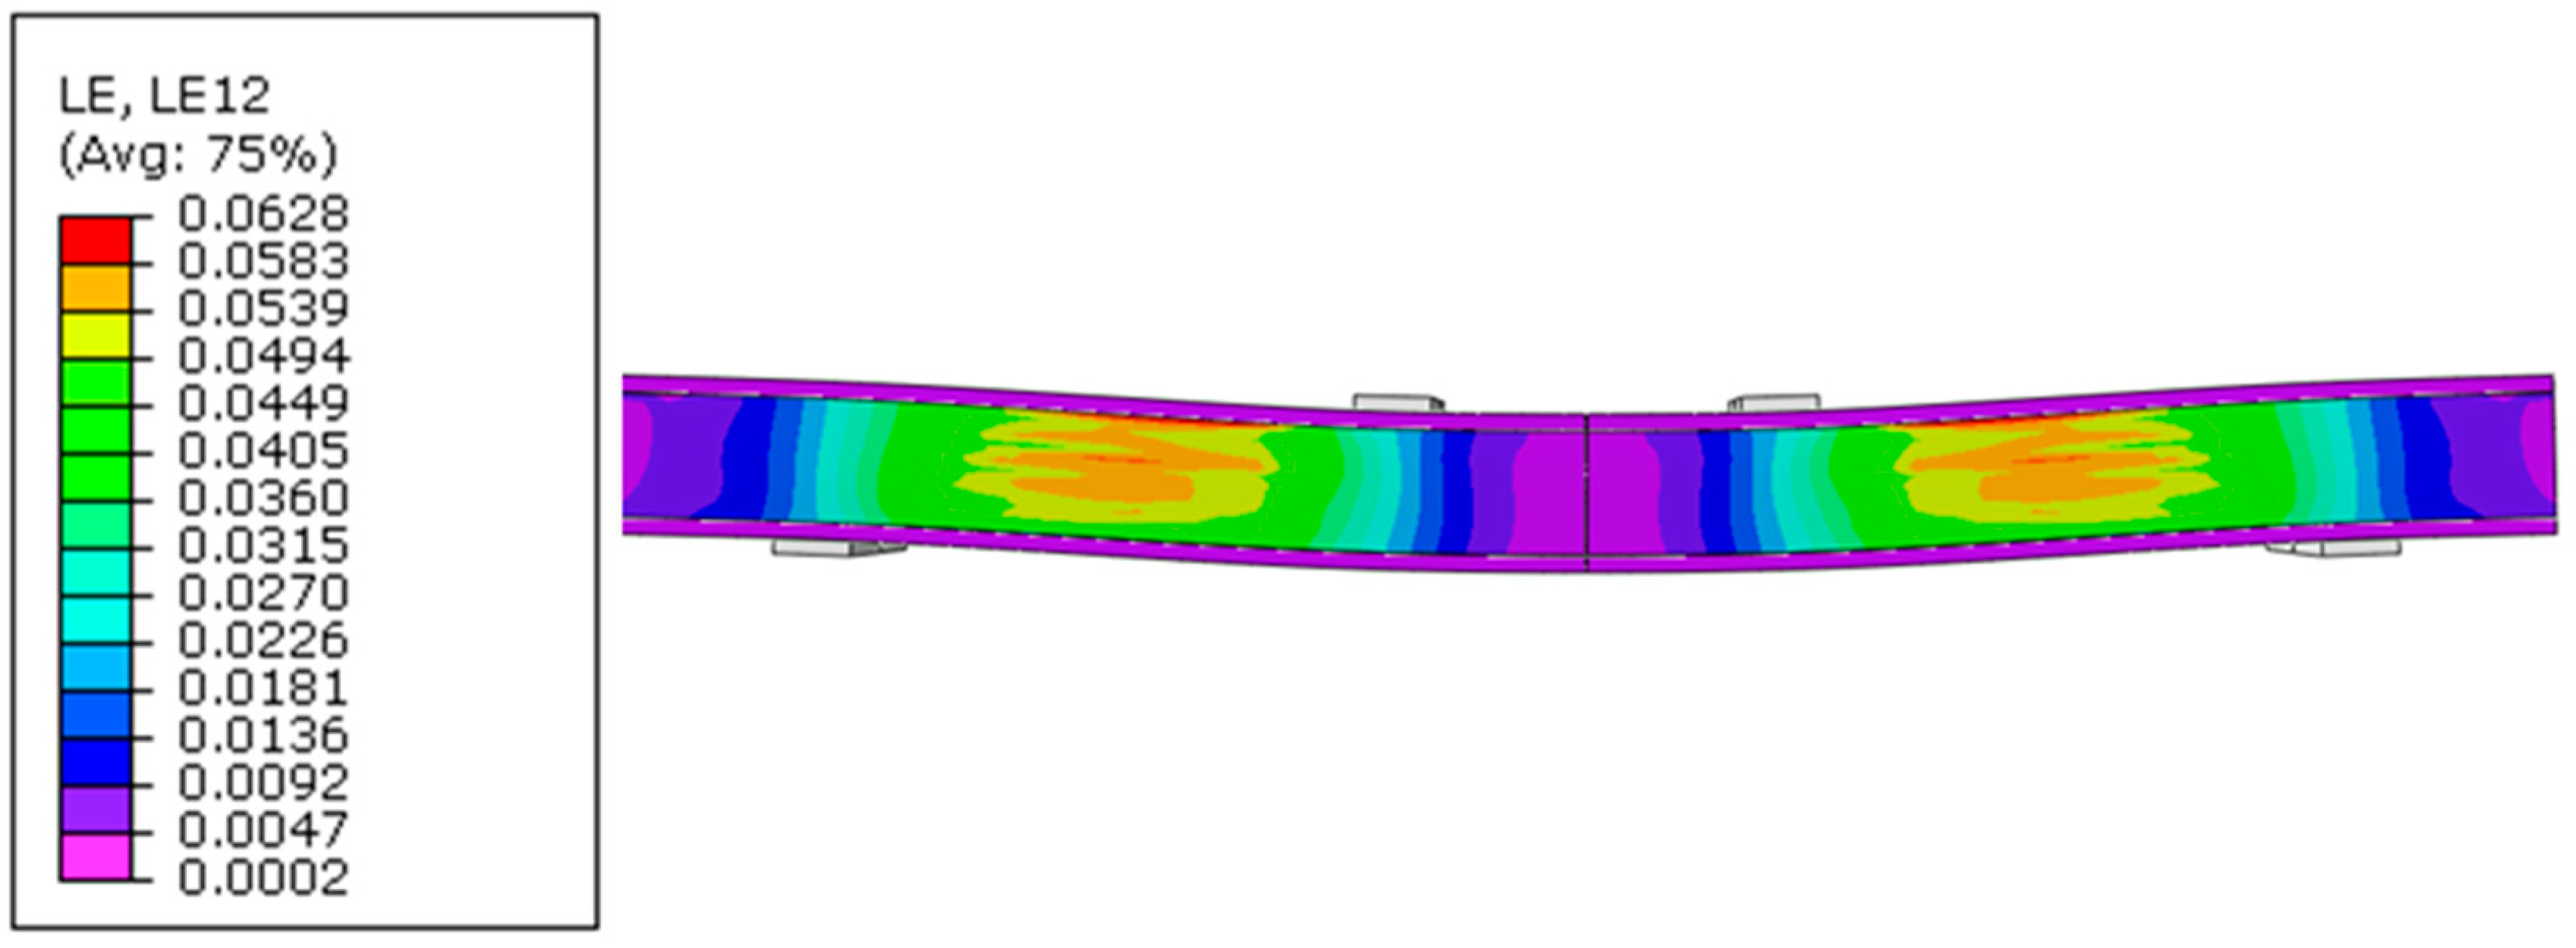
4.1. Numerical Model
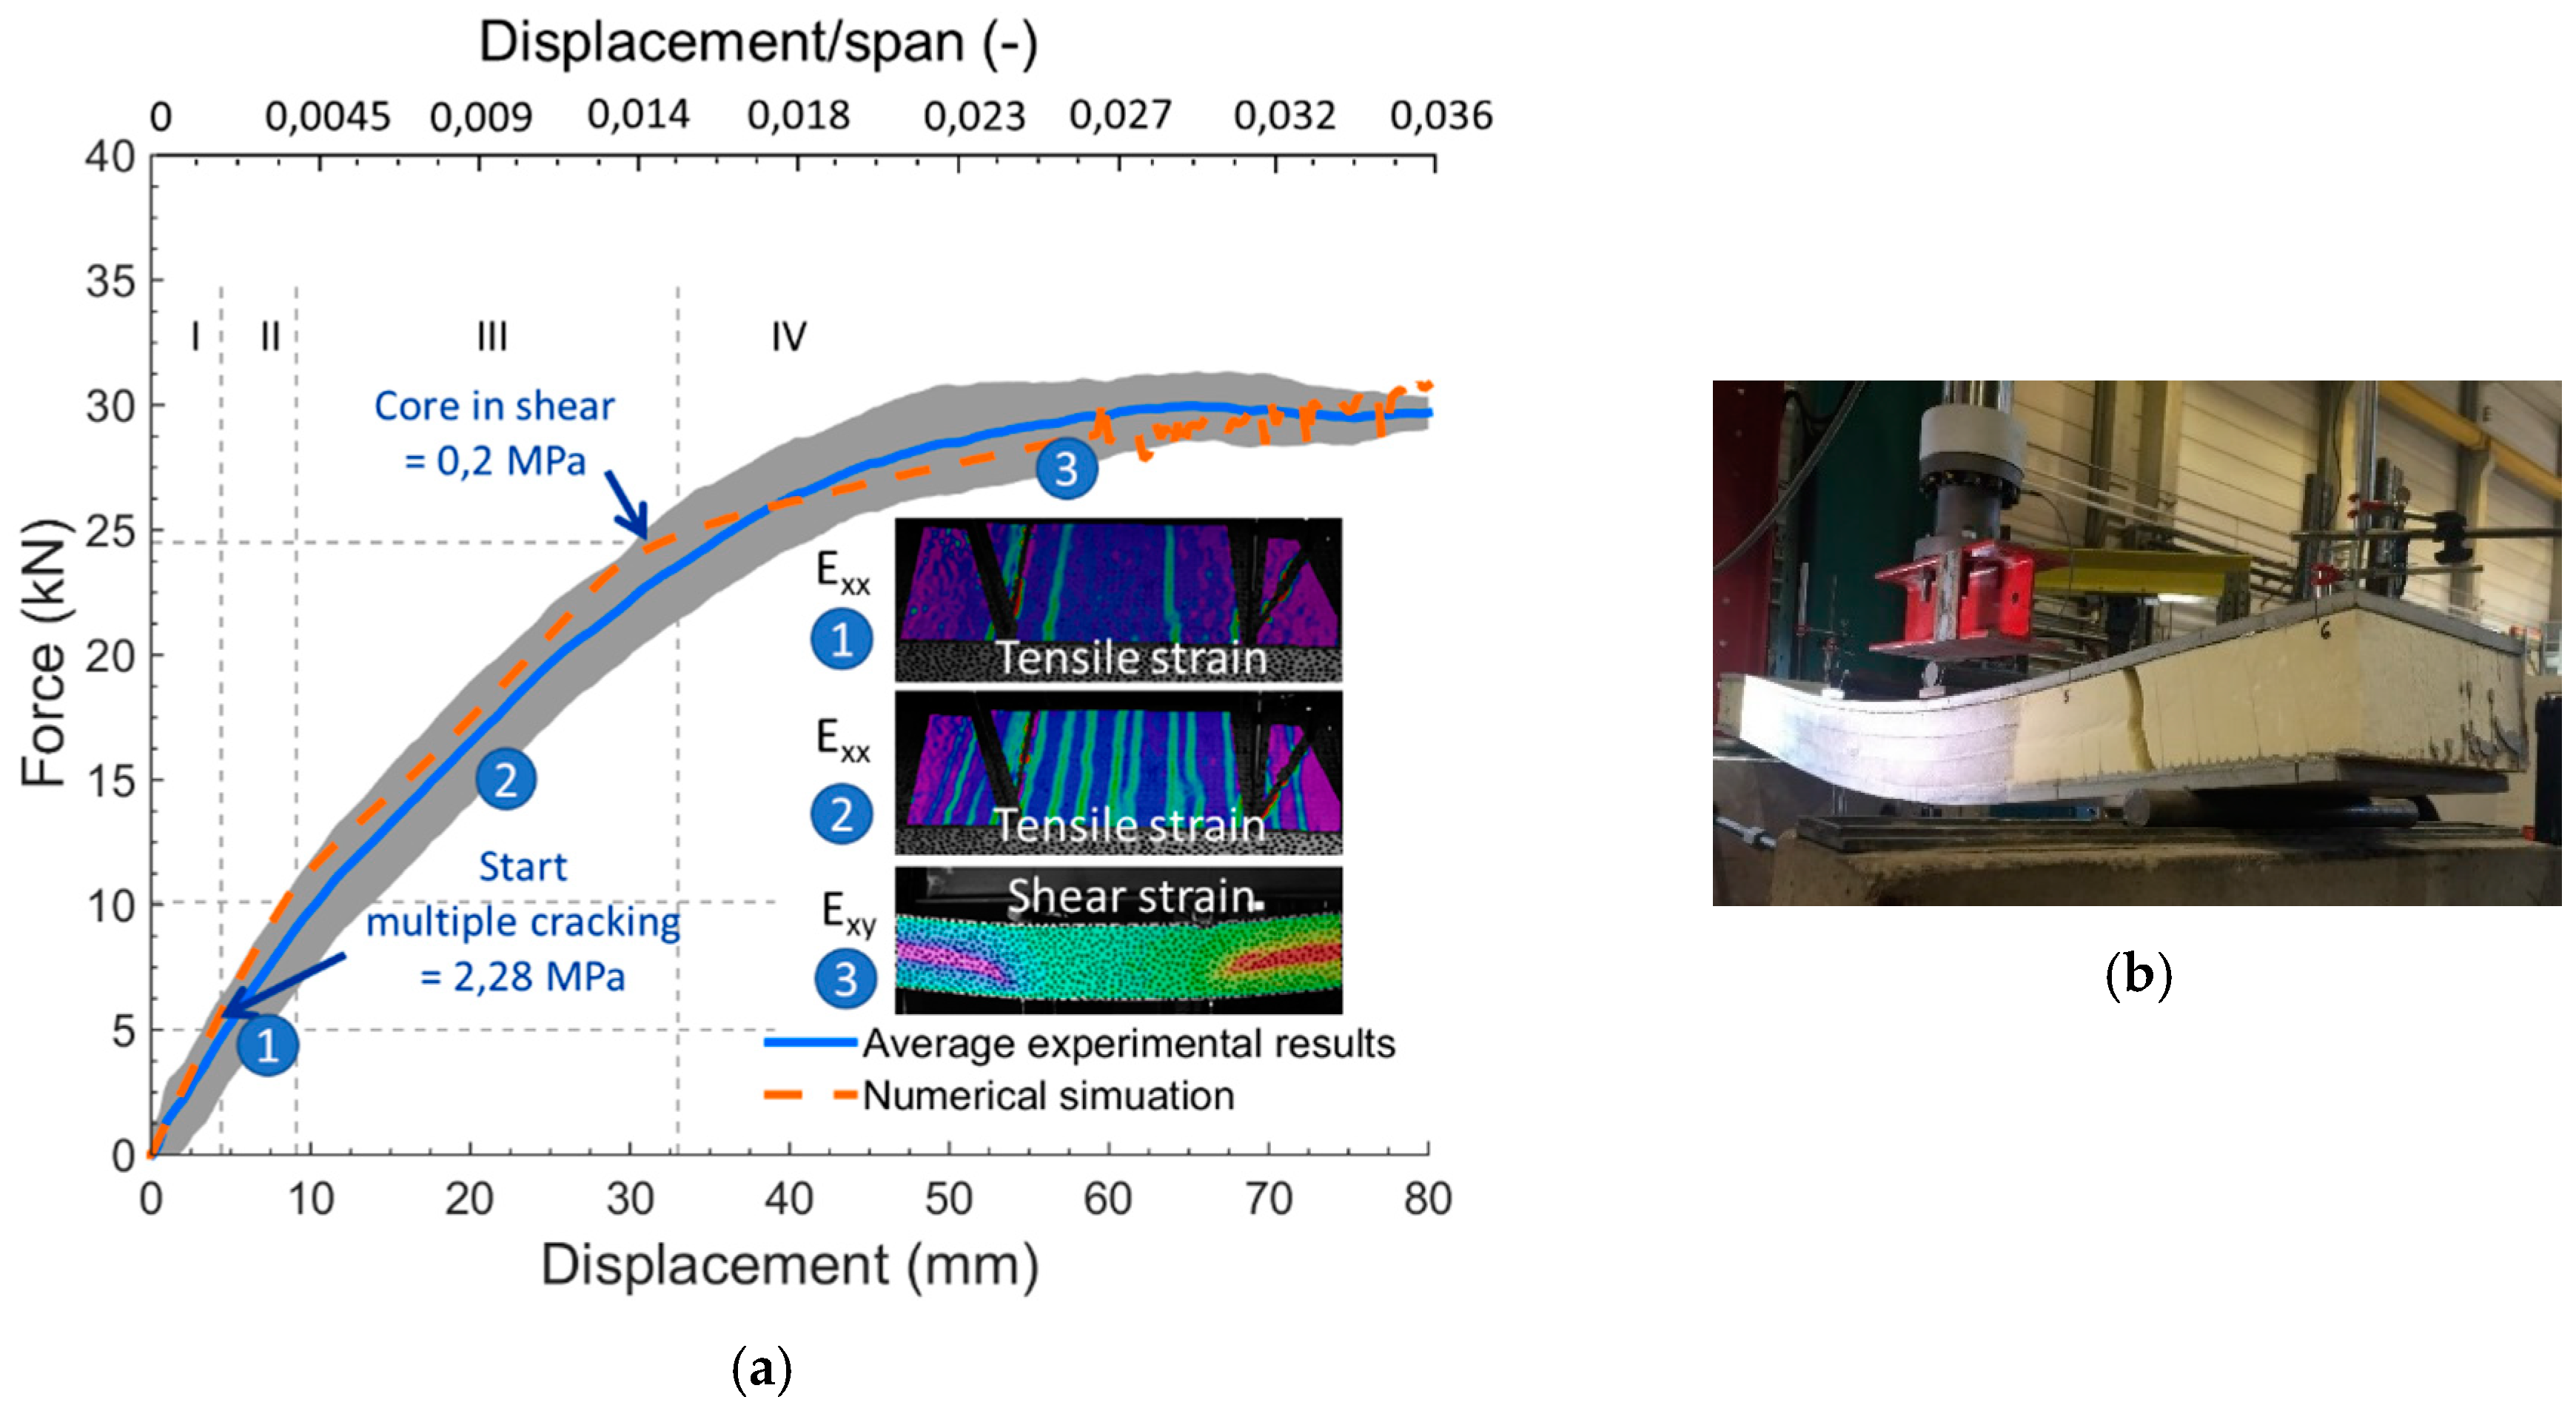
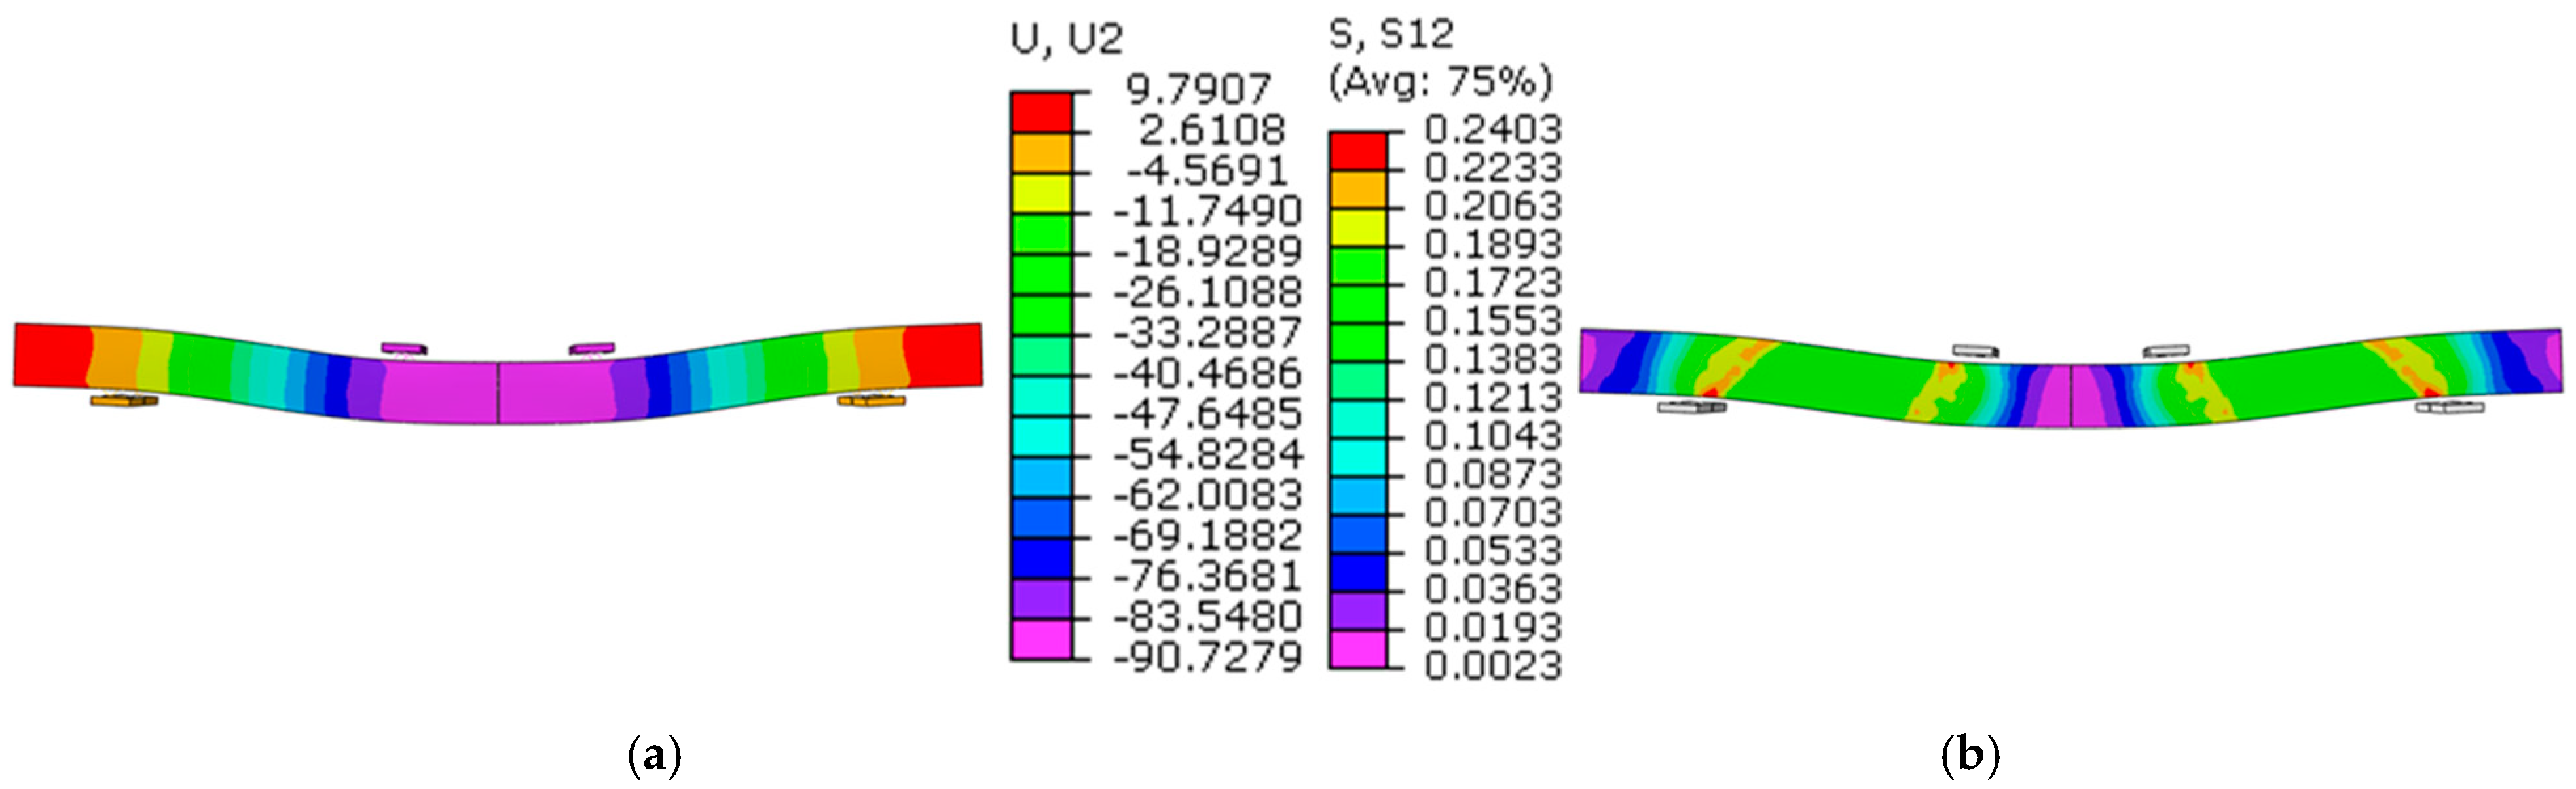
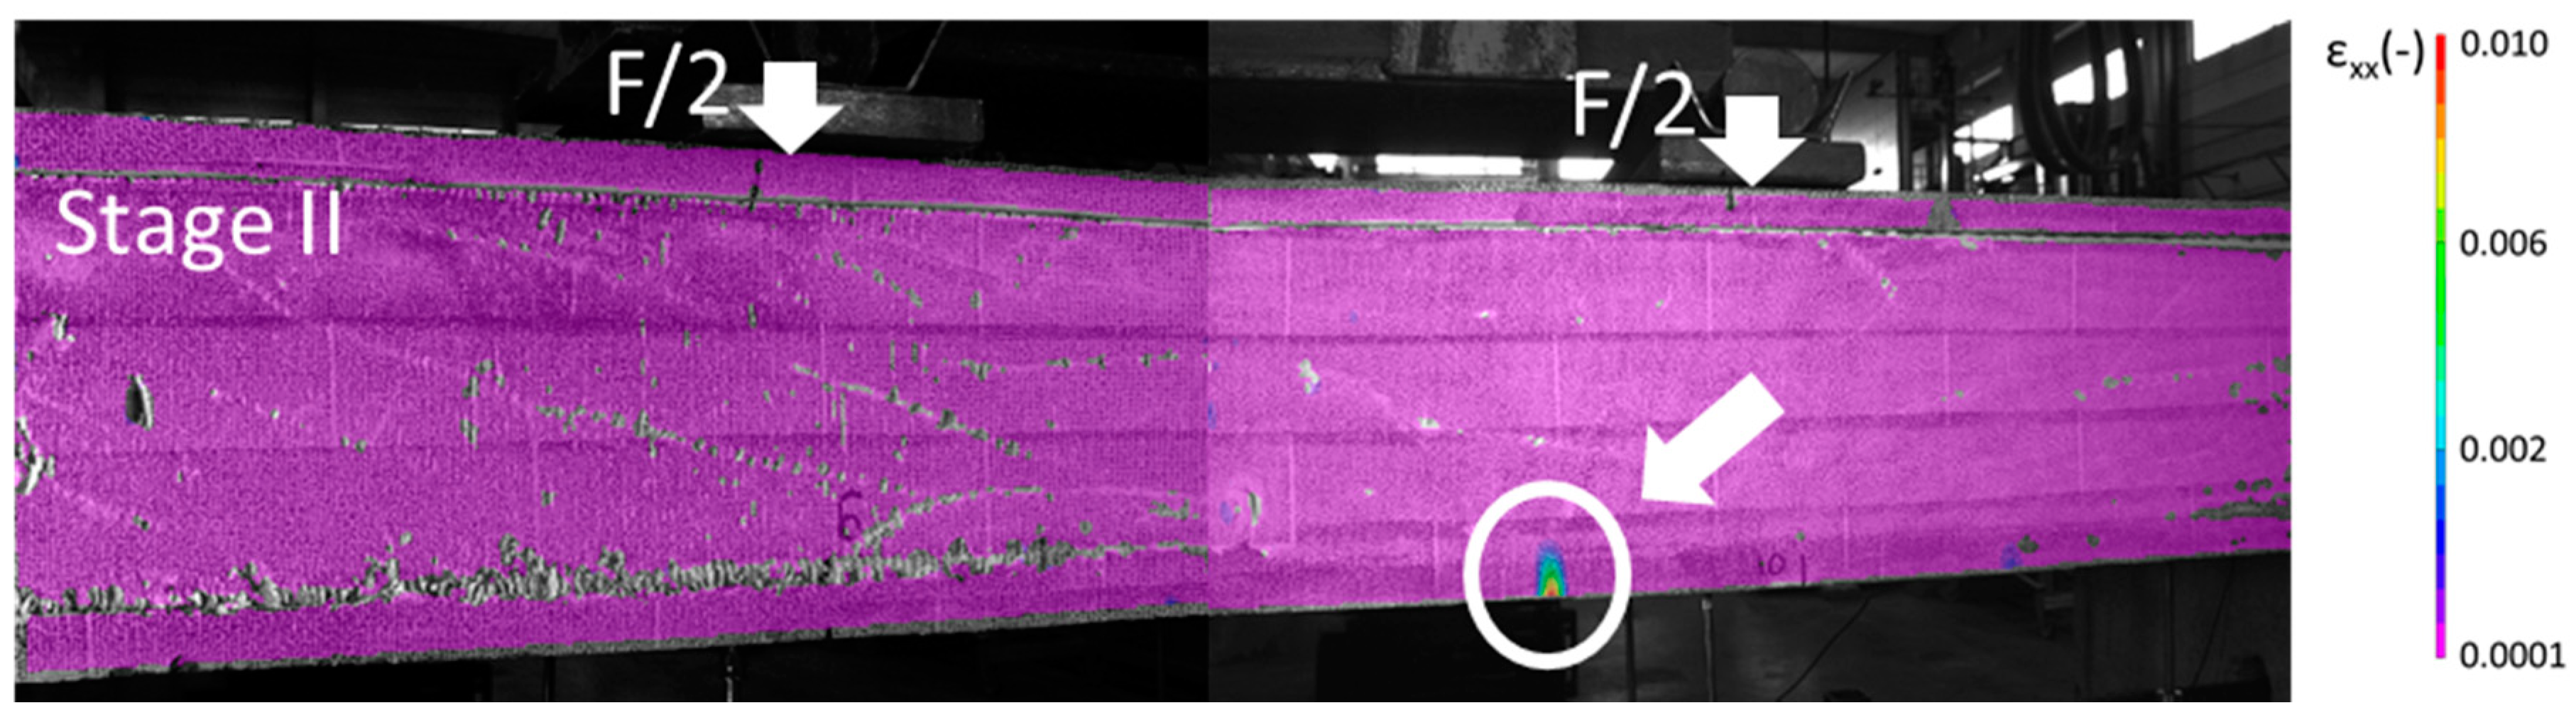
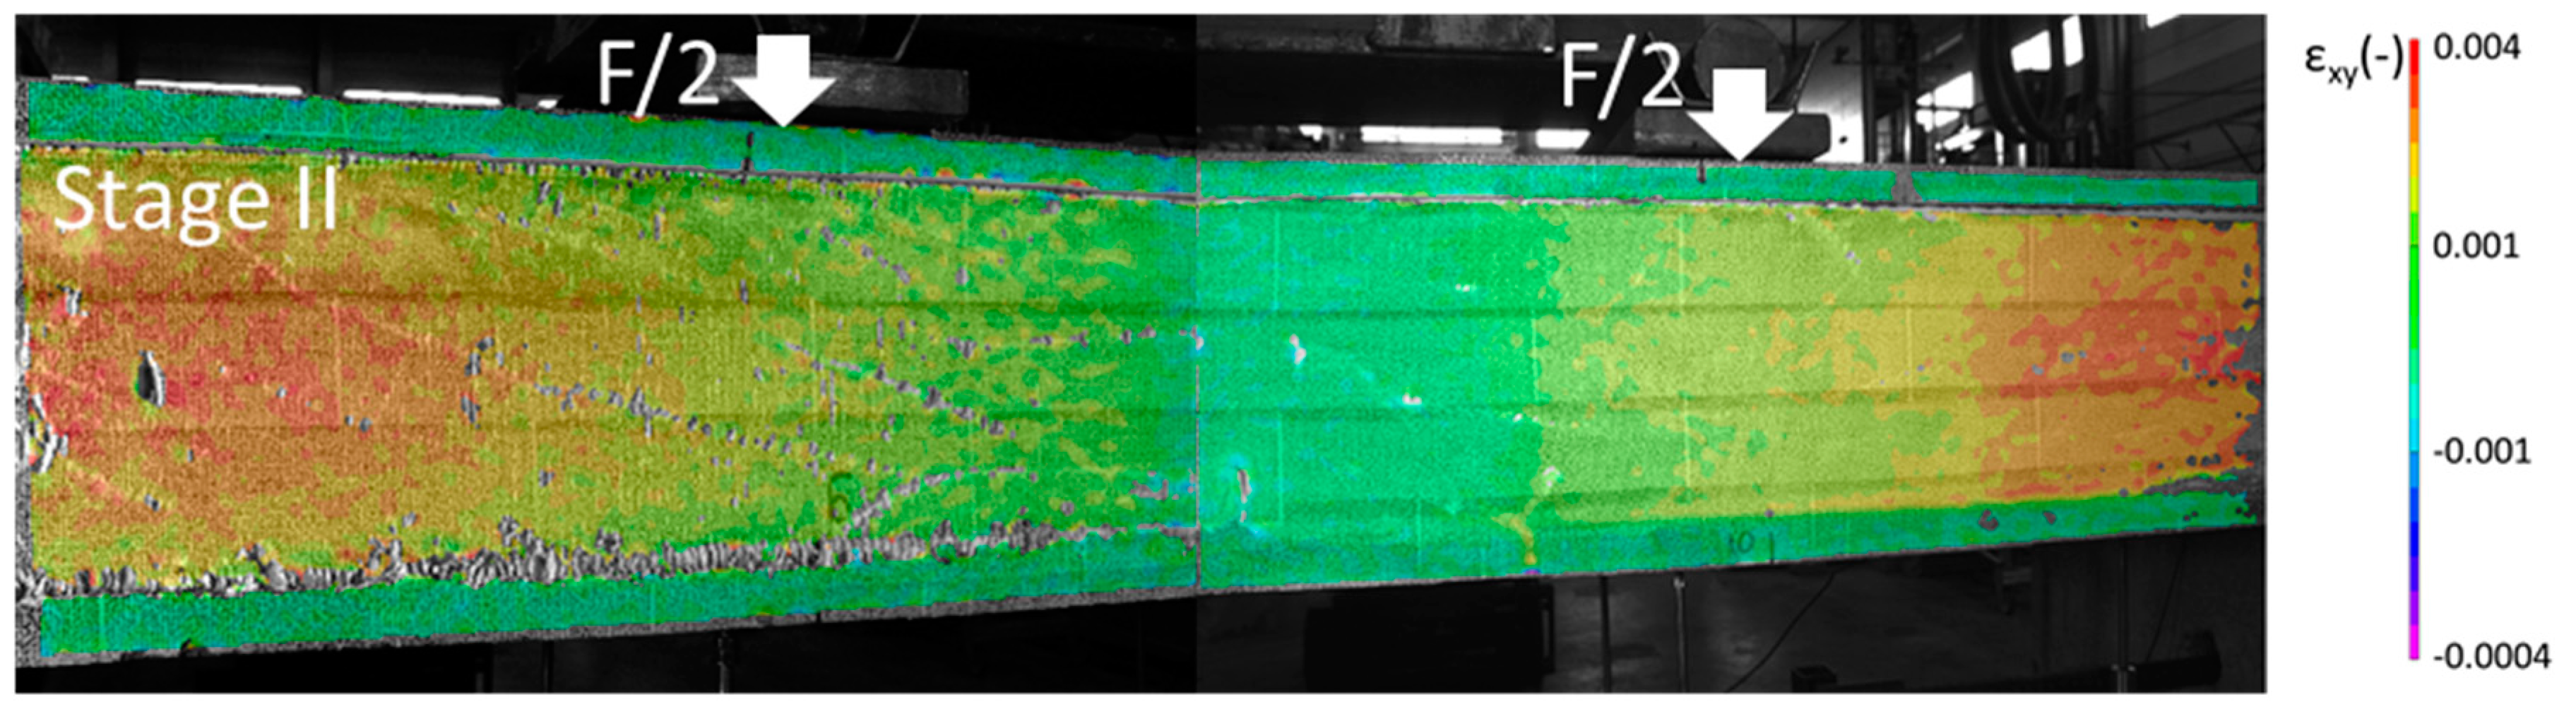
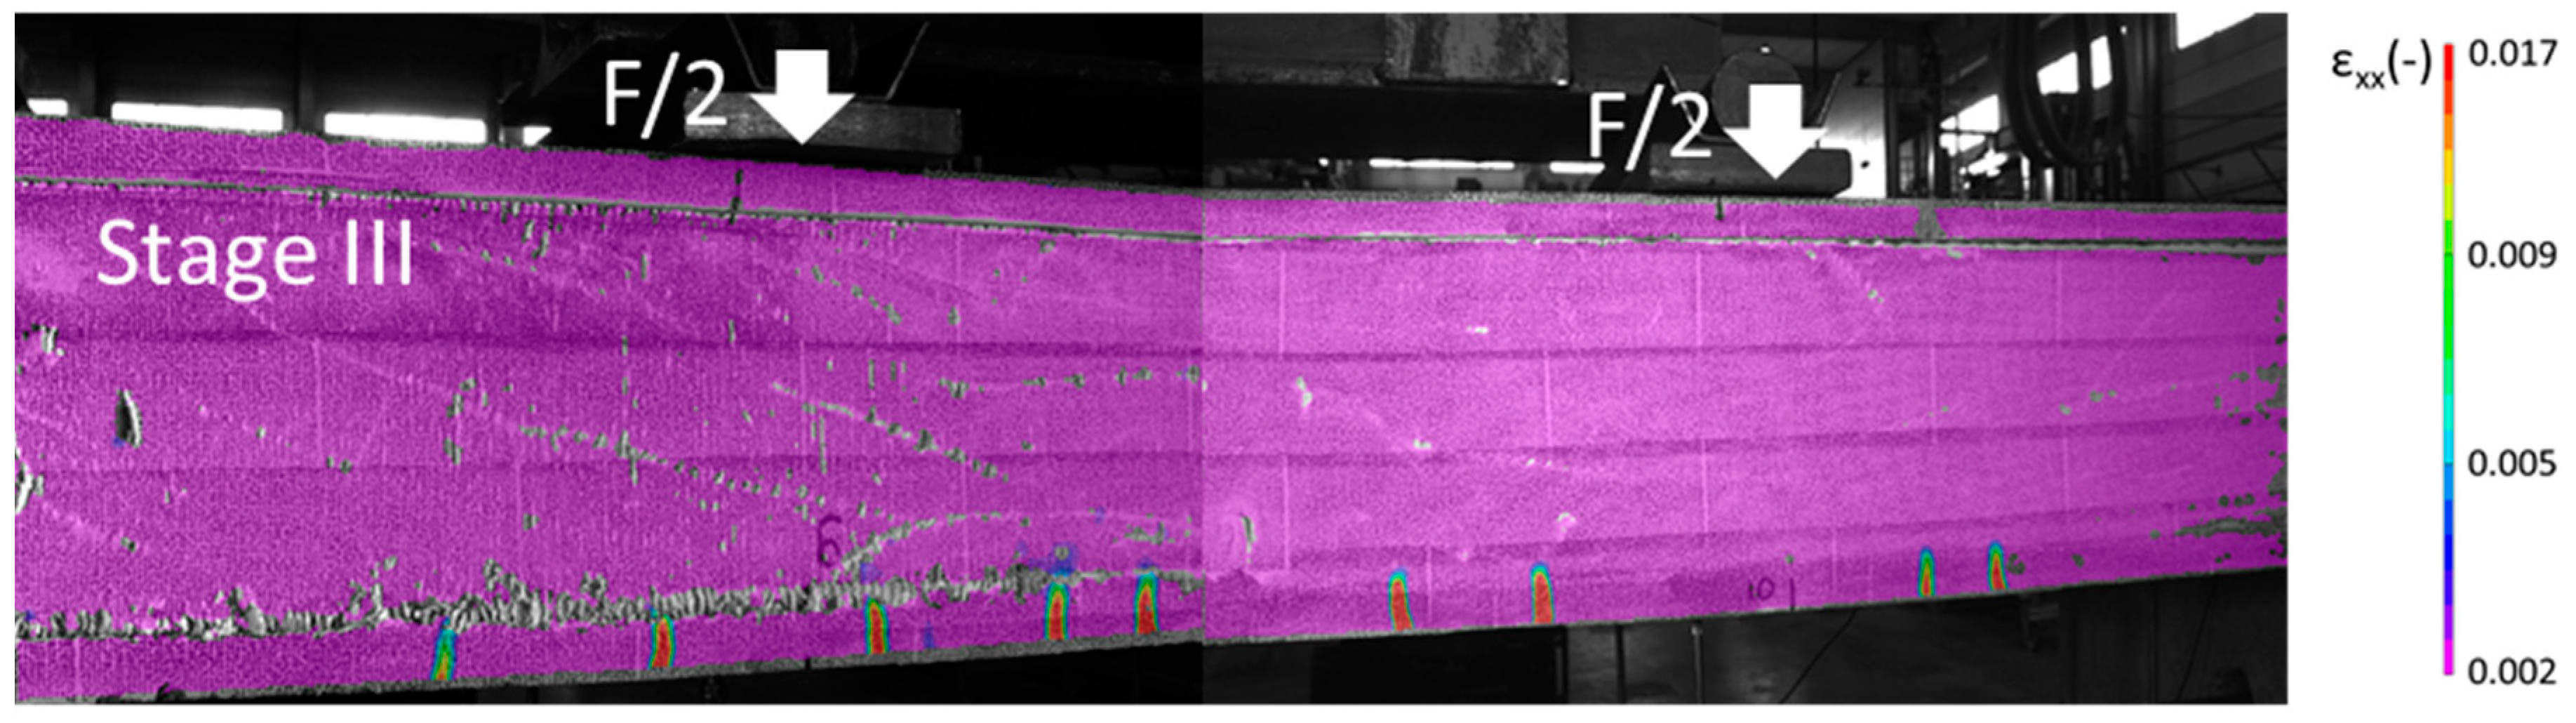
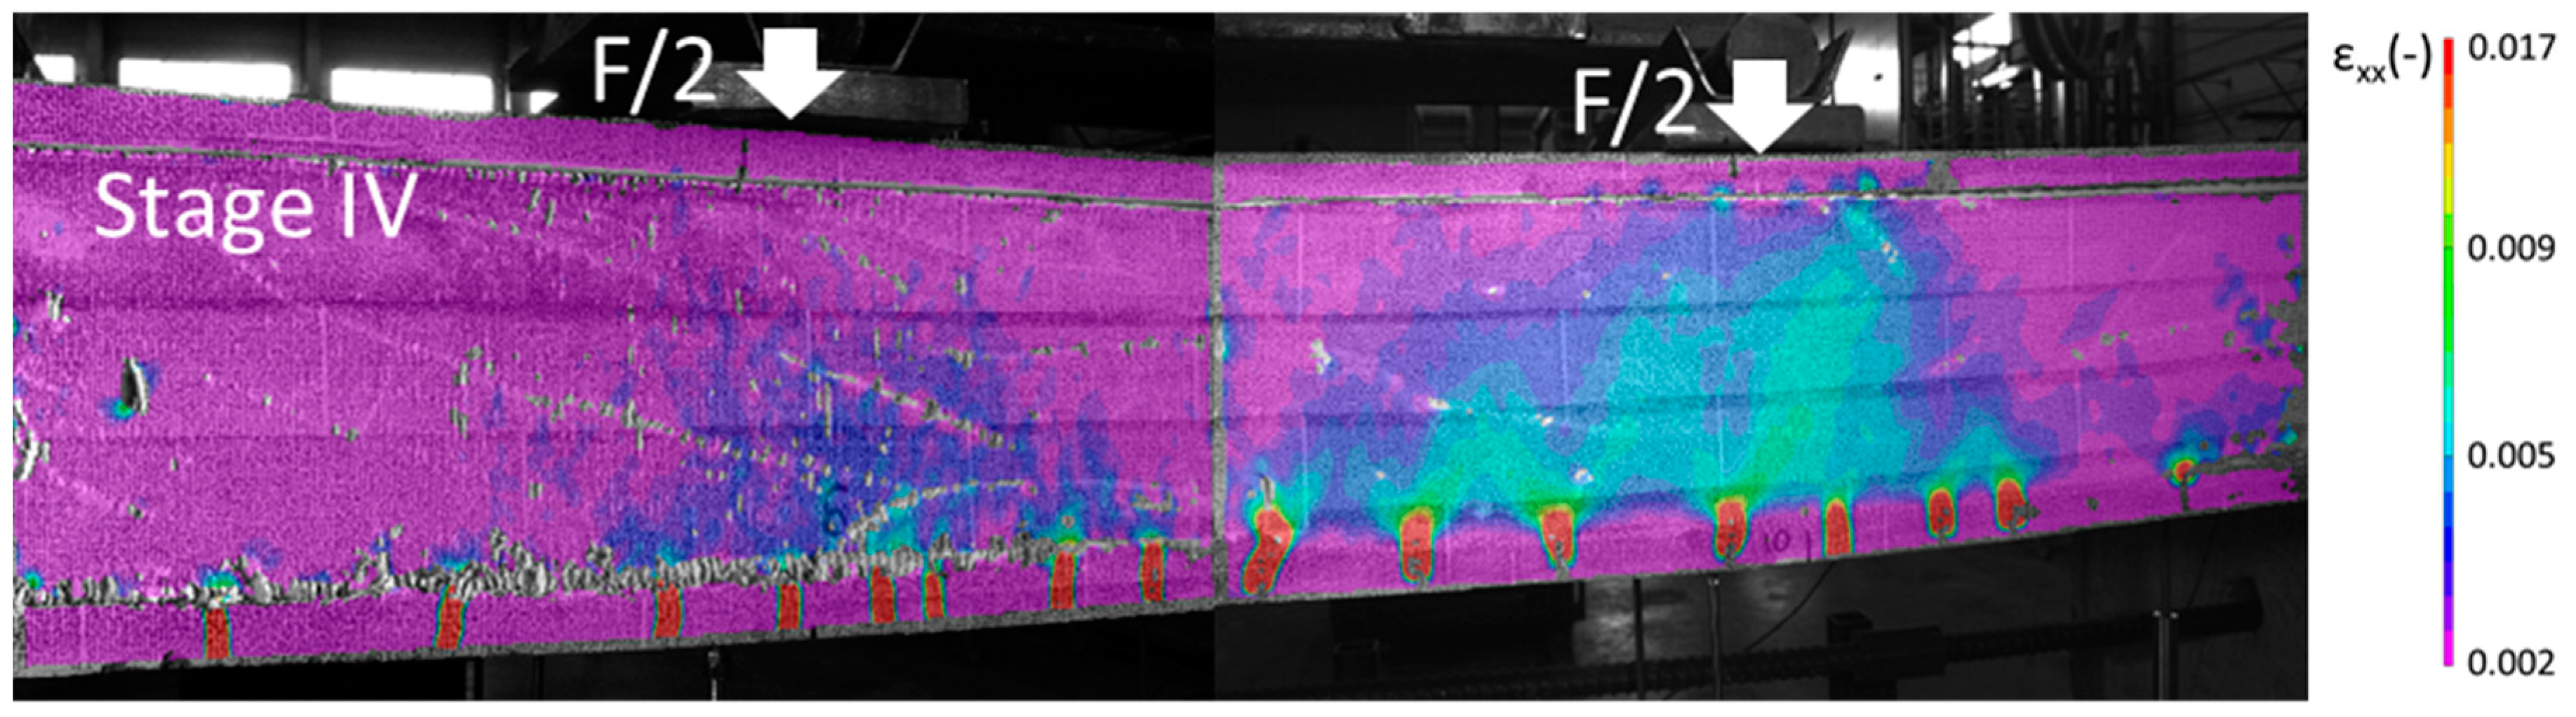
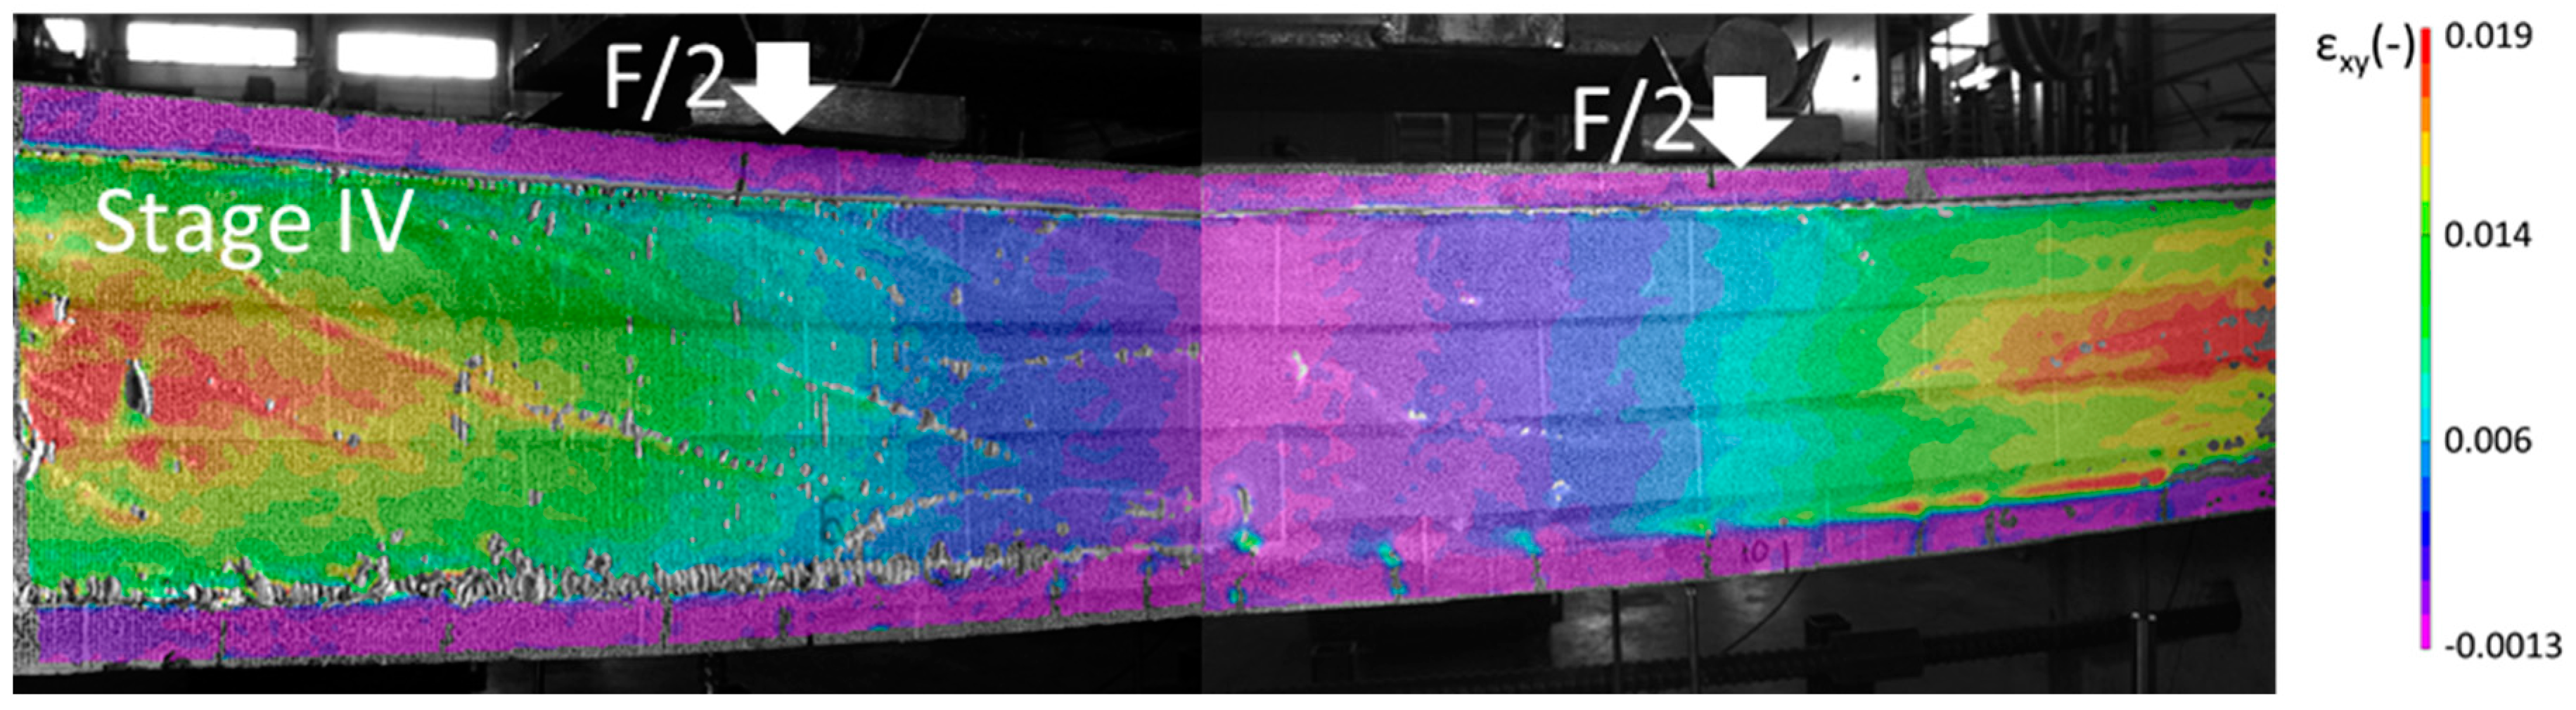
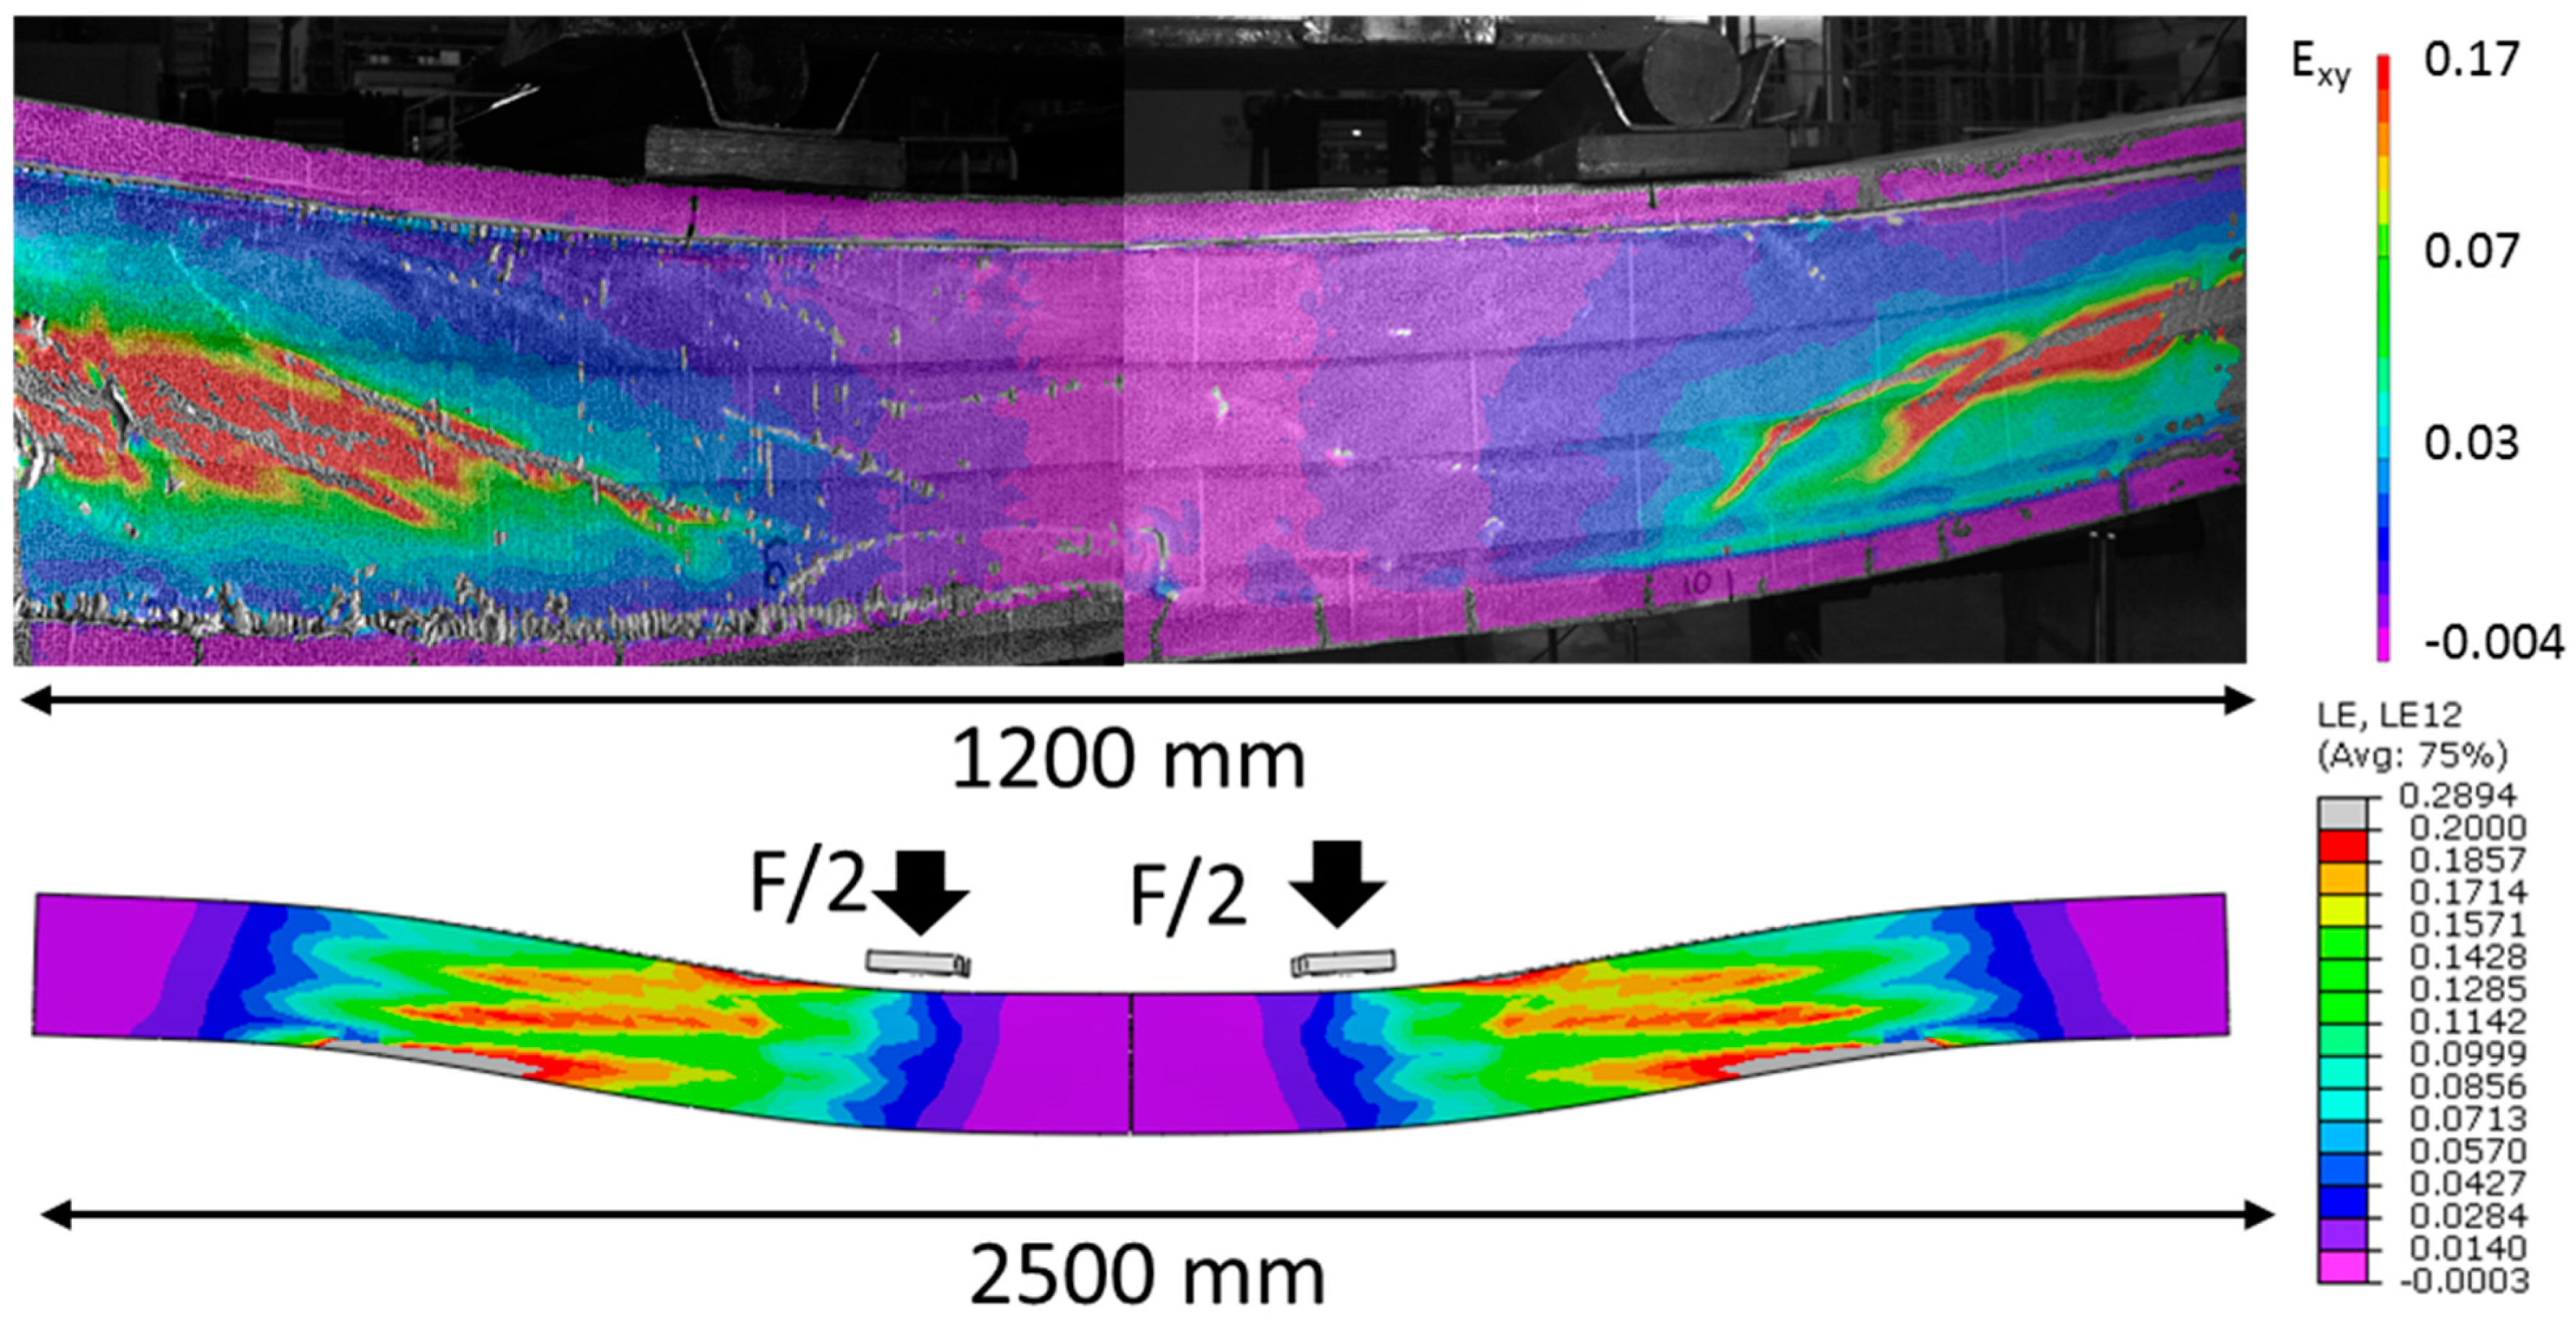
4.2. Experimental Results
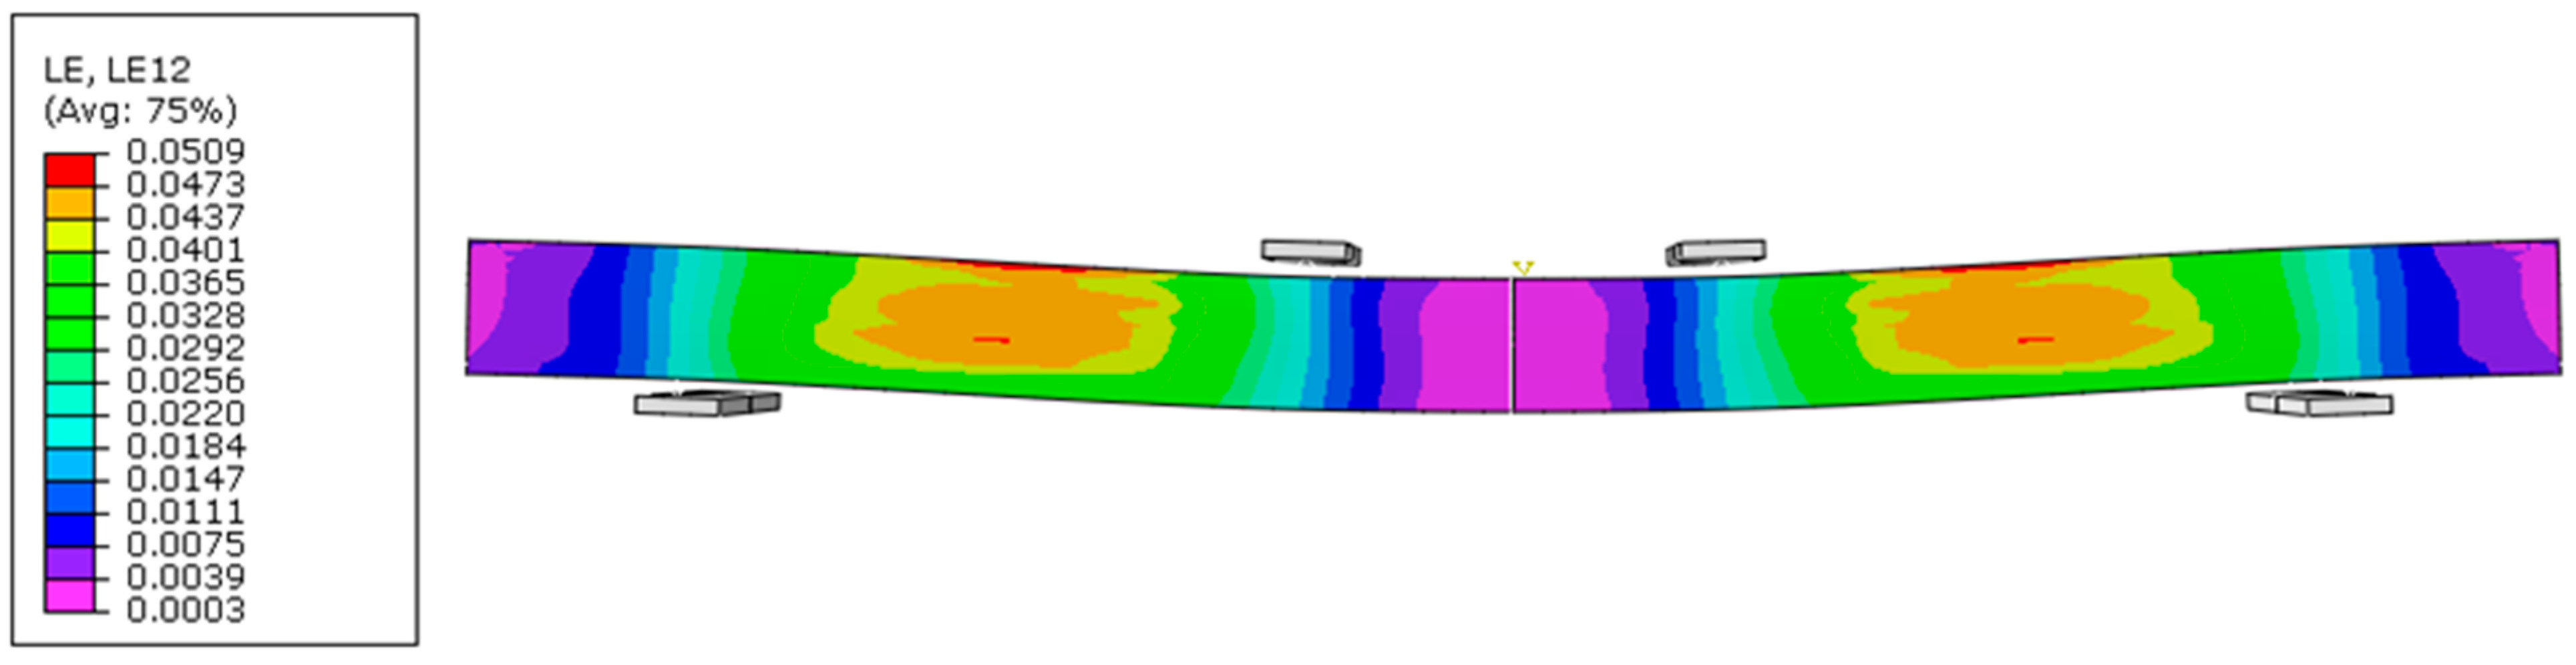
4.3. Strain Comparison with the Numerical Model
5. Conclusions
Author Contributions
Funding
Acknowledgments
Conflicts of Interest
References
- Benayoune, A.; Samad, A.; Abang Ali, A.; Trikha, D.N. Response of pre-cast reinforced composite sandwich panels to axial loading. Constr. Build. Mater. 2007, 21, 677–685. [Google Scholar] [CrossRef]
- Benayoune, A.; Samad, A.; Trikha, D.N.; Abdullah Abang Ali, A.; Ashrabov, A.A. Structural behaviour of eccentrically loaded precast sandwich panels. Constr. Build. Mater. 2006, 20, 713–724. [Google Scholar] [CrossRef]
- Losch, E.D.; Hynes, P.W.; Andrews, R., Jr. State of the Art of Precast/Prestressed Concrete Sandwich wall Panels. PCI J. 2011, 56, 131–176. [Google Scholar]
- Precast/Prestressed Concrete Institute. Architectural Precast Concrete; Precast/Prestressed Concrete Institute: Chicago, IL, USA, 2007. [Google Scholar]
- Shams, A.; Horstmann, M.; Hegger, J. Experimental investigations on Textile-Reinforced Concrete (TRC) sandwich sections. Compos. Struct. 2014, 118, 643–653. [Google Scholar] [CrossRef]
- Colombo, I.G.; Colombo, M.; Prisco, M. Bending behaviour of Textile Reinforced Concrete sandwich beams. Constr. Build. Mater. 2015, 95, 675–685. [Google Scholar] [CrossRef]
- Cuypers, H.; Wastiels, J. Analysis and verification of the performance of sandwich panels with textile reinforced concrete faces. J. Sandw. Struct. Mater. 2011, 13, 589–603. [Google Scholar] [CrossRef]
- Hegger, J.; Horstmann, M.; Feldmann, M.; Pyschny, D.; Raupach, M.; Feger, C. Sandwich panels made of TRC and discrete and continuous connectors. In Proceedings of the International RILEM Conference on Material Science, Aachen, Germany, 6–8 September 2010; Volume I, pp. 381–392. [Google Scholar]
- Vervloet, J.; Van Itterbeeck, P.; Verbruggen, S.; El Kadi, M.; De Munck, M.; Wastiels, J.; Tysmans, T. Buckling Behaviour of Structural Insulating Sandwich Walls with Textile Reinforced Cement Faces. In Strain-Hardening Cement-Based Composites; RILEM Bookseries: Dordrecht, The Netherlands, 2018; pp. 535–543. [Google Scholar]
- Vervloet, J.; Van Itterbeeck, P.; Verbruggen, S.; El Kadi, M.; De Munck, M.; Wastiels, J.; Tysmans, T. Sandwich panels with Textile Reinforced Cementitious skins as new insulating wall system: A case study. In Proceedings of the IASS Annual Symposium 2017, Hamburg, Germany, 25–28 September 2017; p. 10. [Google Scholar]
- De Munck, M.; Tysmans, T.; Verbruggen, S.; Vervloet, J.; El Kadi, M.; Wastiels, J.; Remy, O. Influence of Weathering Conditions on TRC Sandwich Renovation Panels. In Strain-Hardening Cement-Based Composites; RILEM Bookseries: Dordrecht, The Netherlands, 2018; Volume 15, pp. 659–667. [Google Scholar]
- Hegger, J.; Zell, M.; Horstmann, M. Textile Reinforced Concrete—Realization in applications. Tailor Made Concr. Struct. 2008, 357–362. [Google Scholar] [CrossRef]
- Hegger, J.; Will, N.; Horstmann, M. Summary of Results for the Project INSUSHELL; RWTH Aachen: Aachen, Germany, 2009. [Google Scholar]
- Junes, A.; Larbi, A.S.; Claude, U.; Lyon, B.; Bohr, N. An experimental and theoretical study of sandwich panels with TRC facings: Use of metallic connectors and TRC stiffeners. Eng. Struct. 2016, 113, 174–185. [Google Scholar] [CrossRef]
- Junes, A.; Si Larbi, A. An indirect non-linear approach for the analysis of sandwich panels with TRC facings. Constr. Build. Mater. 2016, 112, 406–415. [Google Scholar] [CrossRef]
- Shams, A.; Hegger, J.; Horstmann, M. An analytical model for sandwich panels made of textile-reinforced concrete. Constr. Build. Mater. 2014, 64, 451–459. [Google Scholar] [CrossRef]
- Colombo, I.G.; Colombo, M.; di Prisco, M.; Pouyaei, F. Analytical and numerical prediction of the bending behaviour of textile reinforced concrete sandwich beams. J. Build. Eng. 2018, 17, 183–195. [Google Scholar] [CrossRef]
- Ilyes Djamai, Z.; Bahrar, M.; Salvatore, F.; Si Larbi, A.; El Mankibi, M. Textile reinforced concrete multiscale mechanical modelling: Application to TRC sandwich panels. Finite Elem. Anal. Des. 2017, 135, 22–35. [Google Scholar] [CrossRef]
- Horstmann, M. Zum Tragverhalten von Sandwichkonstruktionen aus Textilbewehrtem Beton, RWTH Aachen. Ph.D. Thesis, RWTH Aachen University, Aachen, Germany, 2010. [Google Scholar]
- Sika Sikagrout-217 Fine Concrete Data Sheet; Sika AG: Baar, Switzerland, 2016; p. 3.
- Bureau voor Normalisatie. Beproeving van Verhard Beton—Deel 3: Druksterkte van Proefstukken; Wetenschappelijk en Technisch Centrum voor het Bouwbedrijf (WTCB). Available online: https://www.wtcb.be/homepage/index.cfm?cat=services&sub=standards_regulations&pag=norm_concrete&art=standards (accessed on 22 March 2019).
- ASTM International. ASTM C469M-14, Static Modulus of Elasticity and Poisson’s Ratio of Concrete in Compression. 2014. Available online: www.astm.org (accessed on 22 March 2019).
- SitGrid 701. Available online: https://solutions-in-textile.com/produkte/fertigteilbau (accessed on 2 March 2019).
- SitGrid 200. Available online: https://solutions-in-textile.com/produkte/fertigteilbau (accessed on 2 March 2019).
- El Kadi, M.; Verbruggen, S.; Vervloet, J.; De Munck, M.; Wastiels, J.; Van Hemelrijck, D.; Tysmans, T. Experimental Investigation and Benchmarking of 3D Textile Reinforced Cementitious Composites. In Strain-Hardening Cement-Based Composites; RILEM Bookseries: Dordrecht, The Netherlands, 2018; pp. 400–408. [Google Scholar]
- Brameshuber, W. Recommandation of RILEM TC 232-TDT: Test methods and design of textile reinforced concrete. Mater. Struct. 2016, 49, 4923–4927. [Google Scholar]
- ASTM International. ASTM C165-00—Standard Test Method for Measuring Compressive Properties of Thermal Insulations; ASTM International: West Conshohocken, PA, USA, 2000. [Google Scholar]
- Bureau voor Normalisatie. EN 14509: Self-Supporting Double Skin Metal Faced Insulating Panels—Factory Made Products—Specifications; Bureau voor Normalisatie: Brussel, Belgium, 2013; p. 177.
- Sutton, M.A.; Orteu, J.J.; Schreier, H. Image Correlation for Shape, Motion and Deformation Measurements; Springer US: New York, NY, USA, 2009; ISBN 978-0-387-78747-3. [Google Scholar]
- Verbruggen, S.; Remy, O.; Wastiels, J.; Tysmans, T. Stay-in-Place Formwork of TRC Designed as Shear Reinforcement for Concrete Beams. Adv. Mater. Sci. Eng. 2013, 2013, 1–9. [Google Scholar] [CrossRef]
- Bilotta, A.; Ceroni, F.; Lignola, G.P.; Prota, A. Use of DIC technique for investigating the behaviour of FRCM materials for strengthening masonry elements. Compos. Part B Eng. 2017, 129, 251–270. [Google Scholar] [CrossRef]
- Dassault Systèmes Simulia Abaqus CAE User’s Manual. Abaqus 6.12. Available online: http://130.149.89.49:2080/v6.12/books/usi/default.htm?startat=pt06ch60s01.html (accessed on 22 March 2019).
- Brockmann, T. Mechanical and Fracture Mechanical Properties of Fine Grained Concrete for TRC Structures. In Advances in Construction Materials 2007; Grosse, C.U., Ed.; Springer: Berlin/Heidelberg, Germany, 2007; pp. 119–130. ISBN 9783540724476. [Google Scholar]
- Tysmans, T.; Wozniak, M.; Remy, O.; Vantomme, J. Finite element modelling of the biaxial behaviour of high-performance fibre-reinforced cement composites (HPFRCC) using Concrete Damaged Plasticity. Finite Elem. Anal. Des. 2015, 100, 47–53. [Google Scholar] [CrossRef]
- Allen, H.G. Analysis and Design of Structural Sandwich Panels, 2nd ed.; Elsevier Ltd.: Amsterdam, The Netherlands, 1969; p. 269. [Google Scholar]
- Zenkert, D. The Handbook of Sandwich Construction, 2nd ed.; Engineering Materials Advisory Service Ltd.: London, UK, 1997; p. 432. [Google Scholar]


| Fibre Material | Density (g/m2) | Spacer Distance (mm) | |
|---|---|---|---|
| 3D textile [23] | AR-glass | 536 | 11 |
| 2D textile [24] | AR-glass | 568 | - |
| Matrix Cracking Stress | Matrix Cracking Strain | End of Multiple Cracking Stress | End of Multiple Cracking Strain | Ultimate Failure Stress | Ultimate Failure Strain |
|---|---|---|---|---|---|
| 2.28 MPa | 0.00022 | 3.38 MPa | 0.0033 | 7.43 MPa | 0.0087 |
© 2019 by the authors. Licensee MDPI, Basel, Switzerland. This article is an open access article distributed under the terms and conditions of the Creative Commons Attribution (CC BY) license (http://creativecommons.org/licenses/by/4.0/).
Share and Cite
Vervloet, J.; Tysmans, T.; El Kadi, M.; De Munck, M.; Kapsalis, P.; Van Itterbeeck, P.; Wastiels, J.; Van Hemelrijck, D. Validation of a Numerical Bending Model for Sandwich Beams with Textile-Reinforced Cement Faces by Means of Digital Image Correlation. Appl. Sci. 2019, 9, 1253. https://doi.org/10.3390/app9061253
Vervloet J, Tysmans T, El Kadi M, De Munck M, Kapsalis P, Van Itterbeeck P, Wastiels J, Van Hemelrijck D. Validation of a Numerical Bending Model for Sandwich Beams with Textile-Reinforced Cement Faces by Means of Digital Image Correlation. Applied Sciences. 2019; 9(6):1253. https://doi.org/10.3390/app9061253
Chicago/Turabian StyleVervloet, Jolien, Tine Tysmans, Michael El Kadi, Matthias De Munck, Panagiotis Kapsalis, Petra Van Itterbeeck, Jan Wastiels, and Danny Van Hemelrijck. 2019. "Validation of a Numerical Bending Model for Sandwich Beams with Textile-Reinforced Cement Faces by Means of Digital Image Correlation" Applied Sciences 9, no. 6: 1253. https://doi.org/10.3390/app9061253