1. Introduction
Emission of nitrogen oxides (NO
x) will lead to severe environmental problems. NO
x is considered to be responsible for the formation of photochemical smog, acid rain, tropospheric ozone, ozone layer depletion, and a variety of health problems for human beings [
1,
2,
3].
Selective catalytic reduction (SCR) technology is one of the most efficient approaches to reduce NO
x emissions [
4,
5,
6]. Reductants such as urea or ammonia (NH
3) are injected into the flue gas from an ammonia injection grid (AIG) [
7,
8,
9]. The typical SCR reactions include [
10,
11]:
The SCR-deNO
x efficiency is influenced by reaction temperature, residence time, space velocity, and the uniformity of both flue gas velocity and NH
3 concentration [
12,
13]. Therefore, to achieve high NO
x reduction efficiency and low NH
3 slip, optimal design of the flow field and non-uniformed NH
3 injection strategy should be carried out for the SCR-deNO
x facilities [
14].
The SCR-deNO
x facilities are usually divided into π type and tower type according to their overall shapes. So far, many studies have been conducted on the optimization of flow field for the π type SCR-deNO
x facilities. The baffles geometry and the corresponding configuration have been investigated [
15,
16,
17]. Attempts have also been made to reduce difficulties in performing the non-uniformed NH
3 injection strategy and to achieve a more homogeneous distribution of NH
3 [
18,
19]. However, research on the optimal design of the tower type SCR-deNO
x facilities are scarce. A tower type SCR-deNO
x facility usually has fewer turnings and a huge expansion duct, which implies a large sectional area and less turbulence. Nowadays, with an increasing number of tower type SCR-deNO
x facilities [
20,
21], it is necessary to implement flow regulation and ensure optimal design. In the meantime, spatial constraints are common due to the compact configuration. Hence, it is more challenging to find an effective way to optimize the tower type SCR-deNO
x facilities.
Computational fluid dynamics (CFD) simulation is nowadays commonly applied to the flow field regulation of SCR-deNO
x facilities [
22,
23]. In this paper, the optimal design of the tower type SCR-deNO
x facility for a 1000 MW coal-fired power plant is presented. A combination of crossed baffles and small-sized arc-shaped baffles are used to deal with the spatial constraints and to regulate the flow field. The influence of flow regulation at the AIG is evaluated. In addition, pressure loss and the consumption of steel plate are considered. A flow model test (FMT) is carried out to verify the CFD simulation results. This may provide an effective approach to optimize the tower type SCR-deNO
x facilities.
2. CFD Simulation and FMT Validation
2.1. Facility Optimization
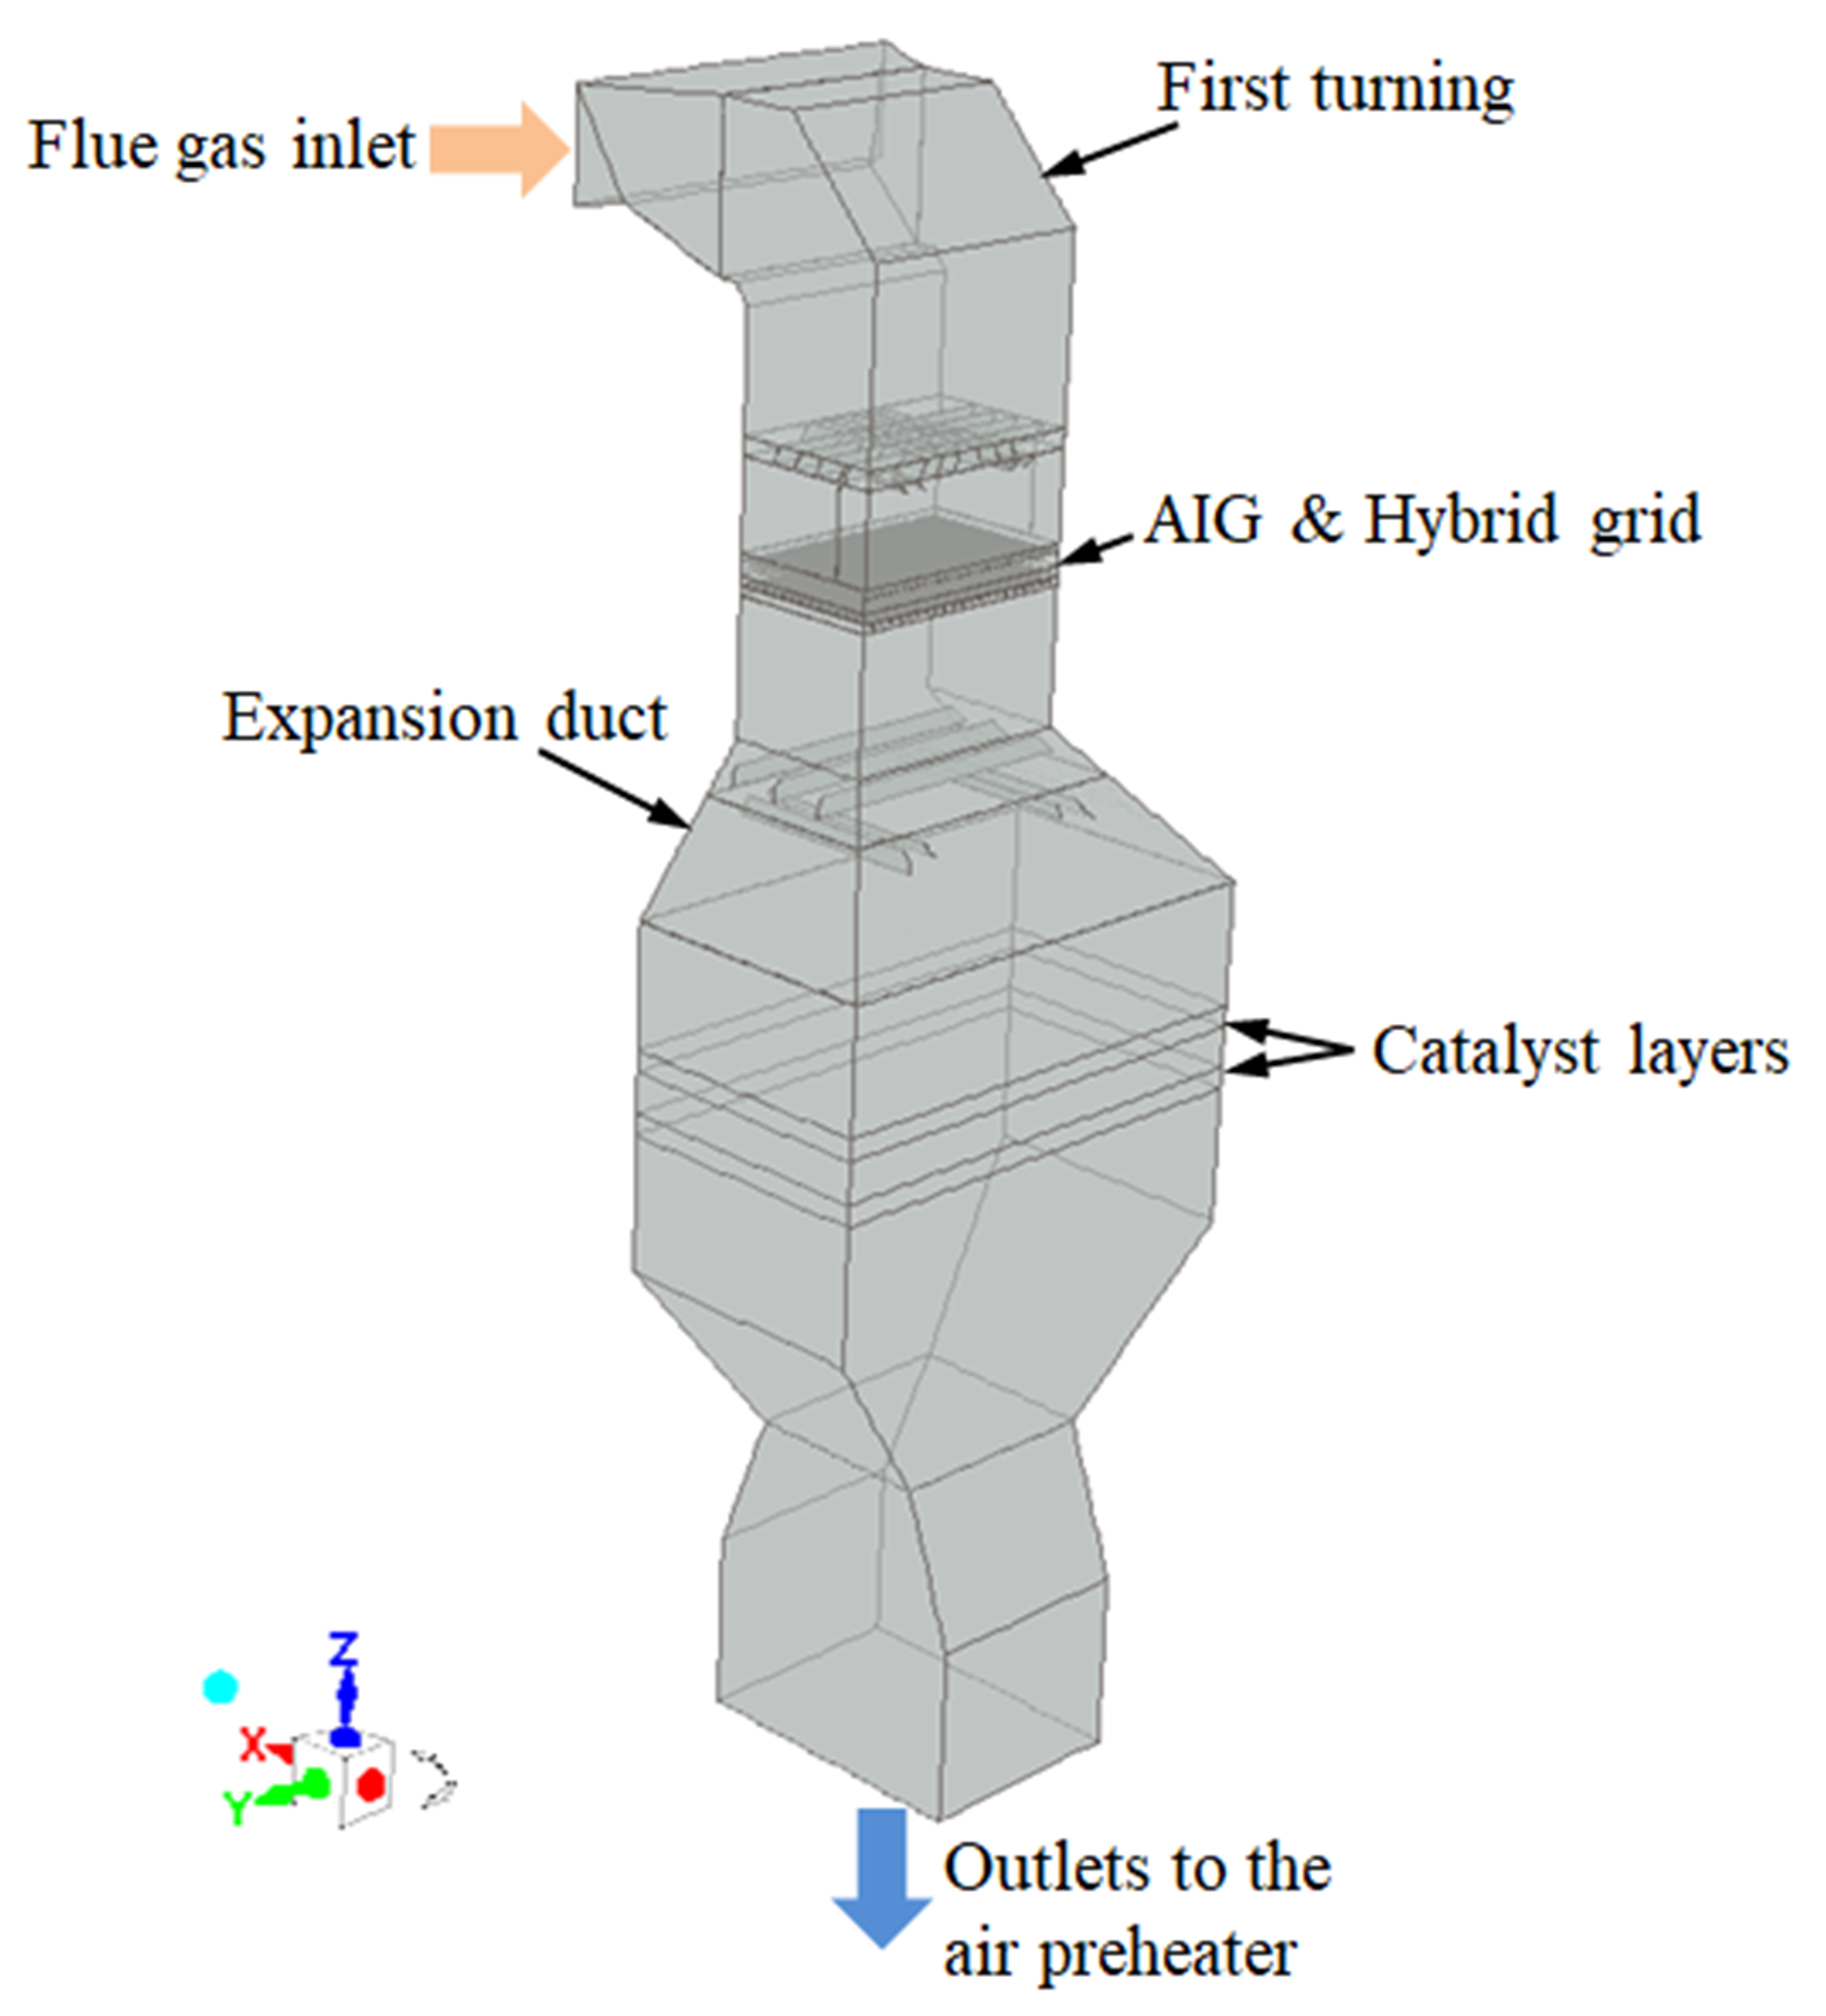
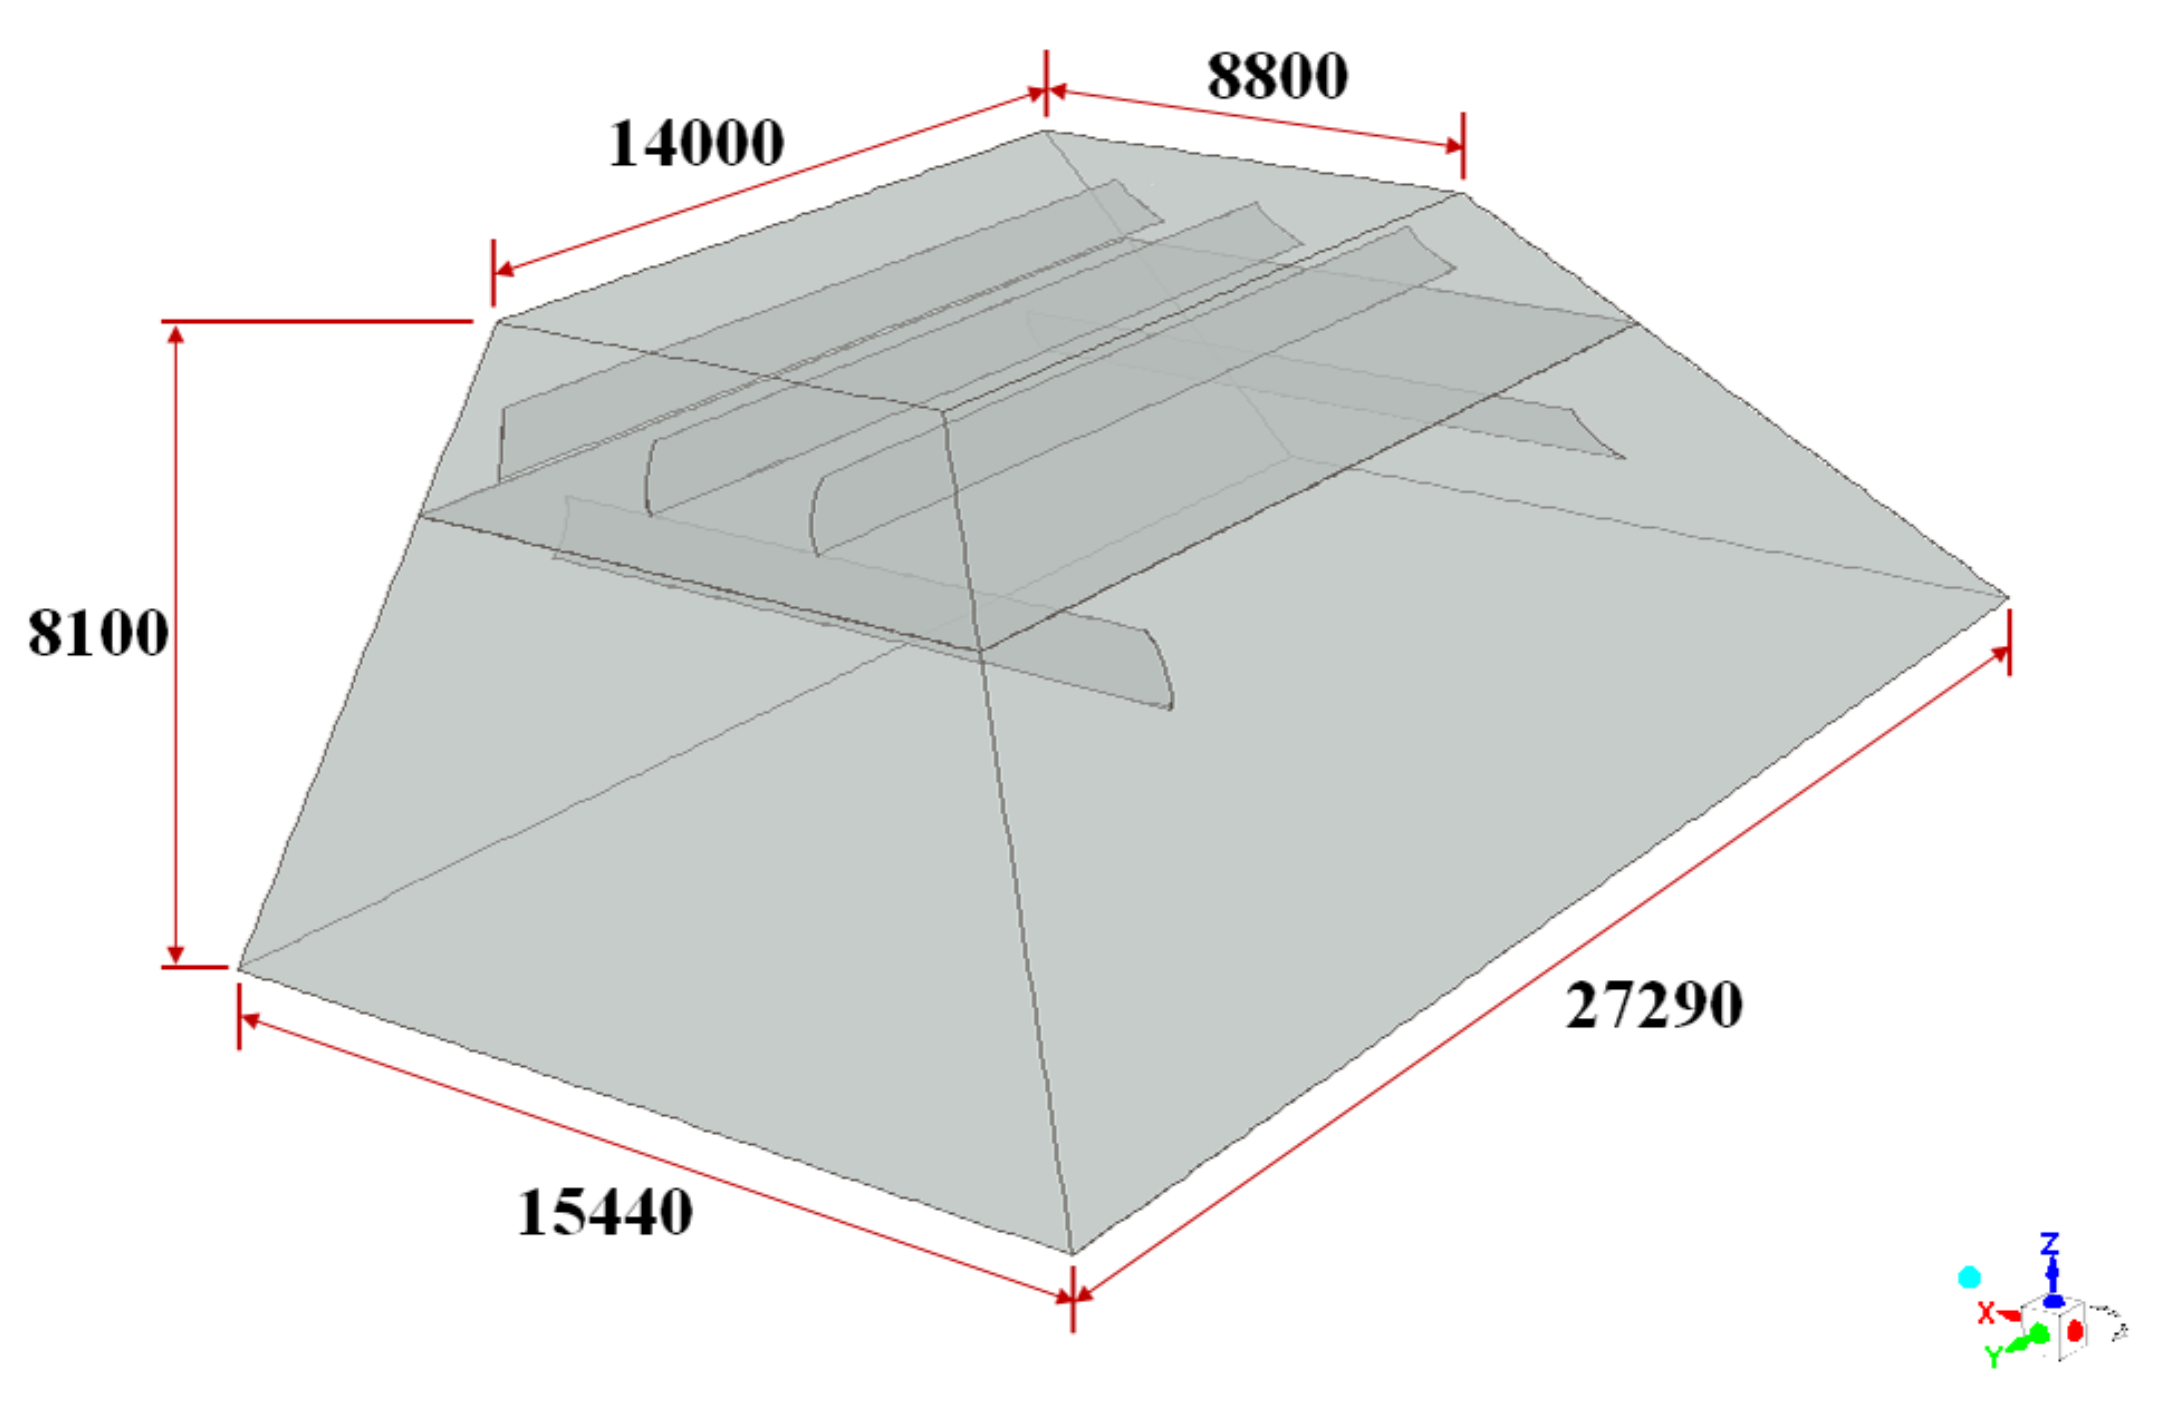
The schematic geometry of a tower type SCR-deNO
x facility for a 1000 MW coal-fired power plant is shown in
Figure 1. The power plant is located in Tuandong Town, Neixiang County, Nanyang City, Henan Province of China. It belongs to the State Development and Investment Corp. The overall height of the SCR-deNO
x facility is about 100 m and the flow rate of the flue gas is about 1030 kg/s with a temperature of 647.15 K under 100% BMCR condition. The flue gas inlet size is about 21 m × 6 m and the sectional area of the catalyst layer is approximately 430 m
2.
The flue gas leaves the economizer and passes the first turning. Then it mixes with NH3 that is injected by the AIG. After that, the flue gas goes through the hybrid grid and the expansion duct. Finally, it enters the SCR reactors, which contain two catalyst layers. The mixing distance for flue gas and NH3 is approximately 25 m from the AIG to the catalyst entrance.
The relative standard deviation (RSD) at the entrance of catalyst layers is used to evaluate the uniformity of both gas velocity and NH
3 concentration distribution, which is defined as [
24,
25]:
where
xi is the
i-th measured value of the variable,
is its average value, and
n is the total sampling number. Usually, the RSD is set to less than 15% for the flue gas velocity distribution and less than 5% for the NH
3 concentration distribution. In the facility design stage, pressure loss is also a very important issue because it is directly related to energy consumption. Correspondingly, a total pressure loss of less than 400 Pa is required excluding the catalysts’ pressure loss. In addition, with the promotion of China’s high-quality development, the consumption of steel plate also needs to be considered.
For this tower type SCR-deNOx facility, optimal design is required with spatial constraints. No baffles are allowed to be installed inside the first turning because it is too close to the economizer. Therefore, it is more difficult to achieve the requirements of RSD mentioned previously and to control the pressure loss. A variety of regulation measures should be taken during the design stage of the SCR-deNOx facility. Arc-shaped baffles with small sizes are used due to their good performance in regulating the flow field while reducing the total pressure loss.
Meanwhile, attempts also are made to regulate the flow field at the AIG as a potential solution to spatial constraints. Installing the baffles at the upstream side of the facility would reduce the difficulty in regulating the downstream flow field, especially for the expansion duct.
Correspondingly, a non-uniformed NH3 injection strategy was adopted to increase the uniformity of NH3 concentration distribution. Considering the large sectional area and insufficient turbulence, it was necessary to use the non-uniformity NH3 injection strategy to enhance the mixing performance. In this case, the AIG had 21 independent NH3 injection areas (3 × 7) and the NH3 injection velocity of each area was set to be proportional to the gas velocity based on the gas velocity distribution before the AIG. With the flow field regulated at the AIG, it was much easier to determine the injection velocities.
The optimization process was carried out based on CFD simulation and FMT validation. Firstly, the CFD simulation of the tower type SCR-deNOx facility with no baffles geometry was performed as an indication of the flow field. Secondly, on the basis of the preliminary simulation, the baffles geometry was designed. The RSDs of gas velocity and NH3 concentration, as well as the pressure loss were calculated. Adjustments were made on the configuration of the baffles until the RSDs and the total pressure loss performed as low as possible. In addition, the consumption of steel plate was calculated and considered. Finally, FMT was conducted as a validation of the CFD simulations.
2.2. CFD Simulation
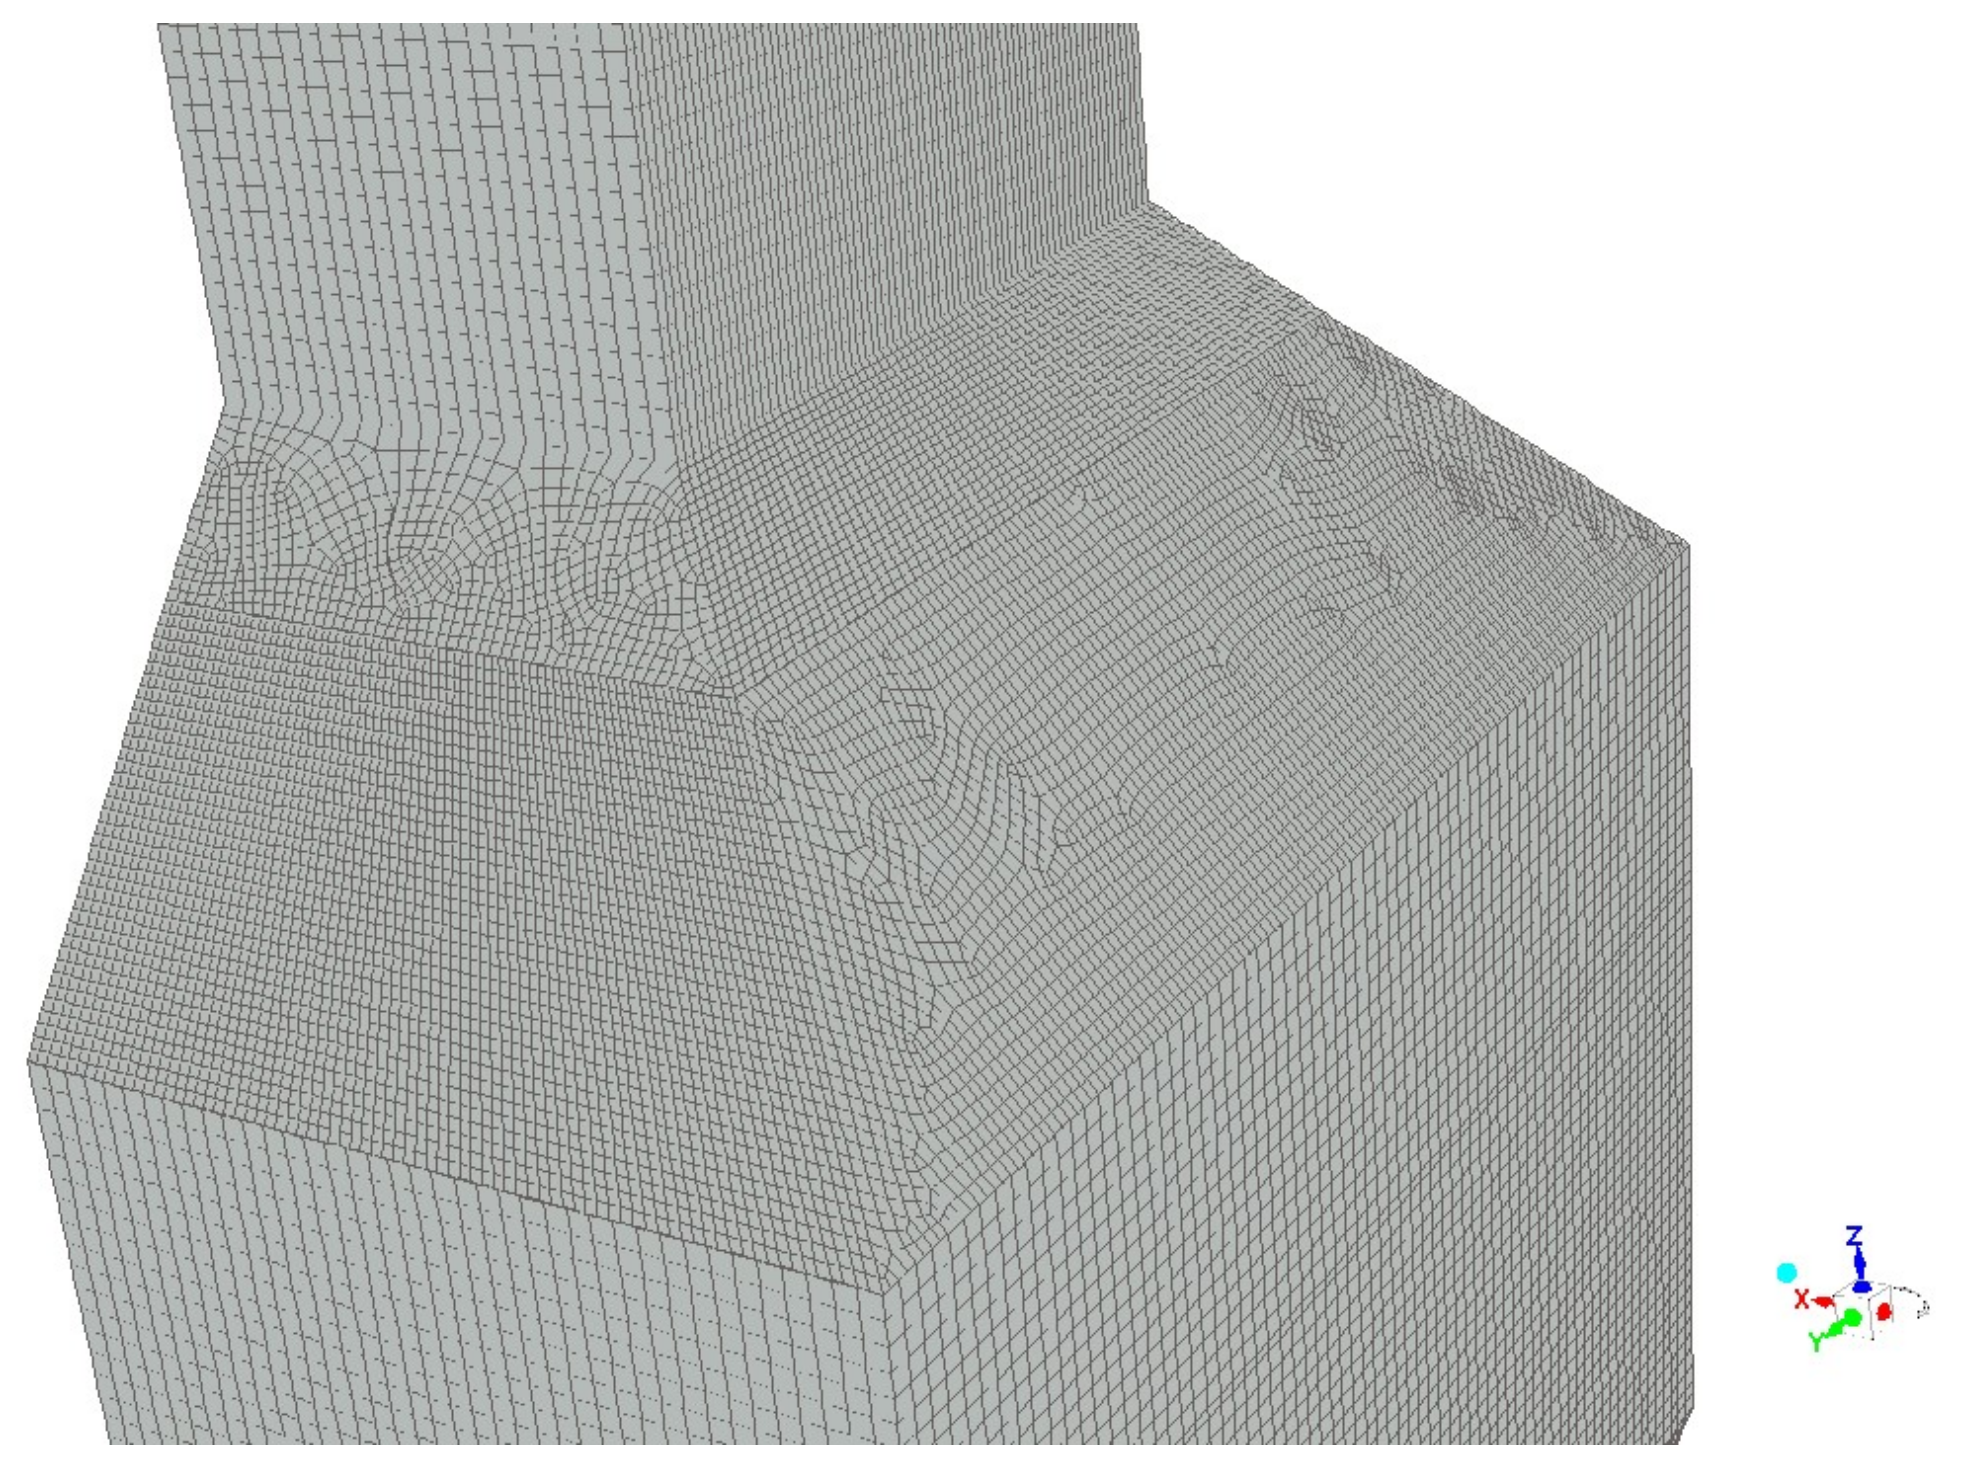
Three-dimensional CFD simulation was carried out with ANSYS 17.1, ANSYS Inc. [
26]. The meshing model was established with the real scale. The total mesh number of the geometry was about 5.9 million. Due to the limitation of the hardware, the grid convergence analysis was only carried out on the meshing geometry of the AIG and the hybrid grid. The corresponding results are shown in
Appendix A.
Figure 2 shows the meshing geometry of the representative area.
The model is considered to be adiabatic and the chemical reactions are not considered here. A standard k-ε model was used to deal with the turbulence and a SIMPLE (Semi-Implicit Method for Pressure-Linked Equation) algorithm was used to solve the Navier-Stokes equation. Moreover, a porous media model was used as a substitute for catalyst layers and the permeability term was eliminated considering the honeycomb structure of the catalyst layers. The corresponding boundary conditions are given below:
- (1)
The flow distribution of inlet was set to be uniform as the sufficient resistance provided by the economizer. The velocity was 14.75 m/s under 100% BMCR condition;
- (2)
The NH3 concentration was diluted to 5% and the corresponding average injection velocity was set to 20 m/s based on the NH3/NOx molar ratio of 1:1;
- (3)
An atmospheric pressure was set at the pressure outlet and the total pressure loss of two catalyst layers was set to 420 Pa;
- (4)
An observation plane was located 0.2 m above the porous media. As the overall height of the tower type SCR-deNOx facility is about 100 m, the flue gas velocity and NH3 concentration distributions at the observation plane can be regarded as those of the catalyst entrance.
Iteration continued until the residuals had converged below 10−6. Contours of gas velocity and NH3 concentration at the observation plane were generated respectively. Thereafter, the corresponding RSDs and the total pressure loss were calculated.
2.3. FMT Validation
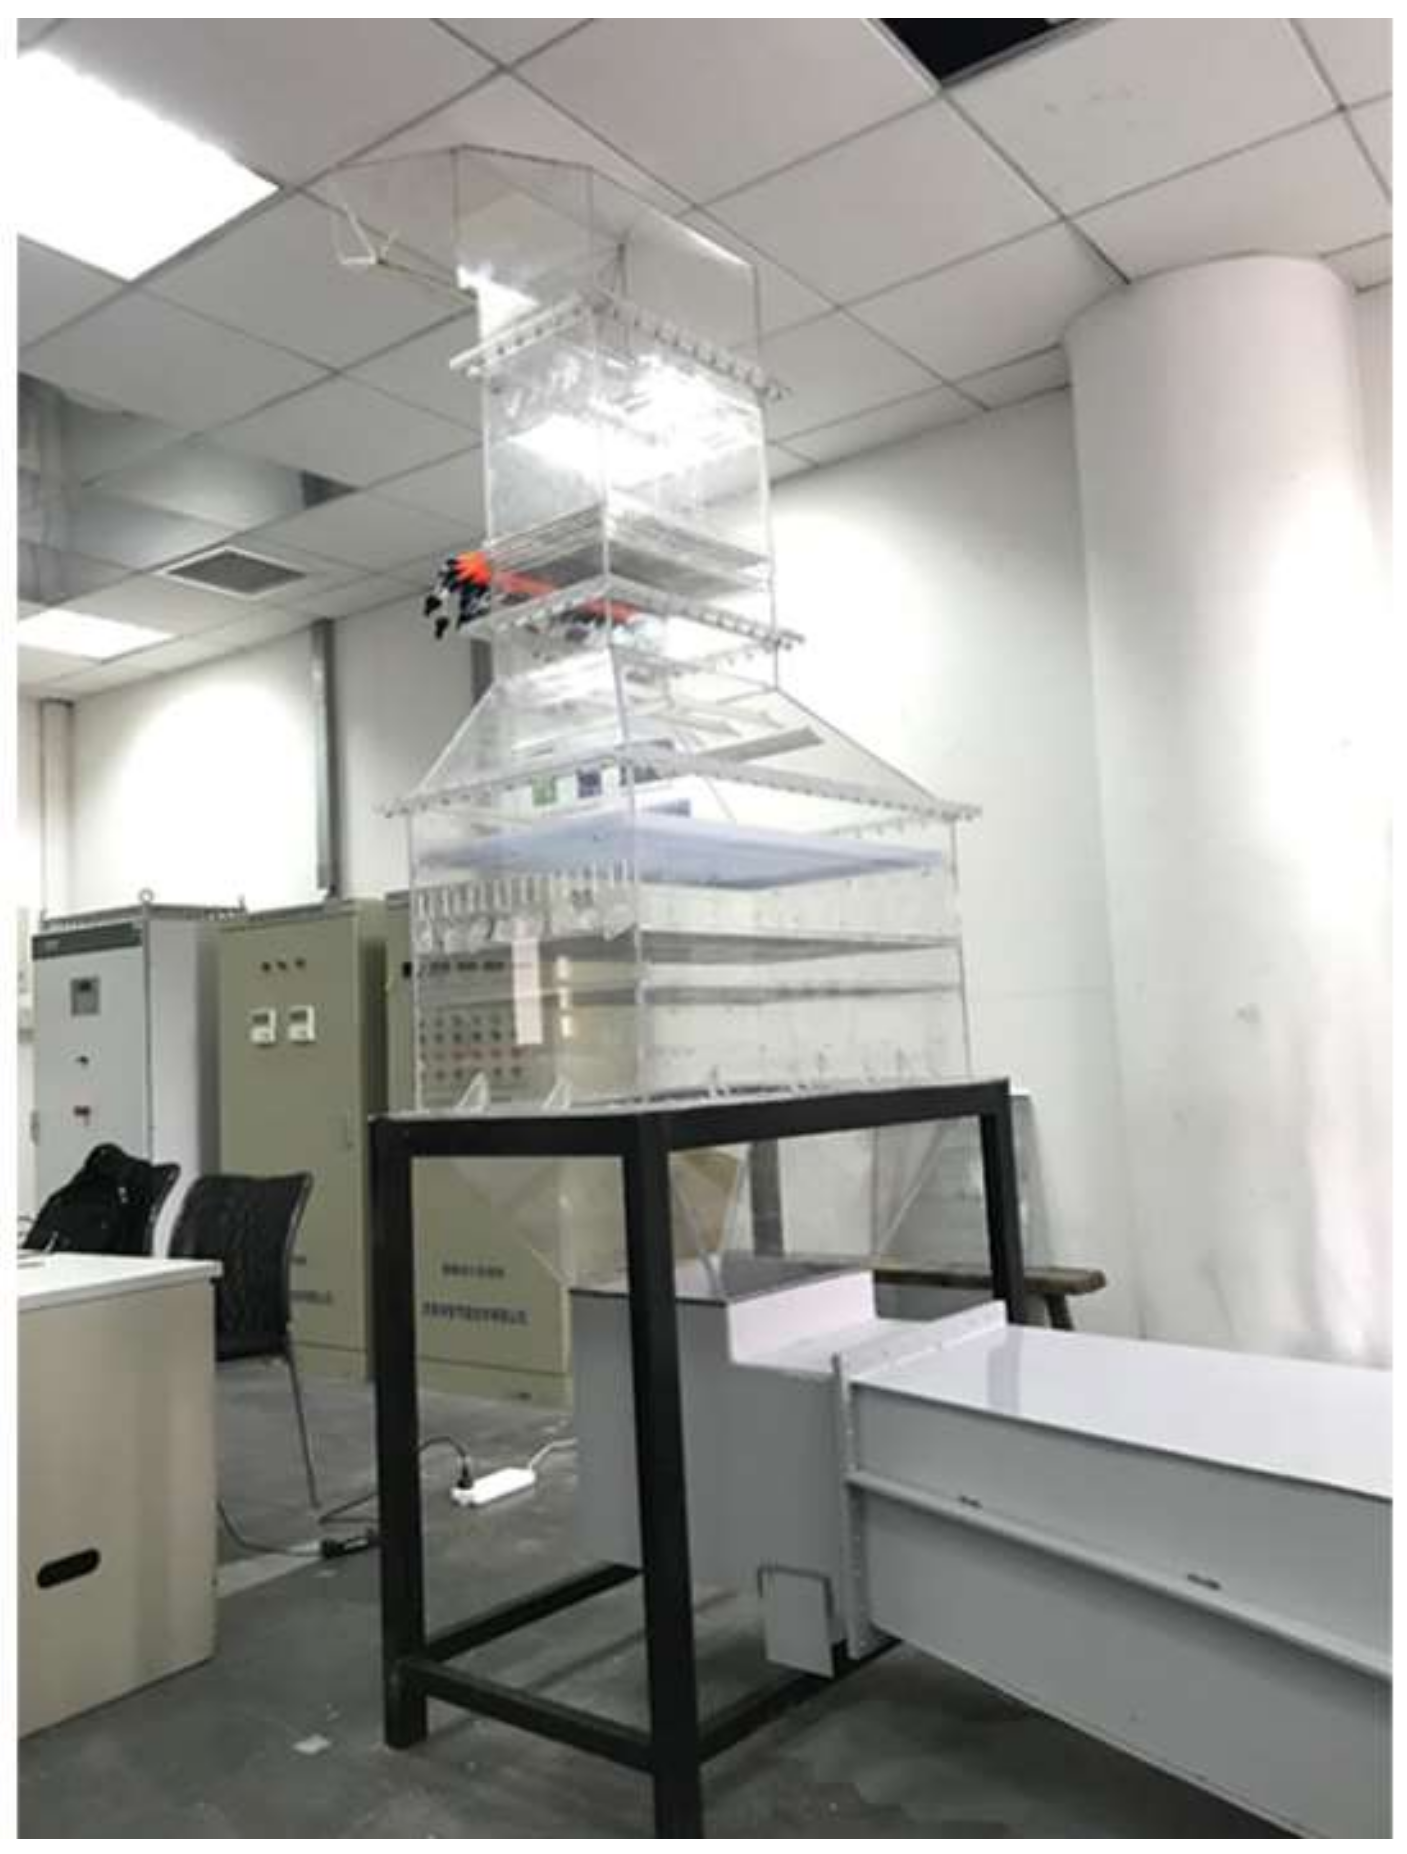
A flow model test was constructed to verify the CFD simulation results.
Figure 3 indicates the platform of FMT experiments.
The model of the tower type SCR-deNO
x facility was made of transparent plexiglas with a scale of 1:30. A perforated plate was used to represent the pressure drop of the catalyst layers. Slices made of aluminum were used as the baffles, AIG, hybrid grid, and straightener. During the experiments, chemical reactions were neglected. Air and carbon dioxide (CO
2) were substituted for flue gas and NH
3. A Testo-445 multi-function measuring instrument with different probes was used to measure the variables. A vane probe was used to measure the air velocity. Its measuring range is 0.6 to 40 m/s with a resolution of 0.01 m/s. The corresponding accuracy is ±(0.2 m/s ± 1.5% of measurement value) (+0.6 to +40 m/s). A CO
2 probe was used to measure the CO
2 concentration. Its measuring range is 0 to 10,000 ppm with a resolution of 1 ppm. The corresponding accuracy is ±(500 ppm + 2% of measurement value) (0 to +5000 ppm) and ±(100 ppm + 3% of measurement value) (+5000 to +10,000). In addition, a pressure probe was used to measure the pressure loss. Its measuring range is 0 to 100 hPa with the resolution of 0.01 hPa. The corresponding accuracy is ±0.1 hPa (0 to +20 hPa) and ±0.5% of measurement value (+20 to +100 hPa).
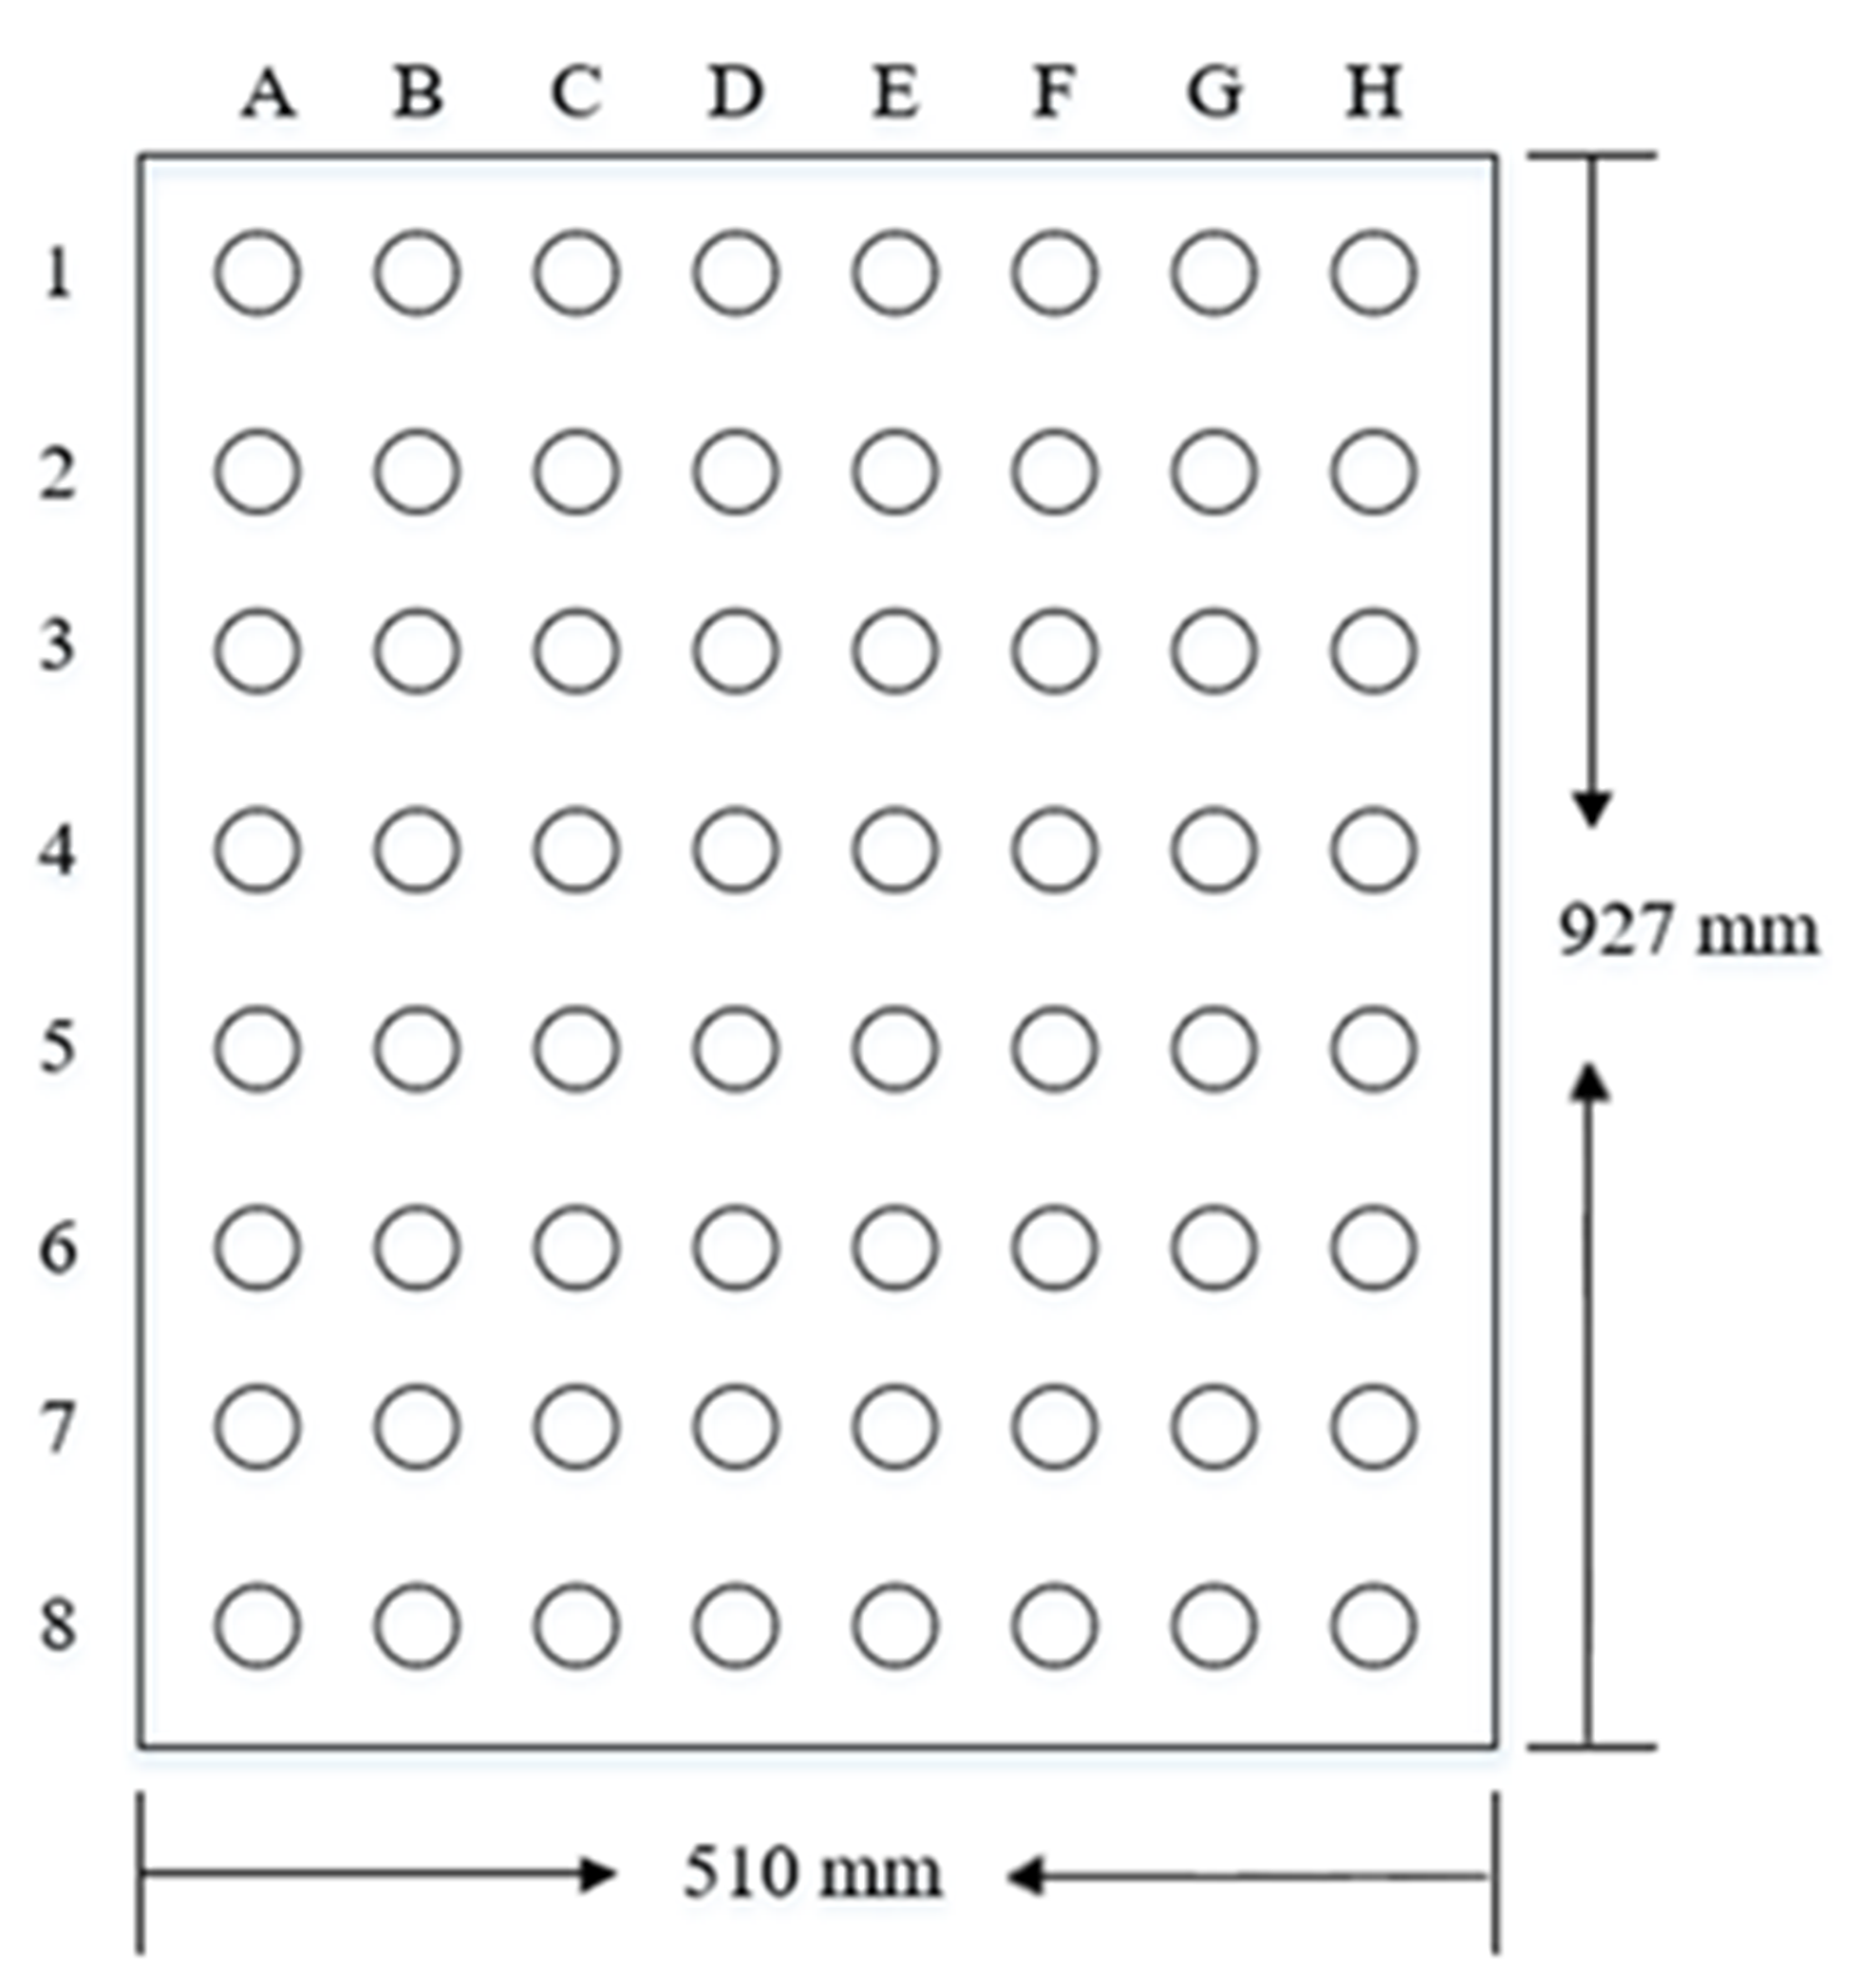
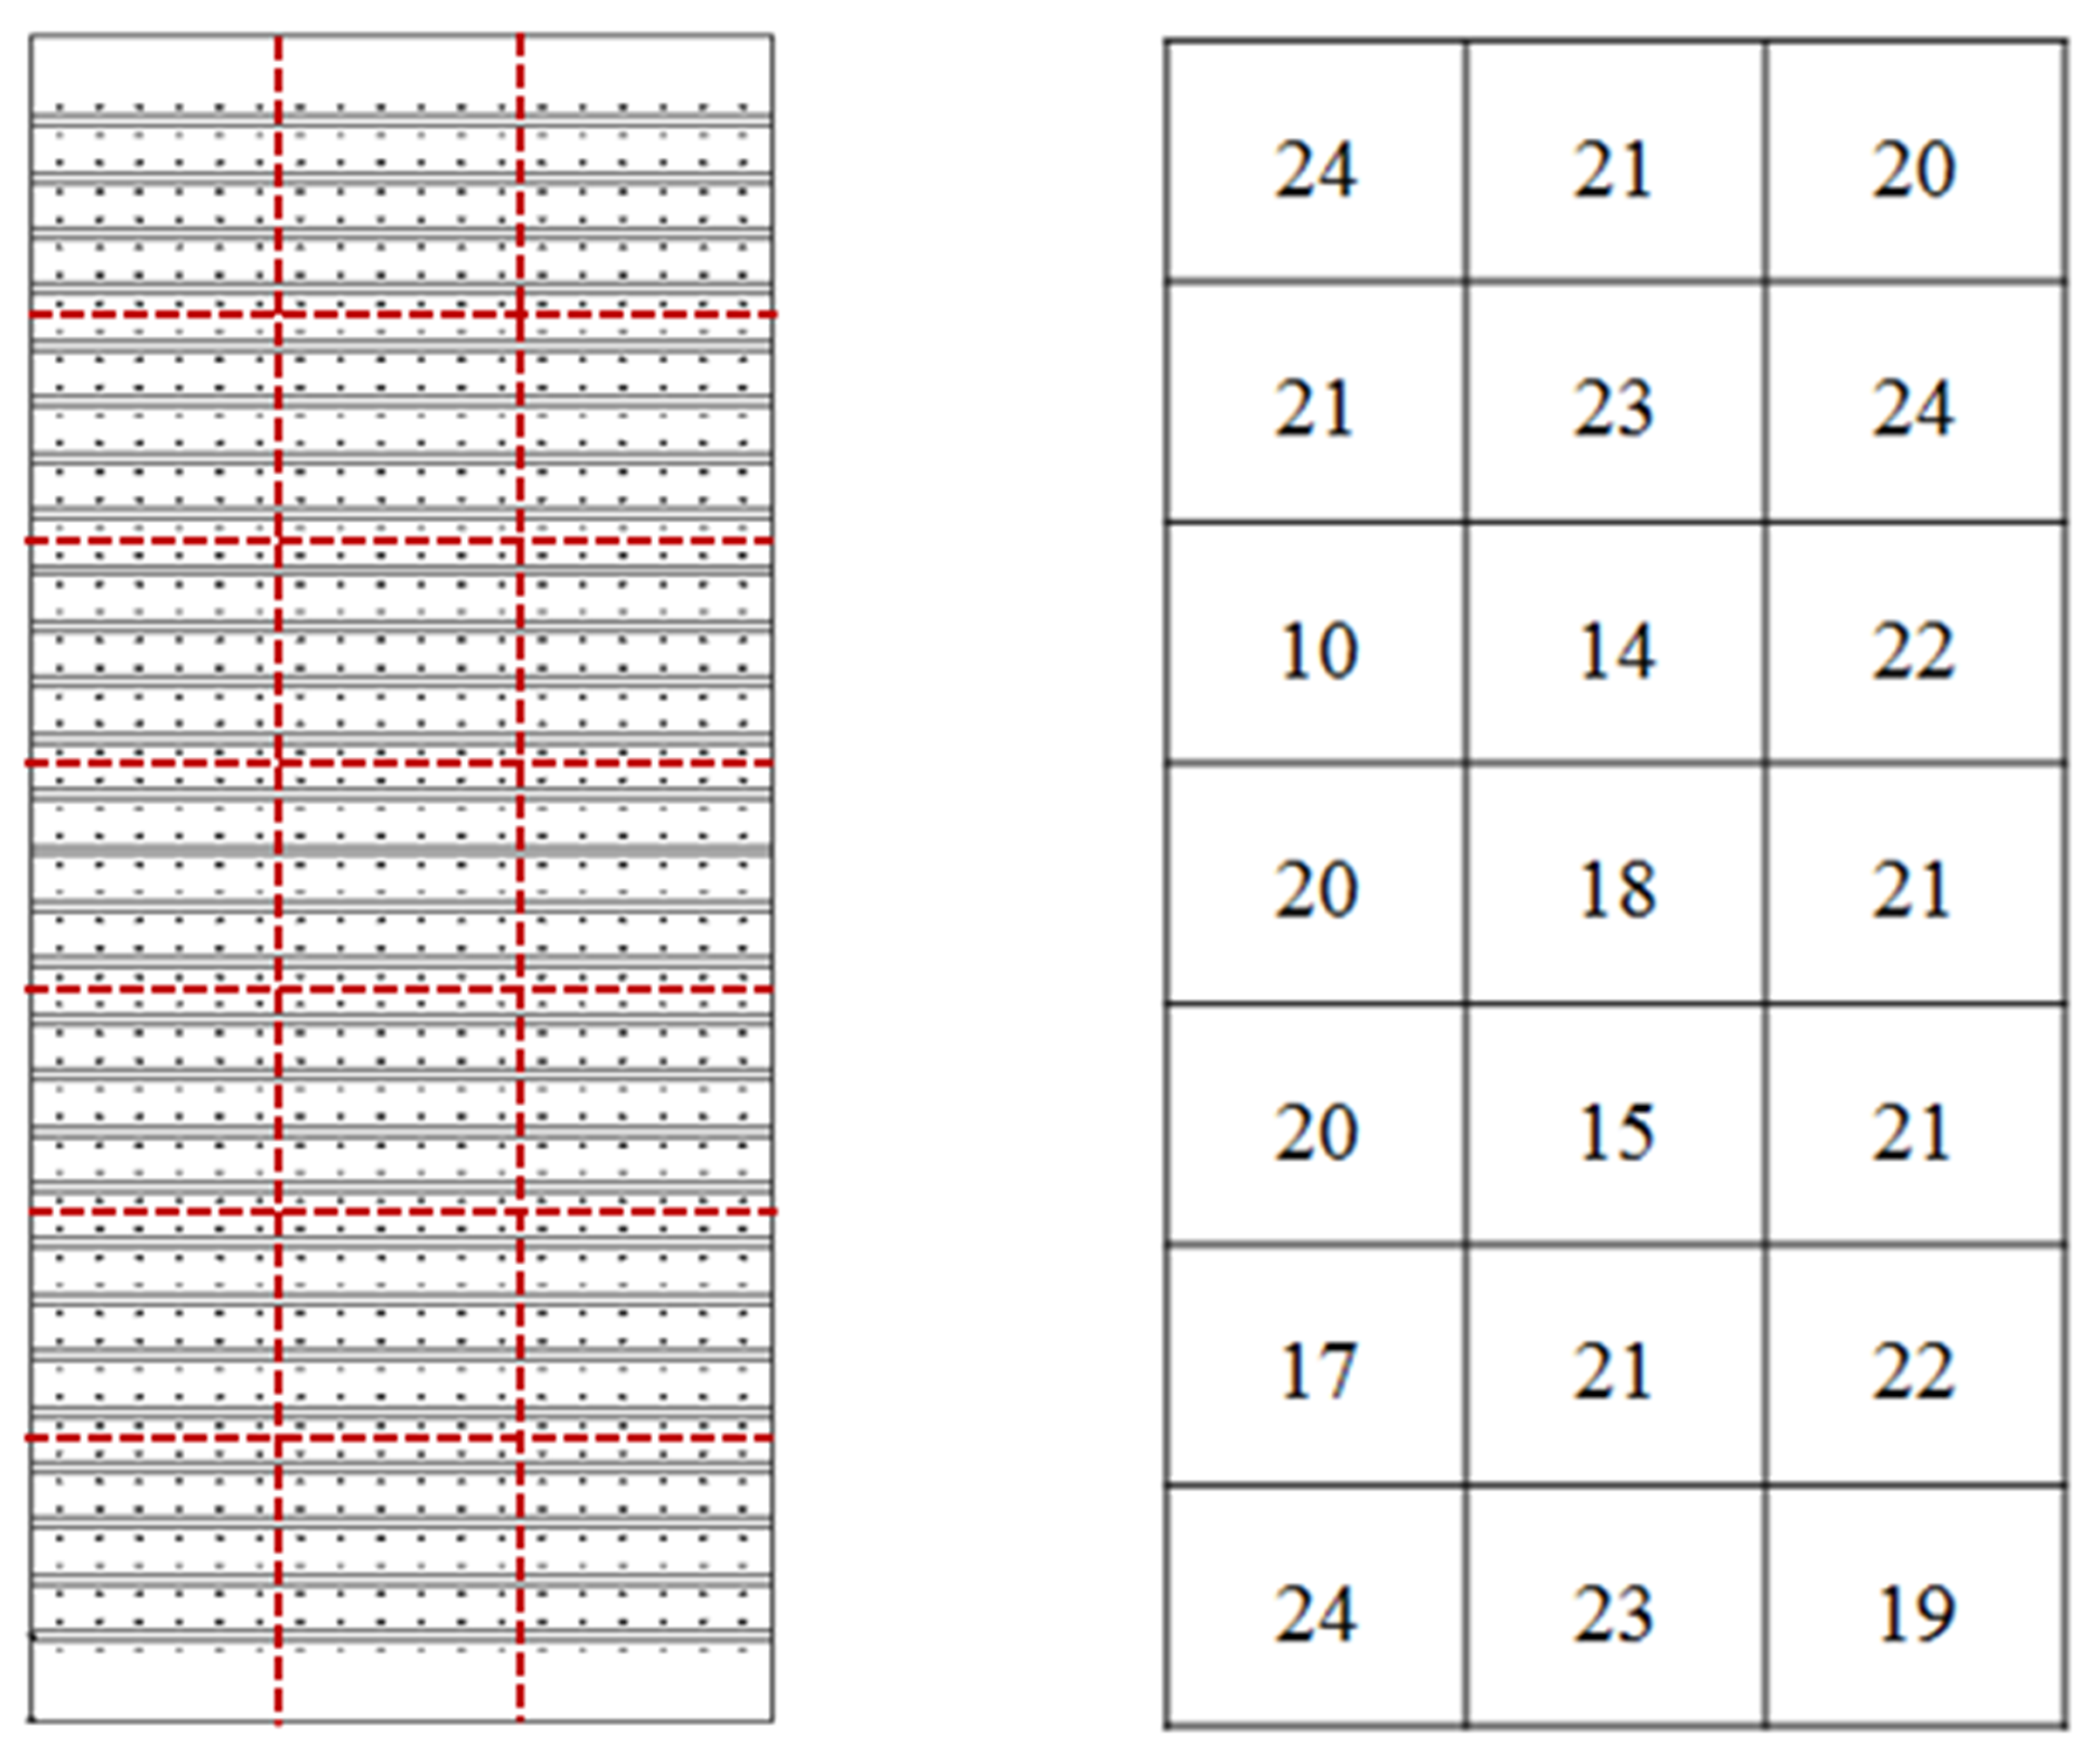
Figure 4 indicates the 64 detection spots that are arranged as an 8 × 8 matrix over the perforated plate.
The experiments were repeated five times at room temperature while the air inlet velocities were modified to close to 14.75 m/s, which is in accordance with the case of 100% BMCR condition. The experimental results are shown in
Appendix B. The average values of air velocity, CO
2 concentration, and pressure loss were calculated and recorded. Comparisons are presented between the results of the FMT experiments and CFD simulations as a validation of the optimal design.
3. Results and Discussion
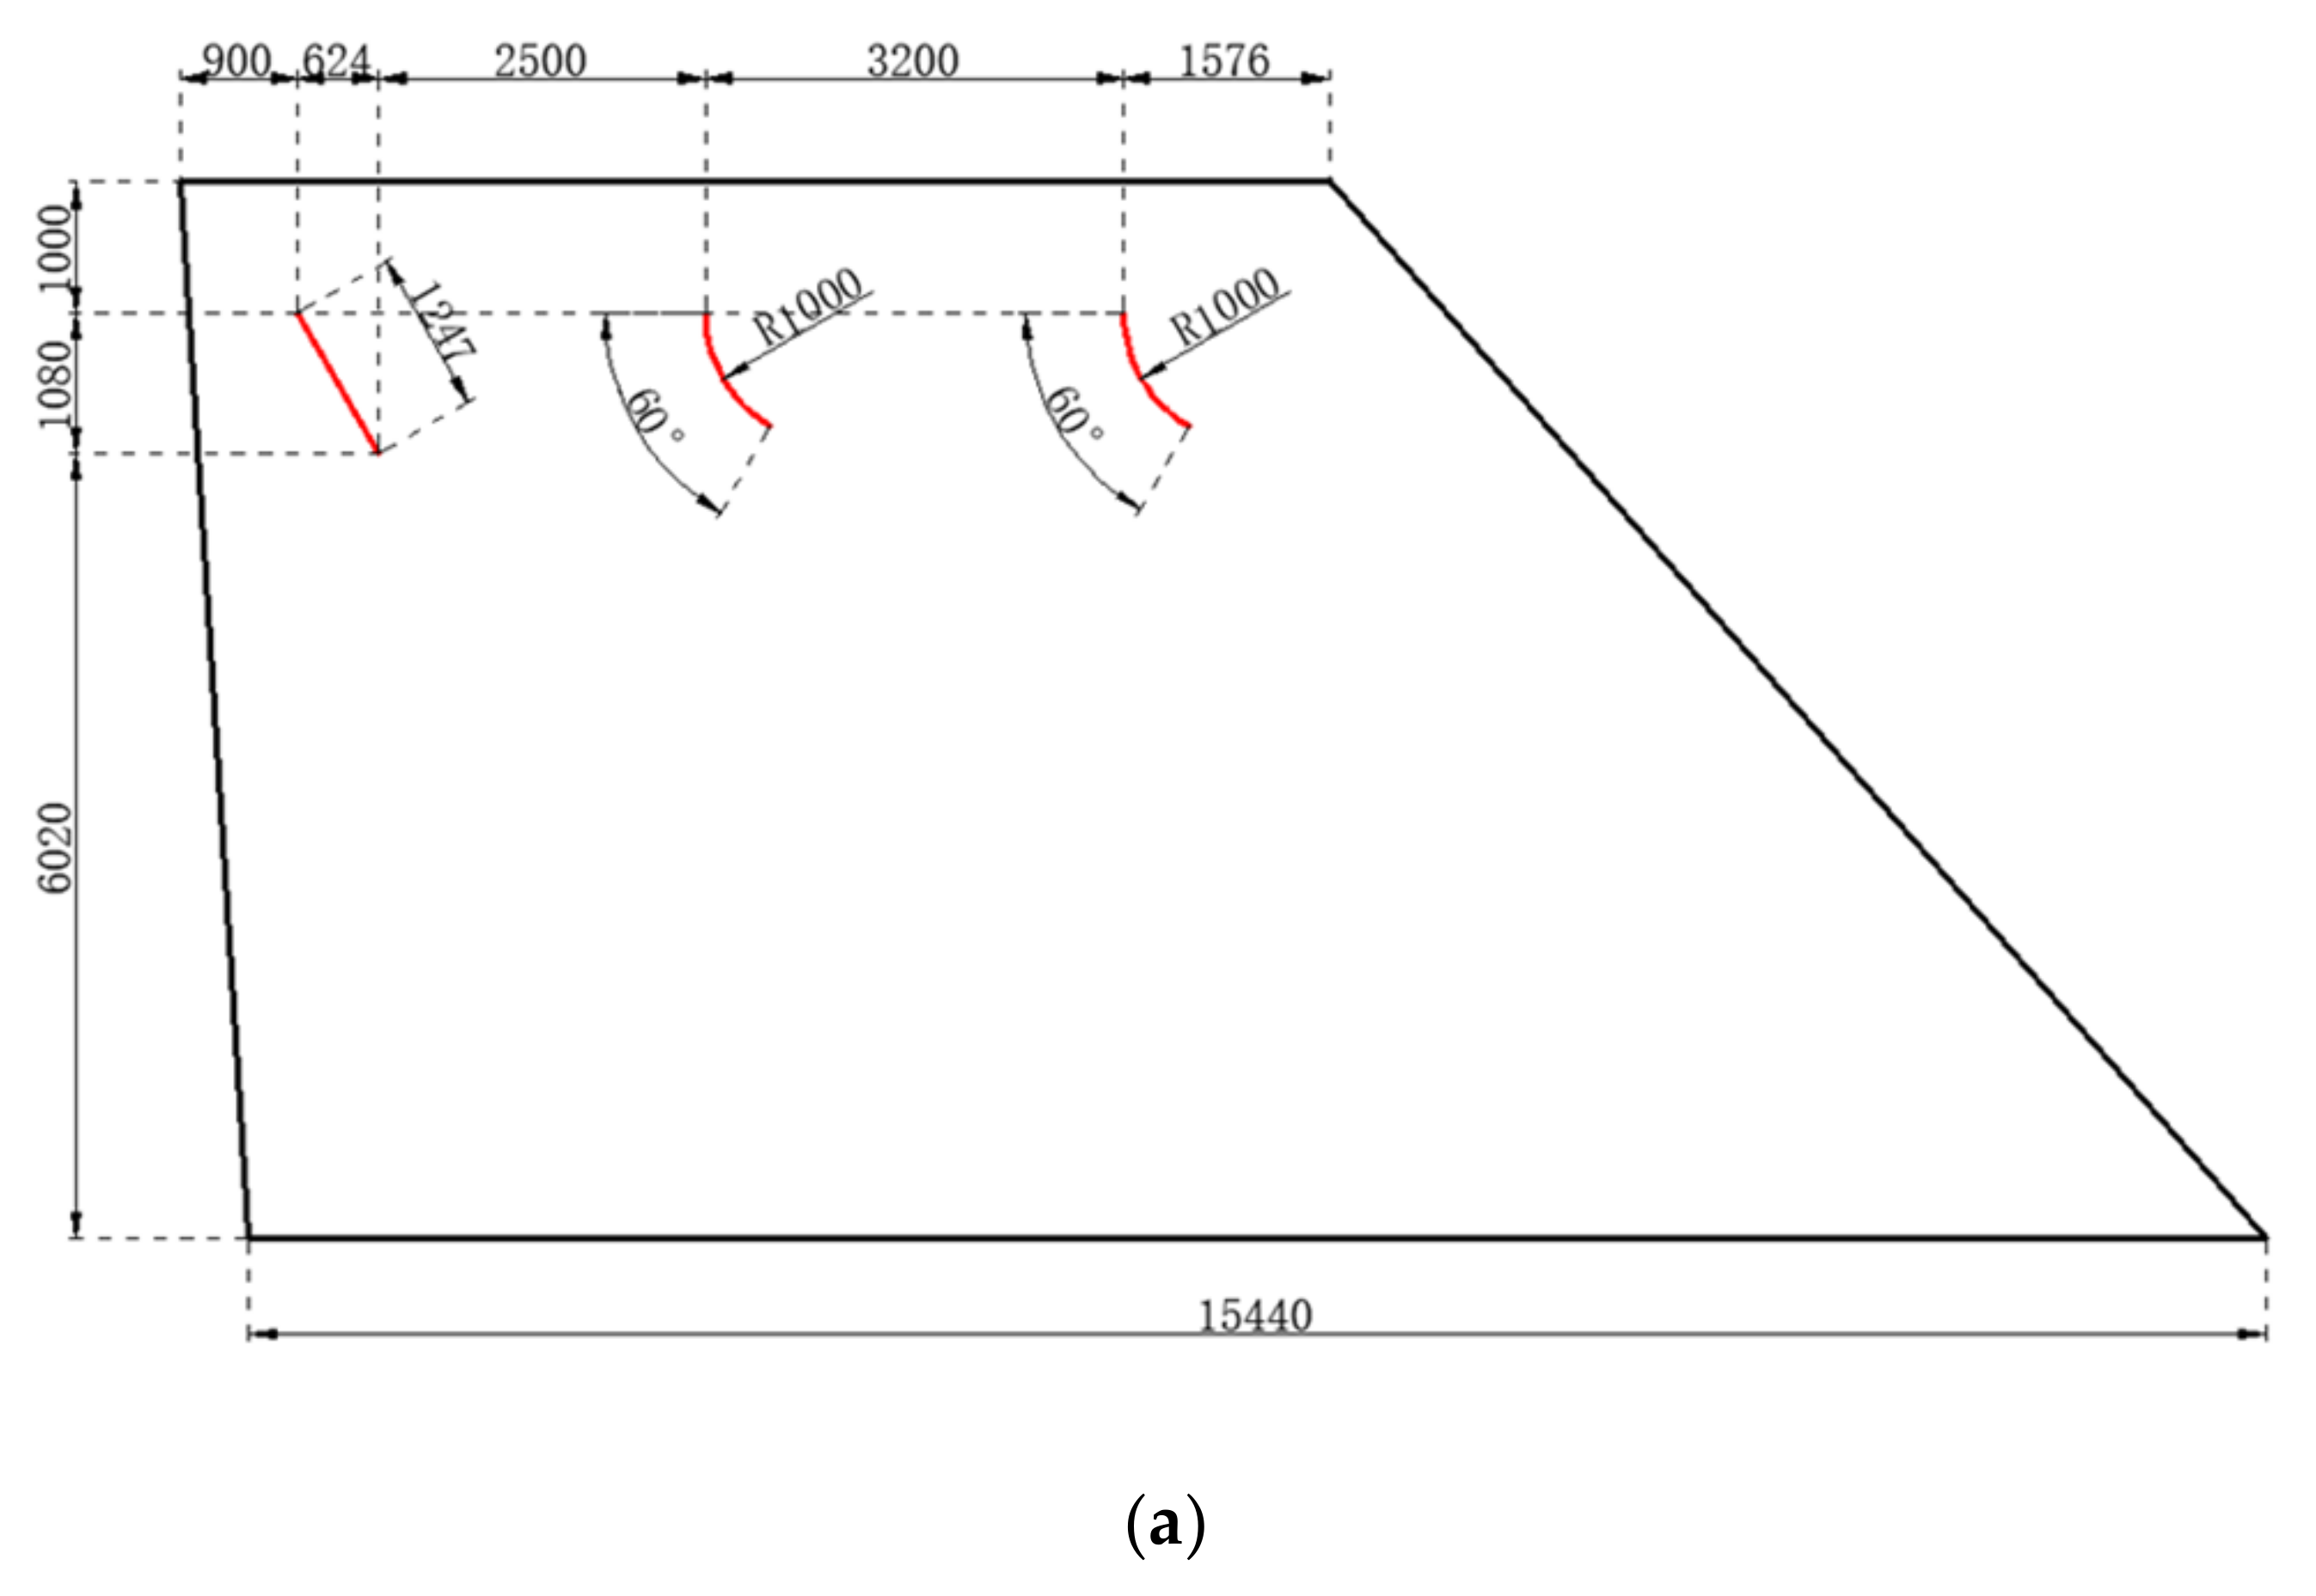
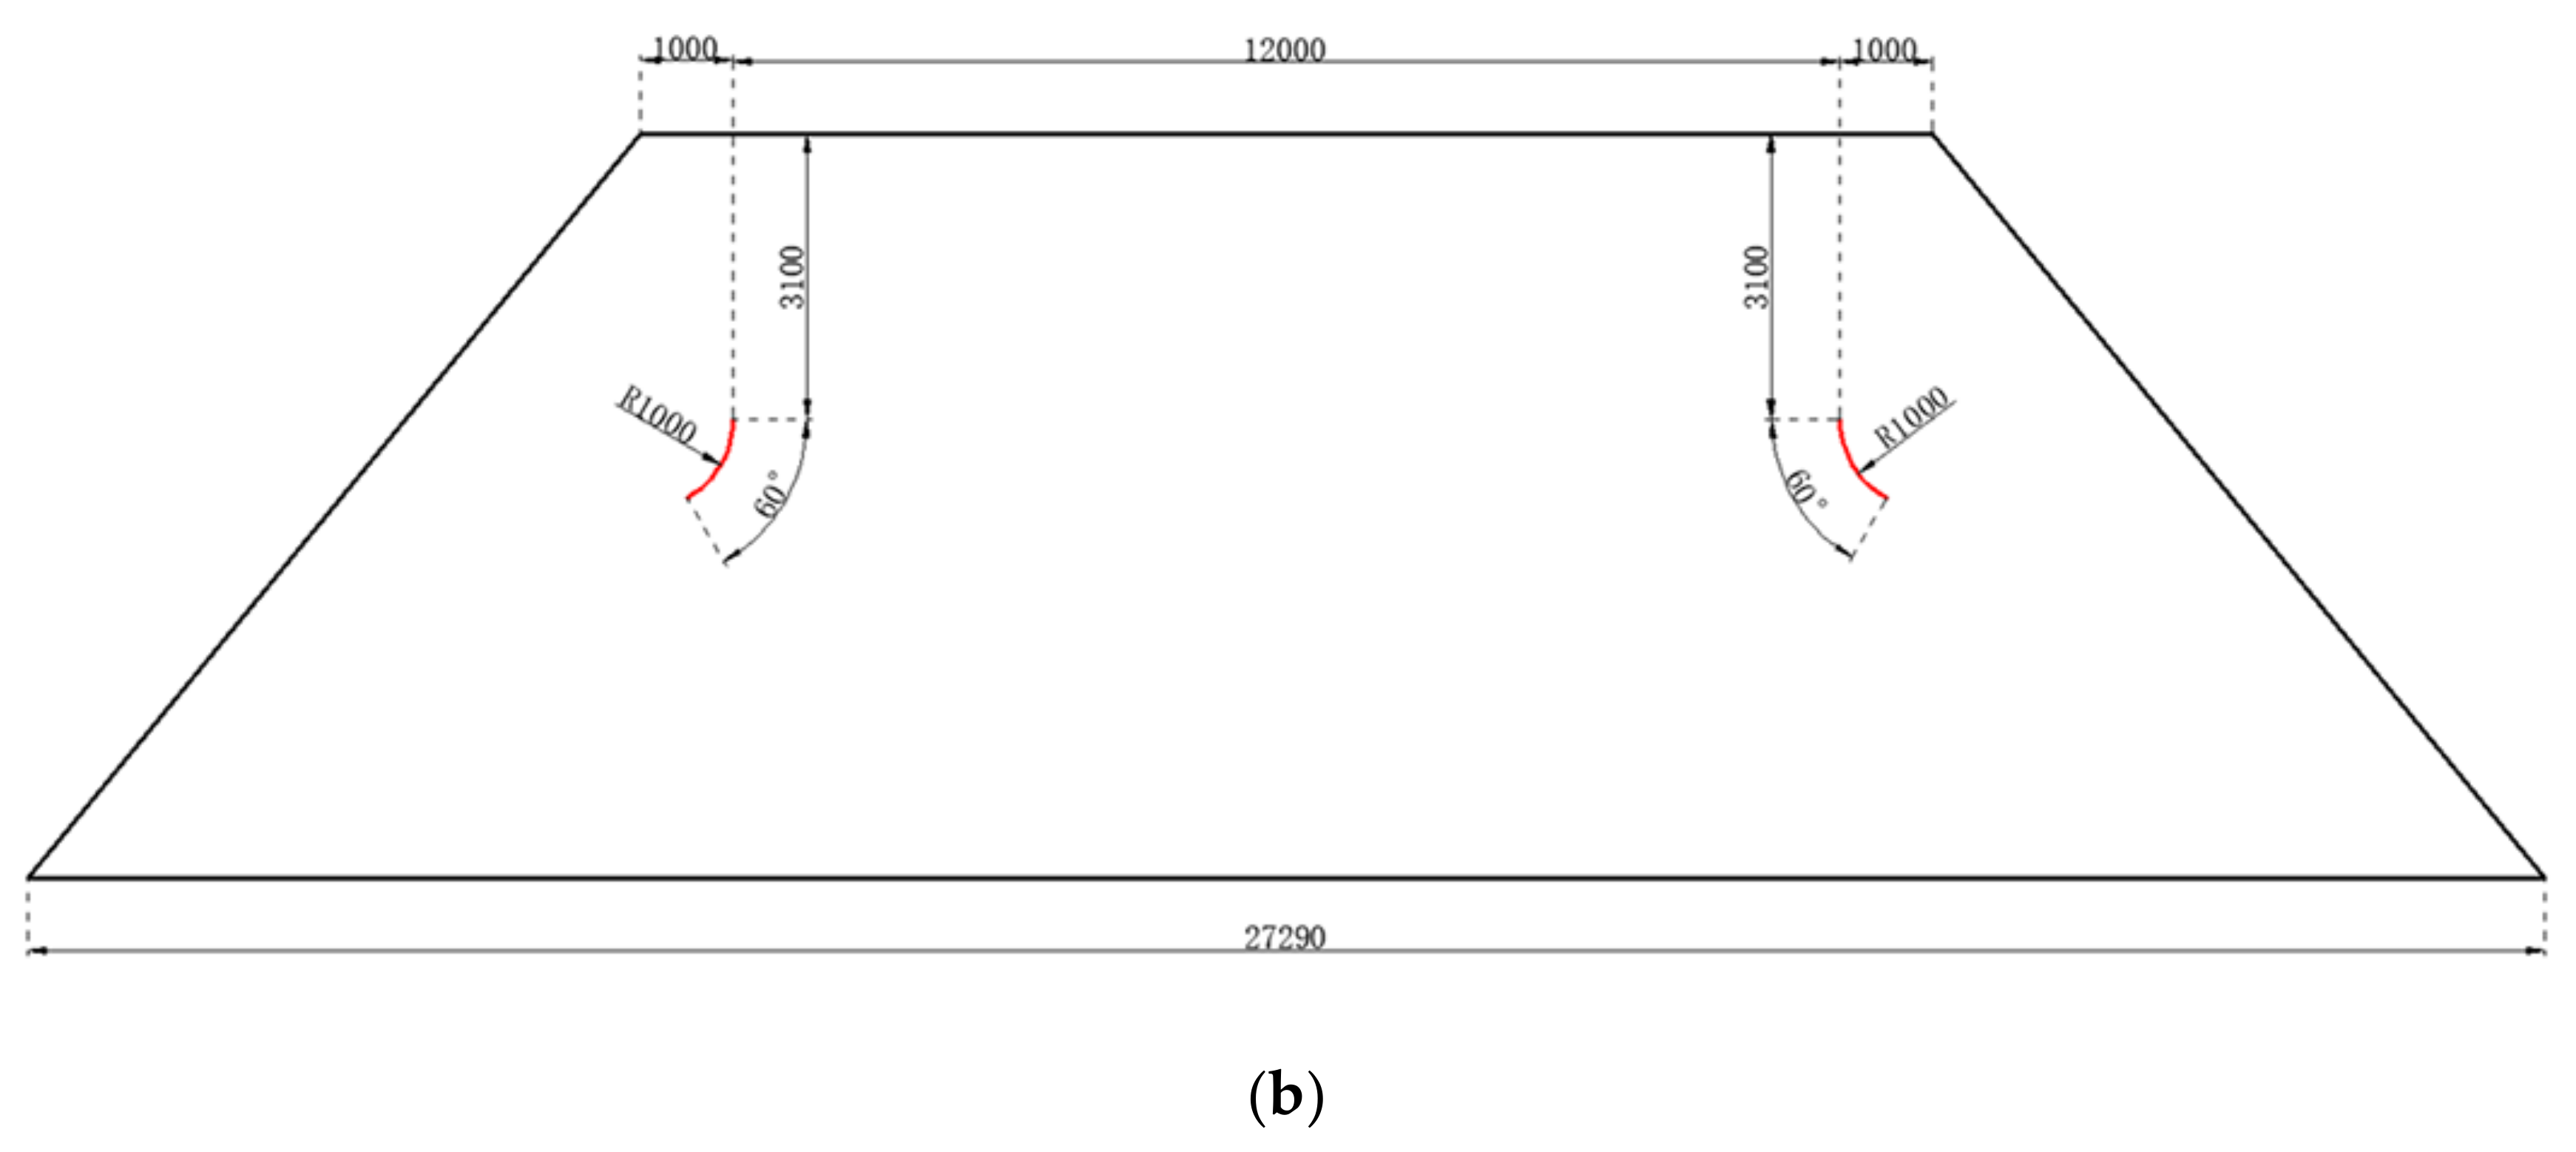
After optimization, baffles were installed in the expansion duct. The corresponding configuration is shown in
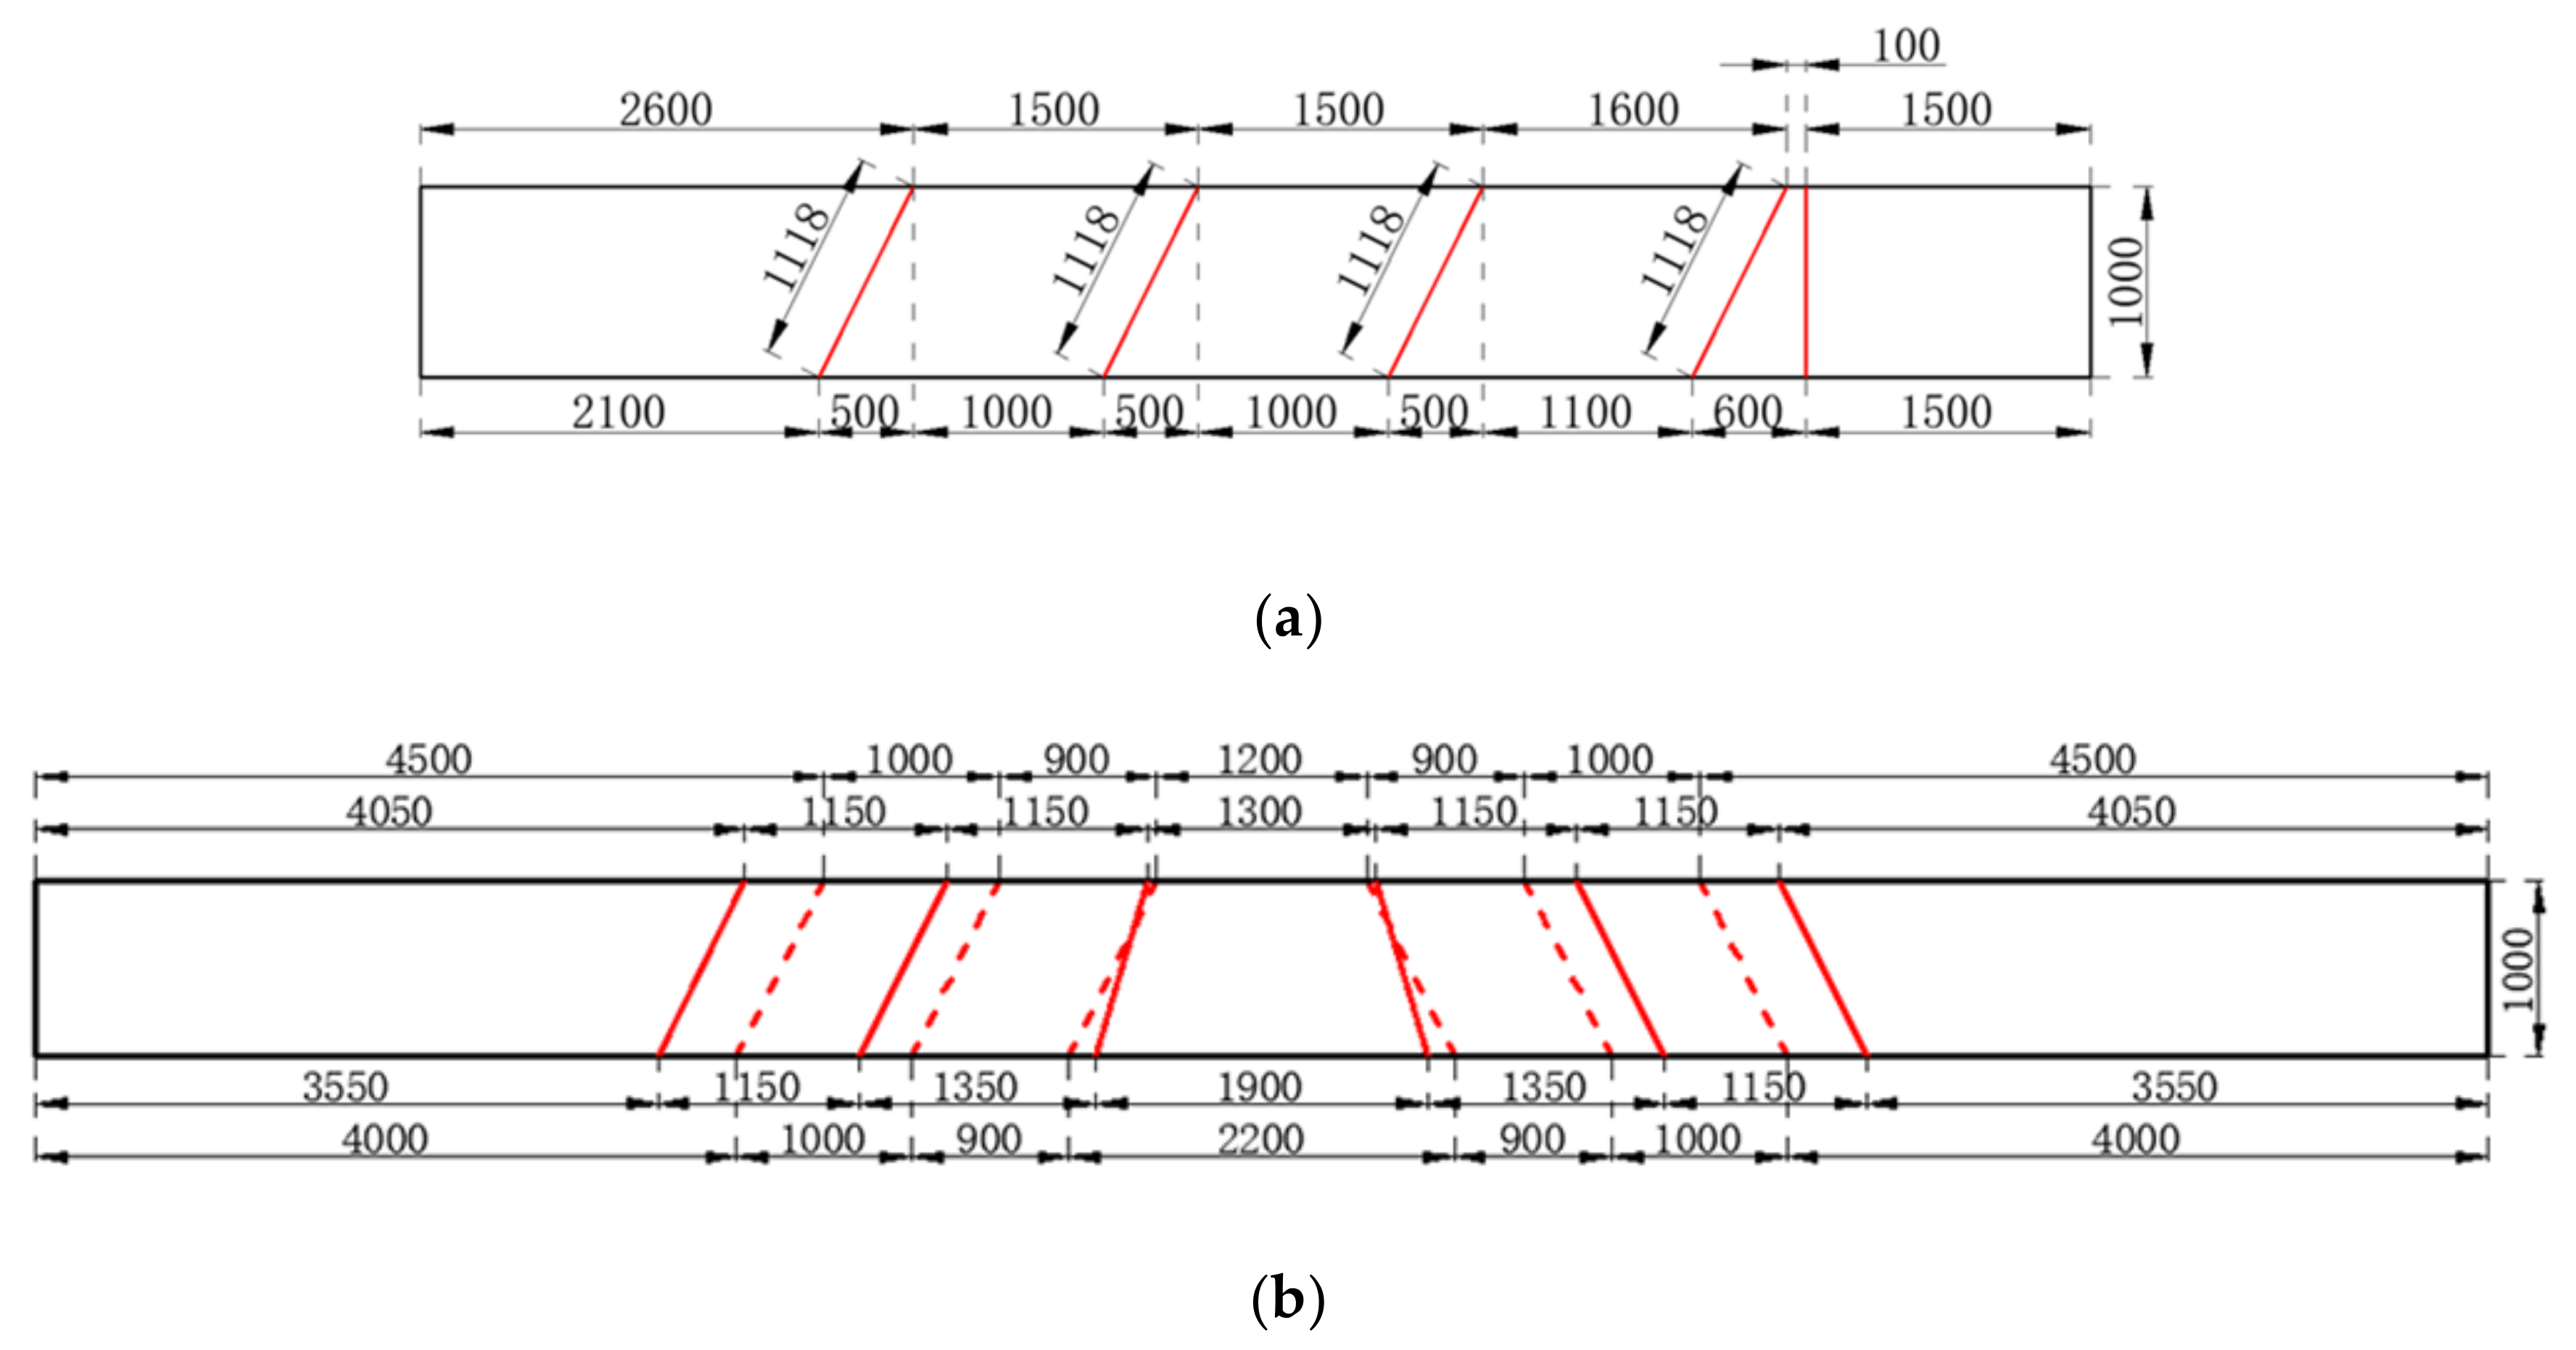
Figure 5. The specific sizes and locations of the baffles are shown in
Figure 6.
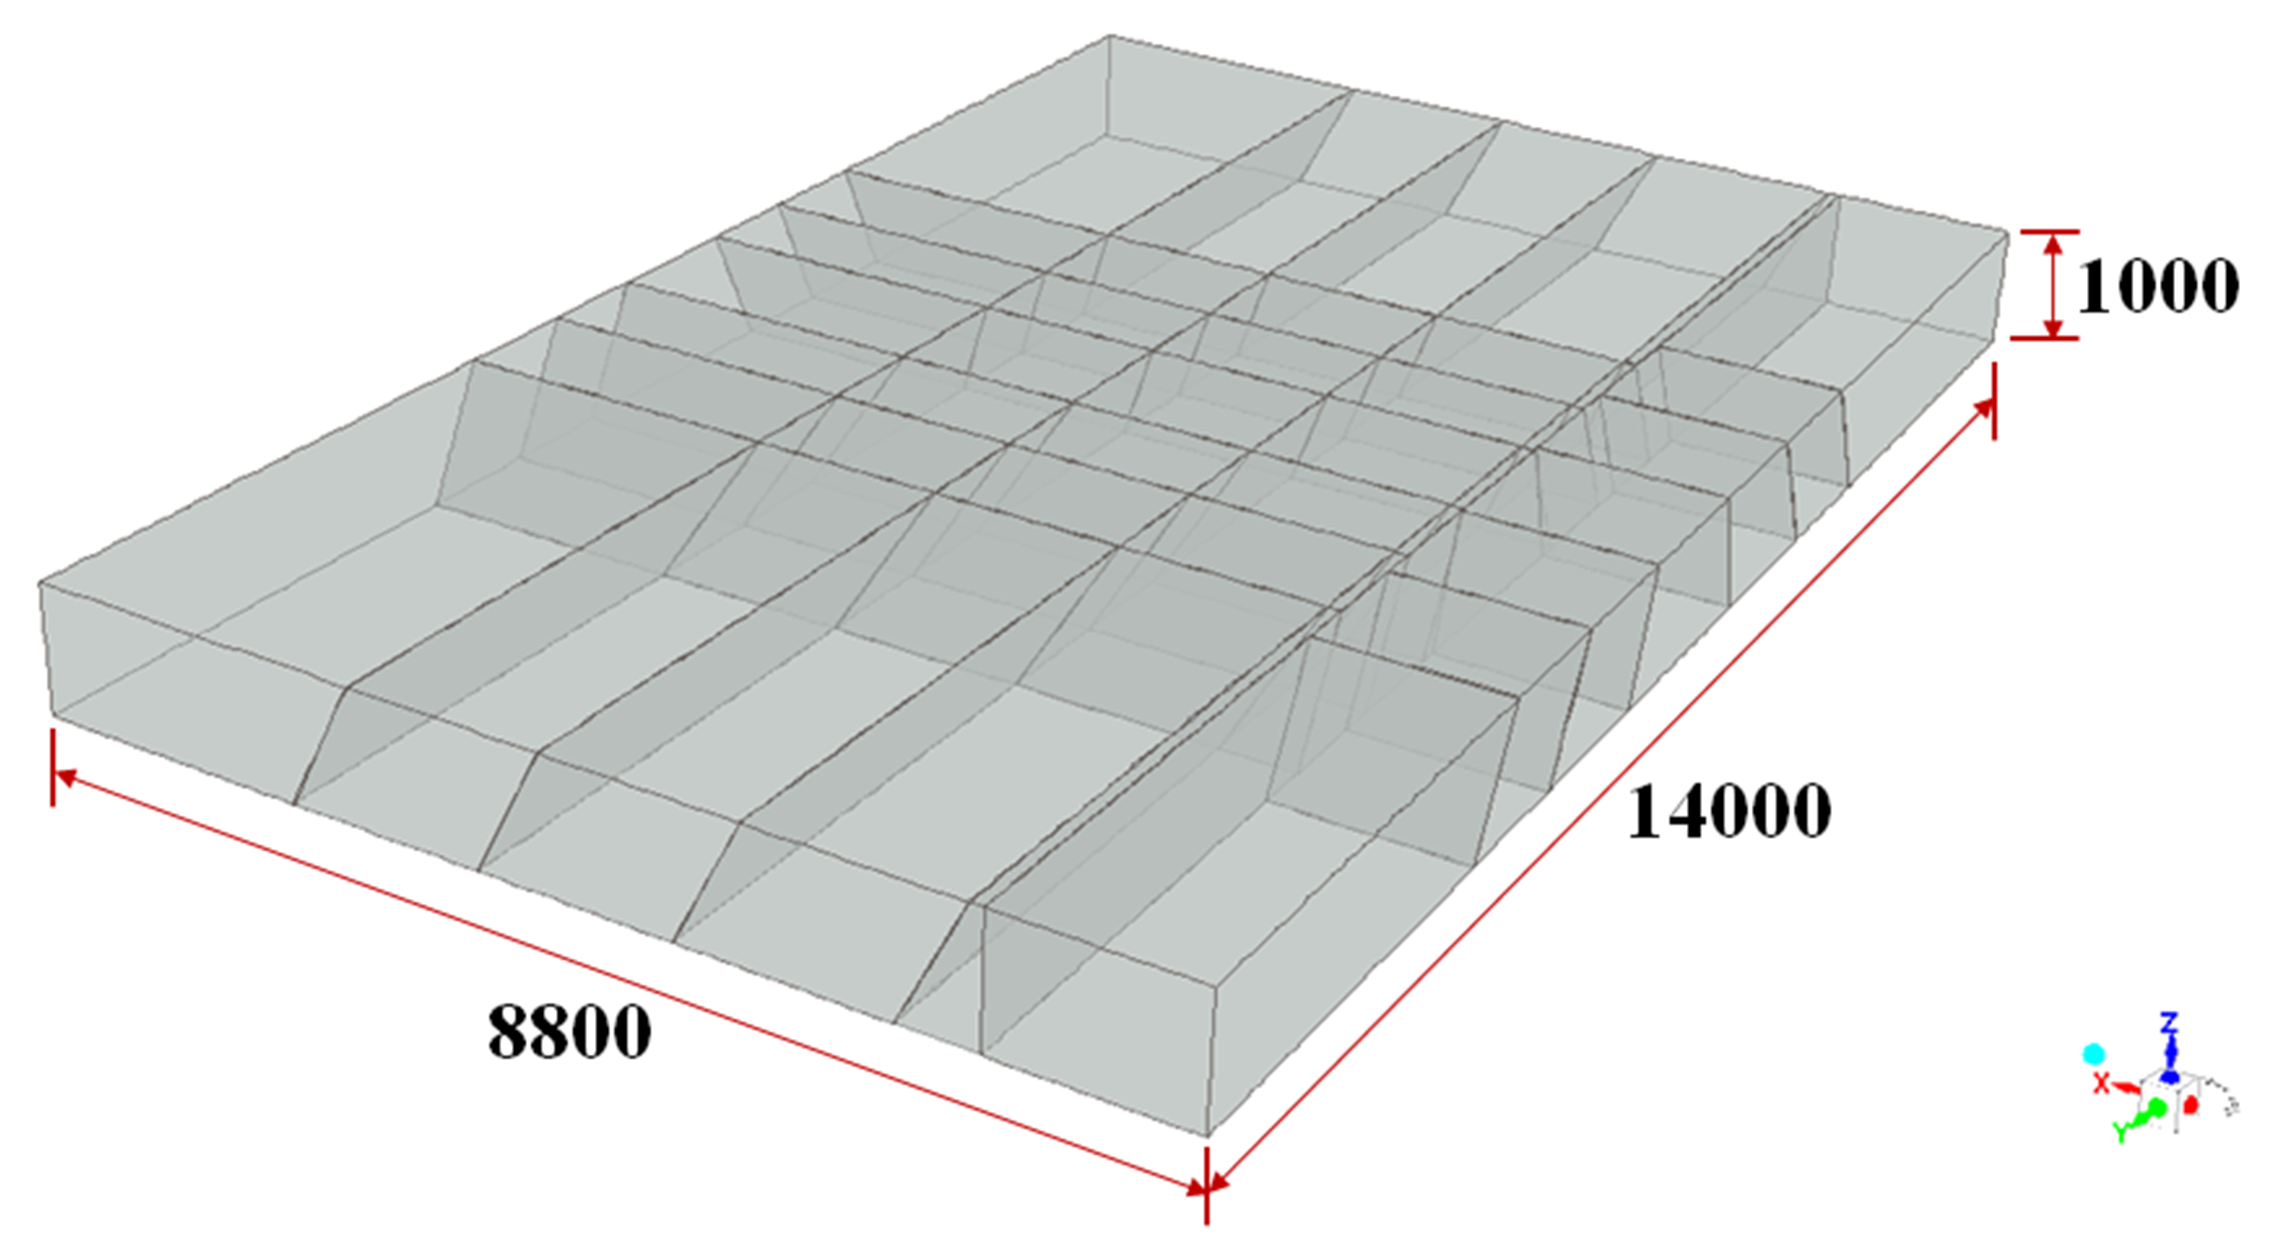
A group of crossed baffles were installed before the AIG. The corresponding configuration is shown in
Figure 7.
Figure 8 illustrates the specific sizes and locations of the baffles. The consumption of the 6 mm steel plate was about 1.13 m
3 and the corresponding surface area of the baffles was about 188 m
2, which is quite small compared with the sectional area of the catalyst layer of 430 m
2.
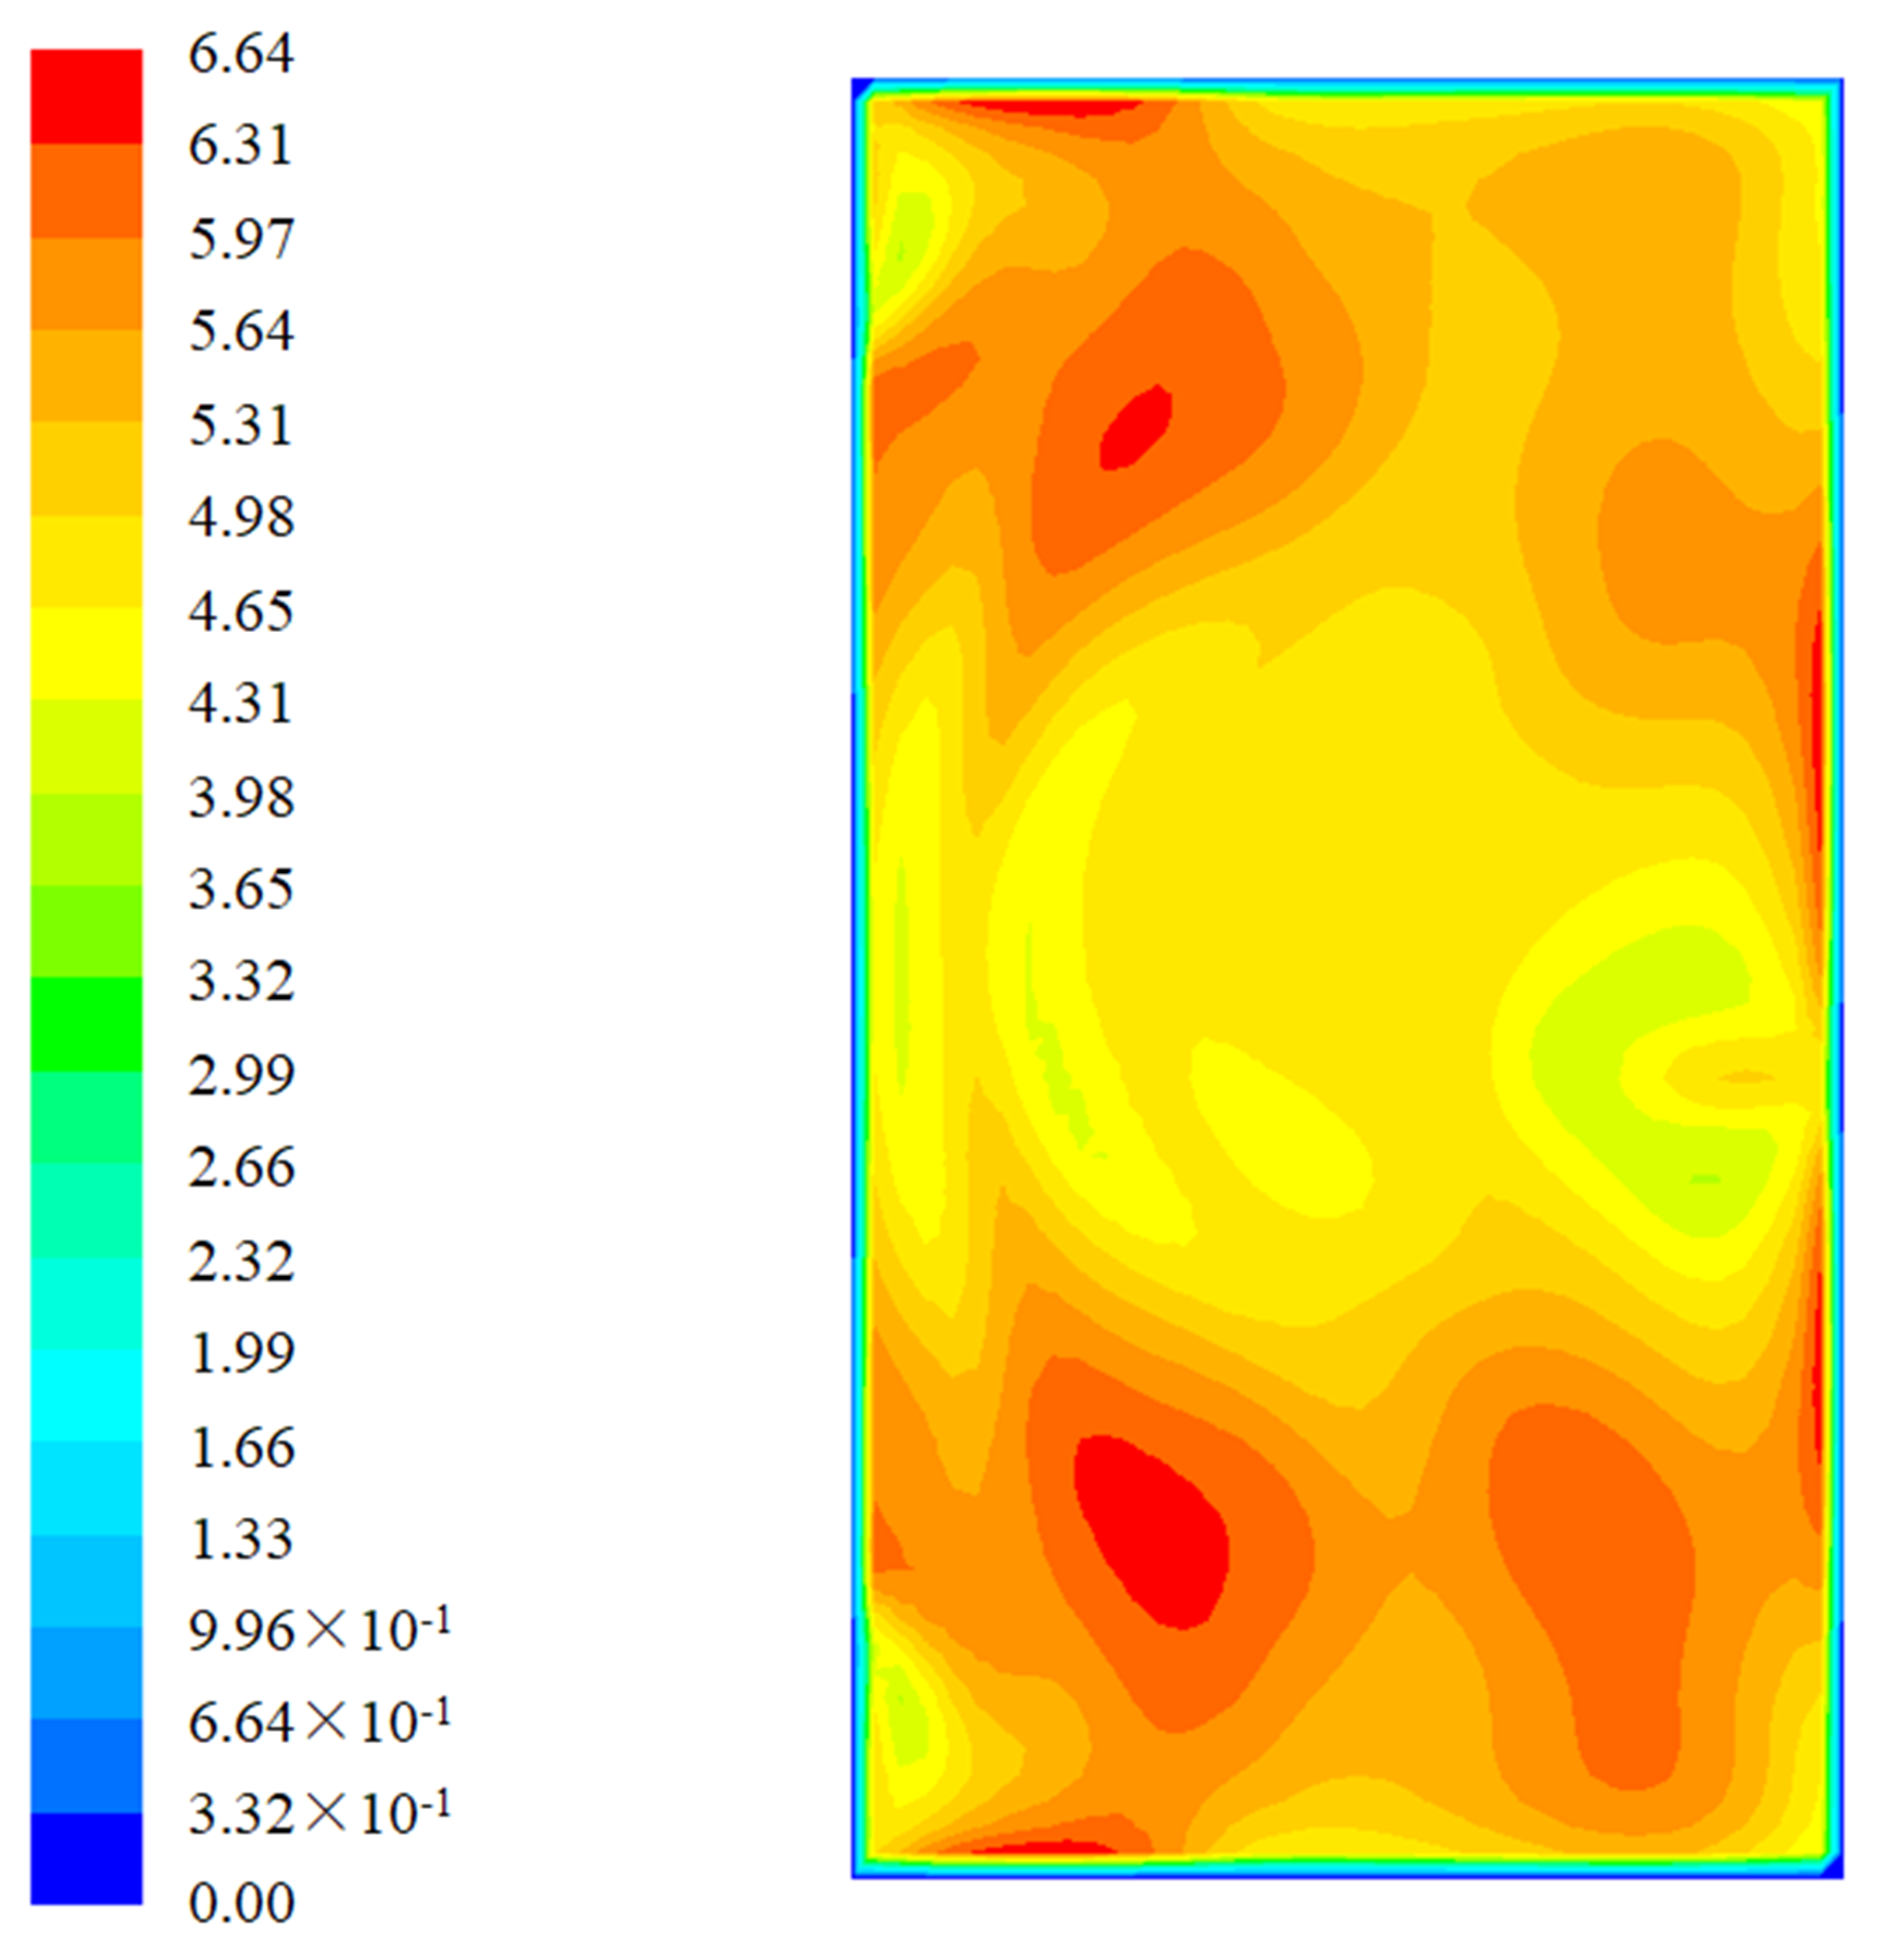
Figure 9 shows the contours of gas velocity at the observation plane for the optimal design. According to
Figure 9, the RSD of gas velocity is 11.90% and the maximum velocity is 6.64 m/s.
Figure 10a gives the injection divisions of AIG and
Figure 10b gives the corresponding non-uniformed NH
3 injection strategy.
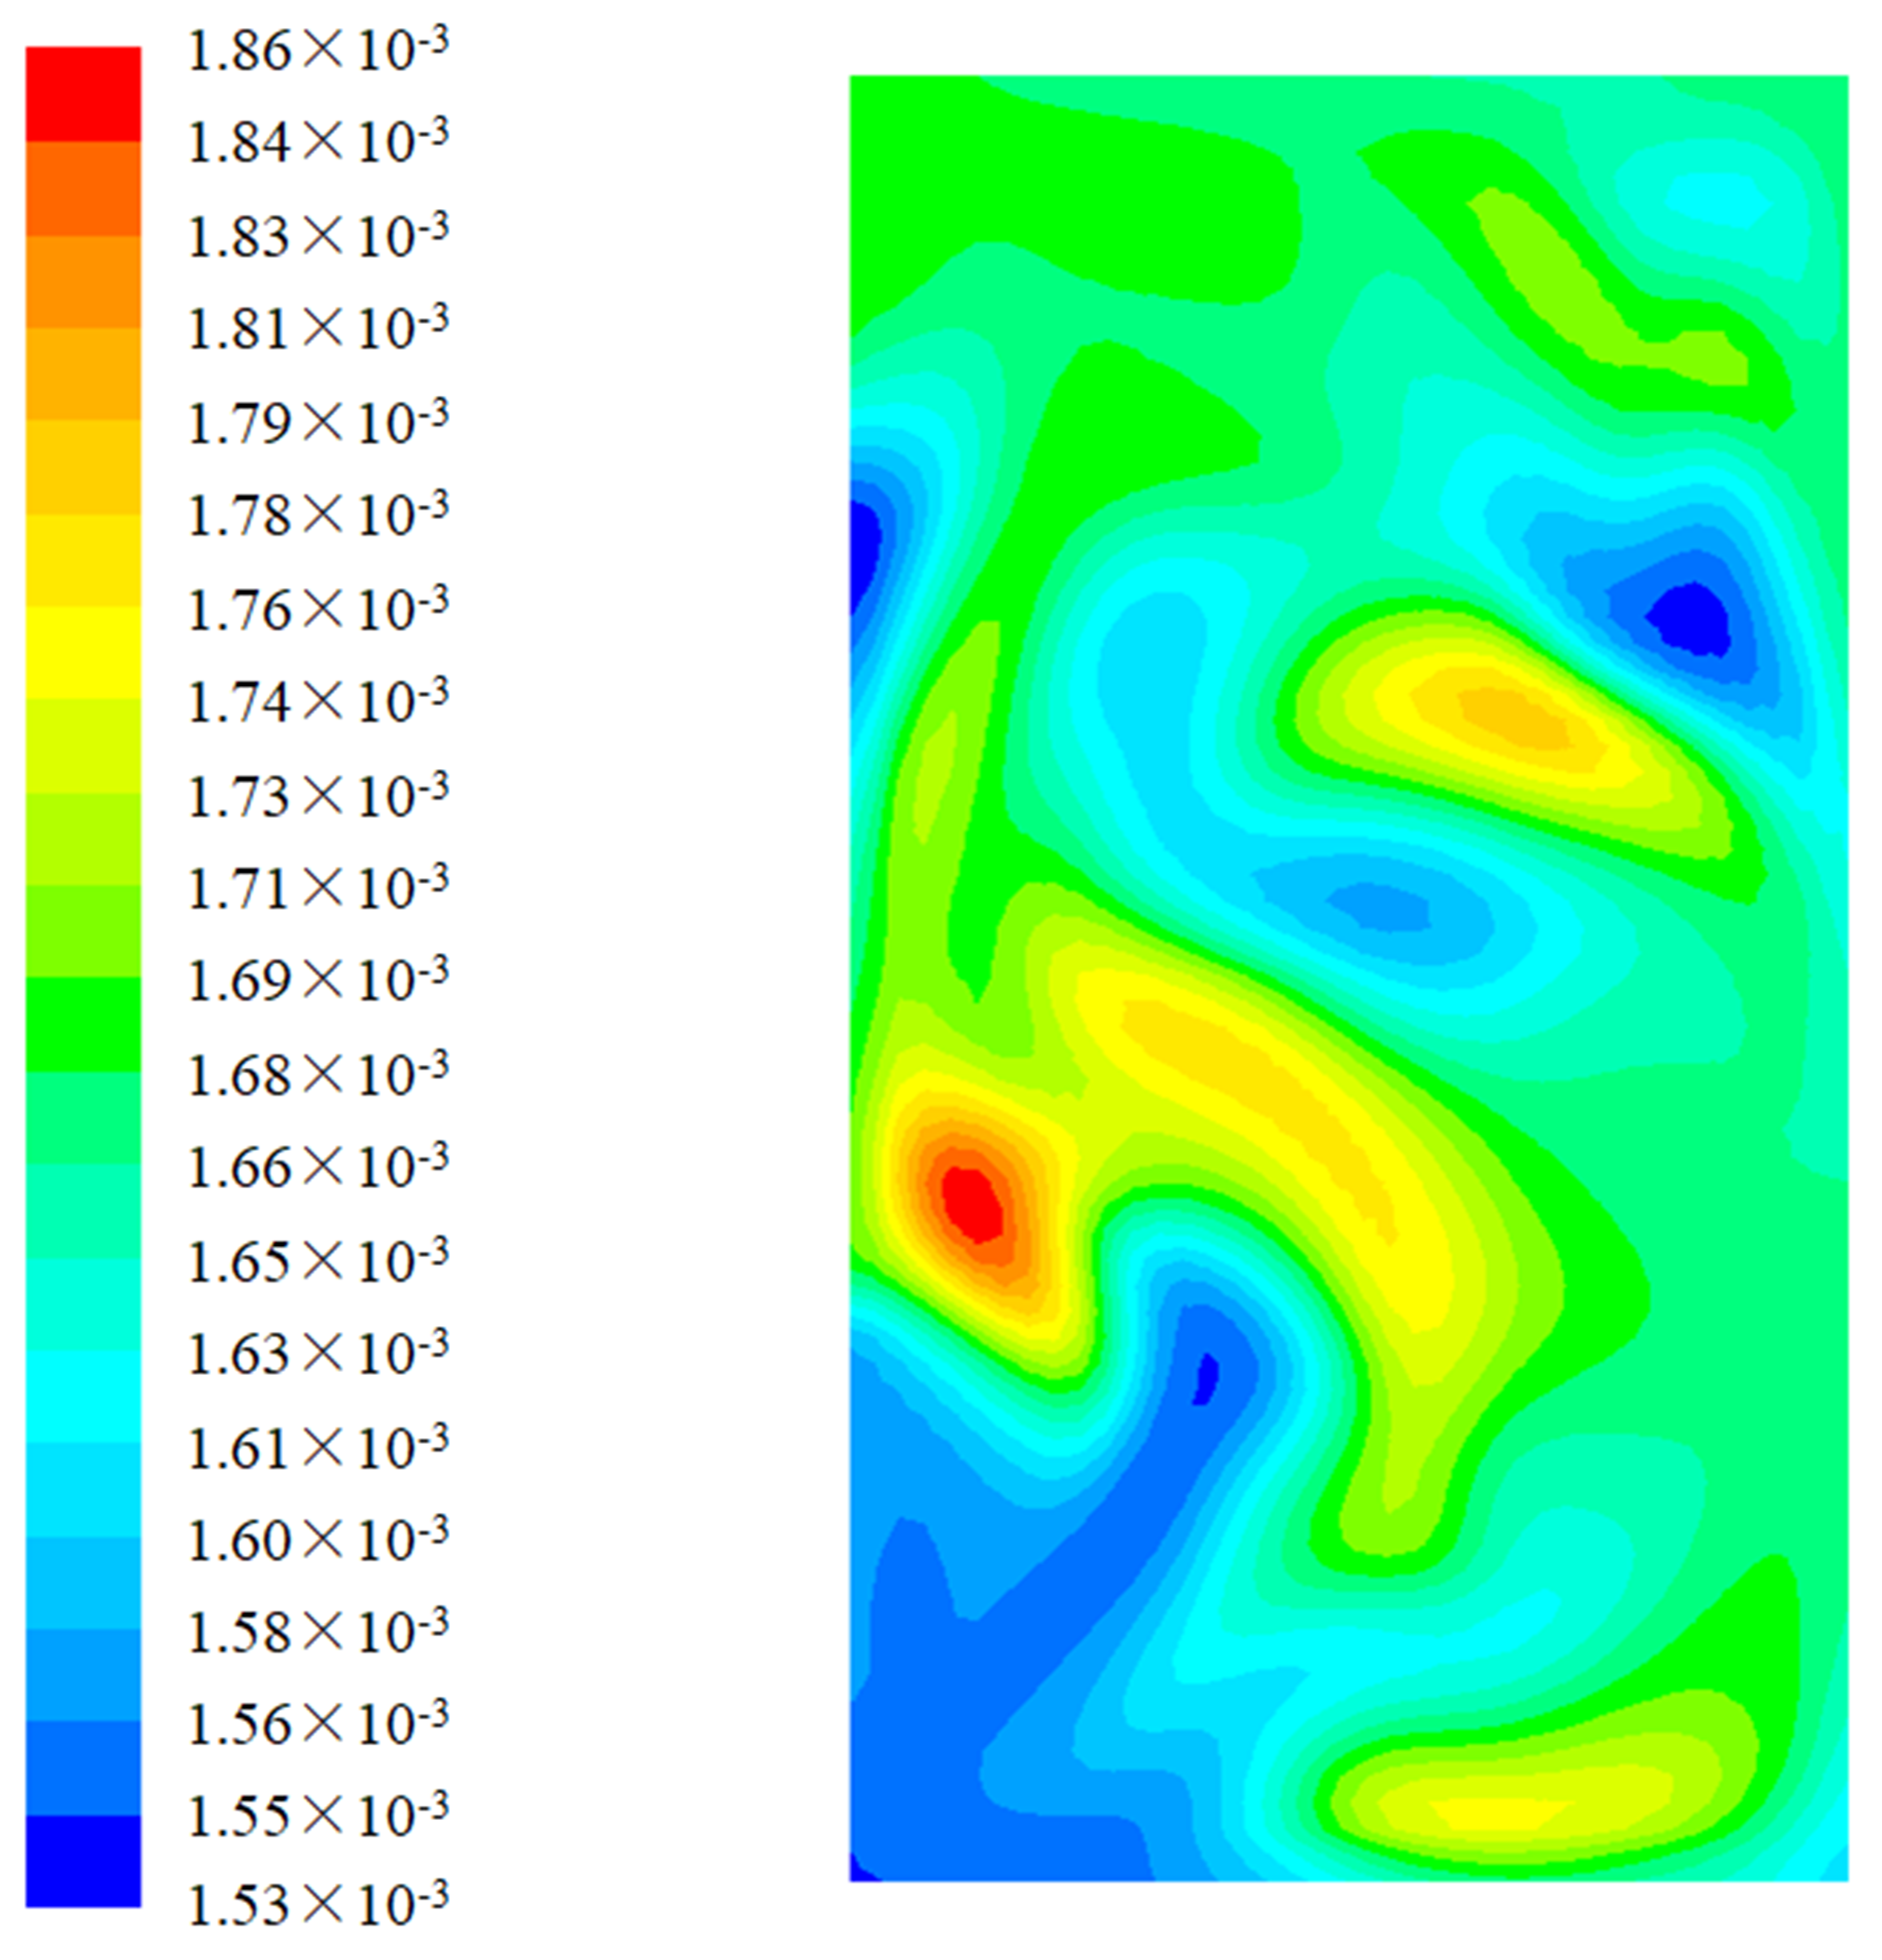
Figure 11 shows the contours of NH
3 concentration with the non-uniformed NH
3 injection strategy applied. The RSD of NH
3 concentration is 3.37% and the range varies from 1.53 × 10
−3 to 1.86 × 10
−3 kg/m
3, indicating that the flue gas and the NH
3 are mixed adequately.
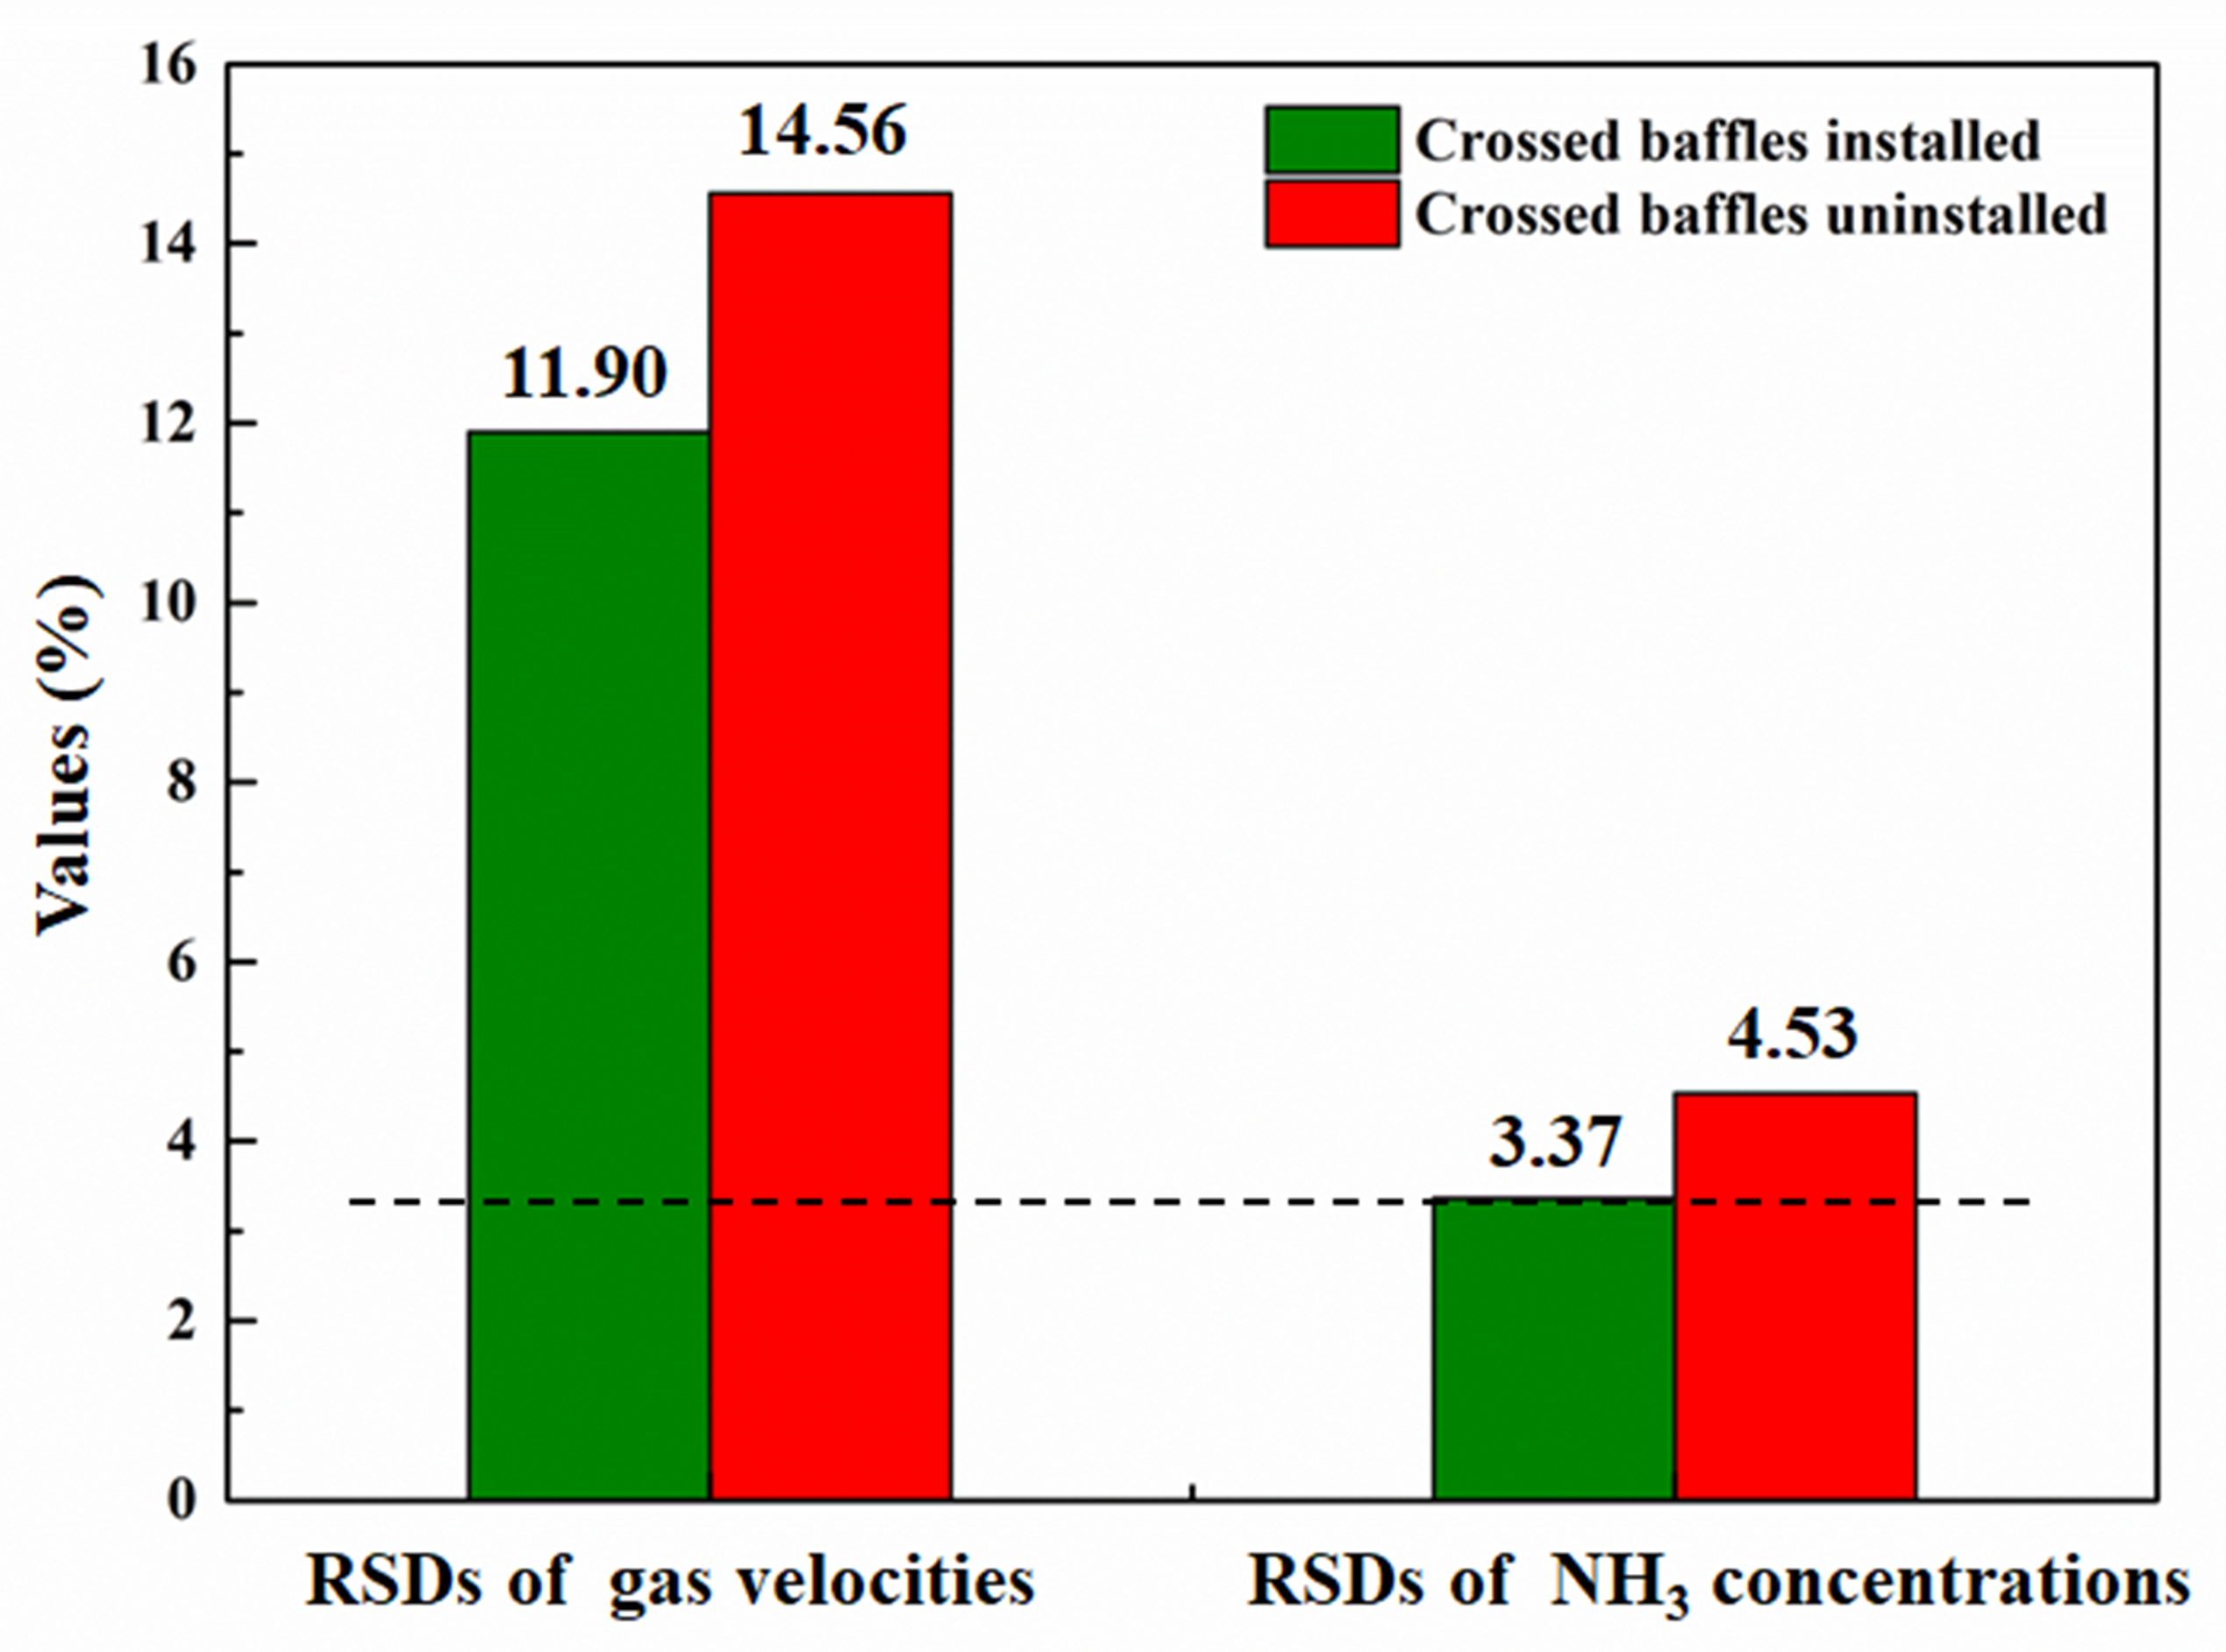
Comparisons were made to evaluate the effect of the crossed baffles.
Figure 12 illustrates the influence of the crossed baffles on gas velocities and NH
3 concentration. After installing the crossed baffles shown in
Figure 7 and
Figure 8, the RSDs of gas velocity and NH
3 concentration decreased by 18.2% and 25.6%, respectively. It is revealed that the crossed baffles are helpful in regulating the flow field. Moreover, when optimizing the tower type SCR-deNO
x facility with spatial constraints, regulating the flow field at the AIG may provide an effective way to achieve a more homogeneous distribution at the entrance of catalyst layers.
In addition, in order to control pressure loss, all of the small-sized baffles were installed at the upstream side of the facility. Simulation results showed that the total pressure loss for the optimal design was 330.61 Pa, which is less than the requirement of 400 Pa.
Table 1 summarizes the statistic indices of the tower type SCR-deNO
x facility before and after the optimal design. According to
Table 1, the RSDs of gas velocity and NH
3 concentration decreased by 18.30 and 5.50 percentage points, respectively. It is indicated that the flow field inside the SCR facility is regulated remarkably after the optimal design. The maximum velocity at the observation plane decreased by 6.83 m/s, which would greatly reduce the risk of catalyst breakage. Additionally, the existence of the optimal baffles provides an extra pressure loss of 195.44 Pa.
Table 2 and
Table 3 show the measured values of air velocity and CO
2 concentration for the FMT experiments. According to
Table 2, the RSD of air velocity is 11.24% and the maximum velocity is 4.76 m/s. FMT results show that the lower velocity areas are located in the upper edge and the bottom edge. Meanwhile, the air flow runs faster at the left half (A–D) of the plane.
Table 3 gives a decent concentration distribution. The RSD of CO
2 concentration is 4.98%.
Comparisons are made between the results of CFD simulations and FMT experiments.
Table 4 shows the corresponding statistic indices. According to
Table 4, both the CFD simulations and FMT experiments achieve the design requirements and perform homogeneous distributions of velocity and concentration. Most of the statistic indices between CFD simulations and FMT experiments are at the same level. For the gas/air velocity distributions, the RSDs are quite close and the difference is only 0.66 percentage points. The deviations of velocities and concentrations may be attributed to detection accuracy and installation accuracy. For instance, the detection spots are unable to cover the whole plane in the FMT and deviations may appear between the actual installation and the optimal design of baffles geometry. For total pressure loss,
Table 4 shows a relatively large deviation of 79.61 Pa. It is plausible to treat this as a result of the deviations of velocities. From
Figure 9 and
Figure 11 and
Table 2 and
Table 3, it is indicated that the distribution tendencies of gas/air velocity and NH
3/CO
2 concentration are similar.
In general, it is revealed that the FMT results are basically consistent with the CFD results, indicating that the optimal design is effective for the tower type SCR-deNOx facility with spatial constraints.
The tower type SCR-deNOx facility is quite different from the traditional π type one. To implement the flow regulation, it is recommended to use small-sized baffles and to install the baffles geometry at the upstream side of the facility. It has the advantages of controlling the pressure loss and the consumption of steel plate. Furthermore, regulating the flow field at the AIG is proven to be an effective way to deal with spatial constraints. It can be applied to SCR-deNOx facilities that have compact configurations such as reconstructed facilities. Additionally, it helps to determine the non-uniformed NH3 injection strategy and to achieve a more homogeneous distribution of gas velocity and NH3 concentration. This paper presents not only the configuration of the baffles geometry but also many specific indices and details during the optimization. It can provide a good reference for optimizing the tower type SCR-deNOx facility.


