Article

Hemodynamics and Wall Mechanics after Surgical Repair of Aortic Arch: Implication for Better Clinical Decisions

1
Department of Mechanical and Materials Engineering, University of Nebraska-Lincoln, Lincoln, NE 68588-0656, USA
2
Department of Surgery, University of Nebraska Medical Center, Omaha, NE 68114, USA
*
Author to whom correspondence should be addressed.
Both authors contributed equally to this paper.
Appl. Sci. 2019, 9(4), 807; https://doi.org/10.3390/app9040807
Submission received: 19 January 2019 / Revised: 20 February 2019 / Accepted: 21 February 2019 / Published: 25 February 2019
(This article belongs to the Section Applied Biosciences and Bioengineering)

Abstract

:
Graft repair of aortic coarctation is commonly used to mimic the physiological aortic arch shape and function. Various graft materials and shapes have been adopted for the surgery. The goal of this work is to quantitatively assess the impact of graft materials and shapes in the hemodynamics and wall mechanics of the restored aortic arch and its correlation with clinical outcomes. A three-dimensional aortic arch model was reconstructed from magnetic resonance images. The fluid–structure interaction (FSI) analysis was performed to characterize the hemodynamics and solid wall mechanics of the repaired aortic arch. Two graft shapes (i.e., a half-moon shape and a crescent one) were considered. Material choices of the aortic arch repair included three commonly used graft materials (i.e., polytetrafluoroethylene (PTFE) synthetic graft, CorMatrix extracellular matrix, and pulmonary homograft) as well as one native tissue serving as a control. The pathological hemodynamic parameters, in terms of the percentage area of low wall shear stress (WSS), high oscillatory shear index (OSI), and high relative residence time (RRT), were quantified to be associated with potential clinical outcomes. Results have shown that the peak von Mises stress for the aortic arch repaired by the crescent graft was 76% less than that of the half-moon graft. Flow disturbance and recirculation were also minimized with the crescent graft. Moreover, pathological hemodynamic parameters were significantly reduced with the crescent graft. The graft material mismatch with the surrounding tissue aggregated the stress concentration on the aortic wall, but had minimal impact on flow dynamics. The present work demonstrated the role and importance of the graft geometry and materials on hemodynamics and wall mechanics, which could guide optimal graft decisions towards better clinical outcomes.

1. Introduction

Aortic coarctation (CoA) (i.e., a narrowing in the aorta) is one of the common congenital heart defects [1]. Its severity is associated with an elevated pressure gradient and blood velocity [2]. Common treatment techniques adopted by cardiothoracic surgeons include end-to-end anastomosis, balloon angioplasty and graft repair [3]. Specifically, the graft repair is preferred for diffuse arch hypoplasia [4]. A clinical study of patients demonstrated the efficacy of graft repair [5]. The major complications include recoarctation and aneurysms at the graft site. These complications are well acknowledged to be associated with altered biomechanical environments (i.e., hemodynamics and solid wall mechanics at the graft zone) [6]. A stiff Dacron graft, adopted in 1952, resulted in early and late complications following the repair by material mismatch [7]. A relatively soft polytetrafluoroethylene (PTFE) graft mitigates the material mismatch with the native tissue and exhibits a better clinical outcome [8,9]. The autologous graft, homograft, or heterograft further reduces the material mismatch with the native tissue. For example, the pulmonary artery homograft, compared with the PTFE, has a stiffness closer to the native tissue [10]. CorMatrix extracellular matrix, a heterograft made from the decellularized porcine small intestinal submucosa [11], is commonly used in aortic reconstruction due to its commercial availability.
Regardless of the diminished variation between graft materials and native tissue, the surgical repair of the aortic arch is still suboptimal in terms of late complications such as recoarctation [12]. The geometric feature may significantly affect the blood flow dynamics [13]. Specifically, the aortic arch shape (i.e., the arch angle, curvature, and cross section dimensions) has been associated with a disturbed flow [14], which in turn causes late aortic remodeling [15]. It has been shown that flow disturbance and recirculation contributes to endothelial dysfunction, localization of atherosclerosis, and arterial thickening by upregulating endothelial cell genes, leukocyte adhesion, permeability, and so on [16,17]. From the perspective of mechanics, the graft geometry that deviates from the native arch causes suboptimal hemodynamics immediately after the surgical repair, and thus results in early and late clinical complications. However, there is scant data on the role of graft shapes on the reconstructed mechanical environments of the aortic arch. In addition, the documented clinical studies of aortic arch repair generally ignore the specification or description of graft shapes [18]. The graft shape adopted by our clinical coauthors was considered as the baseline of this work. It looked like a half-moon from its anterior view, and therefore it was referred to as the half-moon shaped graft.
The goal of this work was to quantitatively depict the underlying mechanism of aortic arch repair. The impacts of graft shapes and materials on the hemodynamics and wall mechanics of the aortic arch following surgical repair were characterized. The three-dimensional aortic arch model was reconstructed from magnetic resonance images (MRIs). Three commonly used graft materials (i.e., PTFE, CorMatrix, and pulmonary homograft) were studied. A crescent graft was proposed to better resemble the curvature of the aortic arch in comparison to the half-moon shaped graft as illustrated in Figure 1. Both grafts were named by their anterior view. There were a total of five model configurations in terms of graft materials and shapes. Their roles in the hemodynamics and solid wall mechanics were quantified through numerical fluid–structure interaction (FSI) analysis. The wall shear stress (WSS), oscillatory shear index (OSI), relative residence time (RRT), and von Mises stress distributions on the aortic wall were obtained and compared among the five choices. These mechanical indices have been associated with clinical outcomes. Results were expected to provide a mechanistic understanding of the optimum surgical repair.

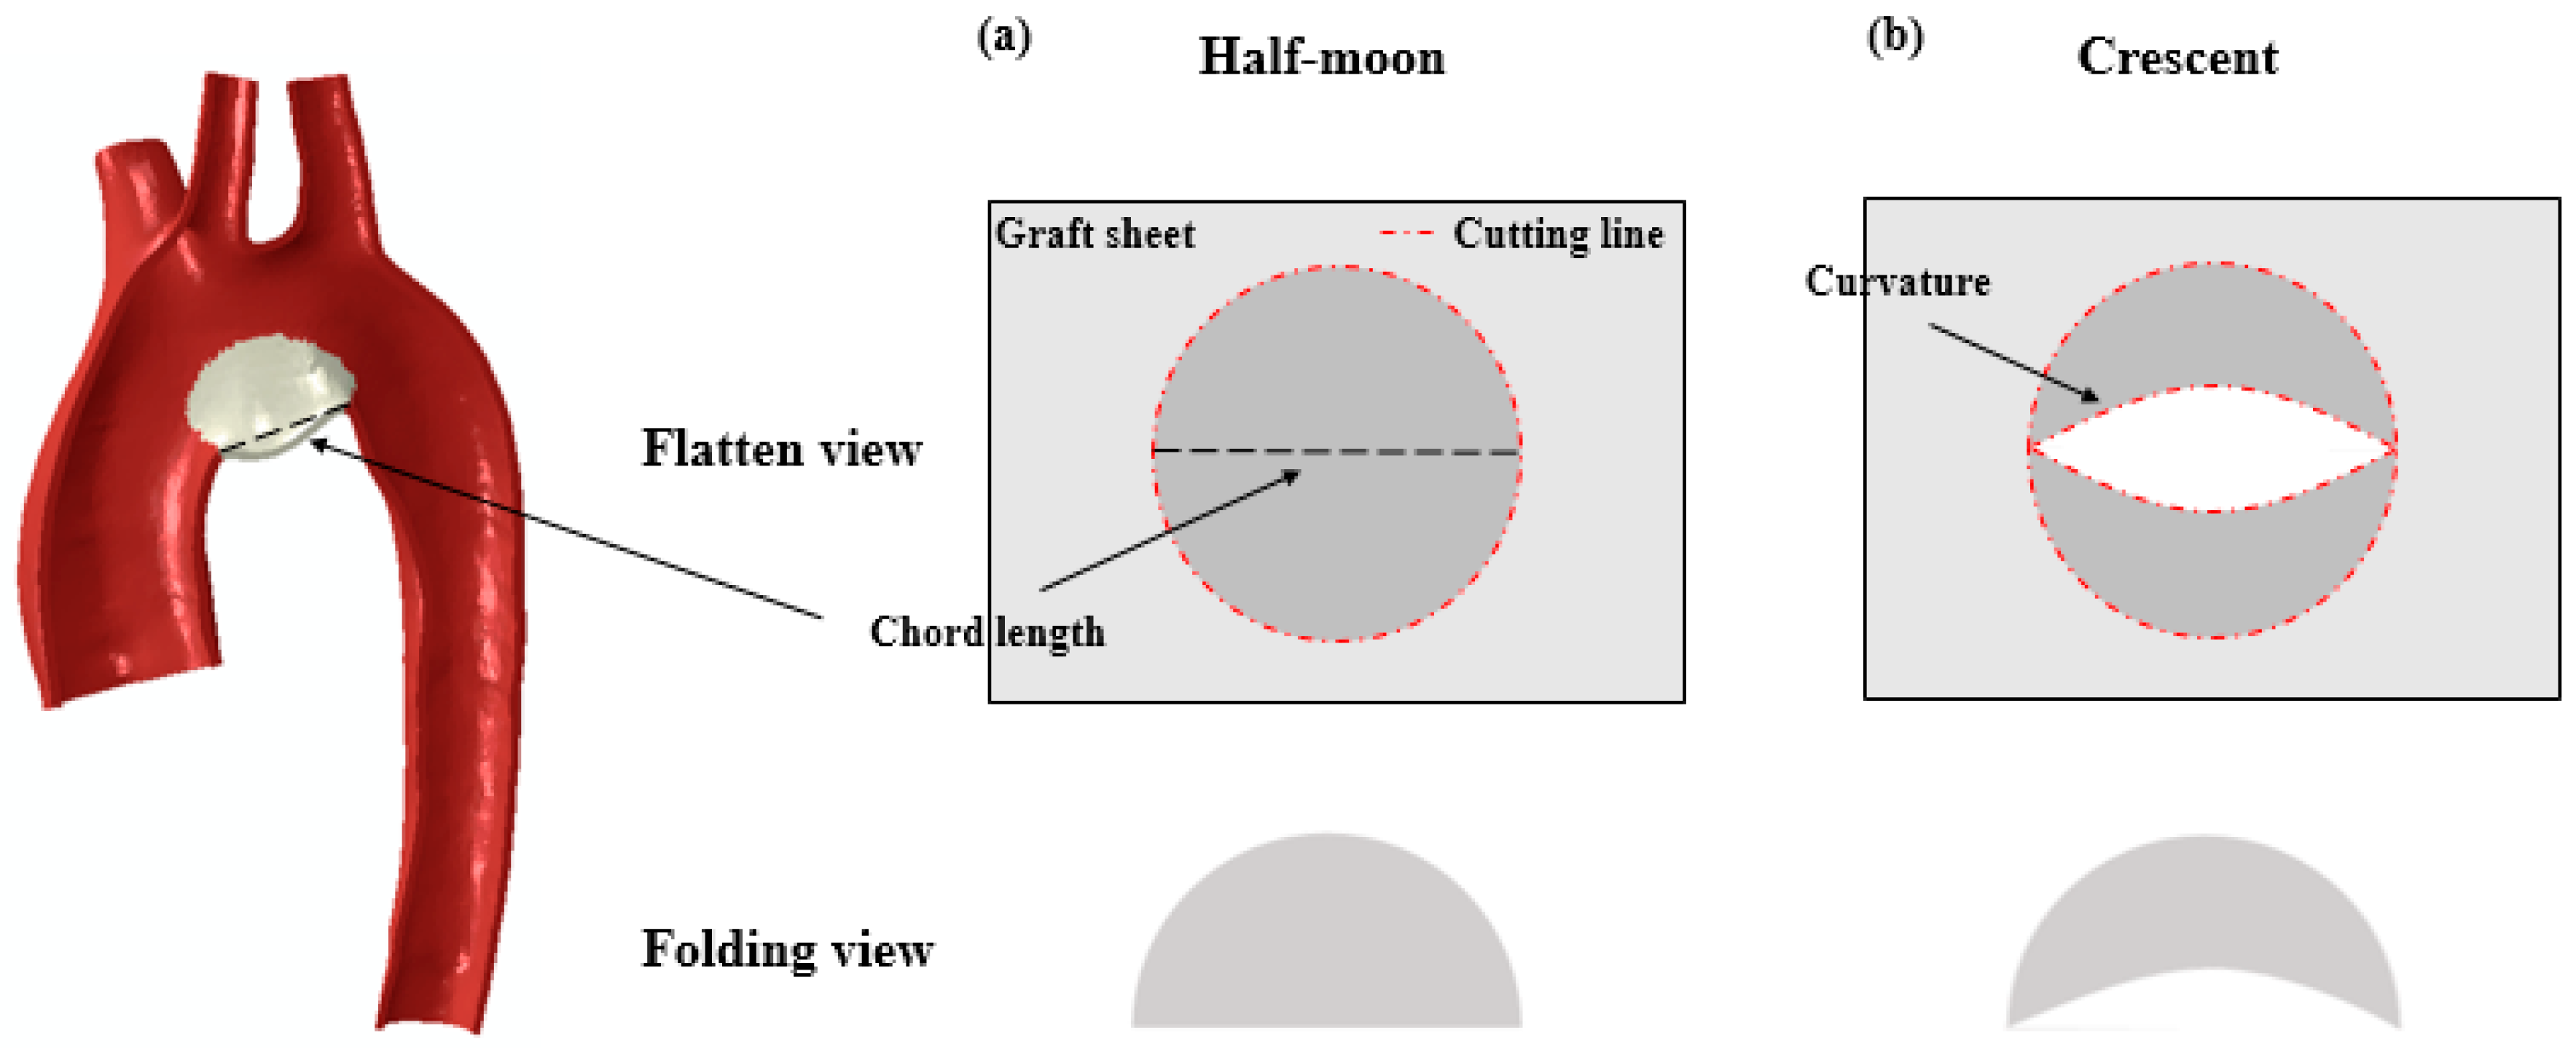
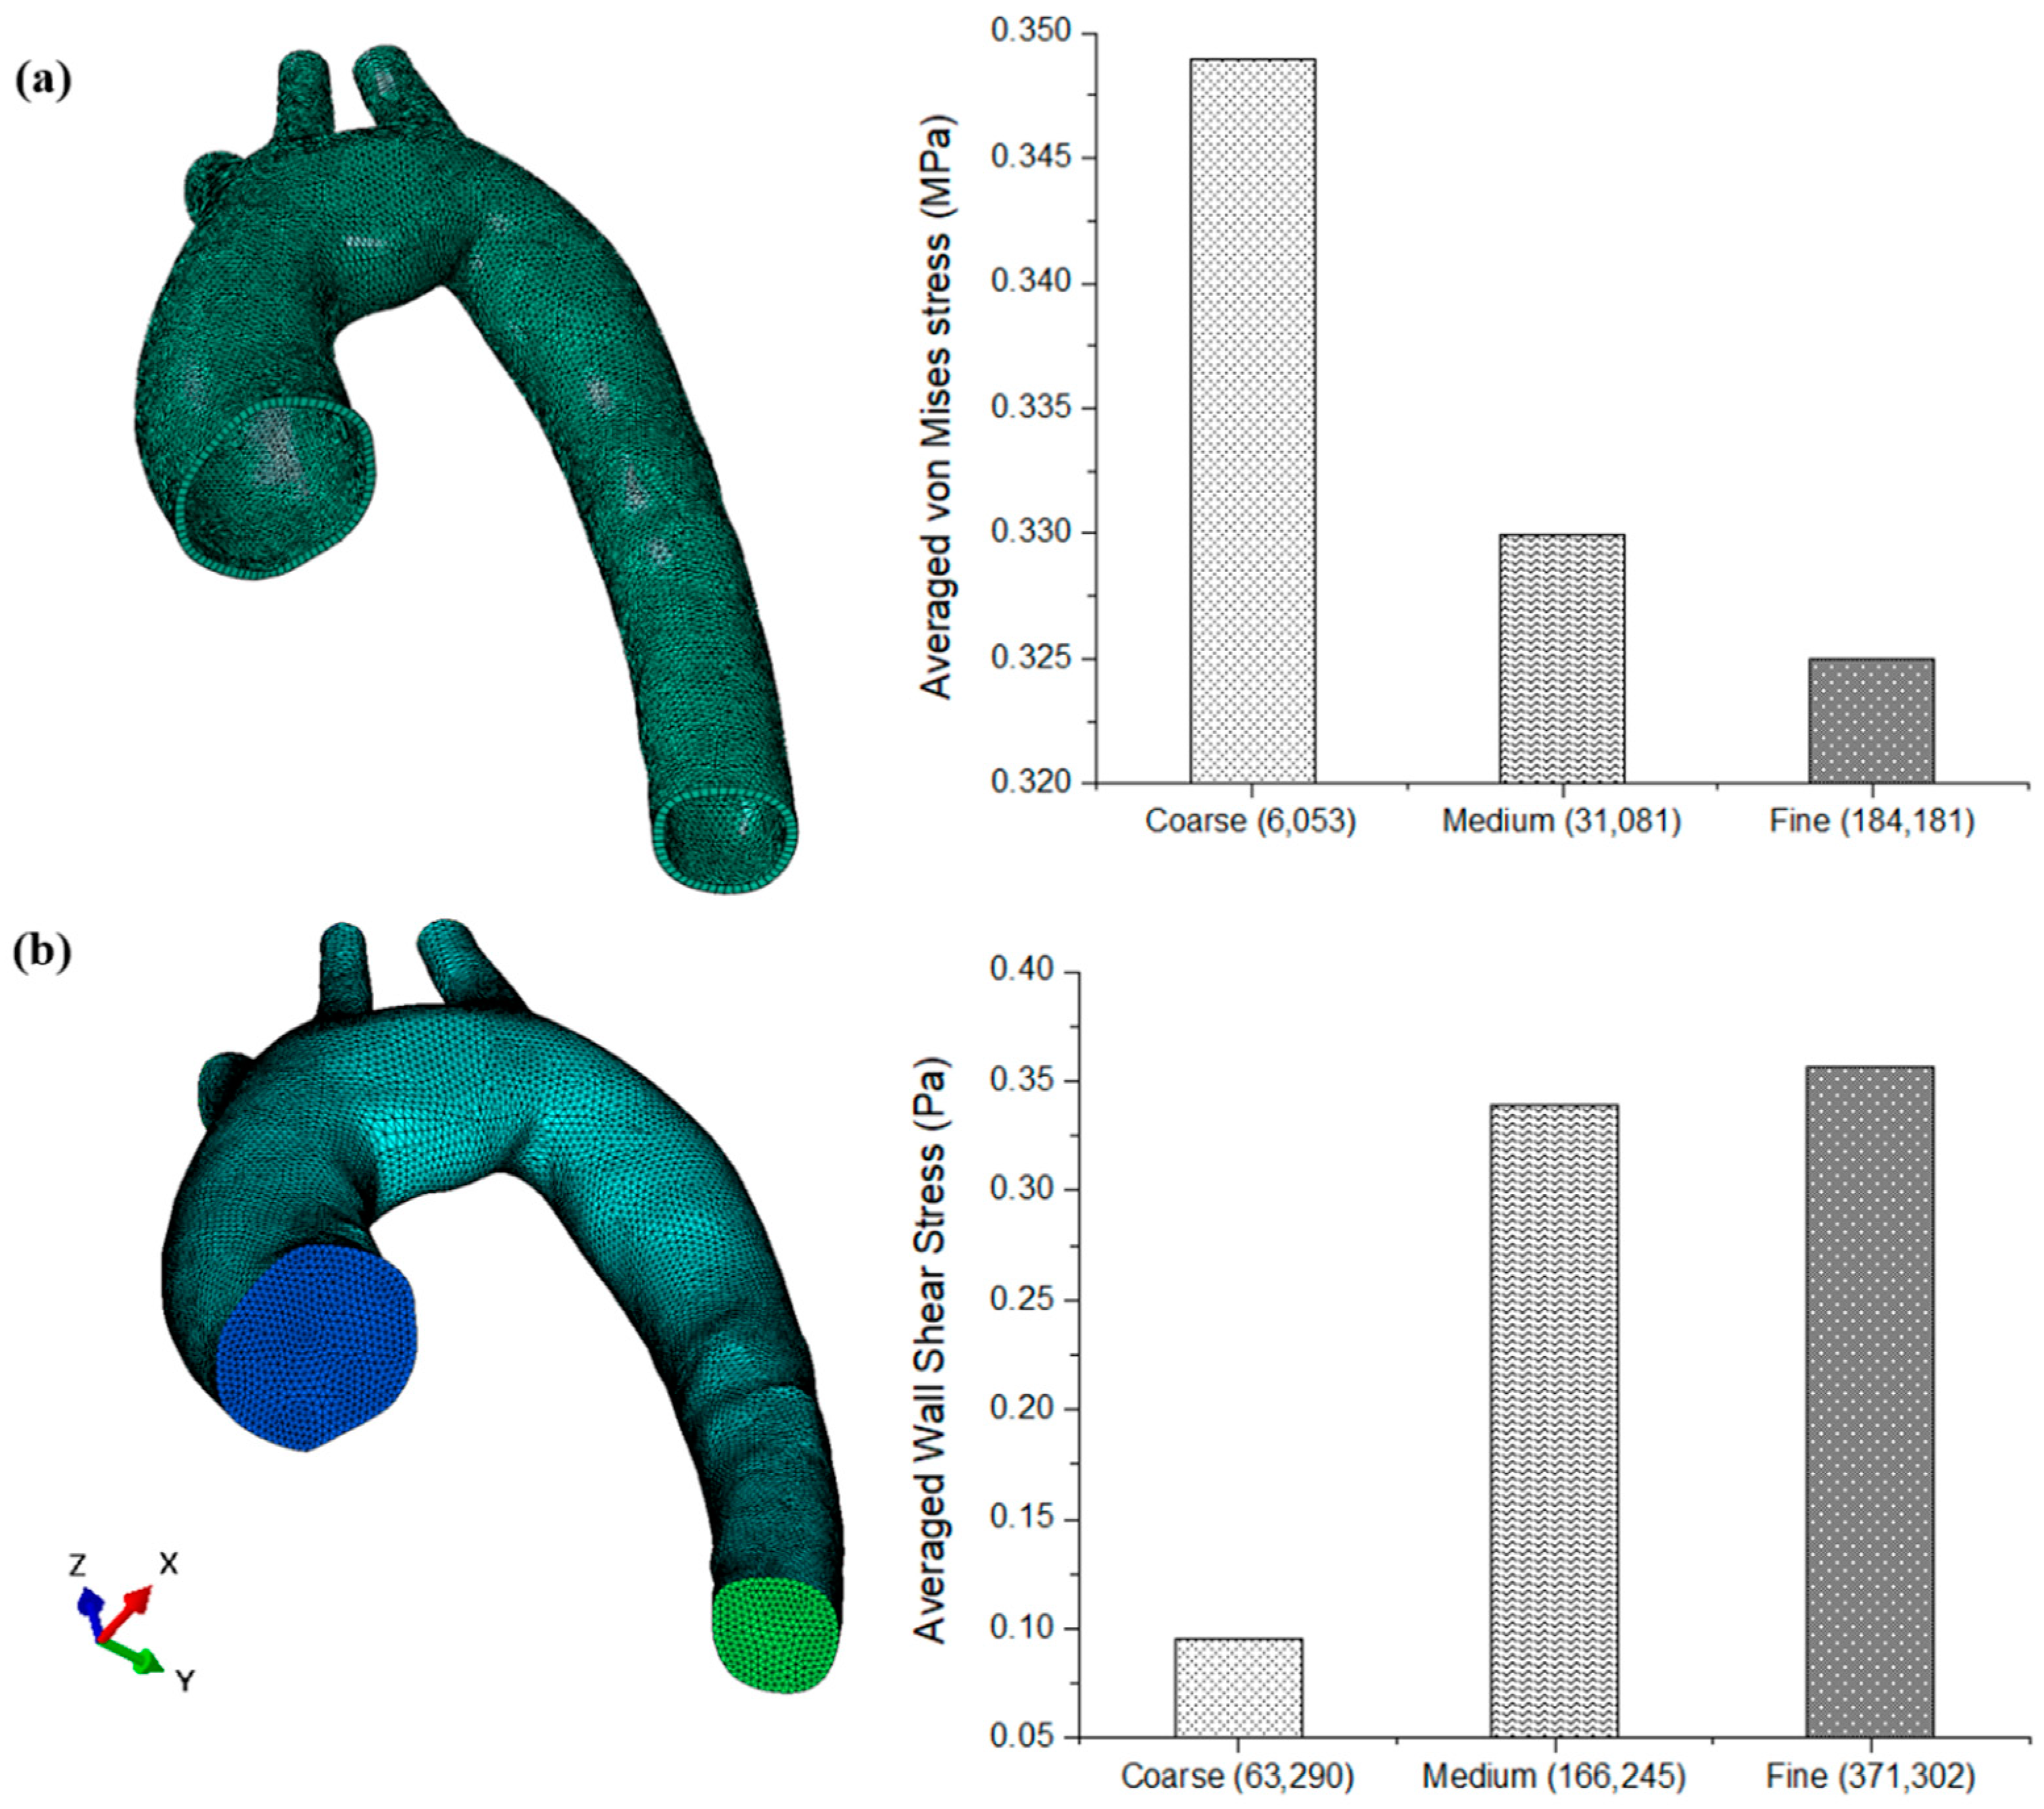
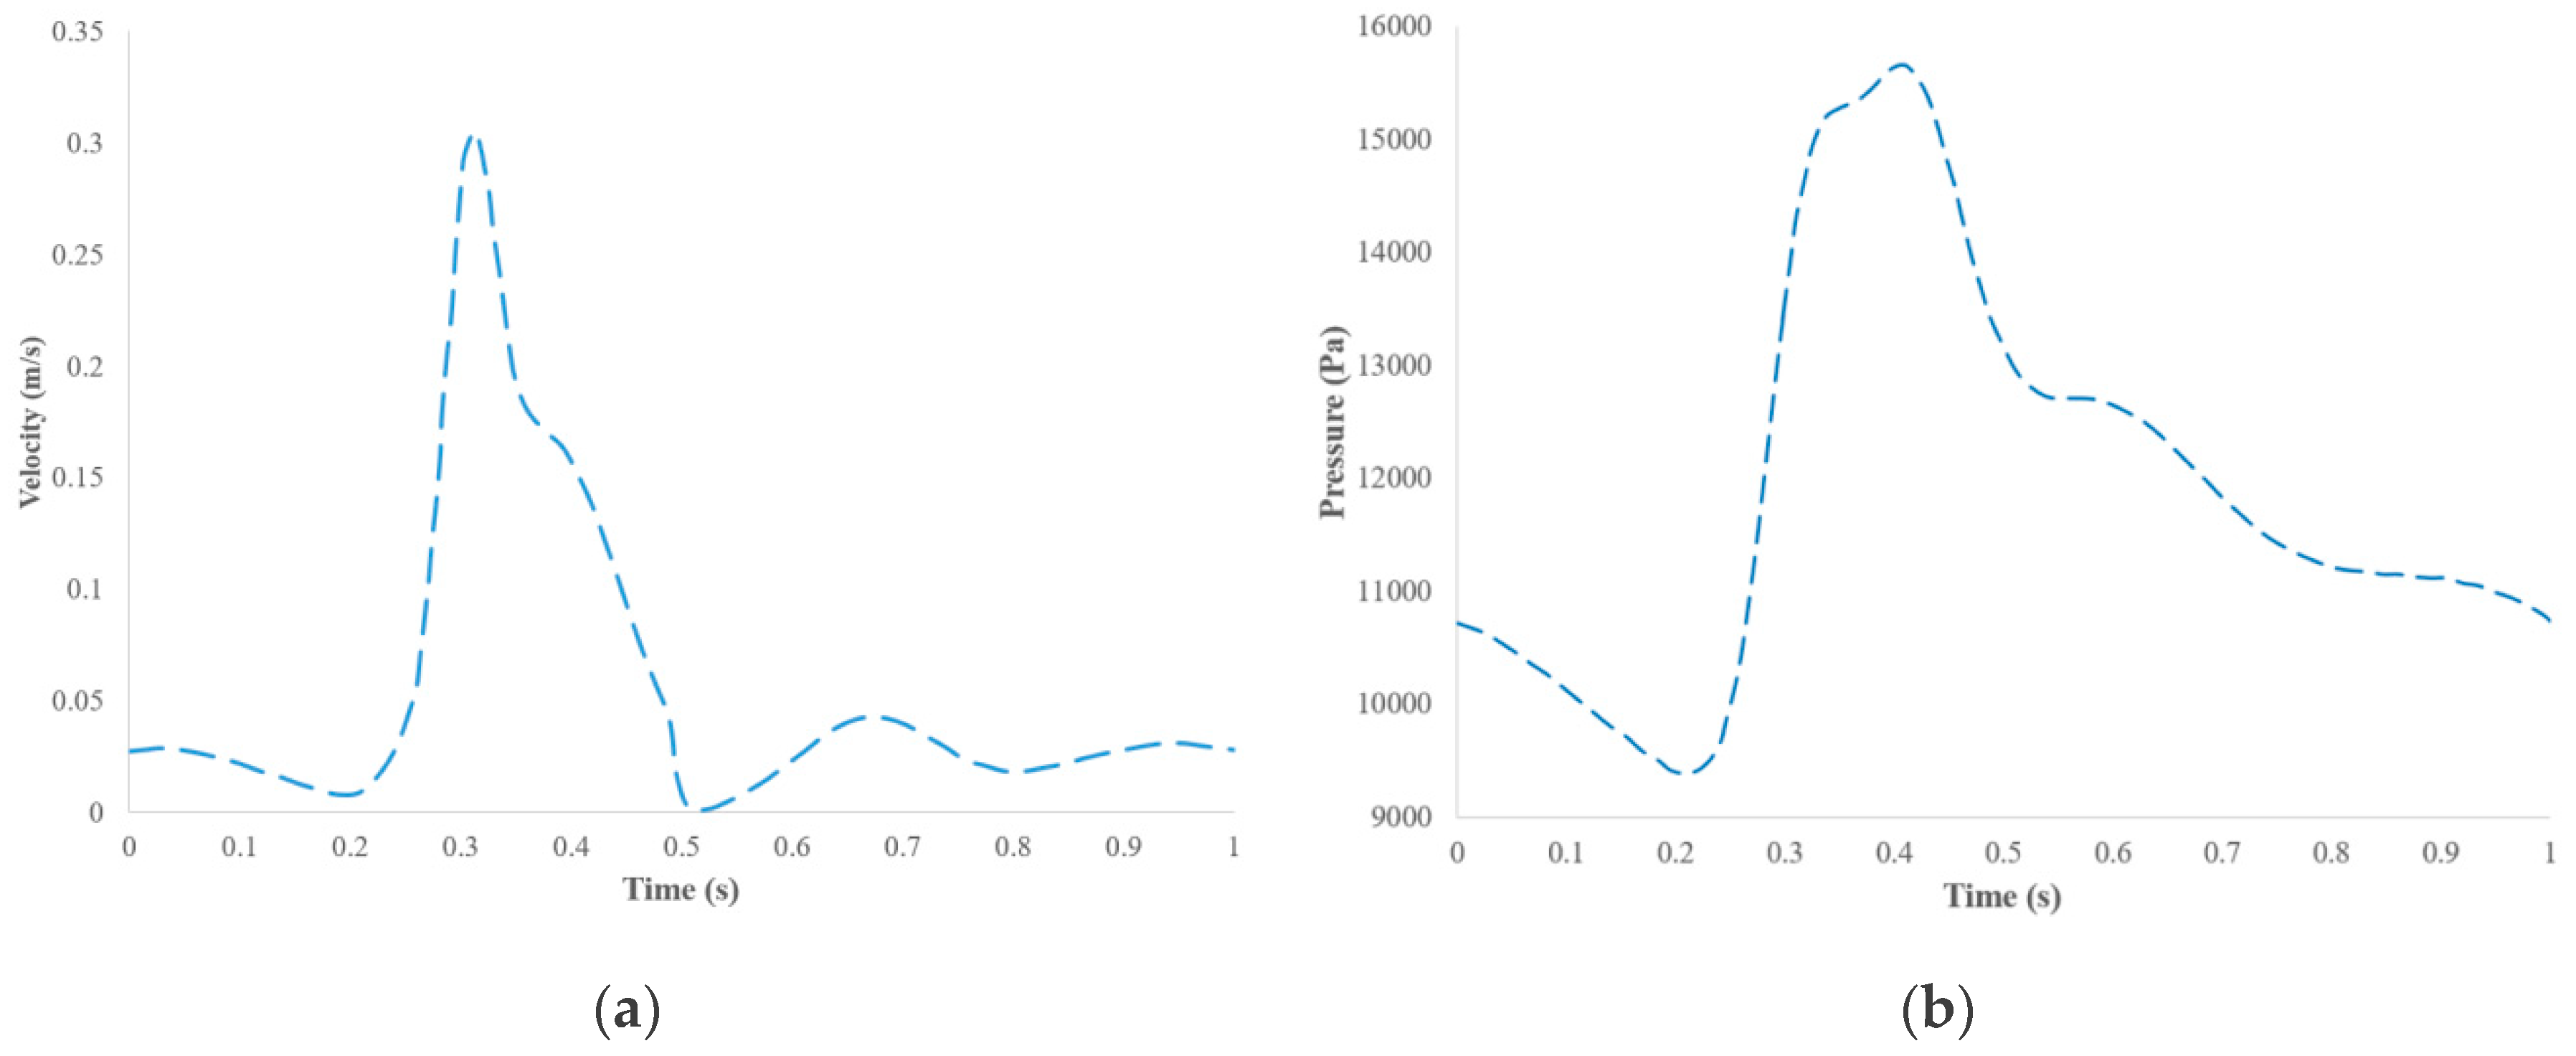
2. Materials and Methods

The three-dimensional models of the aortic arch repaired with two graft shapes (i.e., the half-moon and crescent) are illustrated in Figure 2. Both grafts were named by their anterior shape. The grafts were highlighted in a grey color. Models were reconstructed from MRIs using the commercial software package Mimics (Materialise, Belgium). The two graft shapes were constructed using Hypermesh software (Altair Engineering, Michigan, USA). The chord length of the aortic arch, measured from the echocardiography, was used to tailor the shape of both grafts. Figure 2a,b illustrate both graft shapes at a blood pressure of 80 mmHg. It is obvious that the crescent graft matched better with the native aortic arch. The centerline of the repaired aorta was used for anatomical measurements. The cross-section A-A′ represents the ascending aorta near the graft site, which was 38.27 mm away for the inlet along the centerline. The vertical cross-section B-B′, as shown in Figure 2c,d, was 55.76 mm away from the inlet. The centerline angle ( θ ) at plane B-B′ was measured between two tangential vectors a and b using ImageJ freeware [19]. The geometric quantifications are summarized in Table 1.
A mesh convergence study was performed for both the solid and fluid domain, as shown in Figure 3. The aortic wall, with a thickness of 2 mm [20], was meshed into 31,081 hybrid hexahedral elements (C3D8H). The aortic lumen (i.e., the blood domain) was meshed with 166,245 tetrahedral elements. Both grafts and aortas were assumed to be isotropic elastic materials and nearly incompressible (i.e., Poisson ratio of 0.45) [21,22]. The stiffness of the native aortic tissue was adopted as 0.84 MPa [23]. The stiffness values of the three graft materials (i.e., PTFE, CorMatrix, and pulmonary homograft) were 1000 MPa, 30 MPa and 3 MPa, respectively [24,25,26]. There were a total of five model configurations in terms of graft materials and shapes. For the material mismatch cases, the control configuration was the aorta with native tissue properties. For the shape effect, the control configuration was the crescent graft with a pulmonary homograft.
The Arbitrary Lagrangian–Eulerian (ALE) method was employed to capture the interaction between the aorta wall and blood flow [27]. The two-way coupled FSI numerical model was implemented using a commercial software Mpcci 4.5 (Fraunhofer SCAI, Germany) [28]. The passing parameters between fluid domain and solid domain were the boundary-relative force vector and nodal position (i.e., displacement) at the integration point of each element [29,30]. The neighborhood search technique (i.e., the closest element of a source mesh to each node of a target mesh) and the shape function mapping [28] were adopted for non-matching meshes between fluid and solid domains. The coupling was enforced at every 0.05 s. The Gauss–Seidel algorithm for the iterative coupling scheme between the solid and fluid domains was adopted. A partitioned approach was used to solve the governing equations sequentially.
The solid mechanics analysis was carried out through ABAQUS 2017 (Dassault Systèmes Simulia Corp., Providence, RI, USA). Solid mechanics of the arterial wall was governed by the dynamic equilibrium equation [31]:
f b = ρ a 2 u i t 2 σ i j x j
where σ i j , f b , ρ a , and u i are the stresses, the body force per unit volume, the arterial wall density and the deformation, respectively. Inlet and outlets were constrained in all degrees of freedom except for the radial direction. The traction-free boundary condition was employed on the external boundary of the aorta wall. Fluid dynamics analysis was carried out through FLUENT (ANSYS® Academic Research 17.2). The flow dynamics of the blood was governed by the mass and momentum conservation equations:
Mass : u i x i = 0
Momentum : ρ ( u i t + ( u j v j ) u i x j ) = x j ( μ ( u i x j + u j x i ) ) p x i
where, ρ , p ,   u j , and v j are the density, pressure, velocity and mesh velocity, respectively, and u j v j is the velocity relative to the moving mesh.
The blood was assumed as a Newtonian fluid with a density of 1060 kg/m3 and a dynamic viscosity of 0.0037 Pa·s. The Navier–Stokes equation was solved to obtain the blood flow field in the aortic arch. A no-slip boundary condition was applied at the wall. The pulsatile inlet velocity and outlet pressure for one cardiac cycle were adopted from an in vivo study [32] to replicate the physiological flow in a cardiac cycle, as shown in Figure 4. The peak inlet velocity occurred at 0.32 s of each cardiac cycle, and the peak outlet pressure occurred at 0.4 s. The corresponding cardiac output was 1.71 L/min, which agreed with the measurements by Calamandrei, et al. [33]. The diastolic pressure at approximately 80 mmHg was considered as the base pressure corresponding to the reconstructed model. The percentage of the mass flow rate was 70% at the descending aorta (i.e., Outlet 1) and 10% each at three supra-aortic arteries (i.e., Outlets 2, 3, and 4) [34].
Hemodynamic analysis included the time-averaged wall shear stress (TAWSS) over one cardiac cycle, the oscillatory shear index (OSI) over each cardiac cycle, and the relative residence time (RRT), as defined below:
T A W S S = 1 T 0 T w s s i d t
O S I = 1 2 ( 1 | 0 T w s s i d t | 0 T w s s i d t )
R R T ~ 1 T A W S S ( 1 2 O S I )
where T represents the time for one cardiac cycle.

3. Results

The FSI model of the aortic arch captured the blood flow dynamics and wall stress field simultaneously. The mechanical environment of the aortic arch altered by the graft shapes, as well as the PTFE, CorMatrix, and pulmonary grafts, was characterized in terms of WSS, OSI, RRT, and von Mises stress distributions on the aortic wall.

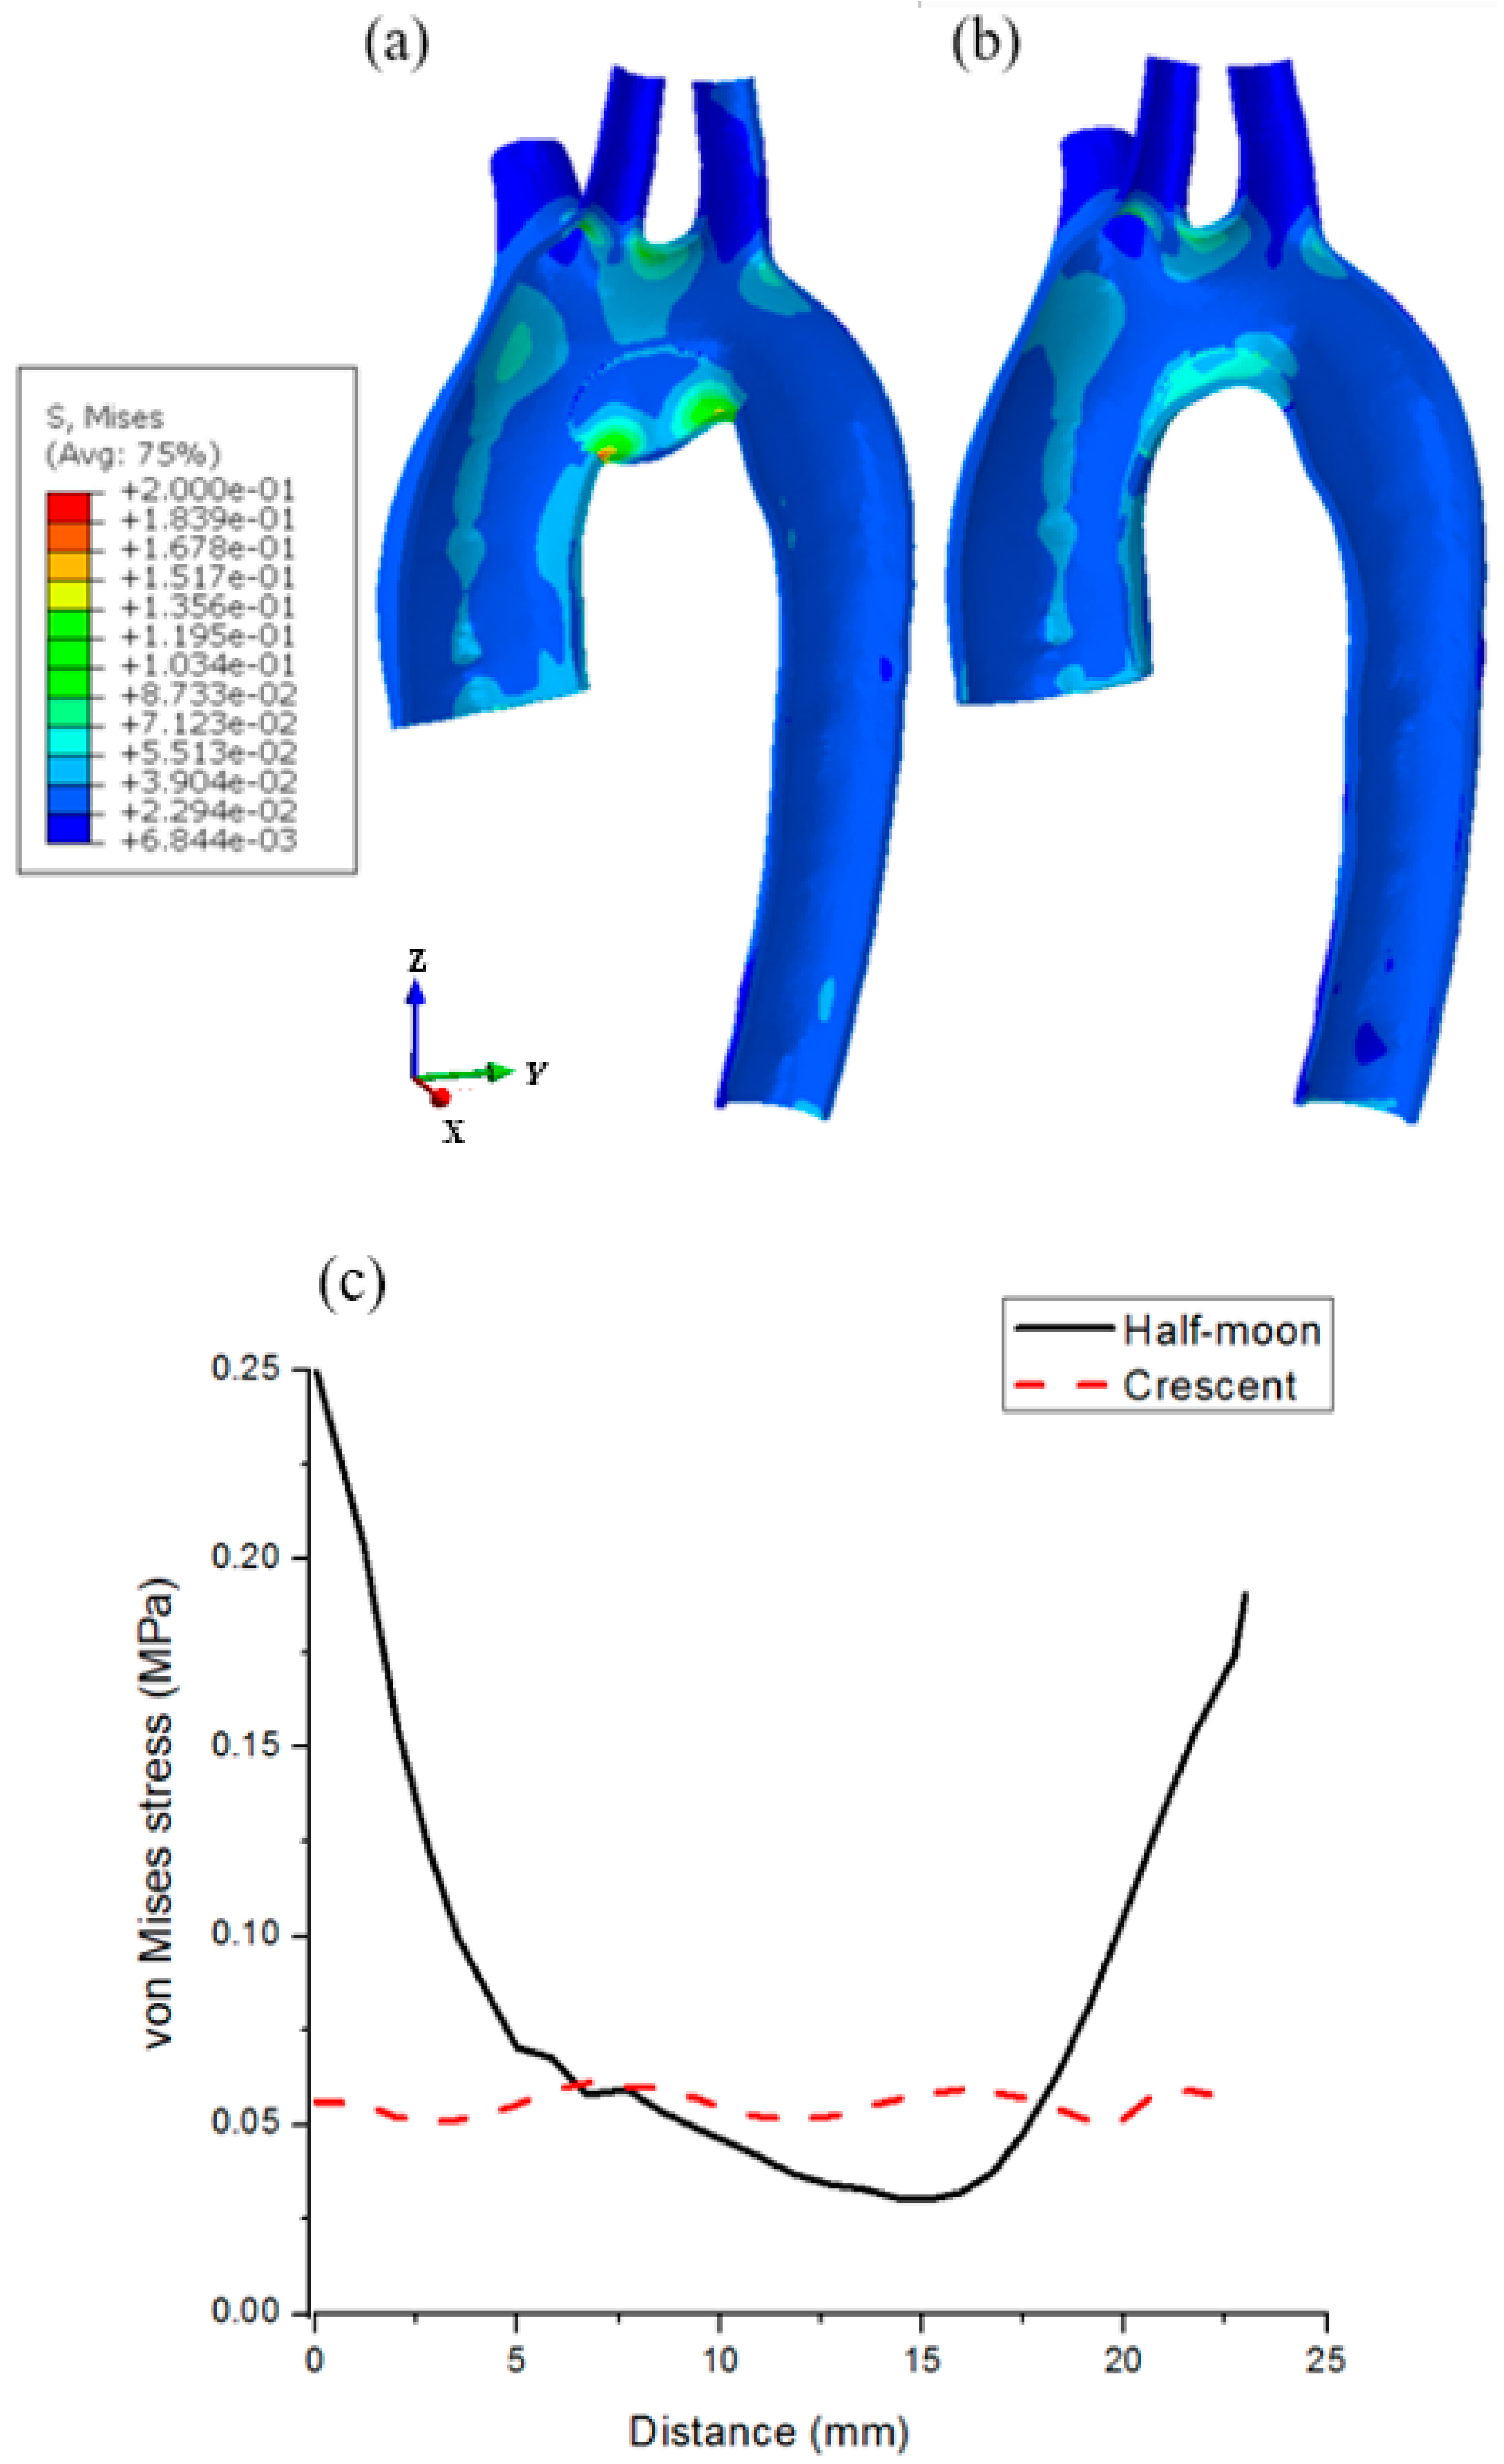
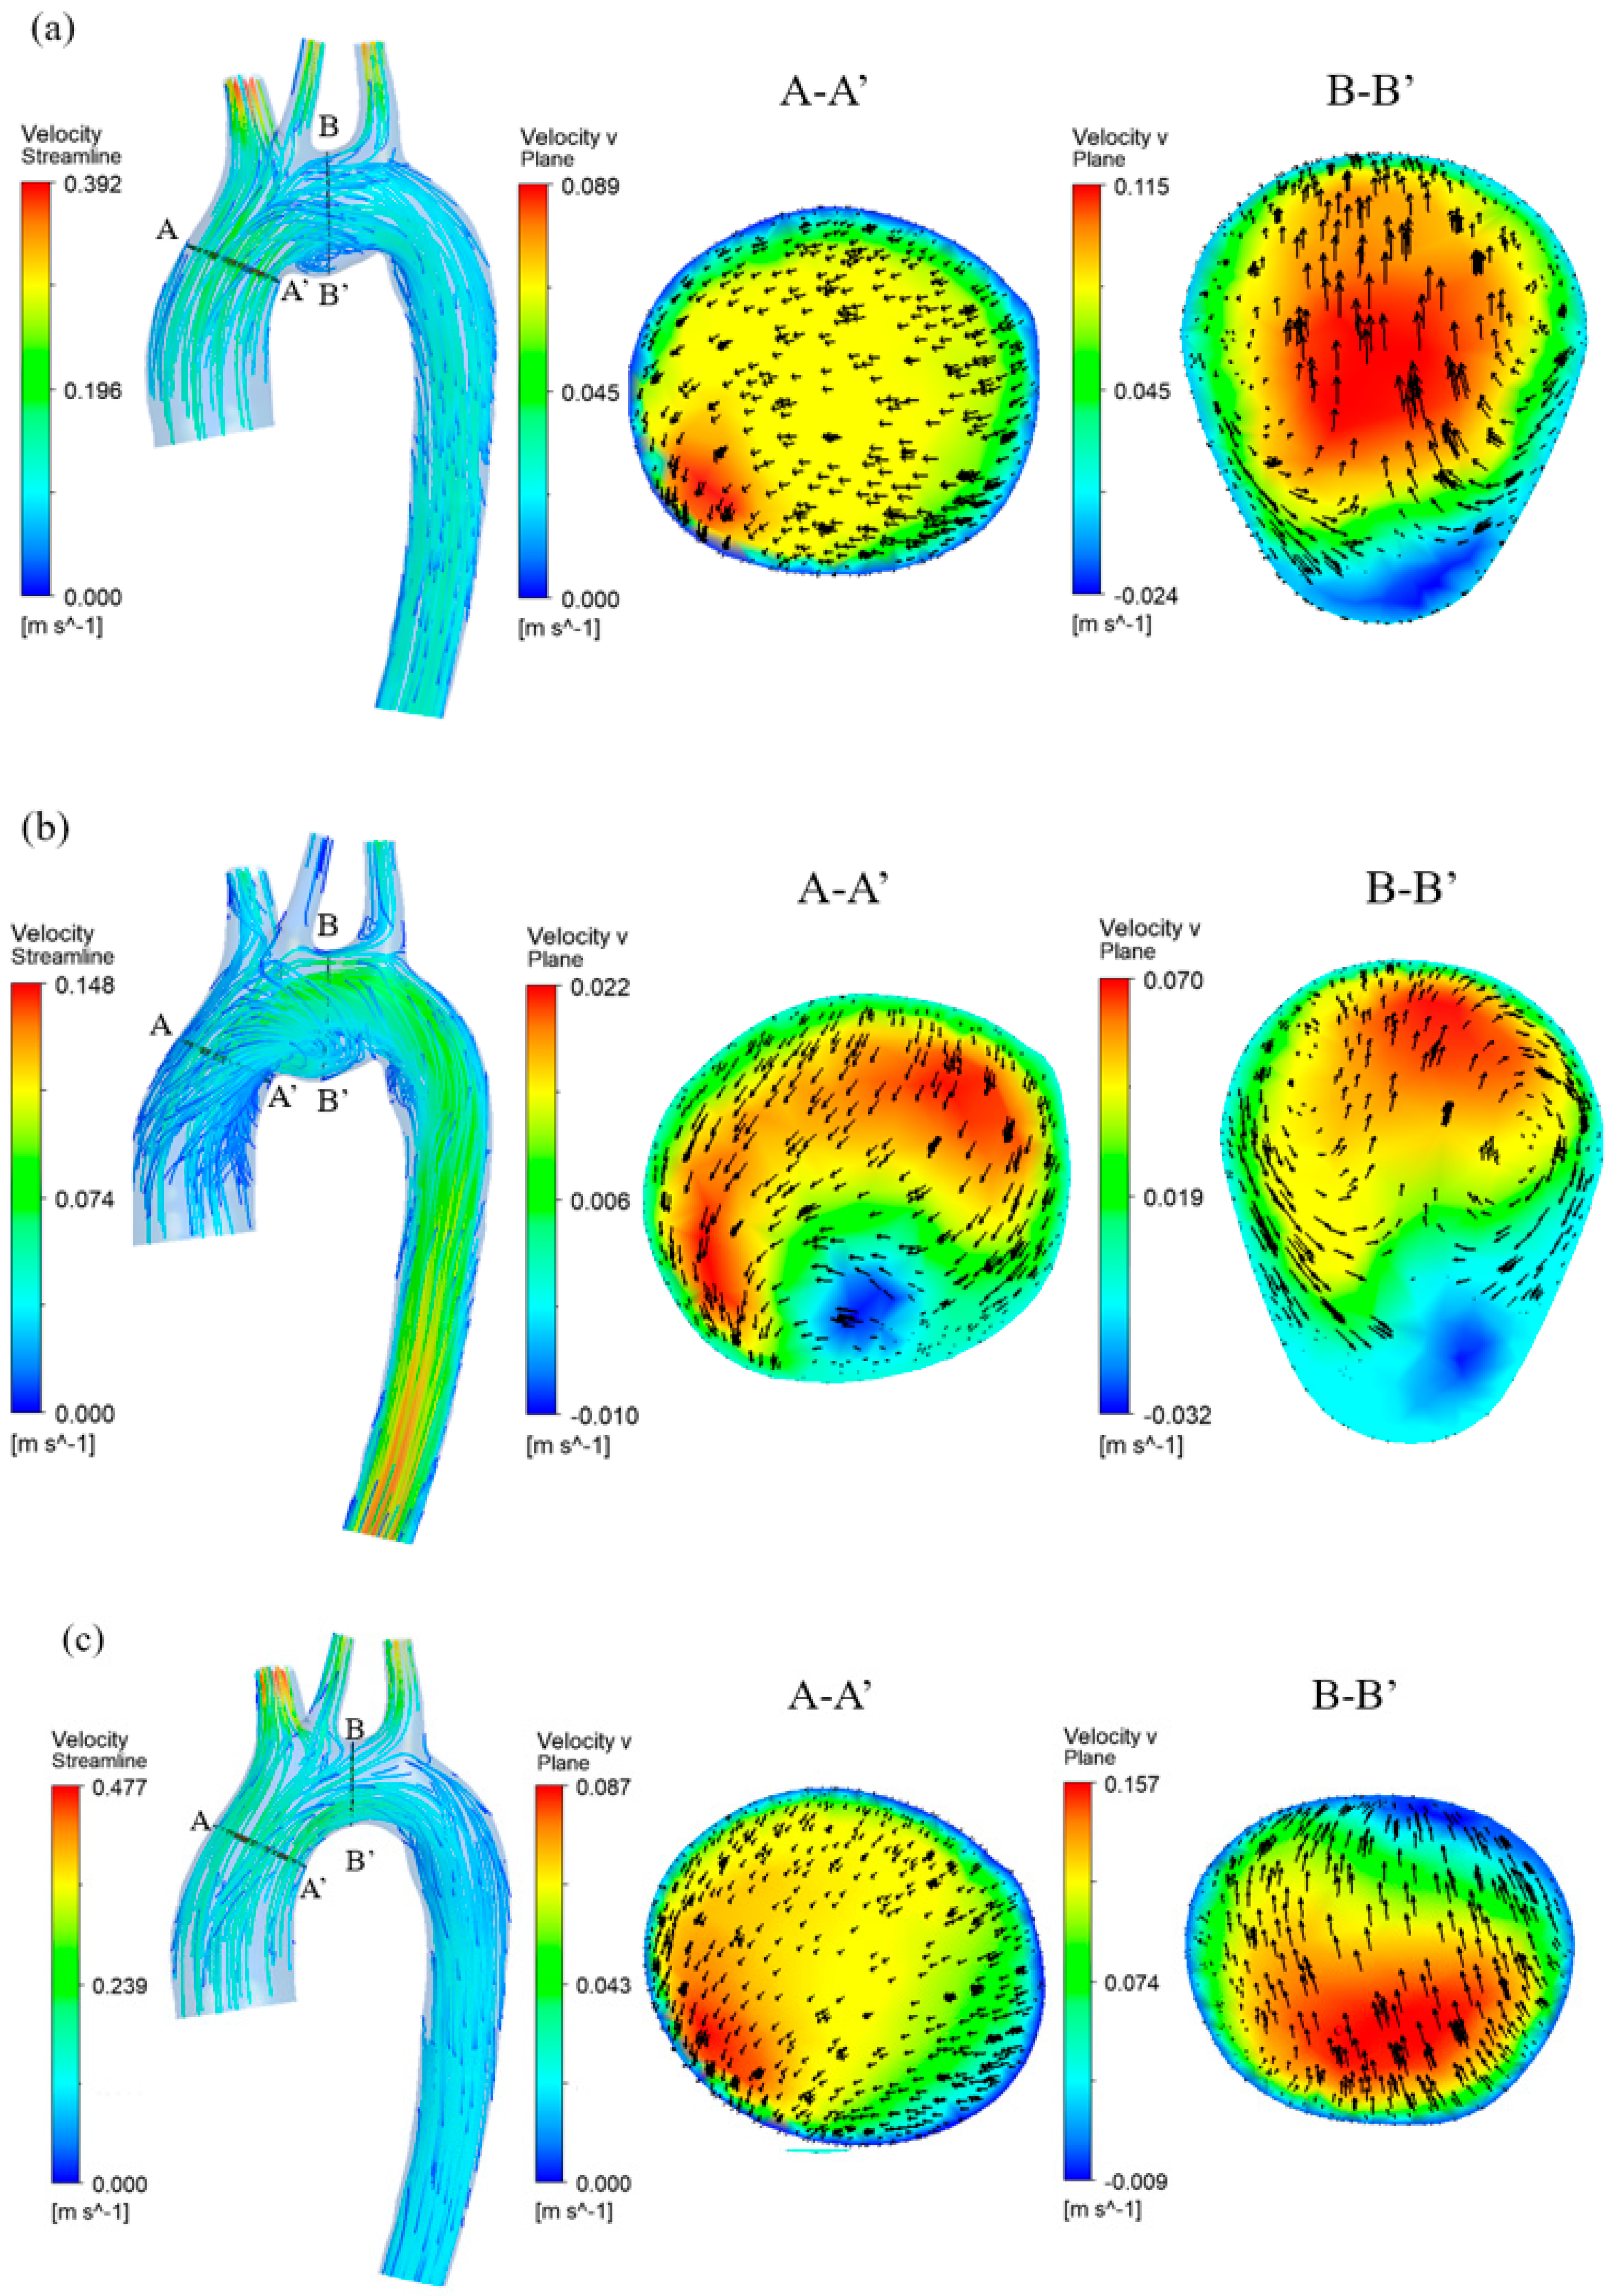
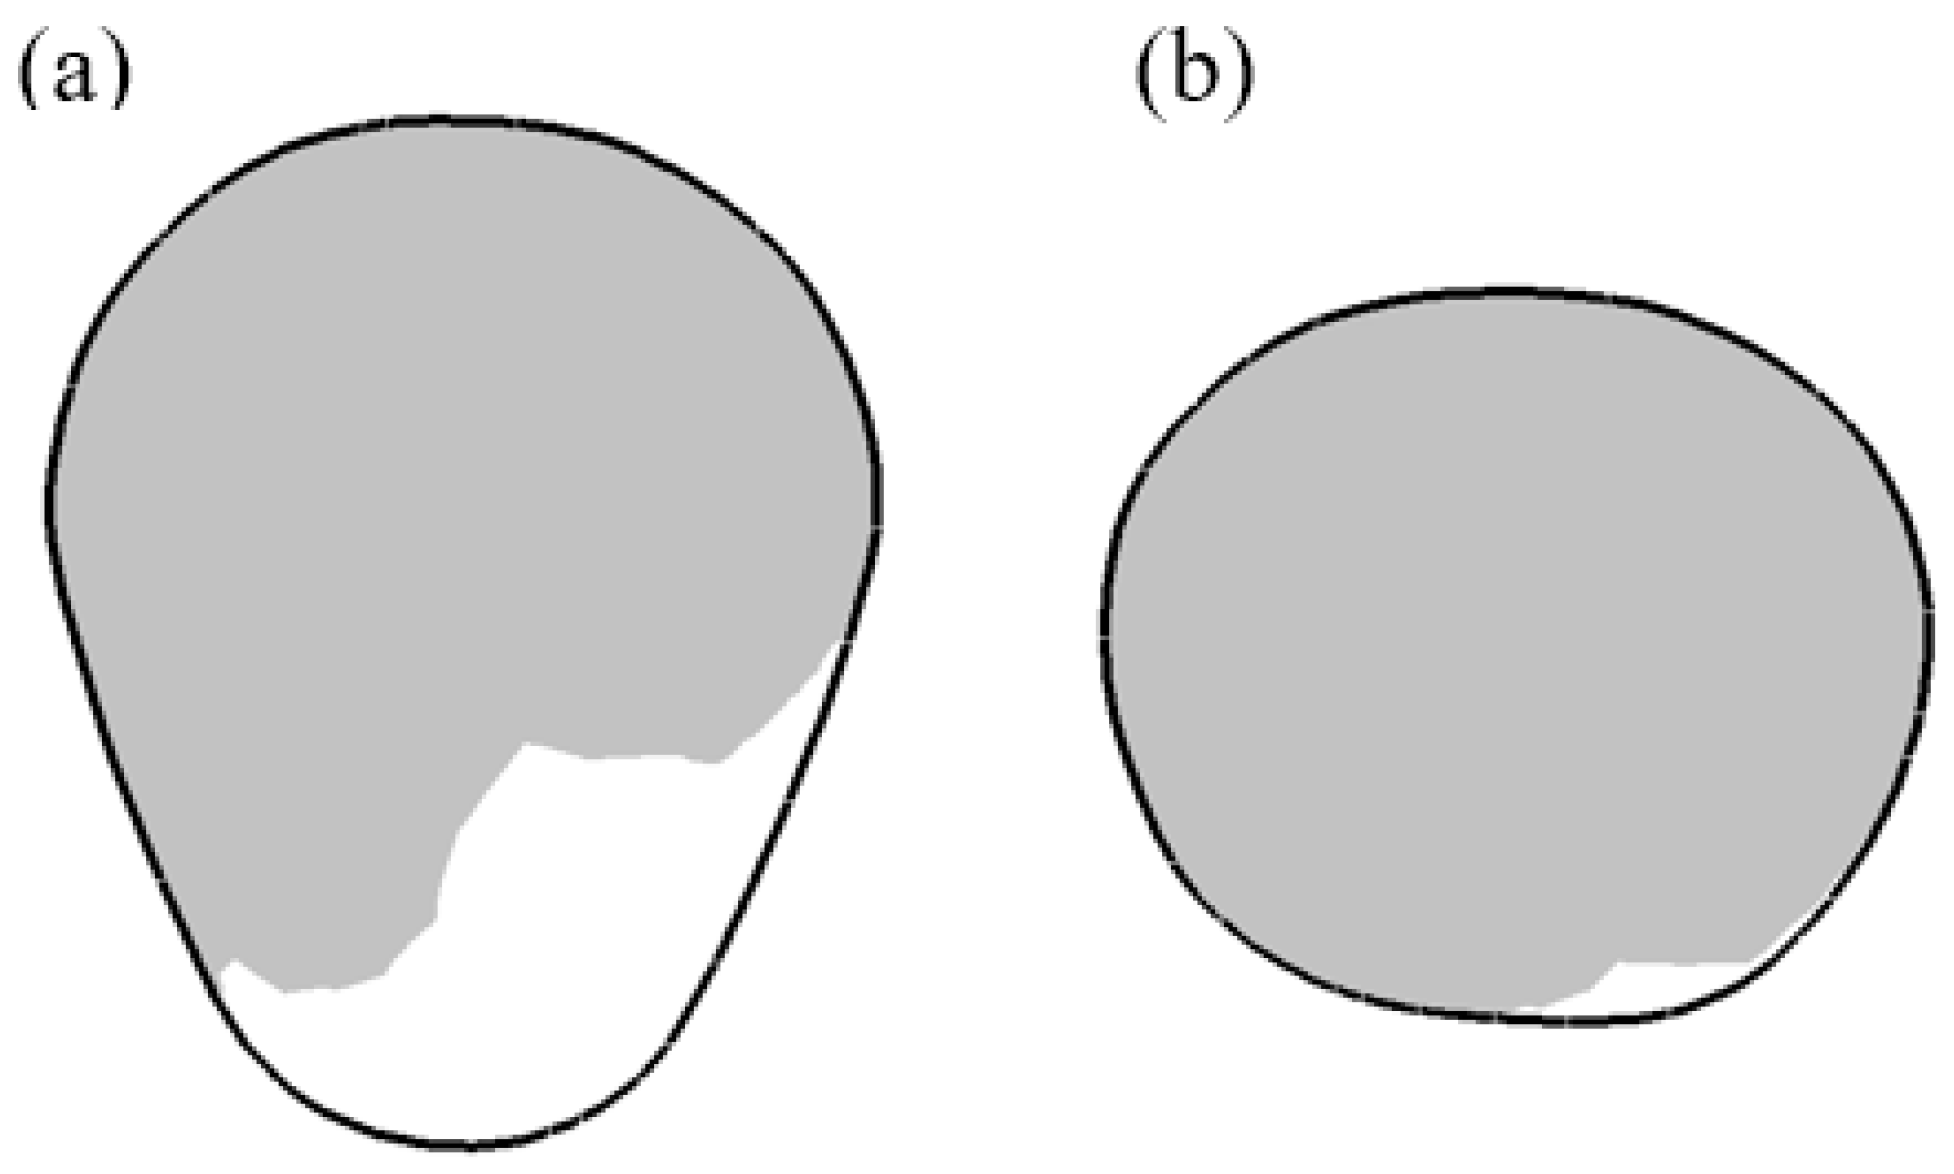
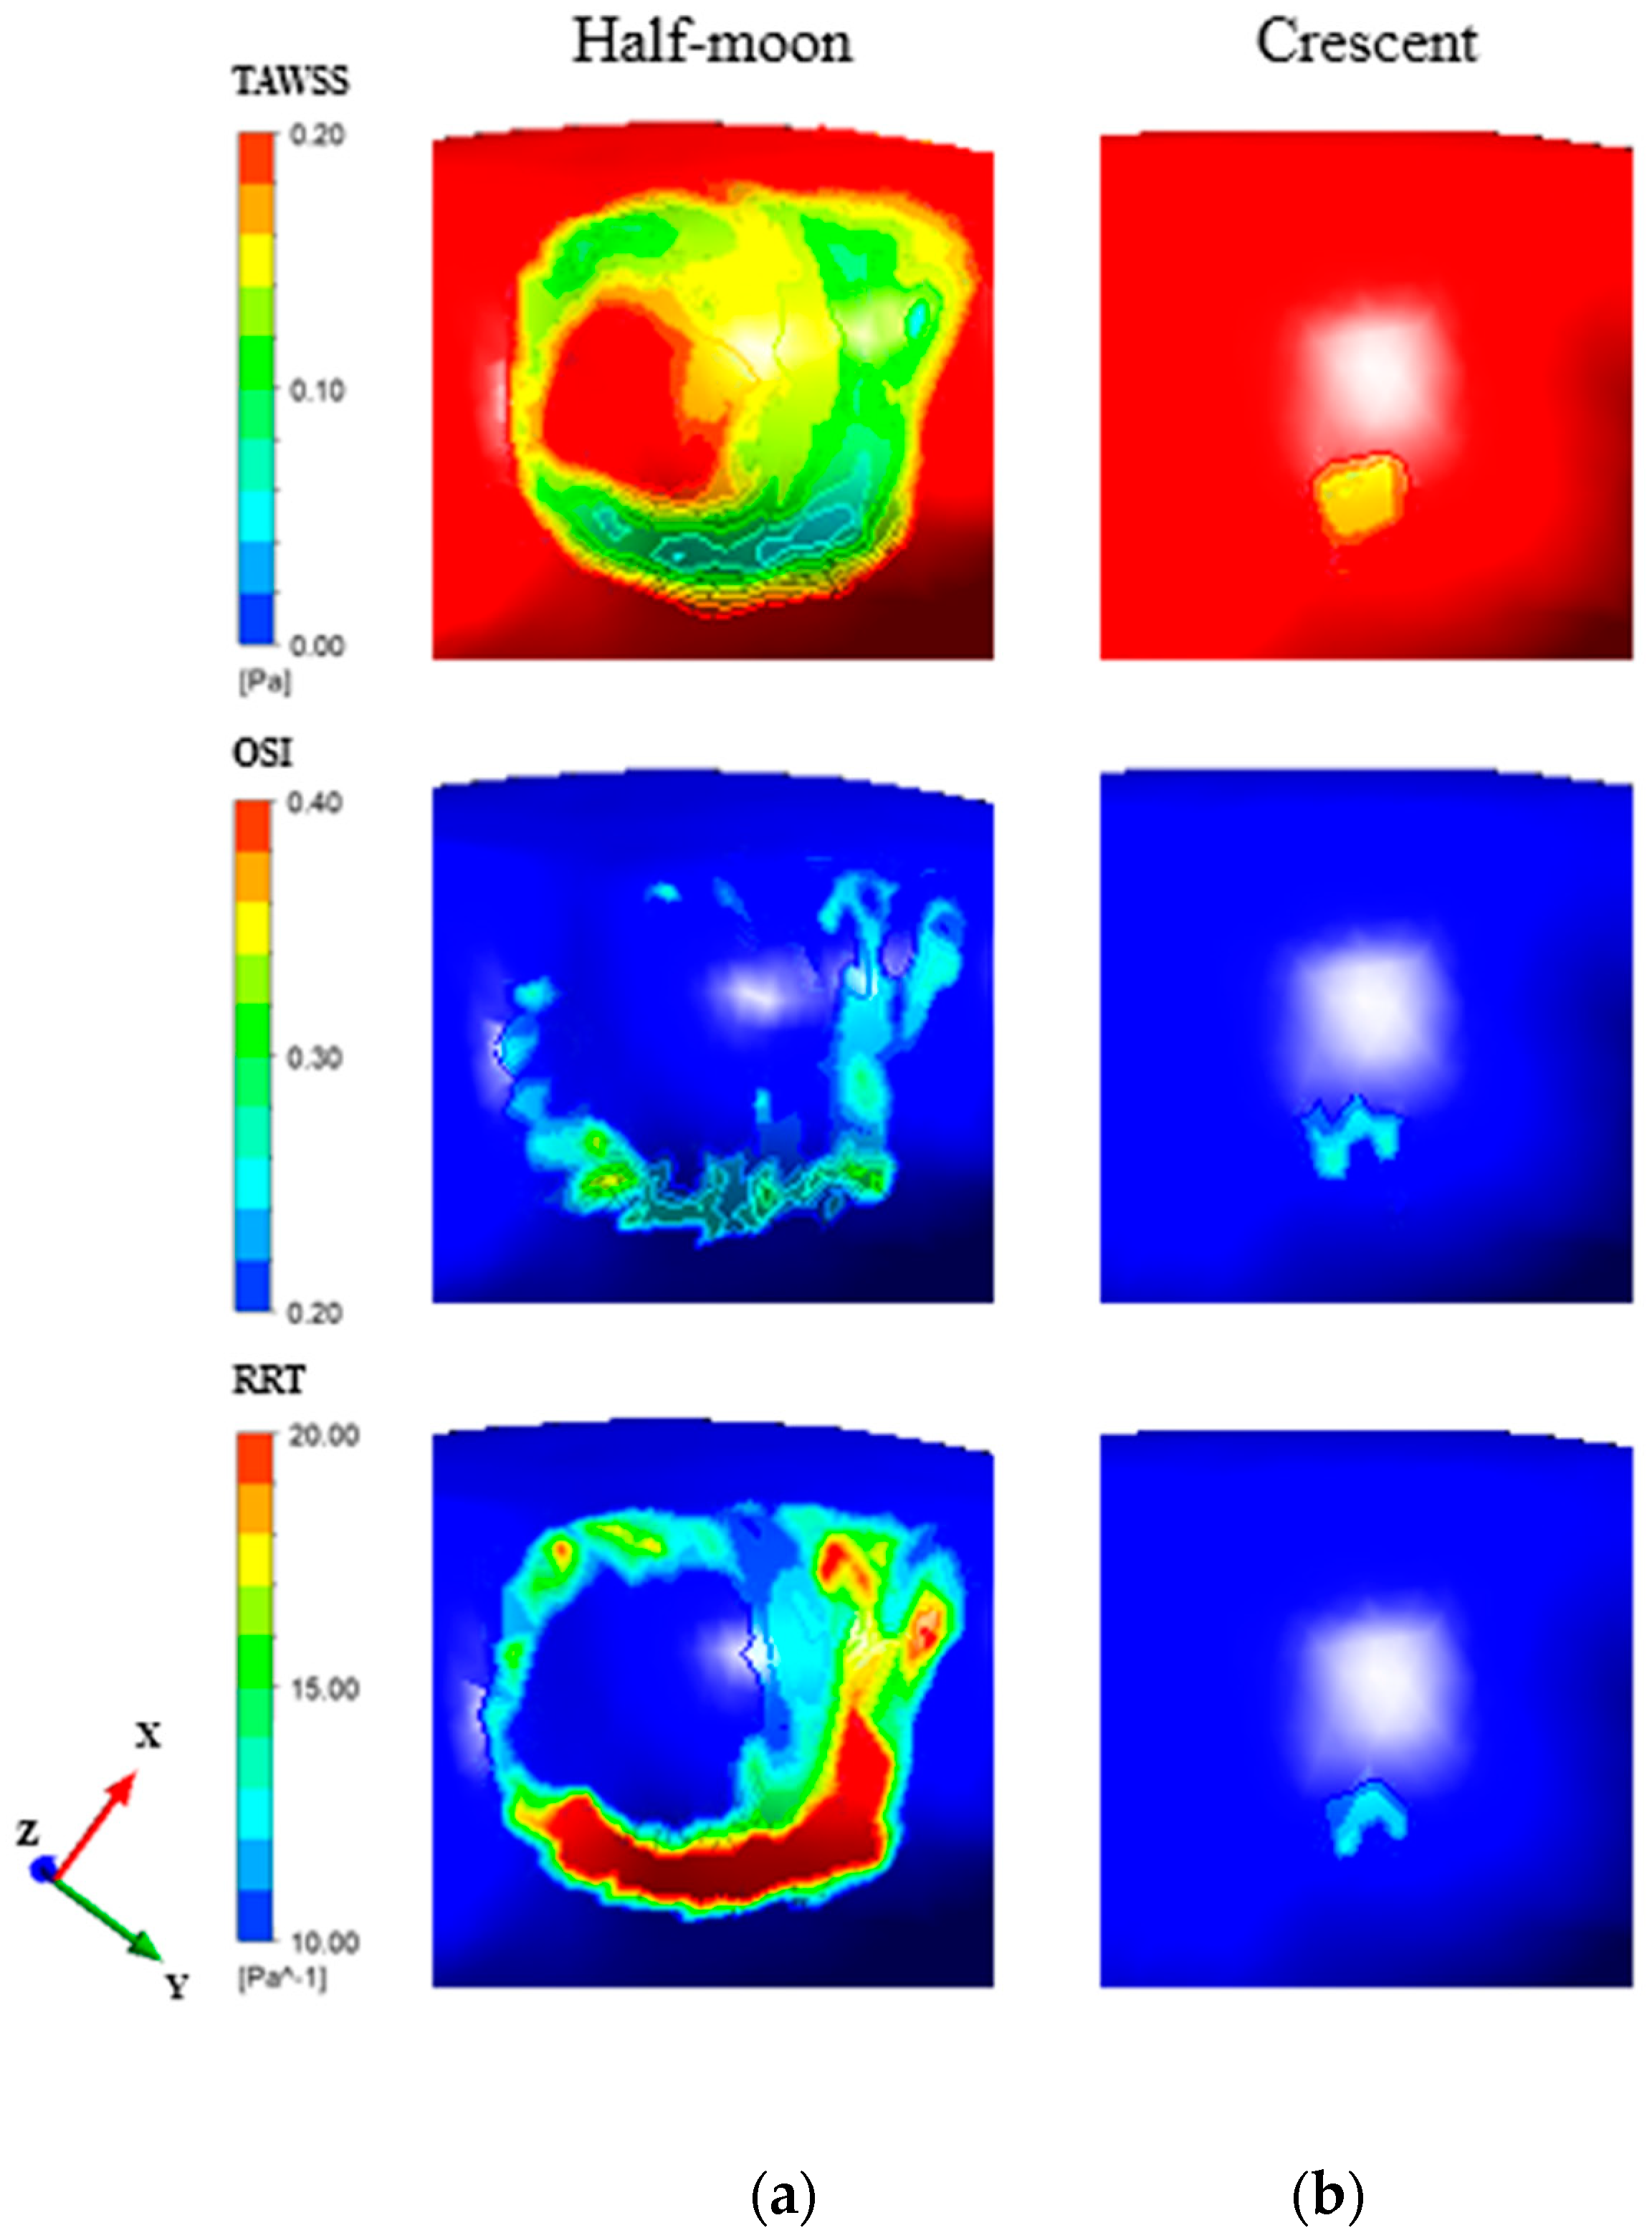
3.1. Influence of Graft Shapes

The impact of the graft shape (i.e., a classical half-moon and our proposed crescent) was evaluated using the pulmonary homograft. The repaired aortic arch by either the half-moon or crescent graft was quantified using two representative cross-sectional areas and the centerline angle, as listed in Table 1. It was clear that the half-moon arch repair, compared with the crescent one, exhibited a wider cross-sectional area as well as a larger centerline angle. For the half-moon arch, the cross-sectional area at the aortic arch (B-B′) was 24.49% larger than that of the crescent one. The centerline angle of the half-moon graft was 11.52% larger than that of the crescent graft. These geometric differences were hypothesized to affect their graft mechanics.
The von Mises stress distributions for both the half-moon and crescent grafts are shown in Figure 5. Both grafts demonstrated larger stress than the adjacent native tissue, and the stress concentrated on the lower border of the aortic arch. In addition, the stress level in the crescent graft was smaller than the one in the half-moon graft. The pathline across the graft zone along the lower border of the arch was used to capture the peak von Mises stress of the graft (Figure 5c). It was observed that the maximum von Mises stresses on the half-moon and crescent grafts were 0.25 MPa and 0.06 MPa, respectively. For the half-moon graft, the stress concentrated at the interface between the graft and the native tissue. In contrast, there was not much stress variation along the pathline of the crescent graft.
The blood flow dynamics at 0.4 s (peak pressure, systole) and 0.6 s (early diastole) for both graft repairs are shown in Figure 6. Streamlines illustrate the helical blood motion while y-direction velocity vectors, without any projection at two representative cross sections (ascending aorta A-A′ and aortic arch B-B′), demonstrate the rotational flow. It is clear that flow disturbance was higher at the diastolic phase. The positive velocity magnitude represents the forward flow, and the negative one represents the reversed flow. The minimal flow disturbance was observed at the ascending aorta only at the diastolic phase. However, at the aortic arc, the reversed flow was observed during both the diastolic and systolic phases. The reversed flow was much more obvious in the half-moon graft than the crescent one. The reversed flow zone was minimal in the crescent graft. In addition, the reversed flow occurred around the inner curvature of the graft.
The crescent graft was quantitatively compared with the half-moon one at the aforementioned cross-sections in terms of the area, the maximum velocity, and the mass flow rate at both phases (Table 2). Regardlesss of the graft shapes, both the cross-sectional areas and maximum velocity were larger at the systolic phase than the diastolic one. At the ascending aorta (A-A′), the crescent graft exhibited a relatively larger cross-sectional area at both phases, but the difference in the maximum velocity for both graft shapes was minimal. This could be attributed to the alterations in both the mass flow rate and cross-sectional area. At the ascending aorta (A-A′), the mass flow rates of the crescent graft were 11.2% and 8.7% higher than that of the half-moon one at 0.4 s and 0.6 s, respectively. The corresponding cross-sectional areas of the crescent graft were 5.6% and 6.1% larger than that of the half-moon one, respectively.
At the aortic arch (B-B′), the cross-sectional area of the crescent graft was 31.9% smaller than that of the half-moon one during systolic phase (0.4 s). The maximum velocity of the crescent graft was 24.1% higher than that of the half-moon one due to the smaller area and relatively larger mass flow rate. It is interesting to observe that during diastolic phase (0.6 s), the maximum velocity of the half-moon graft was 22.7% higher than that of the crescent one although the cross-sectional area of the half-moon graft was 30.1% larger than that of the crescent one. This could be explained by the vena contracta effect [35]. The positive flow area (PFA), as illustrated in Figure 7, is the area with only forward flow. The PFA at the cross-section B-B′ at 0.6 s for the half-moon and crescent grafts was 364.8 m m 2 and 344.3 m m 2 , respectively. The PFA at the cross-section B-B′ at 0.6 s in the half-moon graft was 31% smaller than the total cross-sectional area, while the difference in the crescent one was minimal (i.e., 2.9%). Moreover, the mass flow rate in the PFA of the half-moon graft was 8.4% higher than that of the crescent graft. Therefore, the maximum velocity in the half-moon graft was higher than that in the crescent graft.
The percentage areas of low TAWSS, high OSI and high RRT, viewed from the bottom of the aortic arch, are shown in Figure 8. The crescent graft, compared with the half-moon one, demonstrated a smaller percentage area of low TAWSS, high OSI and high RRT, which was calculated over the graft region. Specifically, the percentage areas of low TAWSS (i.e., less than 0.2 Pa) were 0.360 and 0.046 for the half-moon and crescent graft, respectively; the corresponding high OSIs, (i.e., larger than 0.2) were 0.161 and 0.030, respectively; the high RRTs (i.e., larger than 10 Pa−1) were 0.260 and 0.028, respectively. These were associated with the potential clinical outcomes.

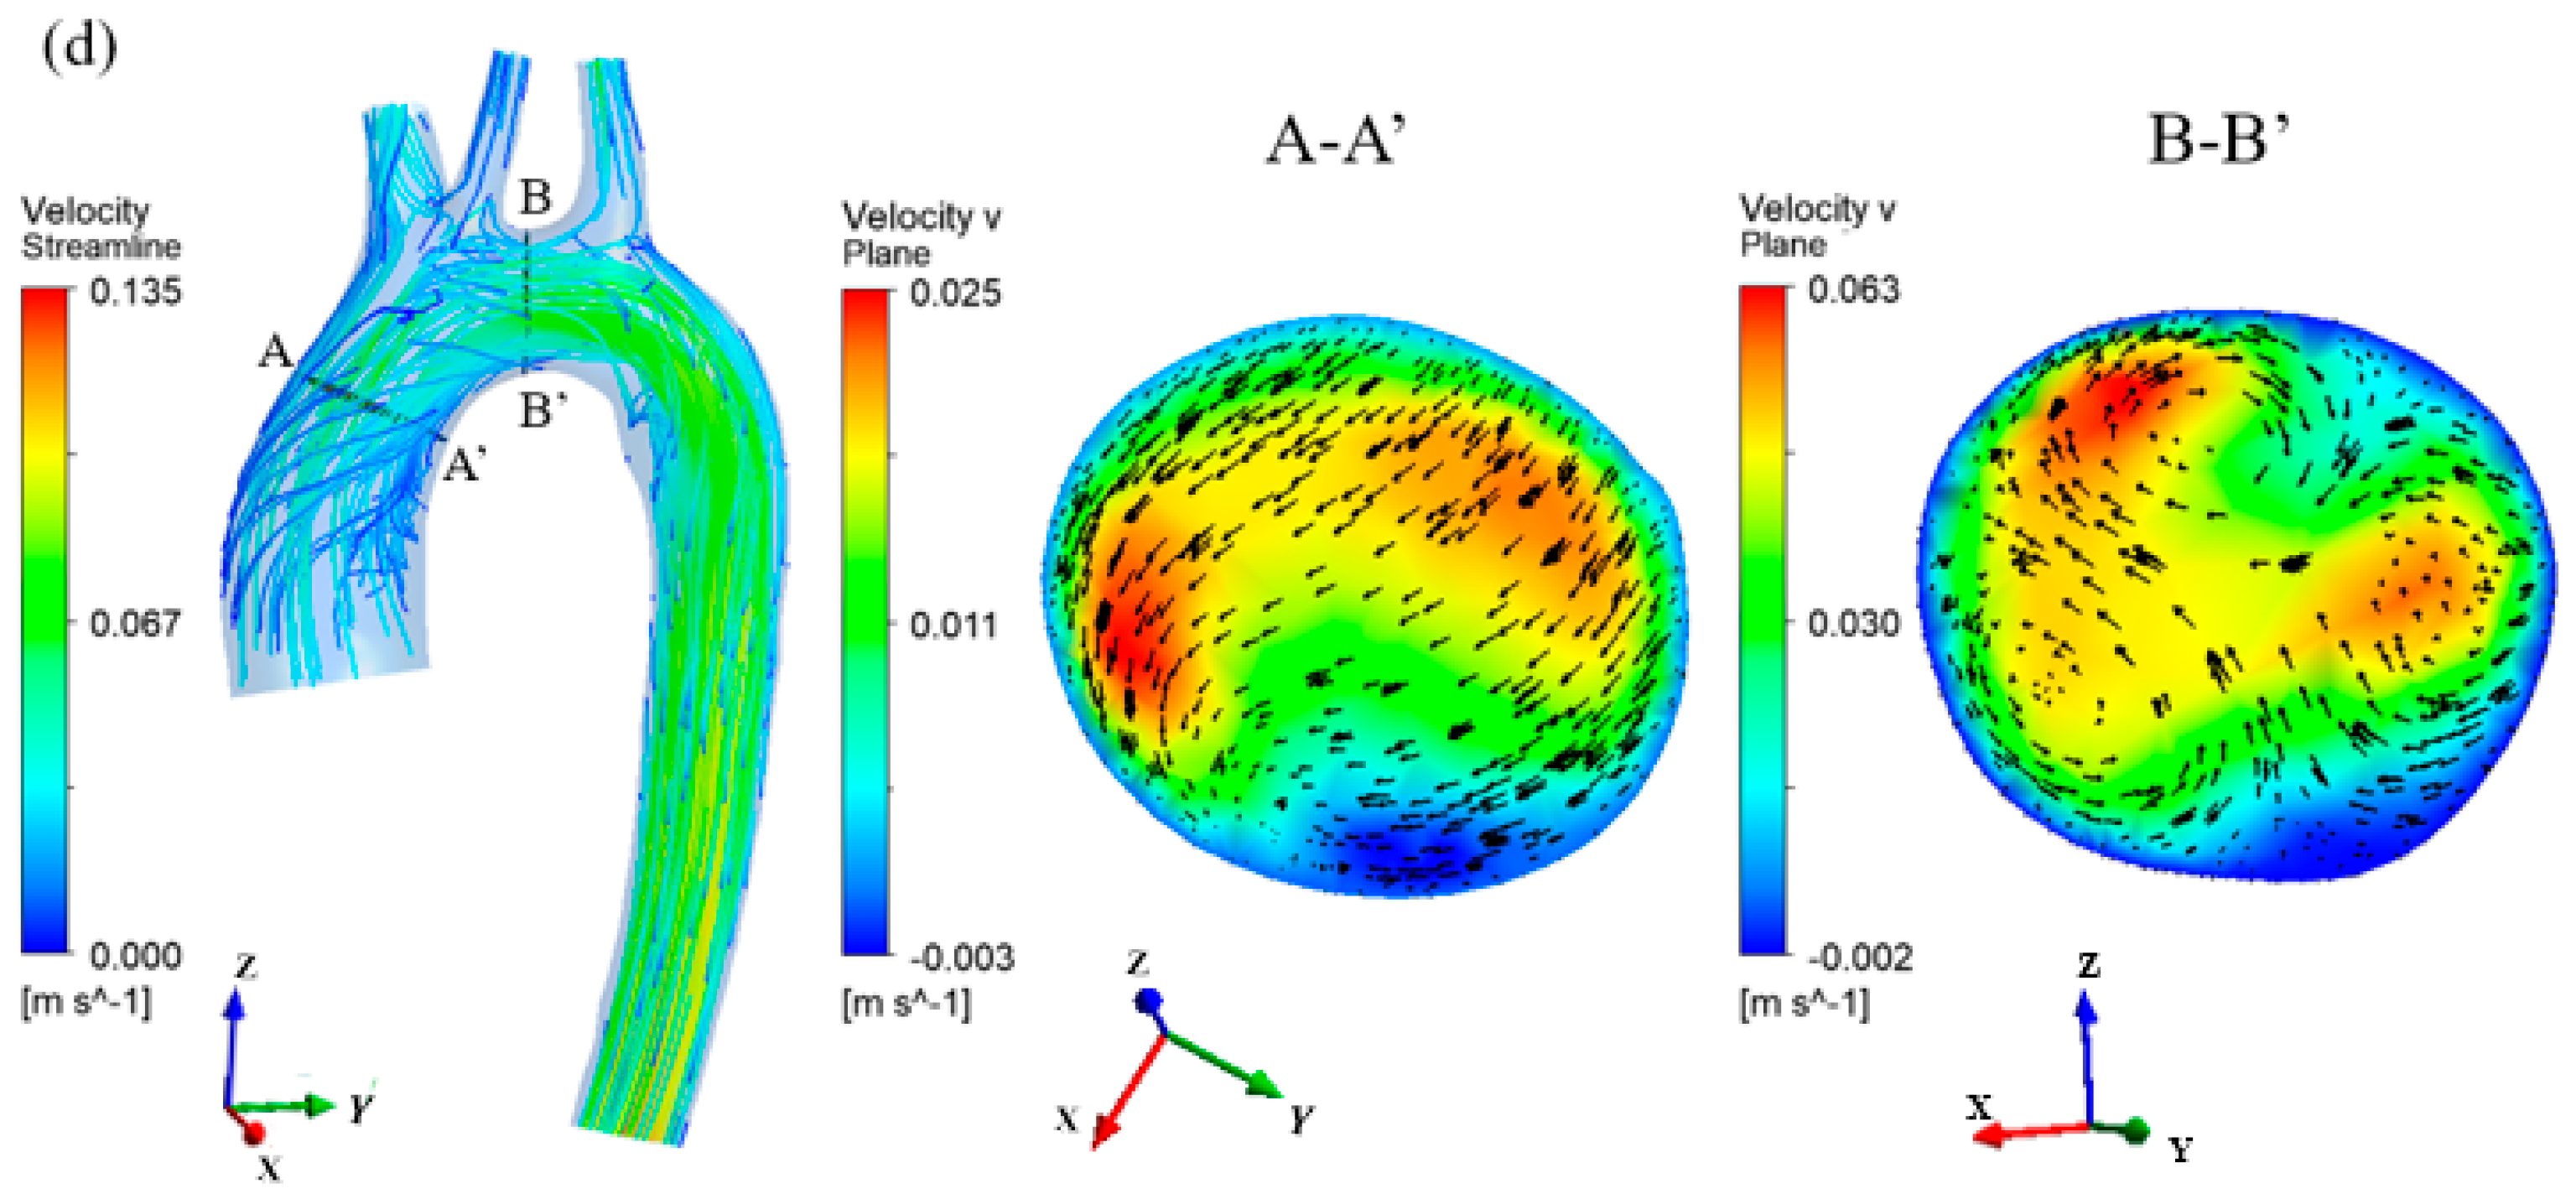
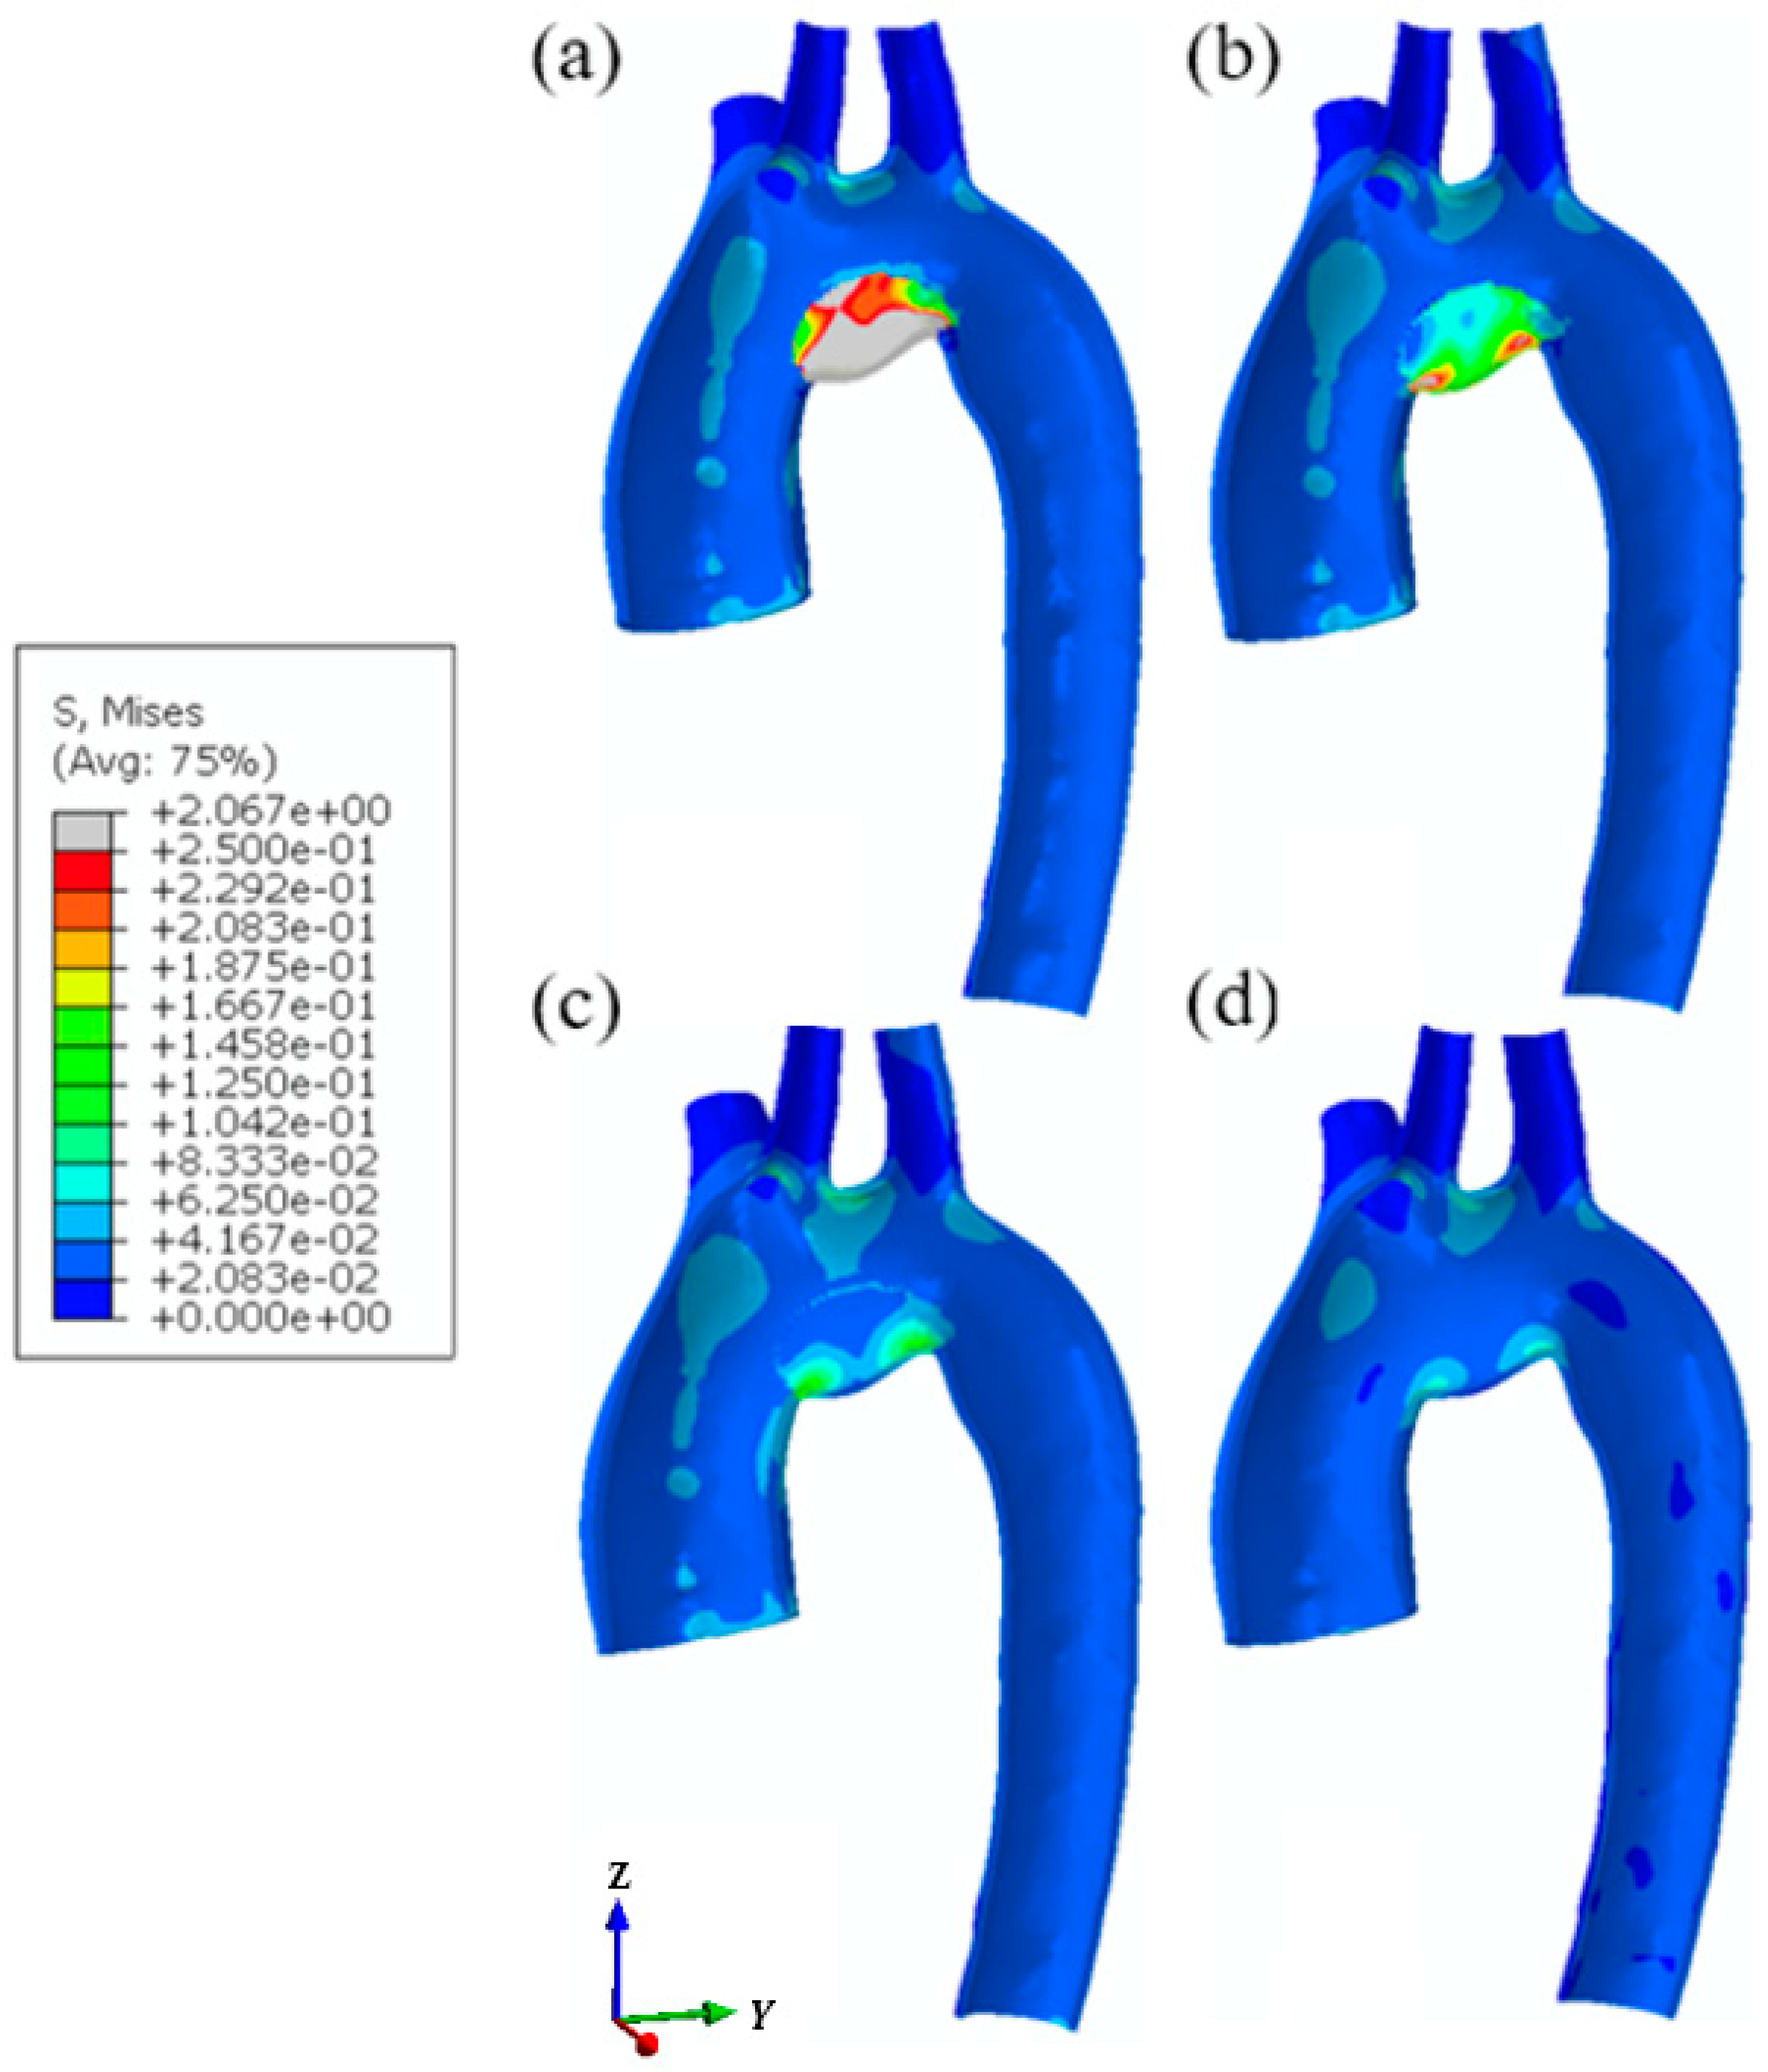
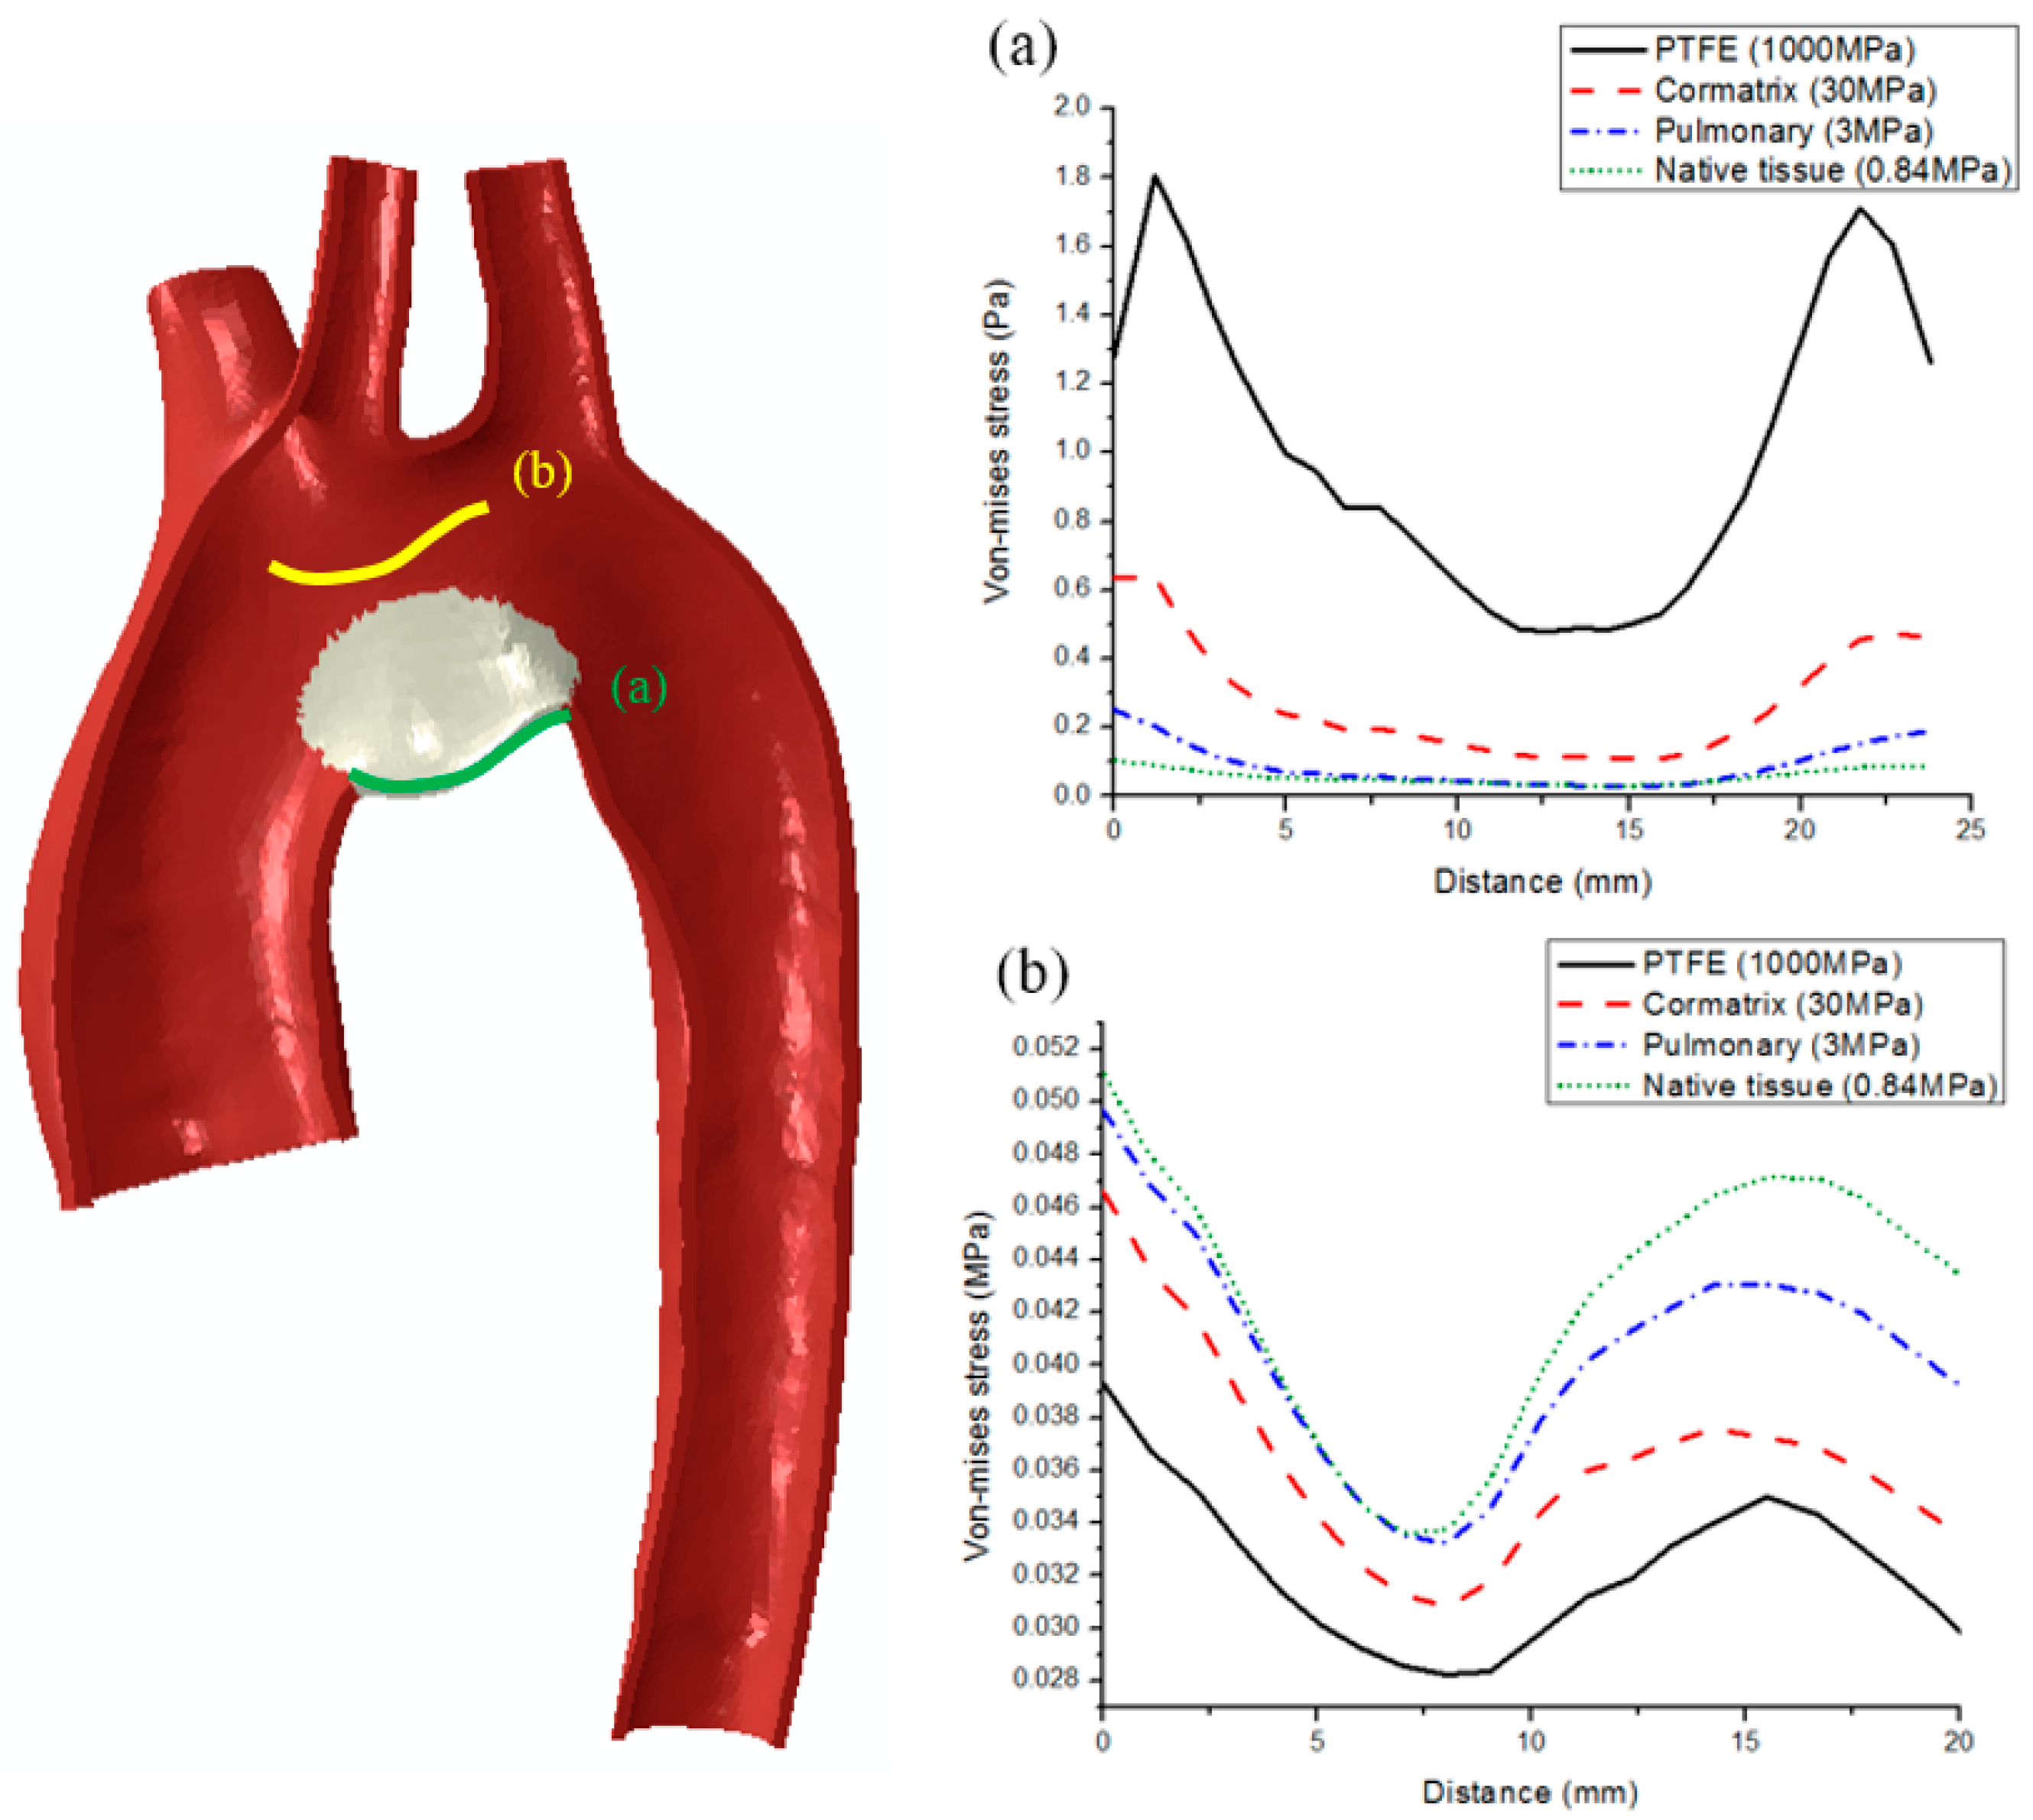
3.2. Influence of Graft Materials

Various graft materials were commercially available for the aortic arch repair. The role of the graft material properties on their von Mises stress distributions using the commonly adopted half-moon shape are illustrated in Figure 9. Generally, stresses on the grafts were larger than on the adjacent tissue, and stress concentrations were observed at the interface between the graft and the native tissue. A stiffer graft resulted in larger stress concentrations. The peak von Mises stresses for PTFE, CorMatrix, pulmonary, and native tissue equivalent grafts were 2.067 MPa, 0.638 MPa, 0.251 MPa, and 0.109 MPa, respectively. To further illustrate the stress-shielding effect of the graft, the von Mises stresses along two pathlines, representing the lower border of the graft or the native tissue with an offset of 13 mm from the superior border of the graft, are depicted in Figure 10. The peak von Mises stress for both pathlines was generally located around the proximal or distal borders of the graft. The stiffer graft shielded much more stress for the adjacent native tissue, leading to a much smaller stress on the native tissue. This could be explained by the larger load-sharing capacity of the stiffer graft. Specifically, the peak von Mises stresses at the lower border of the graft were 1.808 MPa, 0.637 MPa, 0.204 MPa, and 0.090 MPa in order of the PTFE, CorMatrix, pulmonary, and native tissue equivalent materials, respectively. The corresponding stresses at the native tissue pathline were 0.039 MPa, 0.047 MPa, 0.050 MPa, and, 0.051 MPa, respectively.
The graft material-induced blood flow dynamics had similar patterns as illustrated in Figure 6a,b. Reversed flow patterns were observed near the inner curvature of the aortic arch. The reversed flow region expanded with a softer graft material. The relation between graft compliance and the flow pulsation during one cardiac cycle is summarized in Table 3. It was obvious that the aortic cross-sectional areas increased with the softer graft materials. As the stiffness of the graft material reduced, the maximum velocity at systolic phase reduced, and the maximum velocity at diastolic phase increased. This implied that the flow pulsation during one cardiac cycle, represented by the maximum velocity difference between 0.4 s and 0.6 s, was increased with a stiffer graft.
Various graft materials resulted in a similar percentage area of low TAWSS, high OSI, and high RRT, calculated over the graft region, as shown in Figure 8. Specifically, for the adopted four graft materials, the percentage areas of low TAWSS (<0.2 Pa), high OSI (>0.2), and high RRT (>10 Pa−1) were 0.363 ± 0.015, 0.158 ± 0.014, and 0.253 ± 0.005, respectively. The corresponding relative standard deviations were 4.12%, 8.97%, and 1.89%, respectively. This implies that the pathological hemodynamic parameters were not sensitive to graft materials.

4. Discussions

The graft-induced alternations in the aorta mechanical environment were never quantitatively characterized for different graft designs. The goal of this work was to delineate the role of graft shape and materials on the aortic biomechanical environments following the aortic arch graft repair. The fluid structure interactions of the aortic arch were characterized in terms of arterial stress, flow dynamics, and indicators associated with the initiation and progression of the vascular maladaptation [36,37,38] (i.e., low WSS (<0.2 Pa), high OSI (>0.2), and RRT (>10 Pa−1)). The FSI computational framework has been validated by the published experimental observations [30]. It is worth noting that this study is not a clinical case study. It focused on the physical understanding of the graft design in terms of geometry and materials.
It is well recognized that the geometry of the aortic arch affects the hemodynamics and thus cardiac functions [39,40]. Tomita et al. [41] showed that in mice, both the aortic arch angle and cross-sectional area of the aortic arch correlated positively with the area of the plaque. Enhanced clinical outcomes were observed for an autologous vascular graft resembling the curvature of the aortic arch [42]. The crescent graft herein was proposed to better mimic the native arch shape (i.e., a smaller aortic arch angle), tapered cross-sectional area, and smooth curvature compared to the half-moon graft (Figure 2).
The stress concentrations were observed at the interface between the graft and the native tissue, regardless of graft shapes. This was due to the material mismatch. The peak von Mises stress of the crescent graft was 76% smaller than the half-moon one (Figure 5). This could be explained by the local geometrical discontinuity at the interface between the graft and native tissue [43], also referred to as the geometry mismatch. The abnormal stresses have been associated with the reduced compliance of the tissue and disruption of collagen fiber structure [44,45,46].
The geometrical discontinuity in the half-moon graft resulted in the obvious reversed flow adjacent to the bottom border of the graft, especially at the diastolic phase. This was due to the constriction effect at the proximal border of the graft. The cross-sectional area at the proximal border of the graft discontinued the tapering of the ascending aorta, and induced a reversed tapering by implementing a half-moon graft, which is analogous to the stenosis model. The reversed flow was well-observed and explained by the adverse pressure gradient using the analogy of the stenosis case [47]. In comparison, the tapering from the ascending aorta (A-A′) to the aortic arch (B-B′) was well preserved in the crescent graft, and thus led to the minimal flow disturbance.
The graft geometry was also highly related to wall movement in terms of the cross-sectional area and the mass flow rate redistributions [48]. It is interesting to observe that the difference between the PFA and the cross-sectional area for the half-moon graft was significantly larger than for that of the crescent one (Figure 7). This indicated that the flow disturbance and recirculation were more severe in the half-moon graft. The flow streamlines had the same implication as the pressure contours (details not shown for brevity). Moreover, the crescent graft exhibited a smaller percentage area of low TAWSS, high OSI, and high RRT, compared with the half-moon one. A large percentage of these indicators has been associated with neointimal hyperplasia and recoarctation [16,49].
The stress concentration at the graft edges was also associated with the choice of graft materials. The peak von Mises stresses of the PTFE, CorMatrix, and pulmonary grafts were 15.92, 4.961, and 1.352 times larger than that of the native tissue equivalent graft, respectively (Figure 9). The large material mismatch induced more stress concentrations on the borders of the grafts. The stress concentrations correlated with the cellular changes in the tissue and accumulation of the fiber damage [50,51]. Moreover, a stiff graft shielded the surrounding tissue from loadings. However, the pathological hemodynamic parameters were not sensitive to graft materials. It is worth noting that the obtained results should be treated as a comparative or qualitative trend, instead of as absolute numbers, which could vary depending on patients’ variations in terms of ages, disease conditions, anatomies, and material properties. Further clinical case studies are desired for an optimal graft design.
In the present model, the suture line was idealized as the tie constraint. A realistic suture could aggravate the stress concentration on the aortic wall [52]. The aortic wall was simplified by using isotropic homogeneous materials. The anisotropy and heterogeneity of the aortic wall could change the level of wall contractions and stress concentrations on the aortic wall [53,54]. In addition, the effect of the aortic arch stiffness on the left ventricular (LV) function was ignored. Various aortic graft shape and material choices could alter the LV function [40], and thus the hemodynamics inflow waveform [55]. A three-element Windkessel model could be used to account for the interaction between the stoke volume and the compliance of the aorta. Despite these simplifications, the present work demonstrated the important roles of graft shape and materials on the mechanics of the aorta, which have significant clinical implications for optimal graft repair. This work can be used to provide a fundamental understanding of the behavior and impact of graft designs on hemodynamics and wall mechanics, and to provide guidance for better graft decisions and pre-clinical planning. The adopted research approach could be translated to other tissue repair or replacement cases, regardless of ages and anatomical positions.

Author Contributions

S.J. and L.G. contributed to conception, design, data acquisition, interpretation, and preparation of this manuscript. I.A. contributed to conception, design, and interpretation. S.L. contributed to data acquisition.

Funding

This research was funded by the National Science Foundation CAREER award (CBET-1254095).

Acknowledgments

Thanks Heidi Brauning for proofreading the manuscript.

Conflicts of Interest

The authors declare no conflict of interest.

References

  1. Ringel, R.E.; Gauvreau, K.; Moses, H.; Jenkins, K.J.J.A.H.J. Coarctation of the Aorta Stent Trial (COAST): Study design and rationale. Am. Heart J. 2012, 164, 7–13. [Google Scholar] [CrossRef] [PubMed]
  2. Keshavarz-Motamed, Z.; Garcia, J.; Maftoon, N.; Bedard, E.; Chetaille, P.; Kadem, L.J.J.O.B. A new approach for the evaluation of the severity of coarctation of the aorta using Doppler velocity index and effective orifice area: In vitro validation and clinical implications. J. Biomech. 2012, 45, 1239–1245. [Google Scholar] [CrossRef] [PubMed]
  3. Torok, R.D.; Campbell, M.J.; Fleming, G.A.; Hill, K.D. Coarctation of the aorta: Management from infancy to adulthood. World J. Cardiol. 2015, 7, 765. [Google Scholar] [CrossRef] [PubMed] [Green Version]
  4. Vergales, J.E.; Gangemi, J.J.; Rhueban, K.S.; Lim, D.S. Coarctation of the aorta-the current state of surgical and transcatheter therapies. Curr. Cardiol. Rev. 2013, 9, 211–219. [Google Scholar] [CrossRef] [PubMed]
  5. Poirier, N.C.; van Arsdell, G.S.; Brindle, M.; Thyagarajan, G.K.; Coles, J.G.; Black, M.D.; Freedom, R.M.; Williams, W.G. Surgical treatment of aortic arch hypoplasia in infants and children with biventricular hearts. Ann. Thorac. Surg. 1999, 68, 2293–2297. [Google Scholar] [CrossRef]
  6. Boussel, L.; Rayz, V.; McCulloch, C.; Martin, A.; Acevedo-Bolton, G.; Lawton, M.; Higashida, R.; Smith, W.S.; Young, W.L.; Saloner, D. Aneurysm growth occurs at region of low wall shear stress: Patient-specific correlation of hemodynamics and growth in a longitudinal study. Stroke 2008, 39, 2997–3002. [Google Scholar] [CrossRef] [PubMed]
  7. Vardoulis, O.; Coppens, E.; Martin, B.; Reymond, P.; Tozzi, P.; Stergiopulos, N. Impact of aortic grafts on arterial pressure: A computational fluid dynamics study. Eur. J. Vasc. Endovasc. Surg. 2011, 42, 704–710. [Google Scholar] [CrossRef] [PubMed]
  8. Kannan, R.Y.; Salacinski, H.J.; Butler, P.E.; Hamilton, G.; Seifalian, A.M. Current status of prosthetic bypass grafts: A review. J. Biomed. Mater. Res. Part B Appl. Biomater. 2005, 74, 570–581. [Google Scholar] [CrossRef] [PubMed]
  9. Jaganathan, S.K.; Supriyanto, E.; Murugesan, S.; Balaji, A.; Asokan, M.K. Biomaterials in cardiovascular research: Applications and clinical implications. BioMed Res. Int. 2014, 45, 1239–1245. [Google Scholar] [CrossRef] [PubMed]
  10. Chen, X.; Gao, Y.; Lu, B.; Jia, X.; Zhong, L.; Kassab, G.S.; Tan, W.; Huo, Y. Hemodynamics in coronary arterial tree of serial stenoses. PLoS ONE 2016, 11, e0163715. [Google Scholar] [CrossRef] [PubMed]
  11. Yanagawa, B.; Rao, V.; Yau, T.M.; Cusimano, R.J. Initial experience with intraventricular repair using CorMatrix extracellular matrix. Innovations 2013, 8, 348–352. [Google Scholar] [PubMed]
  12. Knyshov, G.V.; Sitar, L.L.; Glagola, M.D.; Atamanyuk, M.Y. Aortic aneurysms at the site of the repair of coarctation of the aorta: A review of 48 patients. Ann. Thorac. Surg. 1996, 61, 935–939. [Google Scholar] [CrossRef]
  13. Lee, S.-W.; Antiga, L.; Spence, J.D.; Steinman, D.A. Geometry of the carotid bifurcation predicts its exposure to disturbed flow. Stroke 2008, 39, 2341–2347. [Google Scholar] [CrossRef] [PubMed]
  14. Mori, D.; Yamaguchi, T. Computational fluid dynamics modeling and analysis of the effect of 3-D distortion of the human aortic arch. Comput. Methods Biomech. Biomed. Eng. 2002, 5, 249–260. [Google Scholar] [CrossRef] [PubMed]
  15. Alberta, H.B.; Secor, J.L.; Smits, T.C.; Farber, M.A.; Jordan, W.D.; Matsumura, J.S. Differences in aortic arch radius of curvature, neck size, and taper in patients with traumatic and aortic disease. J. Surg. Res. 2013, 184, 613–618. [Google Scholar] [CrossRef] [PubMed]
  16. Chiu, J.-J.; Chien, S. Effects of disturbed flow on vascular endothelium: Pathophysiological basis and clinical perspectives. Physiol. Rev. 2011, 91, 327–387. [Google Scholar] [CrossRef] [PubMed]
  17. Zhou, J.; Li, Y.-S.; Chien, S.J.A. Shear stress–initiated signaling and its regulation of endothelial function. Arterioscler. Thromb. Vasc. Biol. 2014, 34, 2191–2198. [Google Scholar] [CrossRef] [PubMed]
  18. Roussin, R.; Belli, E.; Lacour-Gayet, F.; Godart, F.; Rey, C.; Bruniaux, J.; Planché, C.; Serraf, A. Aortic arch reconstruction with pulmonary autograft patch aortoplasty. J. Thorac. Cardiovasc. Surg. 2002, 123, 443–450. [Google Scholar] [CrossRef] [PubMed] [Green Version]
  19. Chen, C.-K.; Chou, H.-P.; Guo, C.-Y.; Chang, H.-T.; Chang, Y.-Y.; Chen, I.-M.; Wu, M.-H.; Shih, C.-C. Interobserver and intraobserver variability in measuring the tortuosity of the thoracic aorta on computed tomography. J. Vasc. Surg. 2018, 68, 1183–1192. [Google Scholar] [CrossRef] [PubMed]
  20. Krüger, T.; Veseli, K.; Lausberg, H.; Vöhringer, L.; Schneider, W.; Schlensak, C.J.I.C.; Surgery, T. Regional and directional compliance of the healthy aorta: An ex vivo study in a porcine model. Interact. Cardiovasc. Thorac. Surg. 2016, 23, 104–111. [Google Scholar] [CrossRef] [PubMed]
  21. Fung, Y.-C. Biomechanics: Mechanical Properties of Living Tissues; Springer Science & Business Media: Berlin, Germany, 2013. [Google Scholar]
  22. Giannakoulas, G.; Giannoglou, G.; Soulis, J.; Farmakis, T.; Papadopoulou, S.; Parcharidis, G.; Louridas, G. A computational model to predict aortic wall stresses in patients with systolic arterial hypertension. Med. Hypothes. 2005, 65, 1191–1195. [Google Scholar] [CrossRef] [PubMed]
  23. Azadani, A.N.; Chitsaz, S.; Matthews, P.B.; Jaussaud, N.; Leung, J.; Wisneski, A.; Ge, L.; Tseng, E.E. Biomechanical comparison of human pulmonary and aortic roots. Eur. J. Cardio-Thorac. Surg. 2012, 41, 1111–1116. [Google Scholar] [CrossRef] [PubMed]
  24. Rae, P.; Dattelbaum, D. The properties of poly (tetrafluoroethylene)(PTFE) in compression. Polymer 2004, 45, 7615–7625. [Google Scholar] [CrossRef]
  25. Scully, B.B.; Fan, C.; Grigoryan, B.; Jacot, J.G.; Vick, G.; Kim, J.J.; Fraser, C.D.; Grande-Allen, K.J.; Morales, D.L. Remodeling of ECM patch into functional myocardium in an ovine model: A pilot study. J. Biomed. Mater. Res. Part B Appl. Biomater. 2016, 104, 1713–1720. [Google Scholar] [CrossRef] [PubMed]
  26. Hoerstrup, S.P.; Kadner, A.; Breymann, C.; Maurus, C.F.; Guenter, C.I.; Sodian, R.; Visjager, J.F.; Zund, G.; Turina, M.I. Living, autologous pulmonary artery conduits tissue engineered from human umbilical cord cells. Ann. Thorac. Surg. 2002, 74, 46–52. [Google Scholar] [CrossRef]
  27. Donea, J.; Huerta, A.; Ponthot, J.P.; Rodríguez-Ferran, A. Arbitrary L agrangian–E ulerian Methods. In Encyclopedia of Computational Mechanics, 2nd ed.; John Wiley & Sons, Inc.: Hoboken, NJ, USA, 2017; pp. 1–23. [Google Scholar] [CrossRef]
  28. Ahrem, R.; Post, P.; Steckel, B.; Wolf, K. MpCCI: A tool for coupling CFD with other disciplines. In Proceedings of the Fifth World Conference in Applied Fluid Dynamics, CFD-Efficiency and Economic Benefit in Manufacturing, Freiburg, Germany, 17–21 June 2001. [Google Scholar]
  29. Fraunhofer, S. MpCCI Documentation; Fraunhofer Institute for Algorithms and Scientific Computing SCAI, Germany: Sankt Augustin, Germany, 2008. [Google Scholar]
  30. Lin, S.; Han, X.; Bi, Y.; Ju, S.; Gu, L. Fluid-Structure Interaction in Abdominal Aortic Aneurysm: Effect of Modeling Techniques. BioMed Res. Int. 2017. [Google Scholar] [CrossRef] [PubMed]
  31. Dassault Systèmes SIMULIA Corp. ABAQUS Theory Manual; 2009 Version; Dassault Systèmes SIMULIA Corp.: Providence, RI, USA, 2009. [Google Scholar]
  32. Cattermole, G.N.; Leung, P.M.; Ho, G.Y.; Lau, P.W.; Chan, C.P.; Chan, S.S.; Smith, B.E.; Graham, C.A.; Rainer, T.H. The normal ranges of cardiovascular parameters measured using the ultrasonic cardiac output monitor. Physiol. Rep. 2017. [Google Scholar] [CrossRef] [PubMed]
  33. Calamandrei, M.; Mirabile, L.; Muschetta, S.; Gensini, G.F.; de Simone, L.; Romano, S.M. Assessment of cardiac output in children: A comparison between the pressure recording analytical method and Doppler echocardiography. Pediatr. Crit. Care Med. 2008, 9, 310–312. [Google Scholar] [CrossRef] [PubMed]
  34. Benim, A.; Nahavandi, A.; Assmann, A.; Schubert, D.; Feindt, P.; Suh, S. Simulation of blood flow in human aorta with emphasis on outlet boundary conditions. Appl. Math. Model. 2011, 35, 3175–3188. [Google Scholar] [CrossRef]
  35. Zeng, X.; Levine, R.A.; Hua, L.; Morris, E.L.; Kang, Y.; Flaherty, M.; Morgan, N.V.; Hung, J. Diagnostic Value of Vena Contracta Area in the Quantification of Mitral Regurgitation Severity by Color Doppler 3D EchocardiographyClinical Perspective. Circ. Cardiovasc. Imaging 2011, 4, 506–513. [Google Scholar] [CrossRef] [PubMed]
  36. Zhang, Q.; Gao, B.; Gu, K.; Chang, Y.; Xu, J. The study on hemodynamic effect of varied support models of BJUT-II VAD on coronary artery: A primary CFD study. ASAIO J. 2014, 60, 643–651. [Google Scholar] [CrossRef] [PubMed]
  37. Tsou, J.K.; Liu, J.; Barakat, A.I.; Insana, M.F. Role of ultrasonic shear rate estimation errors in assessing inflammatory response and vascular risk. Ultrasound Med. Biol. 2008, 34, 963–972. [Google Scholar] [CrossRef] [PubMed]
  38. Castro, M.A. Understanding the role of hemodynamics in the initiation, progression, rupture, and treatment outcome of cerebral aneurysm from medical image-based computational studies. ISRN Radiol. 2013. [Google Scholar] [CrossRef]
  39. Itatani, K.; Miyaji, K.; Qian, Y.; Liu, J.L.; Miyakoshi, T.; Murakami, A.; Ono, M.; Umezu, M. Influence of surgical arch reconstruction methods on single ventricle workload in the Norwood procedure. J. Thorac. Cardiovasc. Surg. 2012, 144, 130–138. [Google Scholar] [CrossRef] [PubMed] [Green Version]
  40. Bruse, J.L.; Khushnood, A.; McLeod, K.; Biglino, G.; Sermesant, M.; Pennec, X.; Taylor, A.M.; Hsia, T.-Y.; Schievano, S.; Modeling of Congenital Hearts Alliance Collaborative Group. How successful is successful? Aortic arch shape after successful aortic coarctation repair correlates with left ventricular function. J. Thorac. Cardiovasc. Surg. 2017, 153, 418–427. [Google Scholar] [CrossRef] [PubMed] [Green Version]
  41. Tomita, H.; Zhilicheva, S.; Kim, S.; Maeda, N. Aortic Arch Curvature and Atherosclerosis Have Overlapping Quantitative Trait Loci in a Cross Between 129S6/SvEvTac and C57BL/6J Apolipoprotein E–Null Mice. Circ. Res. 2010, 106, 1052–1060. [Google Scholar] [CrossRef] [PubMed]
  42. Lee, H.; Yang, J.-H.; Jun, T.-G.; Cho, Y.H.; Kang, I.-S.; Huh, J.; Song, J. Augmentation of the Lesser Curvature With an Autologous Vascular Patch in Complex Aortic Coarctation and Interruption. Ann. Thorac. Surg. 2016, 101, 2309–2314. [Google Scholar] [CrossRef] [PubMed]
  43. Kasiri, S.; Taylor, D. A critical distance study of stress concentrations in bone. J. Biomech. 2008, 41, 603–609. [Google Scholar] [CrossRef] [PubMed]
  44. Broom, N. The stress/strain and fatigue behaviour of glutaraldehyde preserved heart-valve tissue. J. Biomech. 1977, 10, 707–724. [Google Scholar] [CrossRef]
  45. Broom, N.D. An ‘in vitro’study of mechanical fatigue in glutaraldehyde-treated porcine aortic valve tissue. Biomaterials 1980, 1, 3–8. [Google Scholar] [CrossRef]
  46. Soslowsky, L.; Thomopoulos, S.; Tun, S.; Flanagan, C.; Keefer, C.; Mastaw, J.; Carpenter, J. Neer Award 1999: Overuse activity injures the supraspinatus tendon in an animal model: A histologic and biomechanical study. J. Shoulder Elbow Surg. 2000, 9, 79–84. [Google Scholar] [CrossRef] [PubMed]
  47. Brown, D.J.; Smith, F.W. Stenosis hemodynamics: From physical principles to clinical indices. J. Vet. Intern. Med. 2002, 16, 650–657. [Google Scholar] [CrossRef] [PubMed]
  48. Singh, C.; Wang, X.; Morsi, Y.; Wong, C. Importance of stent-graft design for aortic arch aneurysm repair. AIMS Bioeng. 2017, 4, 133. [Google Scholar] [CrossRef]
  49. Qin, F.; Dardik, H.; Pangilinan, A.; Robinson, J.; Chuy, J.; Wengerter, K. Remodeling and suppression of intimal hyperplasia of vascular grafts with a distal arteriovenous fistula in a rat model. J. Vasc. Surg. 2001, 34, 701–706. [Google Scholar] [CrossRef] [PubMed] [Green Version]
  50. Martin, C.; Sun, W. Fatigue damage of collagenous tissues: Experiment, modeling and simulation studies. J. Long-Term Effects Med. Implants 2015, 25. [Google Scholar] [CrossRef]
  51. Sacks, M.S.; Smith, D.B. Effects of accelerated testing on porcine bioprosthetic heart valve fiber architecture. Biomaterials 1998, 19, 1027–1036. [Google Scholar] [CrossRef]
  52. Gu, L.; Kasavajhala, A.R.M.; Lang, H.; Hammel, J.M. Numerical and experimental investigation of vascular suture closure. Biomed. Eng. Lett. 2012, 2, 46–51. [Google Scholar] [CrossRef]
  53. Lee, P.; Carlson, B.E.; Chesler, N.; Olufsen, M.S.; Qureshi, M.U.; Smith, N.P.; Sochi, T.; Beard, D.A. Heterogeneous mechanics of the mouse pulmonary arterial network. Biomech. Model. Mechanobiol. 2016, 15, 1245–1261. [Google Scholar] [CrossRef] [PubMed] [Green Version]
  54. Madhavan, S.; Kemmerling, E.M.C. The effect of inlet and outlet boundary conditions in image-based CFD modeling of aortic flow. Biomed. Eng. Online 2018, 17, 66. [Google Scholar] [CrossRef] [PubMed]
  55. Ohyama, Y.; Ambale-Venkatesh, B.; Noda, C.; Chugh, A.R.; Teixido-Tura, G.; Kim, J.-Y.; Donekal, S.; Yoneyama, K.; Gjesdal, O.; Redheuil, A. Association of aortic stiffness with left ventricular remodeling and reduced left ventricular function measured by magnetic resonance imaging: The Multi-Ethnic Study of Atherosclerosis. Circ. Cardiovasc. Imaging 2016, 9, e004426. [Google Scholar] [CrossRef] [PubMed]
Figure 1. Schematic diagrams of (a) a half-moon shaped graft and (b) a crescent graft in flatten (Top) and folding views (Bottom). The chord length of the native arc, measured from the echocardiography, was used to create graft shapes.
Applsci 09 00807 g001
Figure 2. Reconstructed aortic arch repaired with (a) a half-moon shaped graft and (b) a crescent graft. B-B′ cross-section in (c) a half-moon shape model and (d) a crescent model.
Applsci 09 00807 g002
Figure 3. Mesh convergence in solid (a) and fluid (b) domains.
Applsci 09 00807 g003
Figure 4. (a) Inlet velocity and (b) outlet pressure waveform.
Applsci 09 00807 g004
Figure 5. Stress distributions at t = 0.4 s (peak systolic pressure) on the (a) half-moon and (b) crescent pulmonary grafts; (c) von Mises stress across the graft zone along the lower border of the arch.
Applsci 09 00807 g005
Figure 6. Velocity distributions with y-direction velocity vectors without any projection at two different time points (0.4 s and 0.6 s) and two different cross-sections (A-A′ and B-B′) in the half-moon and crescent pulmonary grafts: (a) half-moon graft at 0.4 s, (b) half-moon graft at 0.6 s, (c) crescent graft at 0.4 s, and (d) crescent graft at 0.6 s.
Applsci 09 00807 g006aApplsci 09 00807 g006b
Figure 7. Area enclosed by the boundary line and shaded positive flow area (PFA) at the cross-section B-B′ at 0.6 s: (a) half-moon graft and (b) crescent graft.
Applsci 09 00807 g007
Figure 8. Distributions of TAWSS (< 0.2 Pa), OSI (> 0.2) and RRT (> 10 Pa−1) for the half-moon-shaped (a) and crescent-shaped (b) pulmonary grafts: views from the bottom of the aortic arch.
Applsci 09 00807 g008
Figure 9. Stress distributions at t = 0.4 s (peak systolic pressure): (a) PTFE graft = 1000 MPa, (b) Cormatrix graft = 30 MPa, (c) pulmonary graft = 3 MPa, and (d) native tissue equivalent graft = 0.84 MPa.
Applsci 09 00807 g009
Figure 10. Stress distribution at t = 0.4 s along the graft location (a) and native tissue location (b).
Applsci 09 00807 g010
Table 1. Geometric difference between half-moon and crescent models in terms of cross-section areas at A-A′ and B-B′ as well as the centerline angle.
A-A′B-B′Centerline Angle
Half-moon429.3 m m 2 444.1 m m 2 155.85°
Crescent431.4 m m 2 335.3 m m 2 139.74°
Table 2. Cross-sectional areas, maximum velocities and mass flow rates of A-A′ and B-B′ at both 0.4 s and 0.6 s.
Area   ( m m 2 )   at   0.4   s Area   ( m m 2 )   at   0.6   s V m a x   ( m / s )   at   0.4   s V m a x   ( m / s )   at   0.6   s m ˙ (kg/s) at 0.4 s m ˙ (kg/s) at 0.6 s
Half-moon
(A-A′)
454.8437.70.2360.0730.085920.01905
Crescent
(A-A′)
480.4464.40.2370.0700.095550.02070
Half-moon
(B-B′)
484.1461.00.1700.0920.049260.01735
Crescent
(B-B′)
367.0354.40.2240.0750.050900.01771
Table 3. Cross-sectional areas and peak velocities of B-B′ at 0.4 s and 0.6 s.
Area   ( m m 2 )   at   0.4   s Area ( m m 2 ) at 0.6 s V m a x   ( m / s )   at   0.4   s V m a x   ( m / s )   at   0.6   s
PTFE447.5437.50.18940.0894
Cormatrix466.2448.90.18110.0916
Pulmonary484.1461.00.17010.0924
Native tissue510.3478.00.16220.0934

