1. Introduction
Estuaries are fresh water and salt water mixing zones that connect the continental limit with the coastal zones. The interaction between these two water bodies (fresh and salty) with such different properties, geomorphological characteristics and acting dynamics (tide, river flow, swell, etc.), generate highly productive ecosystems with a great variety of habitats that are relevant for the conservation of biodiversity, and the refuge of migratory birds and aquatic biota. In addition, they have a high landscape and socioeconomic value (fishing, small industry, ranching, agriculture and tourism amongst others).
Therefore, in order to conserve these spaces, it is fundamental to improve the understanding of the origins and evolution of these environments [
1,
2,
3].
In this regard, tidal channel networks are one of the most important morphologic features, as they are the main route for the transportation of water, sediments and nutrients in intertidal and coastal zones [
4,
5]. Therefore, they play an essential role in the functioning of estuarine ecosystems under the influence of the tide.
However, in these types of natural spaces the empirical data are relatively limited in terms of what the initial formation and the evolution of tidal channels refers to [
6]. This is probably due to the fact that most of the observable channels in the field are currently in balance [
7]. Therefore, the initial formation of tidal channel networks can better be studied after the restoration or creation of new intertidal areas, since this provides the opportunity to start from an unchanneled landscape [
6].
Based on the above, this study aims to obtain empirical data on the formation and evolution of tidal channels towards a balance by analyzing the consequences that conditioning works can have on the morphology of the estuary. For this purpose, a restored intertidal area, such as the Oyambre estuary, was selected as the area to be studied.
2. Study Area
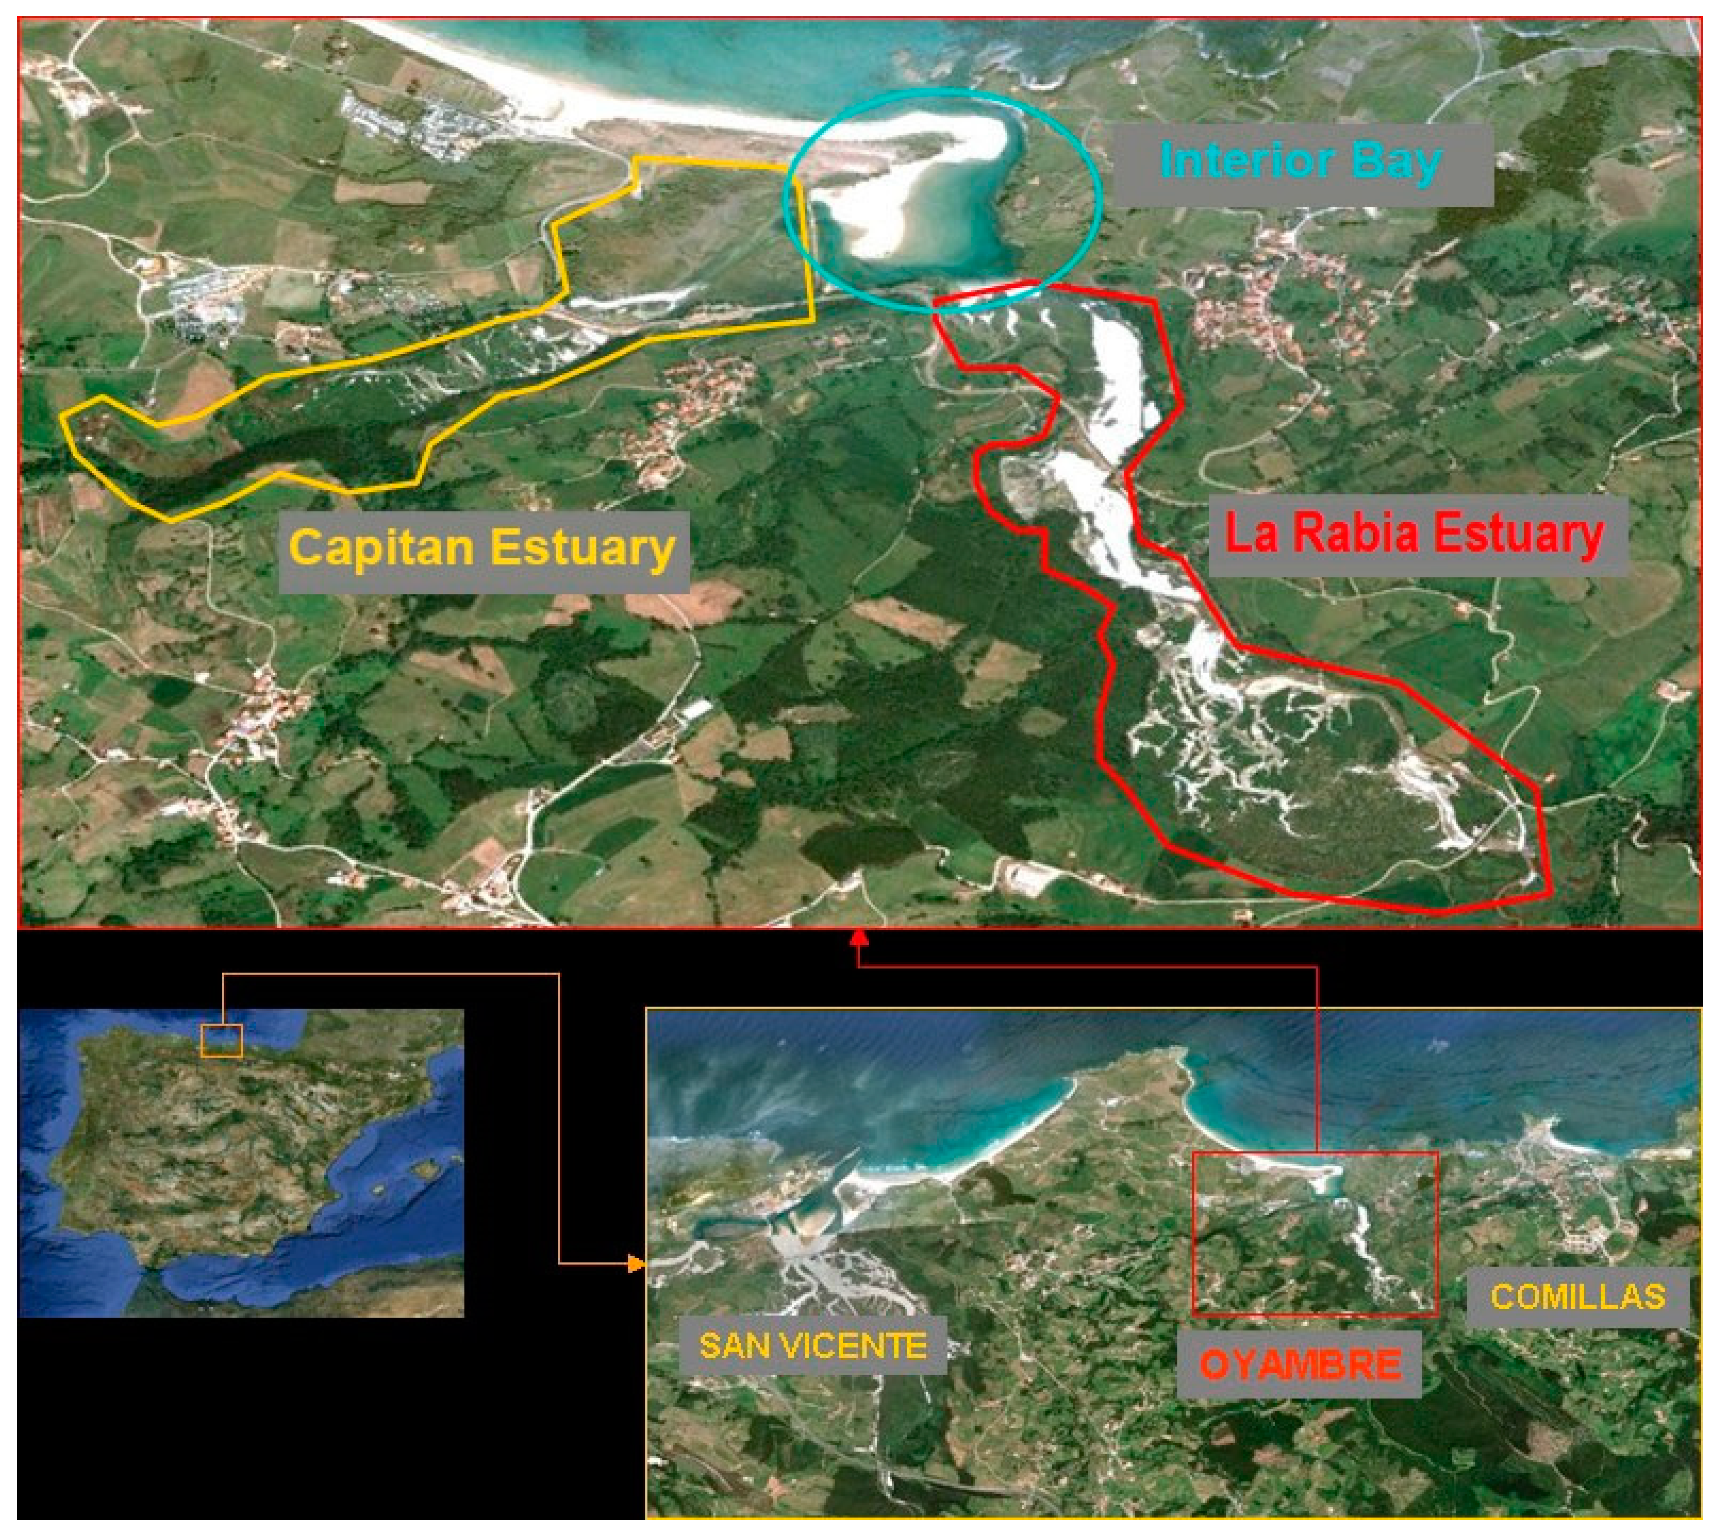
The Oyambre estuary is located in Cantabria (north of Spain) between the villages of Comillas to the east, and San Vicente to the west. It occupies an area of approximately 100 hectares and has a perimeter of about 13.6 km. One of its main characteristics is that it has two arms of the sea joined by an interior bay. They are shaped by the mouth of numerous streams small in size and of local character, with both solid and reduced liquid contributions. One of its arms, called the estuary of the Capitán, is located at its most western end, with a west-east orientation. In the eastern area, heading north-south, is the Zapedo estuary, more commonly known as the La Rabia estuary.
Figure 1 shows the location and general view of the studied area.
On the other hand, the contribution of fresh water comes from the surface runoff of the upper parts close to the estuary, through which small rivers and streams flow. The Turbio river is the largest river, and flows into the upper part of the La Rabia estuary, which has a markedly seasonal character.
Over time, the estuaries of Cantabria, including the marshes of Oyambre, have suffered from human intervention through the occupation of the land maritime domain or the creation of enclosures that modify the natural hydrodynamics of the system causing a significant reduction of its flood zone.
As a consequence of anthropic actions in the Oyambre estuary, there is a frequent rupture of the natural physiographic forms because of the great number of constructions that it shelters, which have clogged the closed channels and raised its riverbed, with respect to the free reaches of the estuary.
In order to recover its ecological functionality, a series of environmental restoration works have been carried out on the La Rabia estuary. The water flow of the road that crosses this estuary has been modified with the aim of returning the environment to its natural tidal dynamics.
In this sense, the La Rabia estuary provides a natural laboratory suitable for the study of restored intertidal areas, where it is possible to analyze and improve the understanding of the morphological evolution of an estuary on its way to a new state of balance.
3. Materials and Methods
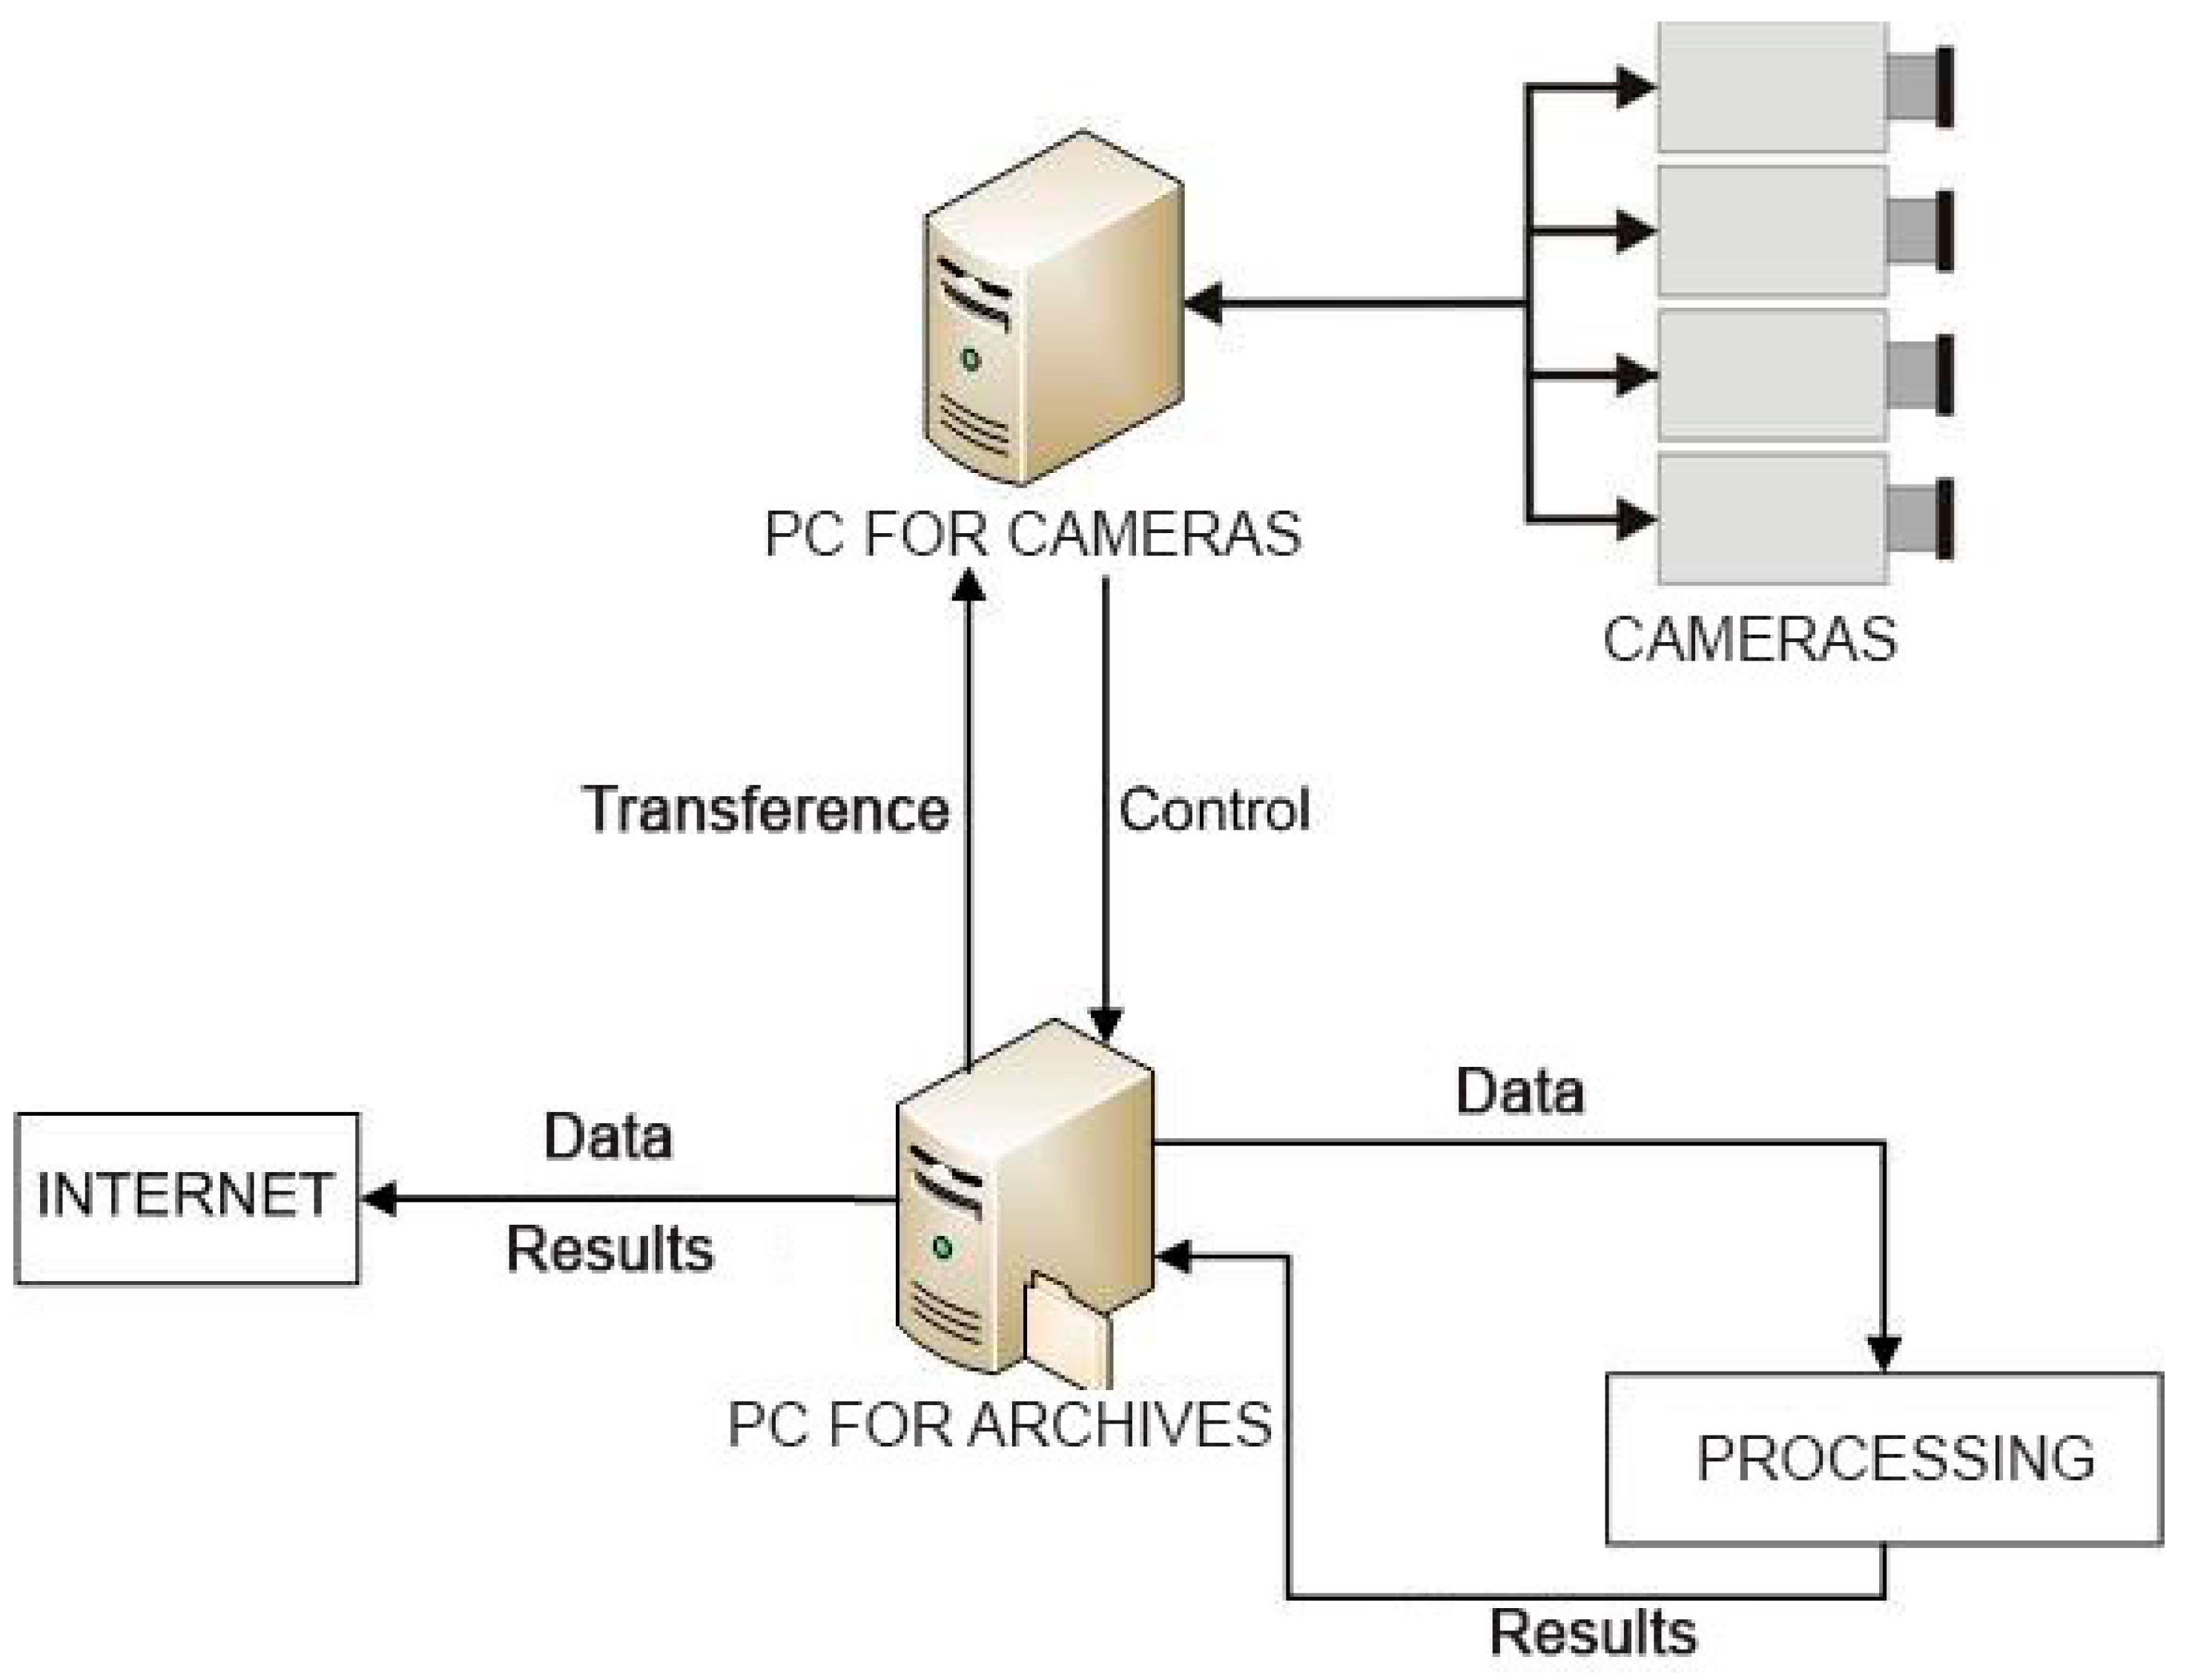
To monitor the restoration work, a HORUS type video monitoring system was chosen, the scheme of which is shown in
Figure 2. The system consists of a battery of digital cameras, which were placed in several locations of a certain height (posts, buildings, etc.) so that we could observe the entire study area. The cameras were connected to a local computer that stored the information and transmitted it to another processing computer in real time, which is where the image processing software is installed.
The number and location of cameras that need to be installed in a monitoring station is defined according to the dimensions of the study area. To this effect, it is important to take into account concepts such as spatial resolution, which refers to the minimum size that an object must have to be recognized within the image, and which depends on the distance to the camera of the region of interest and the number of pixels that its sensor has [
8].
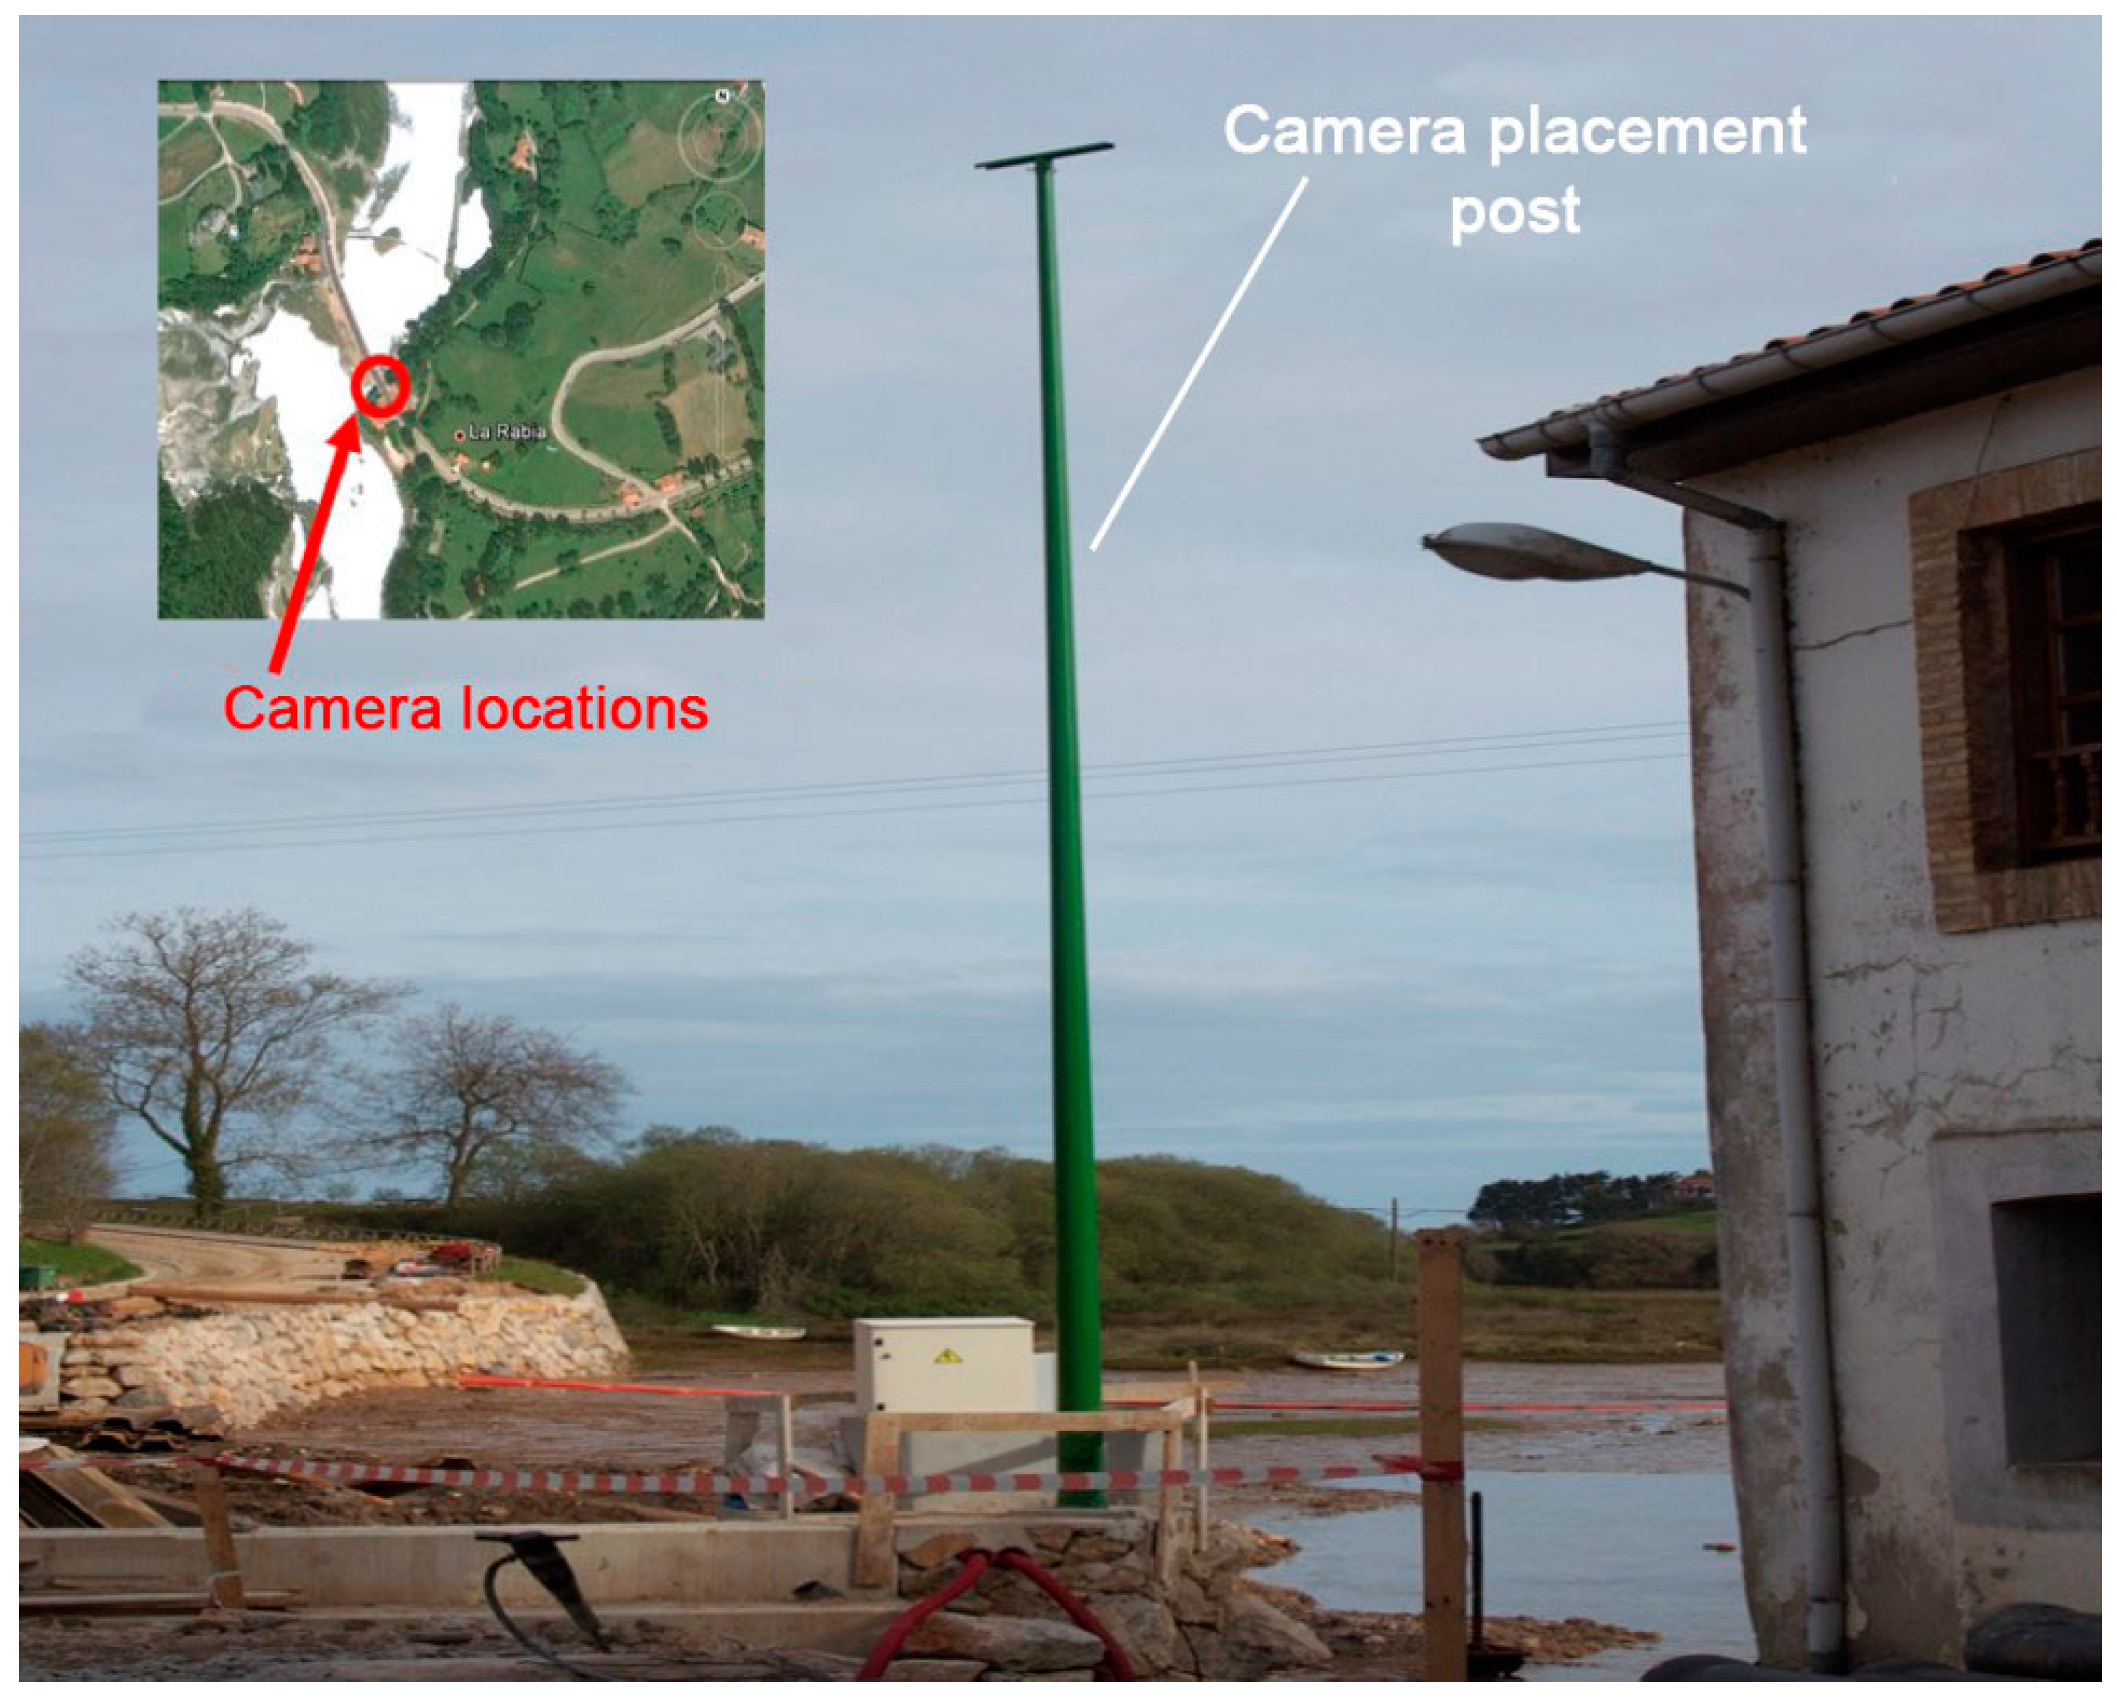
In this case, we decided to use the battery of three cameras (Stingray F-504C model from the AVT company) on a 12-m post, in the south end of the bridge, as can be seen in
Figure 3.
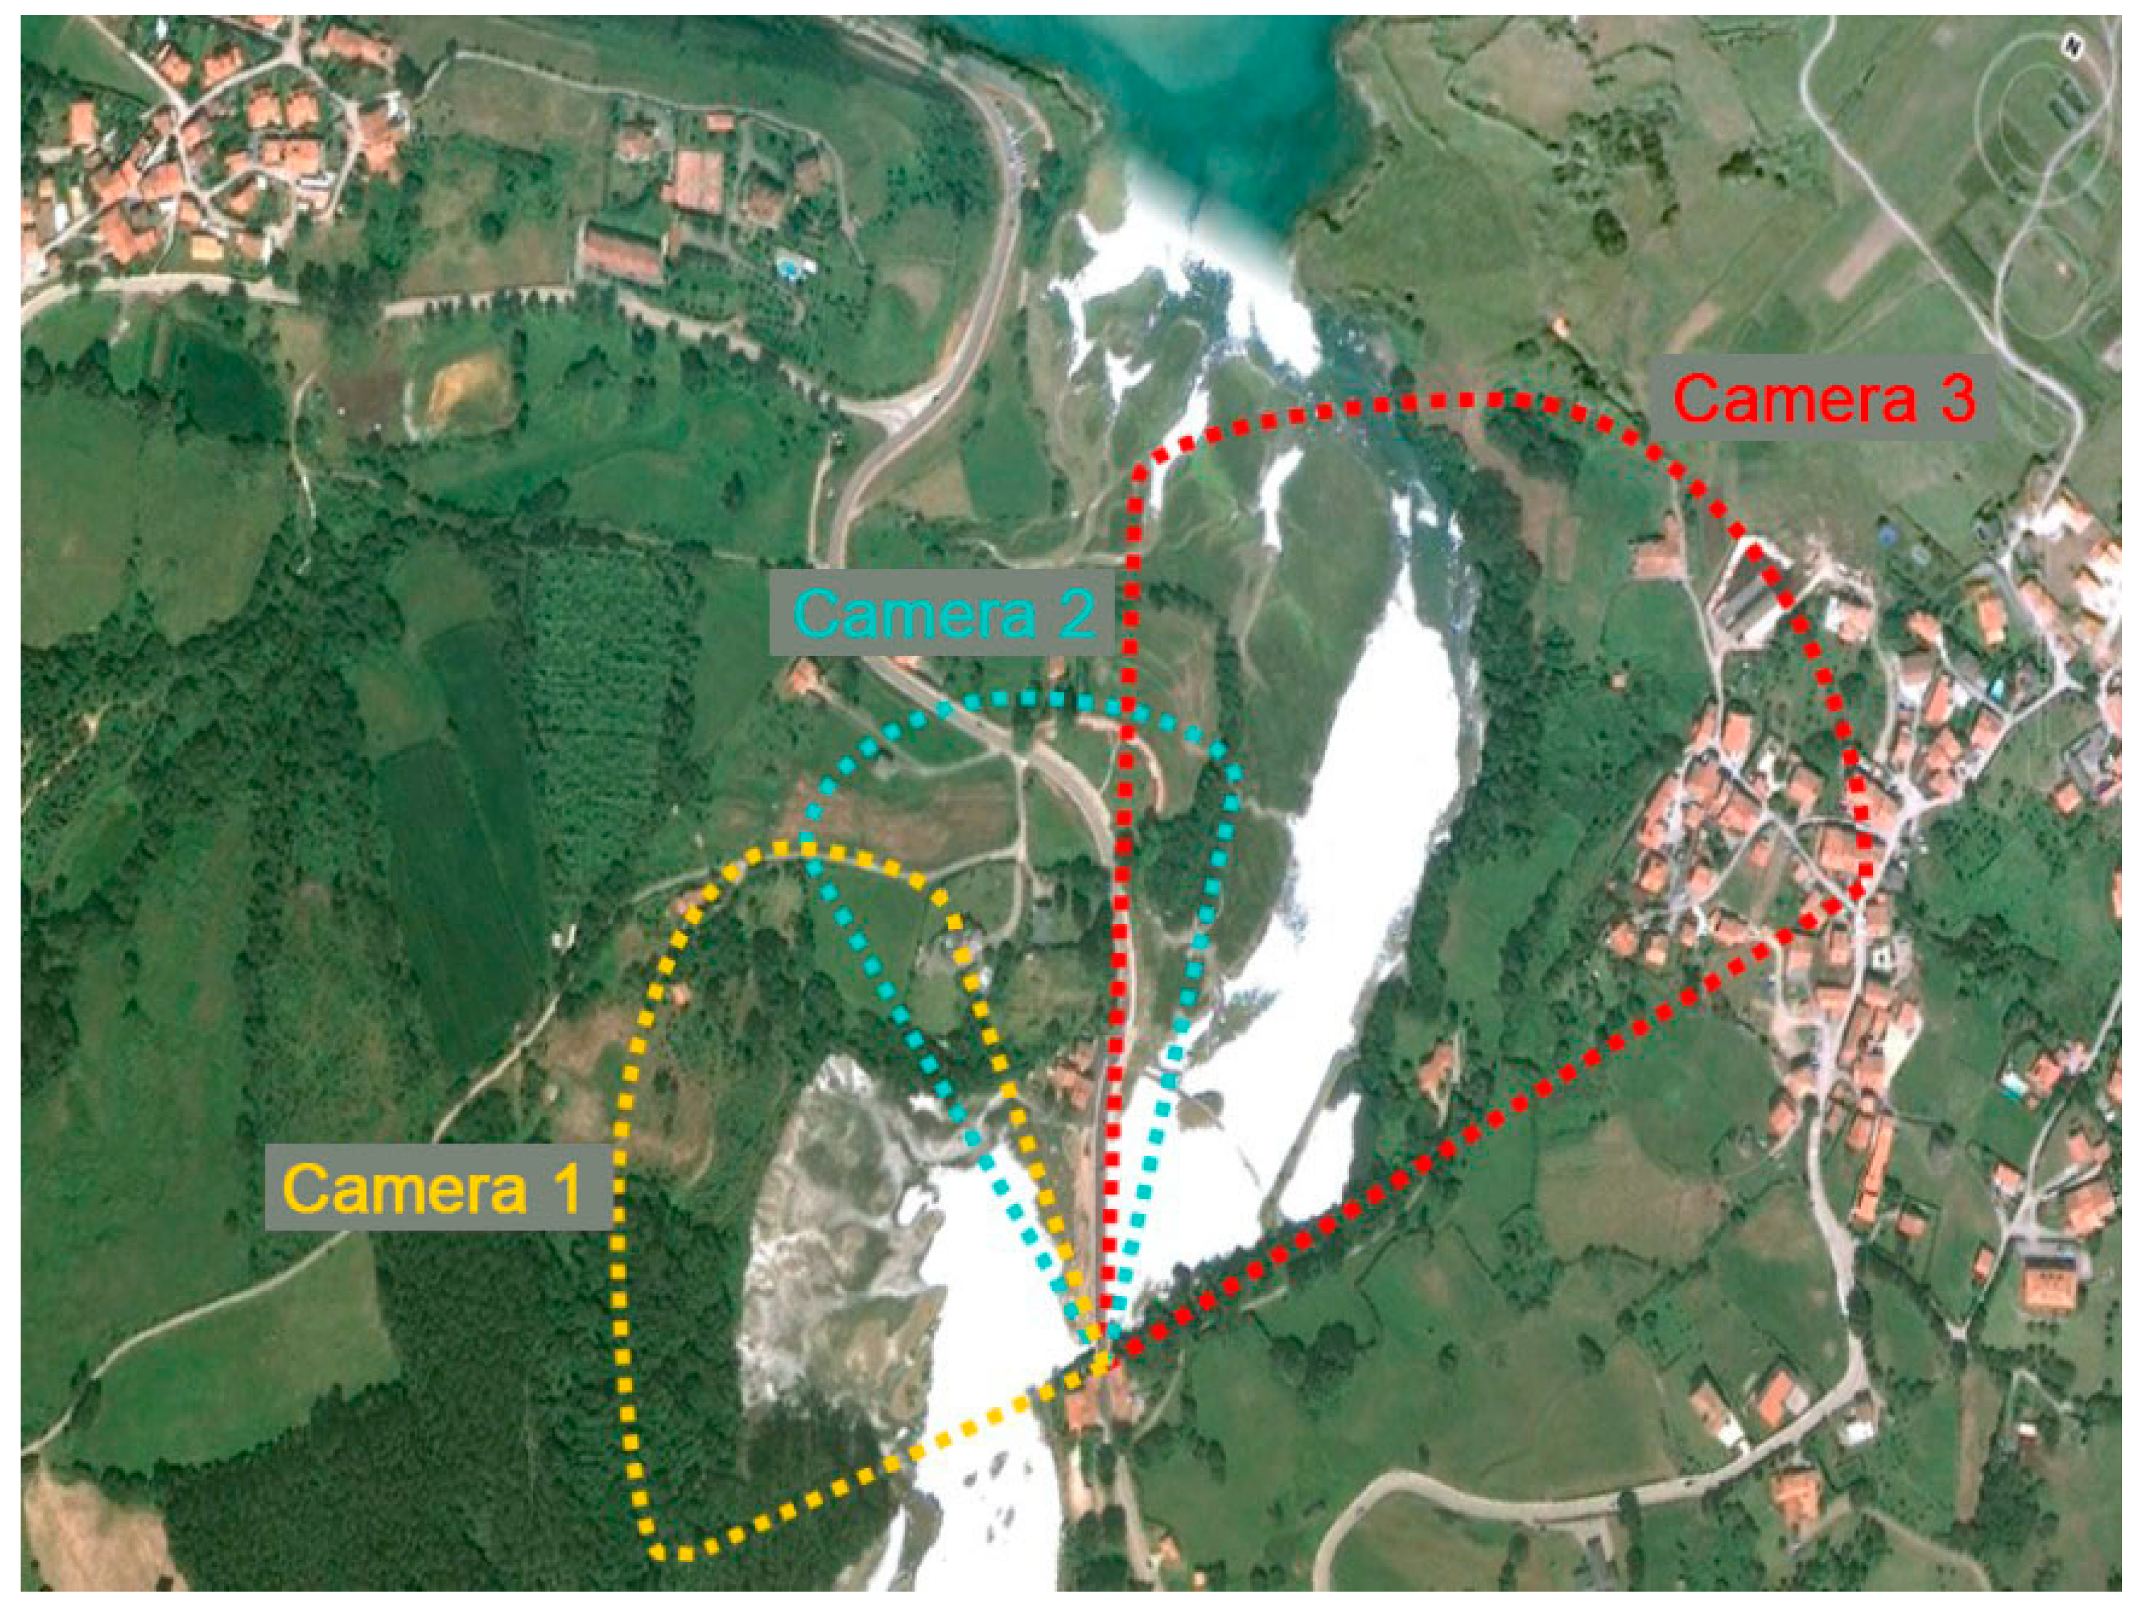
On the other hand,
Figure 4 shows the orientation and area of coverage of each of the cameras installed in the La Rabia estuary, depending on the orography and their resolution.
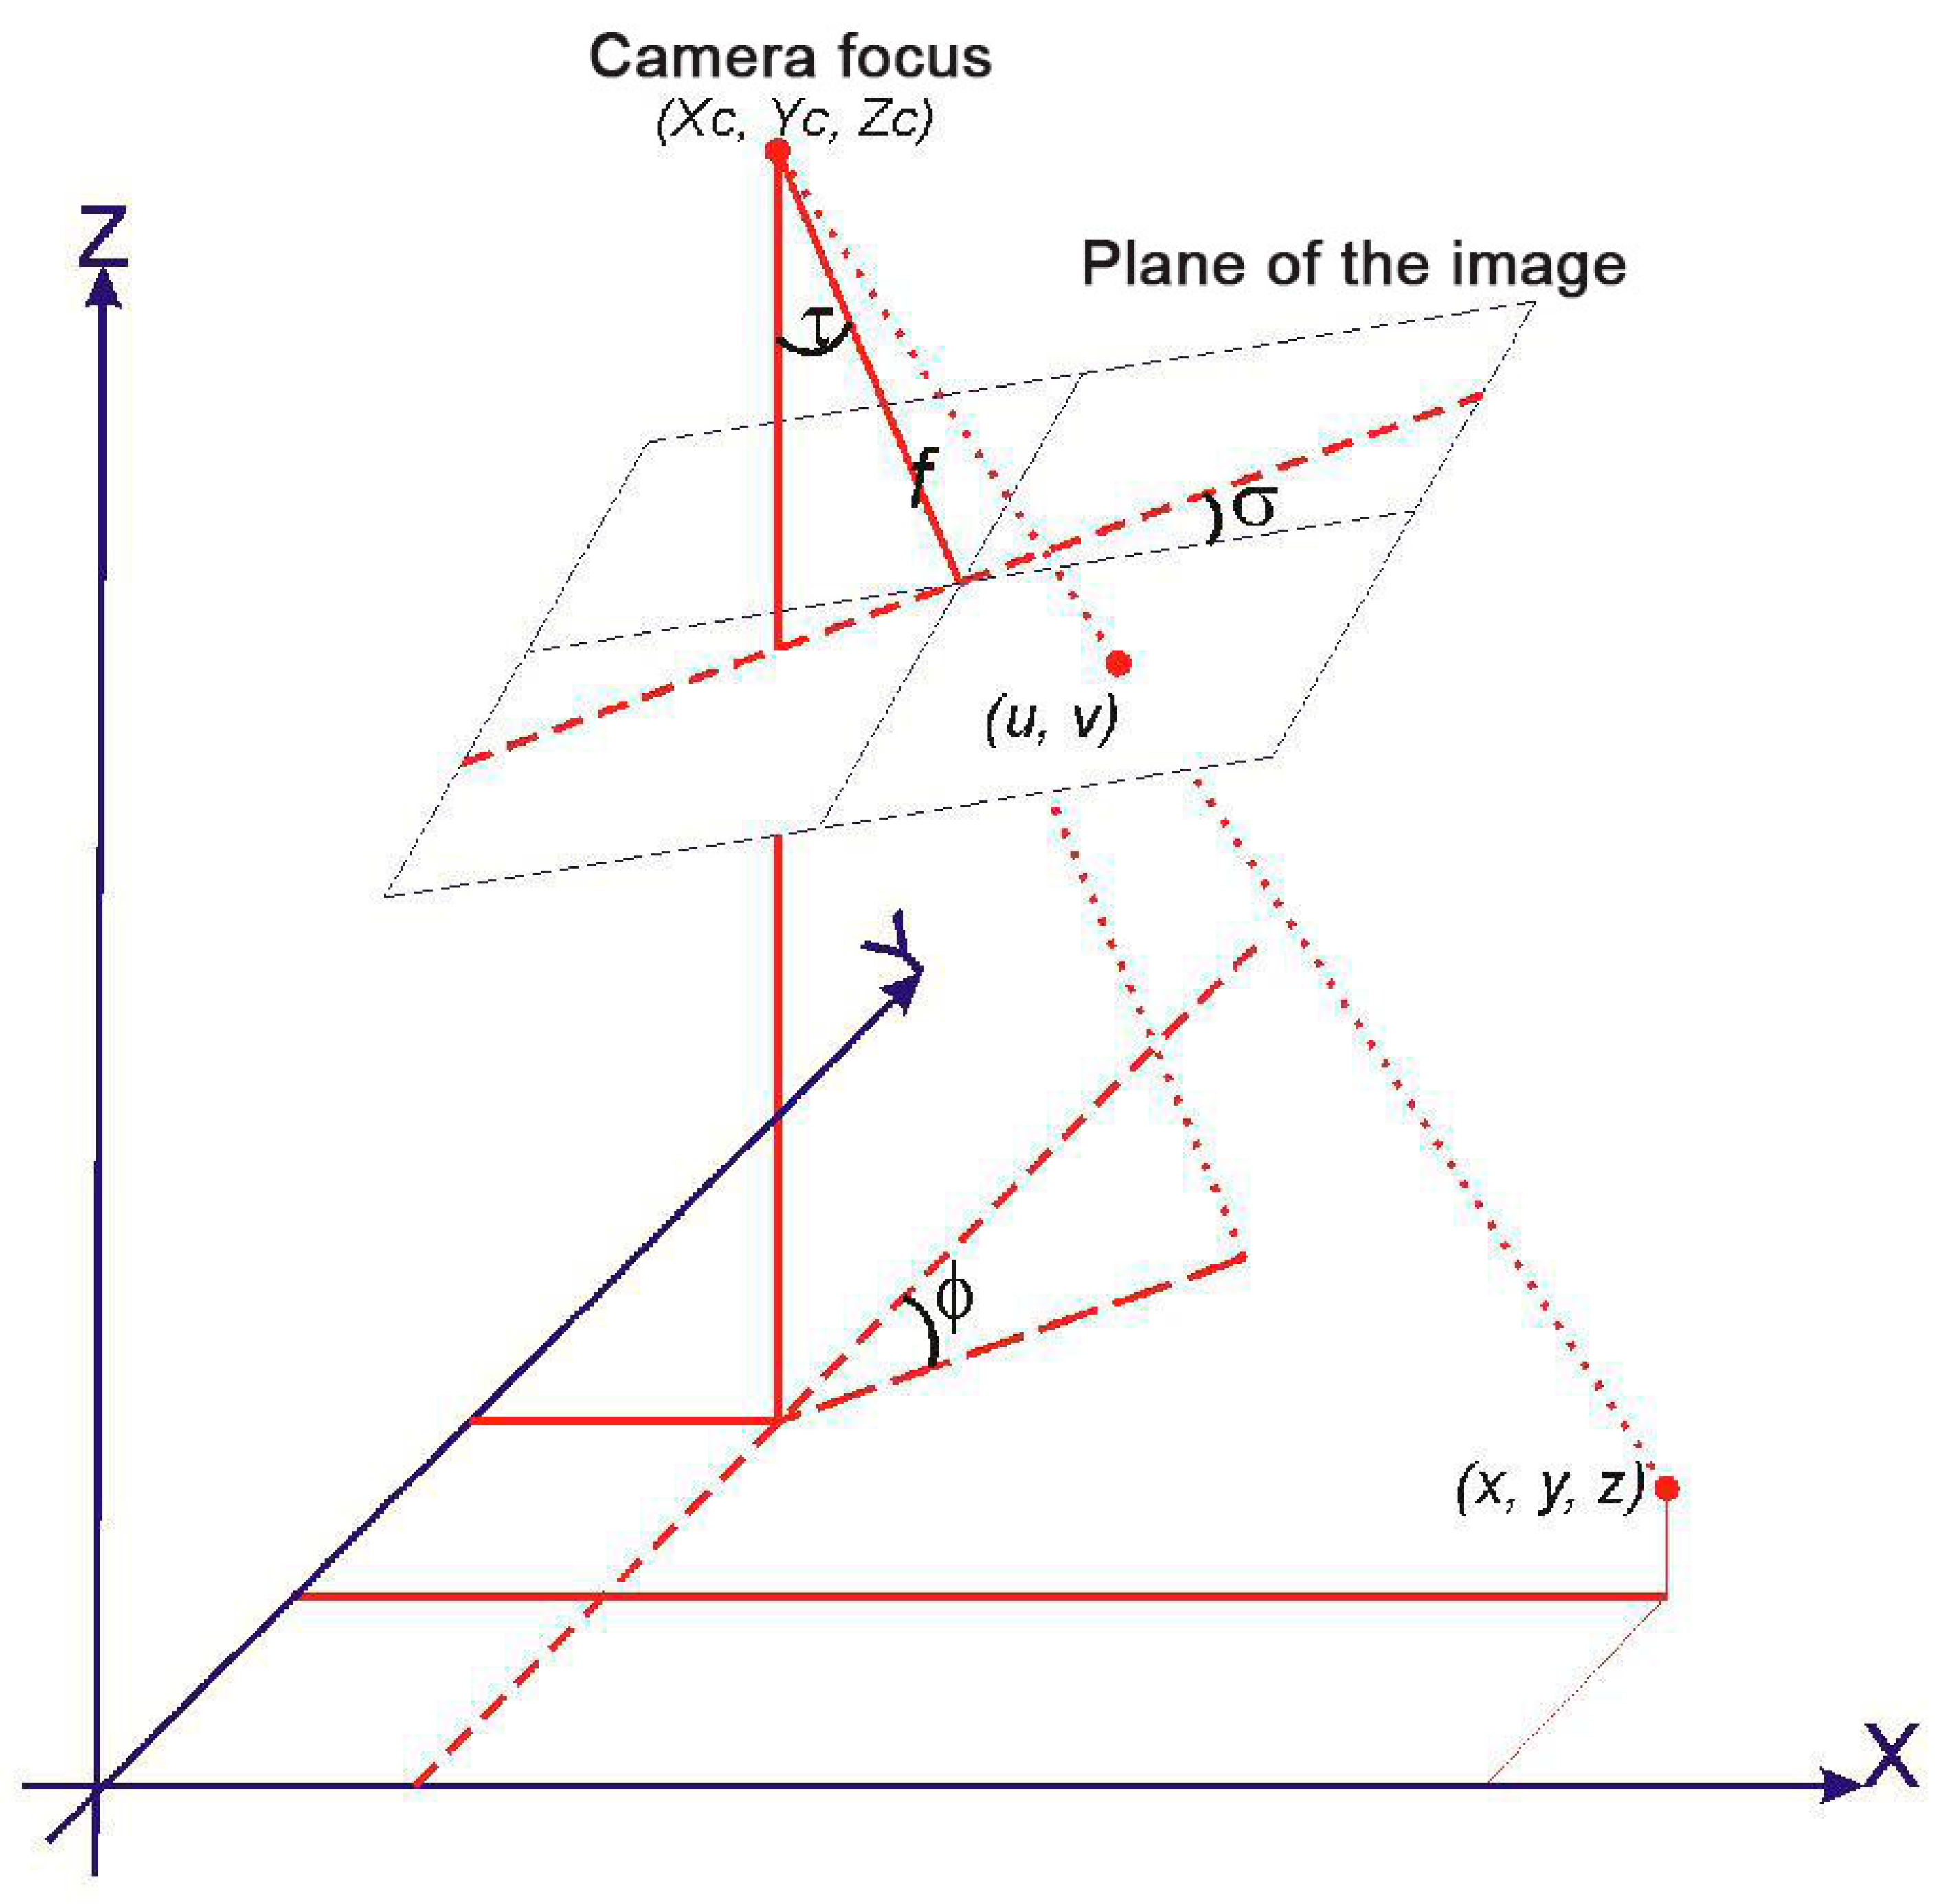
It is important to calibrate the camera before associating an image to a real word coordinate system (x, z, y). For this purpose, the HORUS software provides the pinhole model [
9] based on the principle of collinearity, in which each point of an object in space is projected into the image by a straight line passing through the focal point of the camera. Thus, the coordinates of the camera’s focus (Xc, Yc, Zc) are established according to the coordinate system of the object. Then, a point from the object is taken in space (x, y, z) and its corresponding projection in the image will be found in the coordinate points u, v [
8] as can be seen in
Figure 5.
For the HORUS system to solve the pinhole model, it is necessary to know the position (x, y, z) of at least six points that appear within the image, called ground control points (GCP).
With the aim of applying the calibration process previously described to the La Rabia estuary monitoring station, a topographic field campaign was carried out to determine the position of certain observable points in the space from the three cameras of the station.
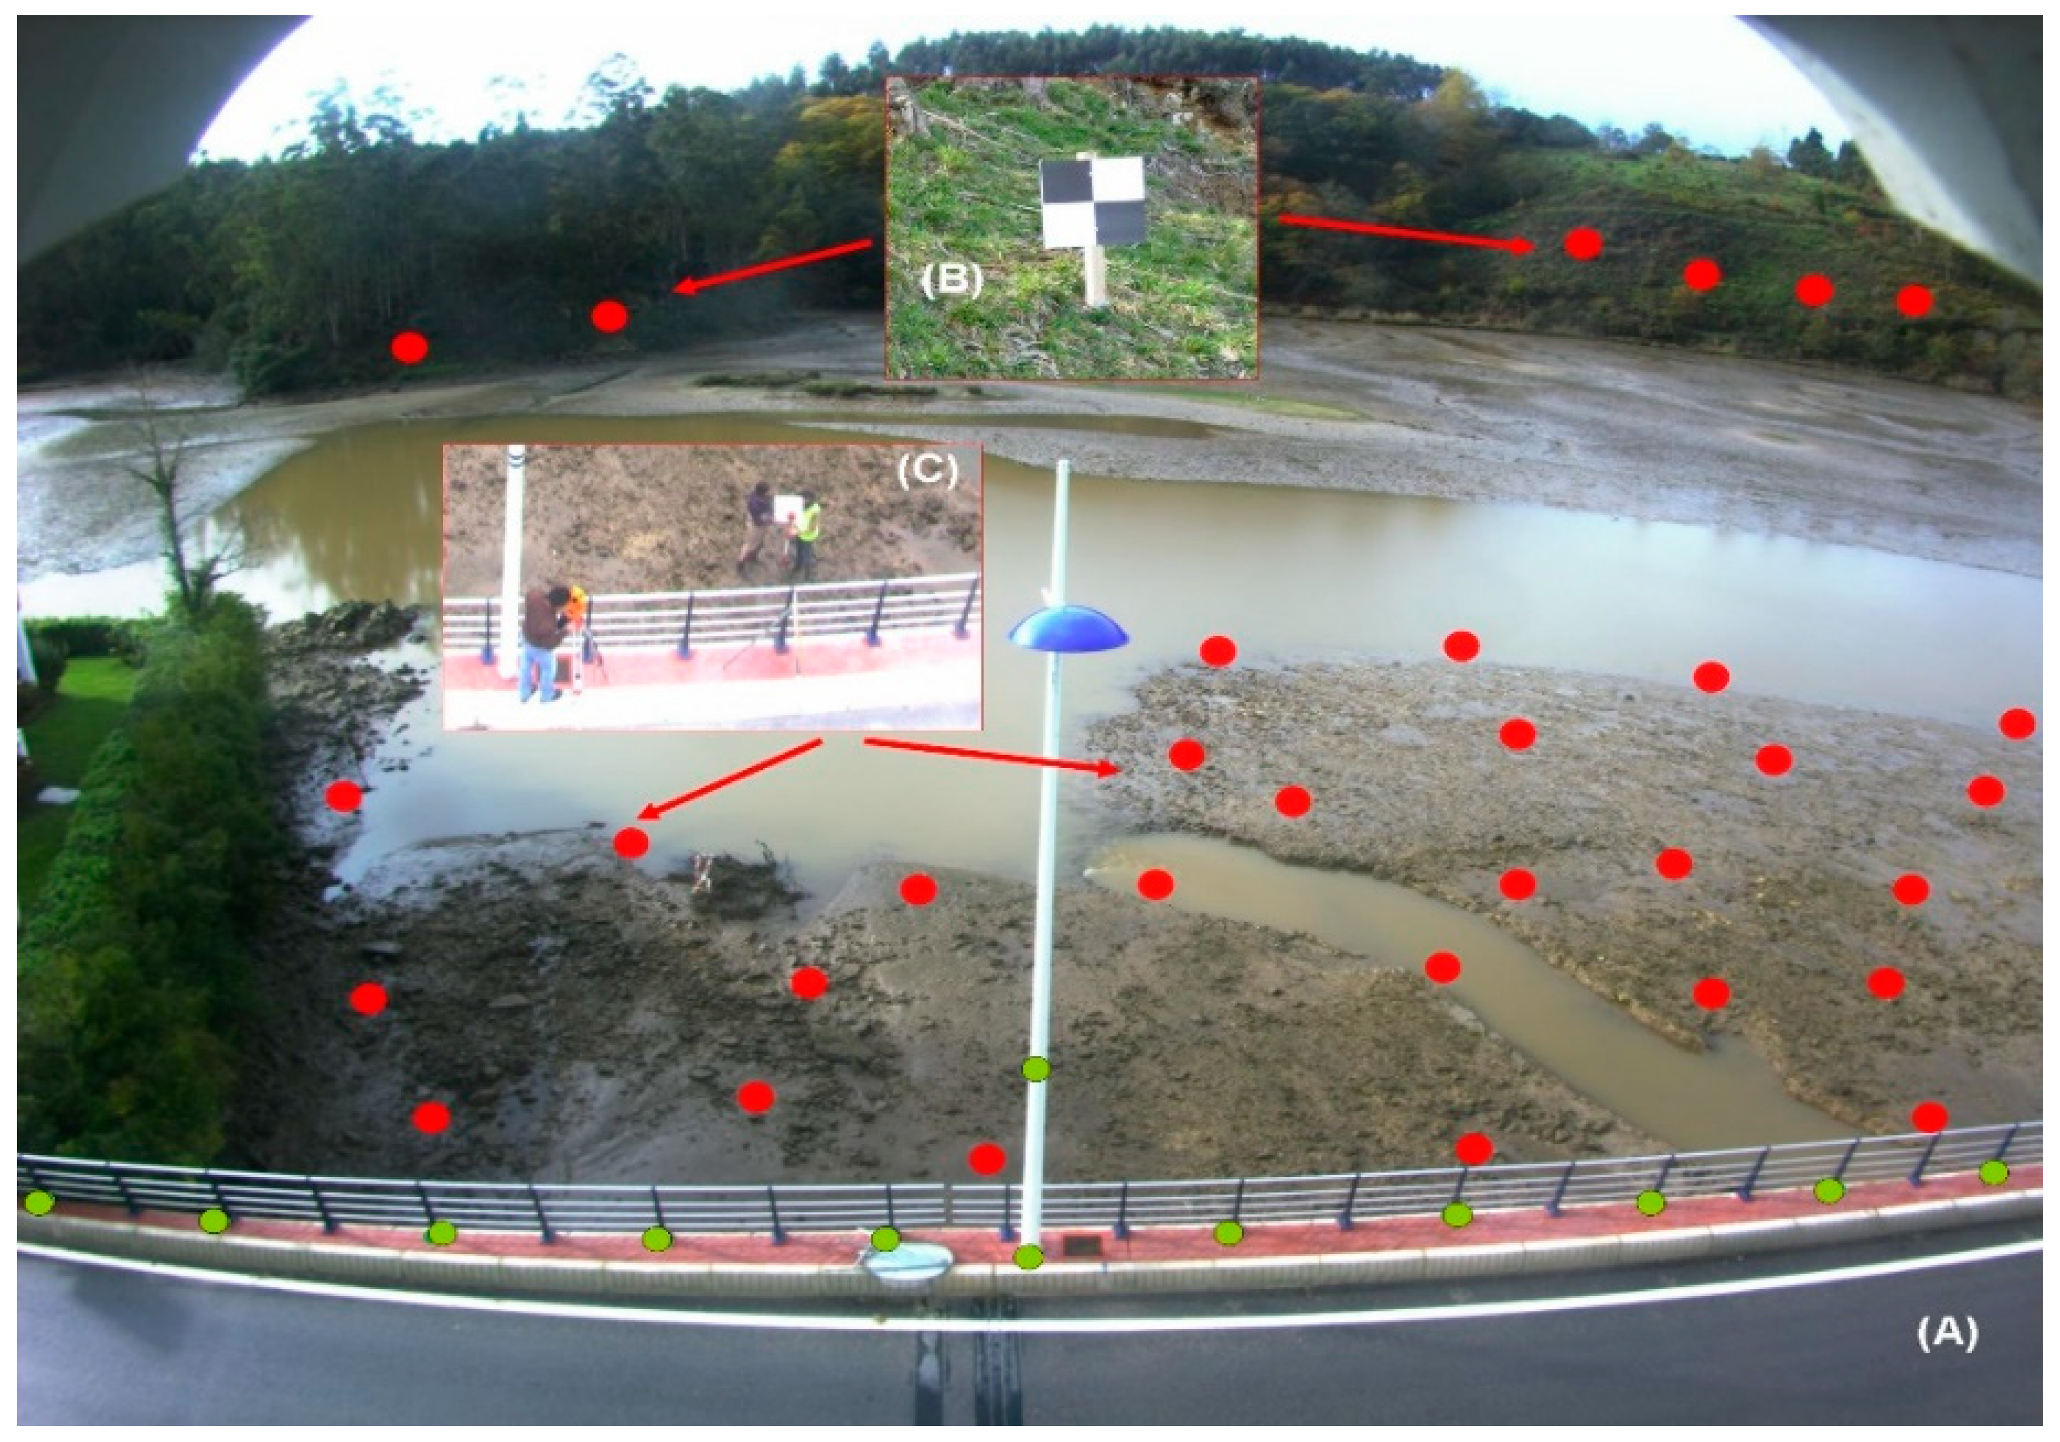
Figure 6 shows all of the control points selected for Camera 1. In the first place, the bases of the bridge’s footbridge were taken as fixed points (green circles in
Figure 6a). On the other hand, due to the fact that there is no type of building that allows any GCP to be fixed beyond the bridge, we opted for the construction of flat and square plastic targets with a vinyl layer (
Figure 6b) which facilitates image visualization while ensuring high longevity in exposed areas close to the coast. These targets were coupled to wooden structures in order to establish fixed points on the hillsides in front of Camera 1 (
Figure 6b,c).
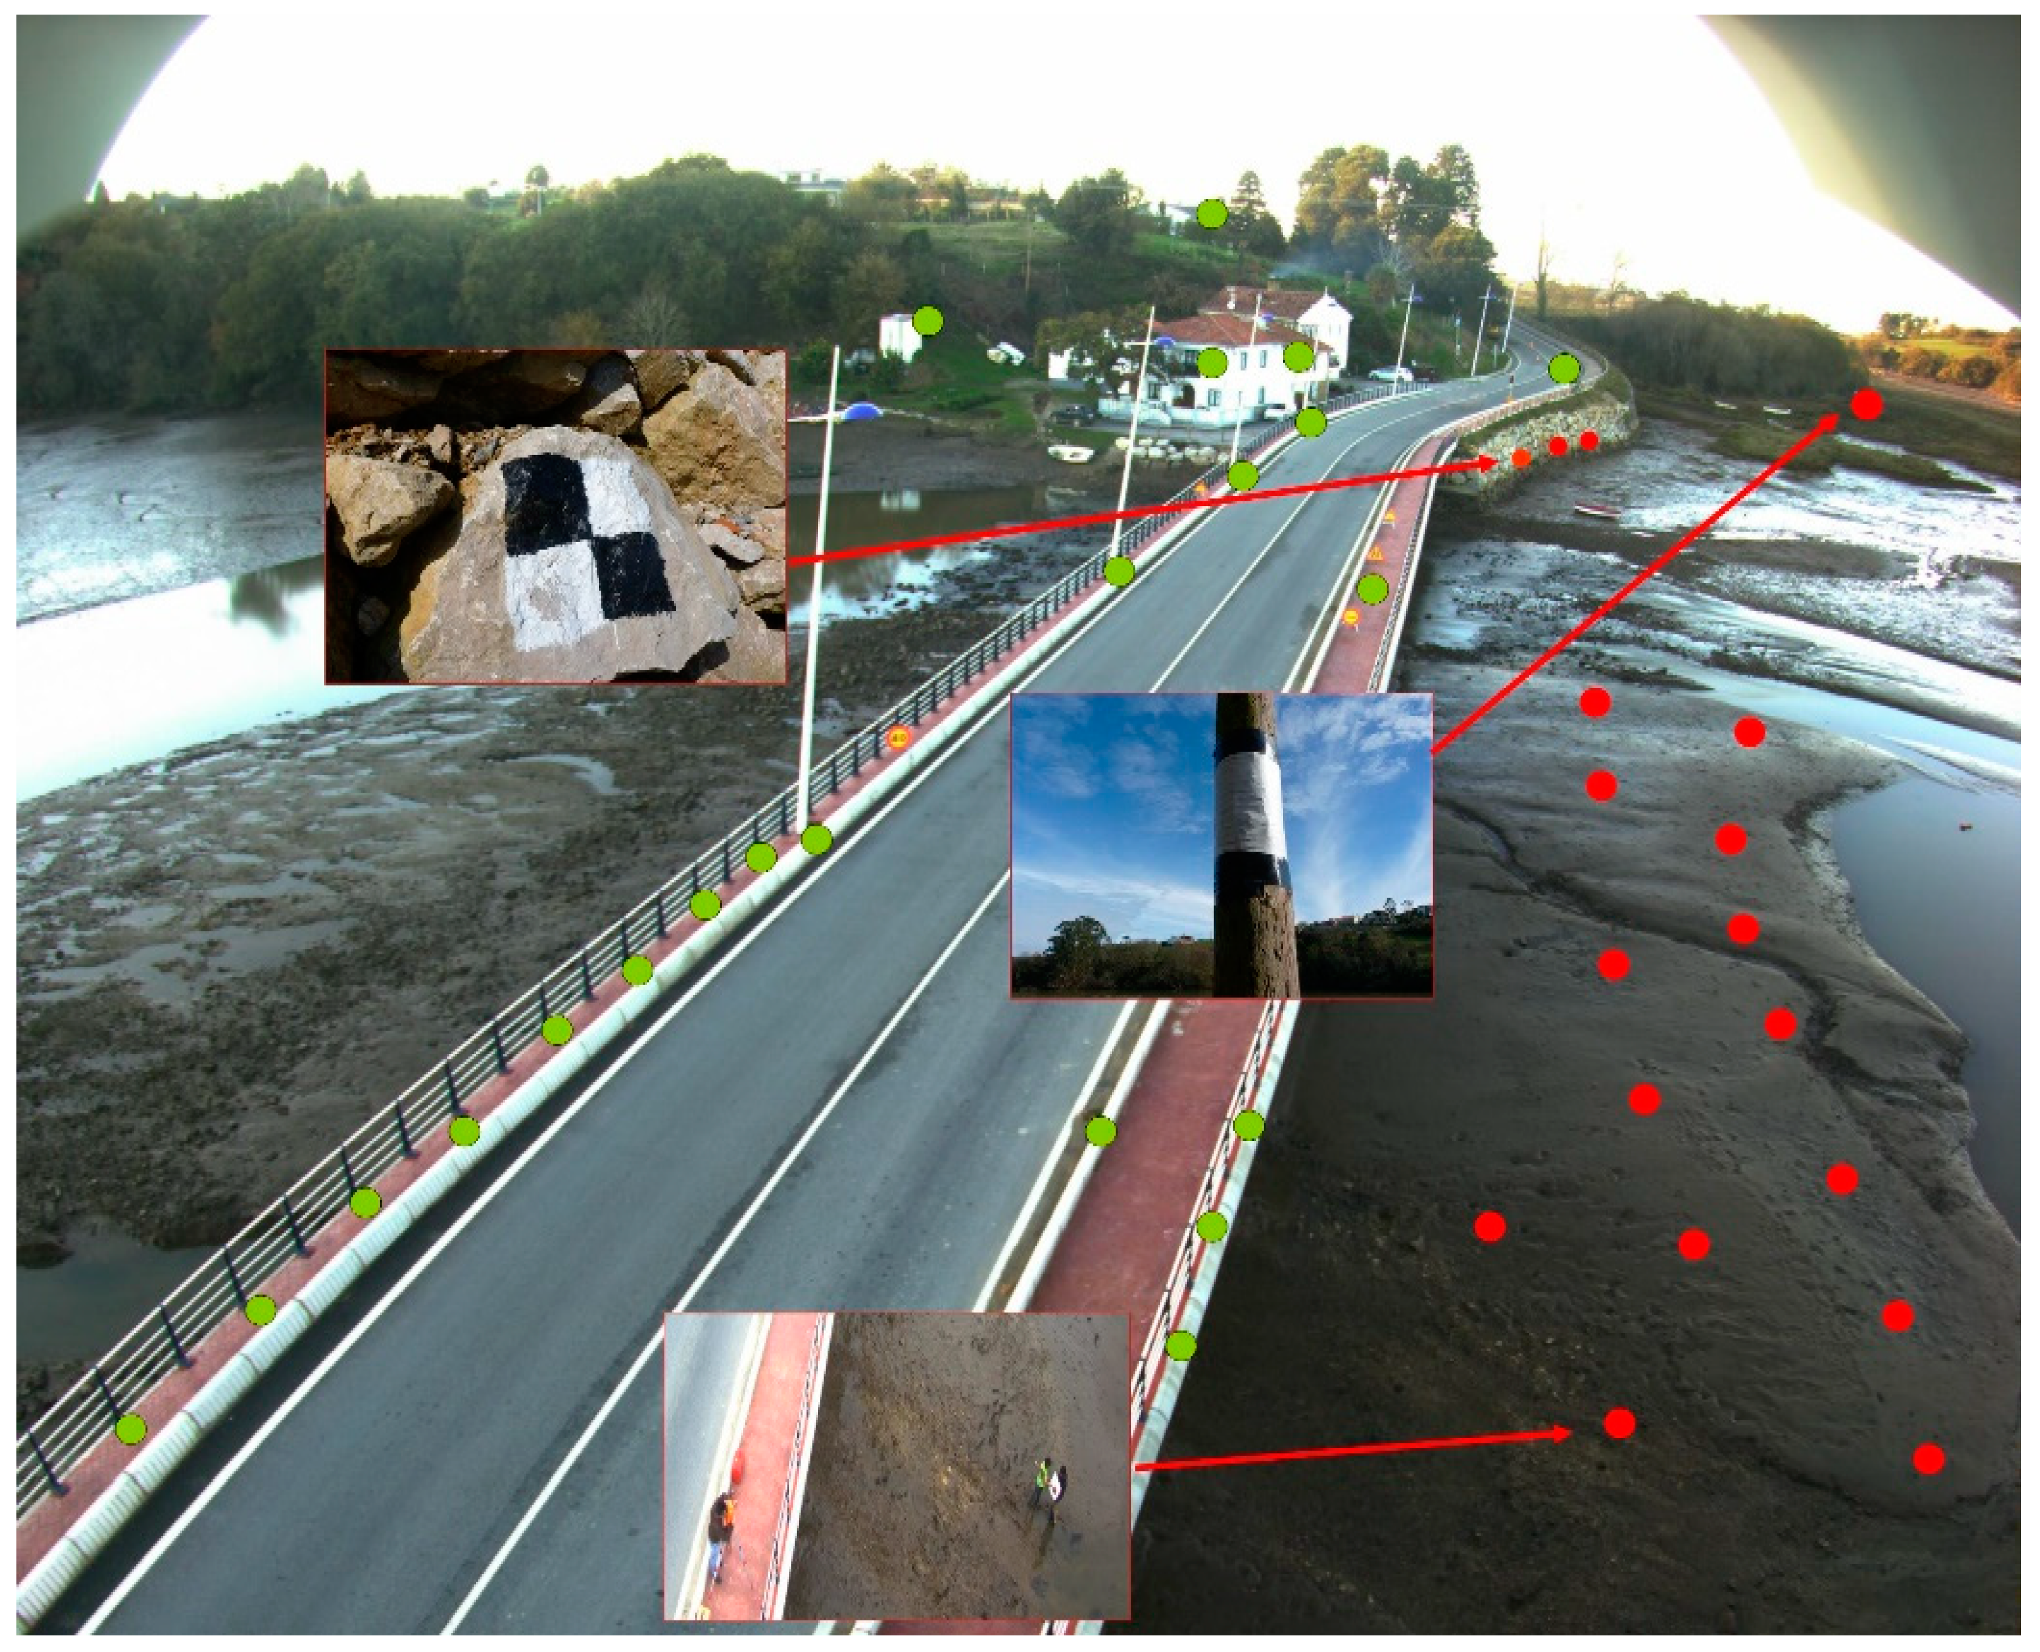
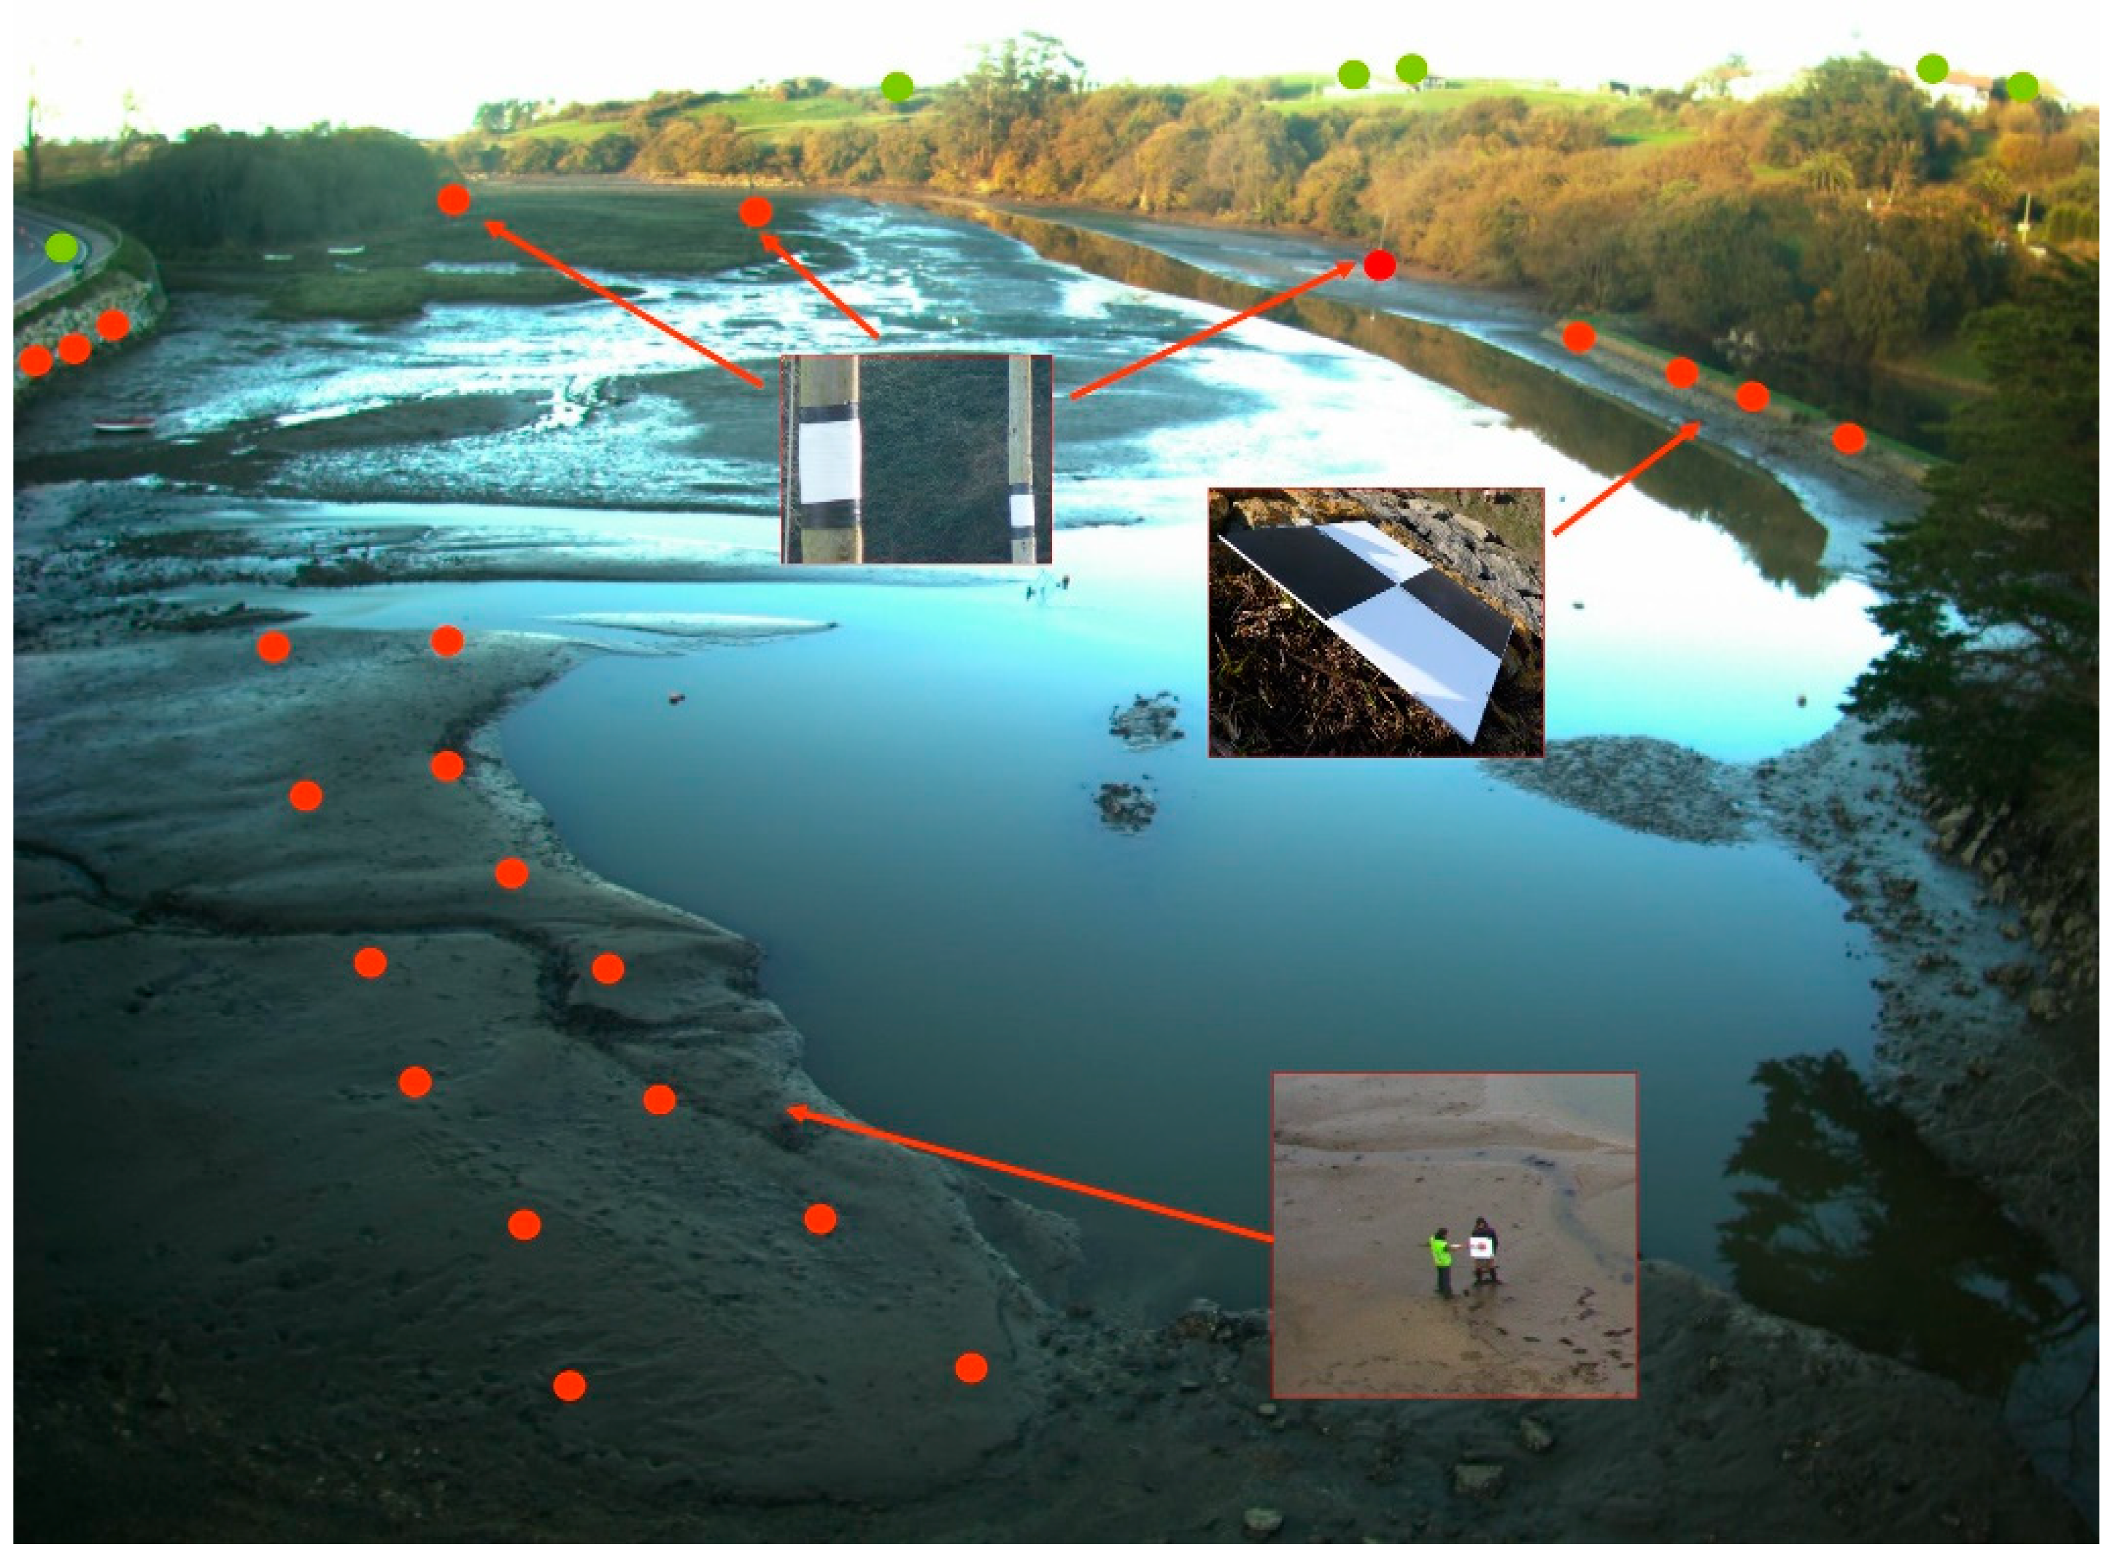
Following the same process for Camera 2 and Camera 3 of the “La Rabia” station, the control points shown in
Figure 7 and
Figure 8 were taken, where the green circles indicate that they are fixed control points, while the red circles refer to those taken with the targets.
In total, 47 control points were established for Camera 1, 40 for Camera 2, and 29 for Camera 3. This number of control points allows us to select a combination of six elements that provide more area information about the image that we want to study.
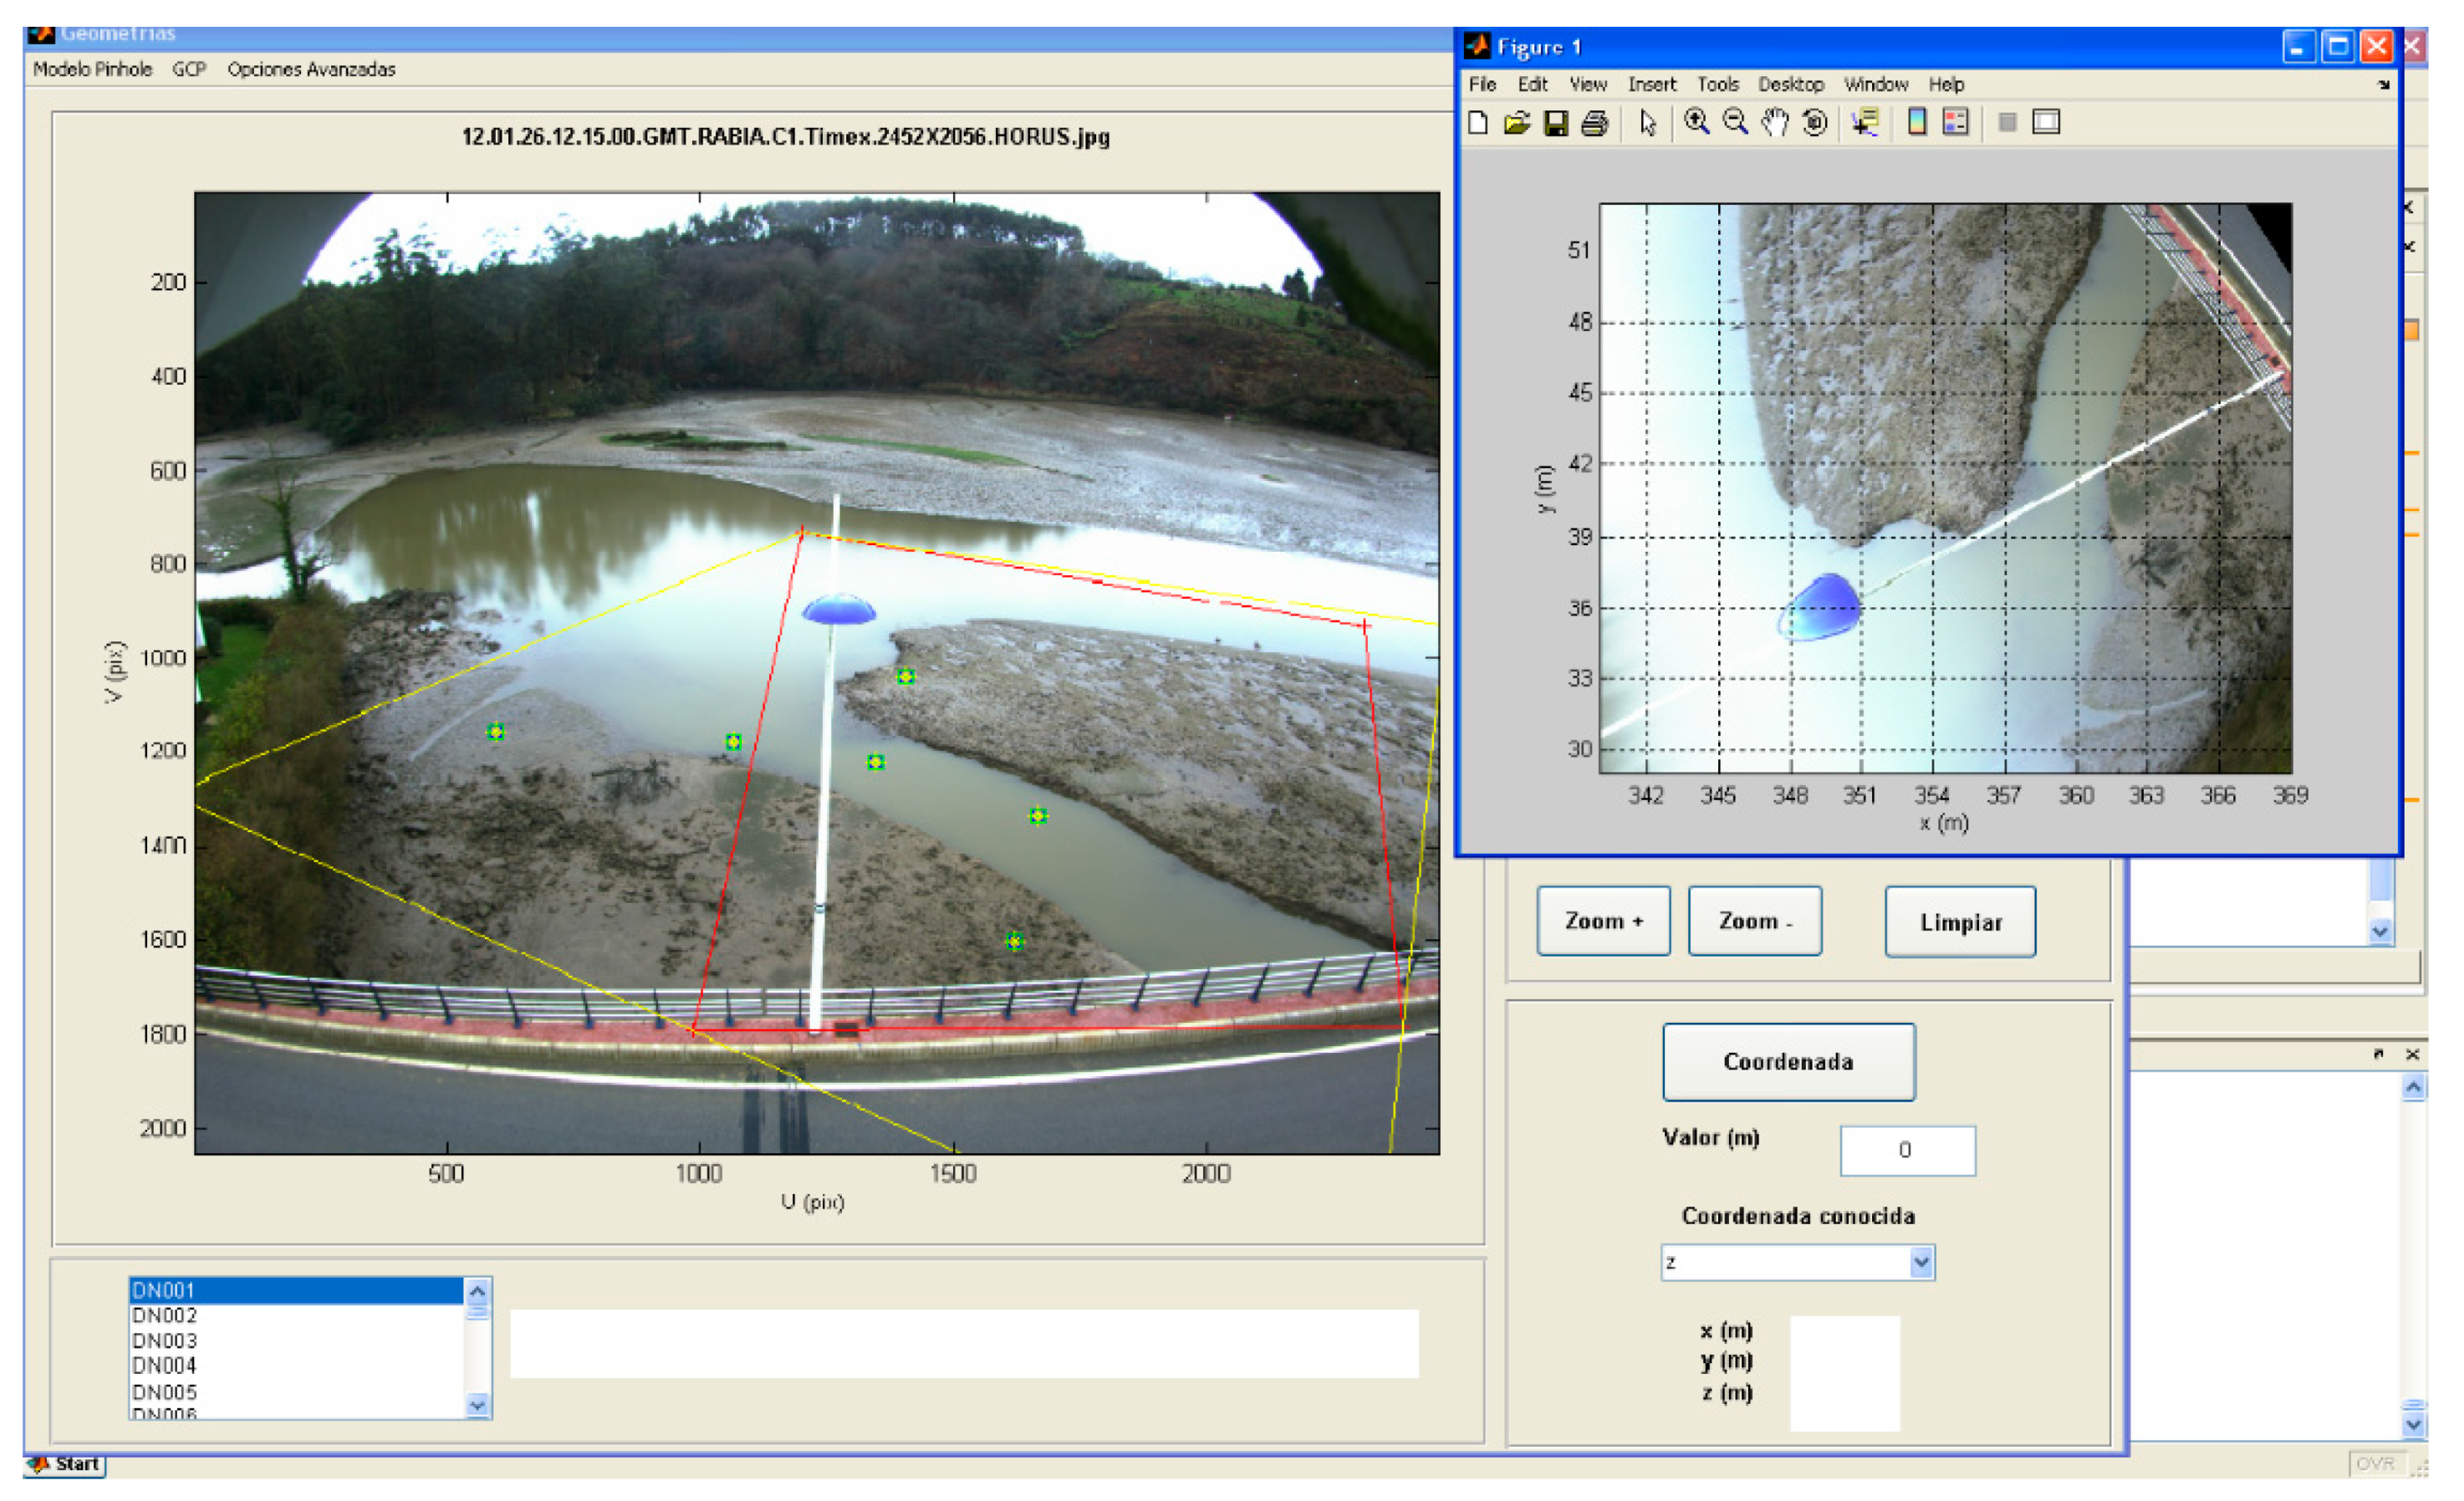
Once the calibration models of the cameras have been resolved, it is possible to obtain quantitative information by the means of post-image processing. For this, it is important to obtain images of constant spatial resolution, i.e., that each pixel of the image is equivalent to the same distance in meters as in the real-world coordinate system.
This rectification process can be performed within the HORUS system by defining a region of interest on the oblique image (in UV coordinates) and then projecting the properties of each pixel of that image onto its corresponding pixel in the rectified image (
Figure 9).
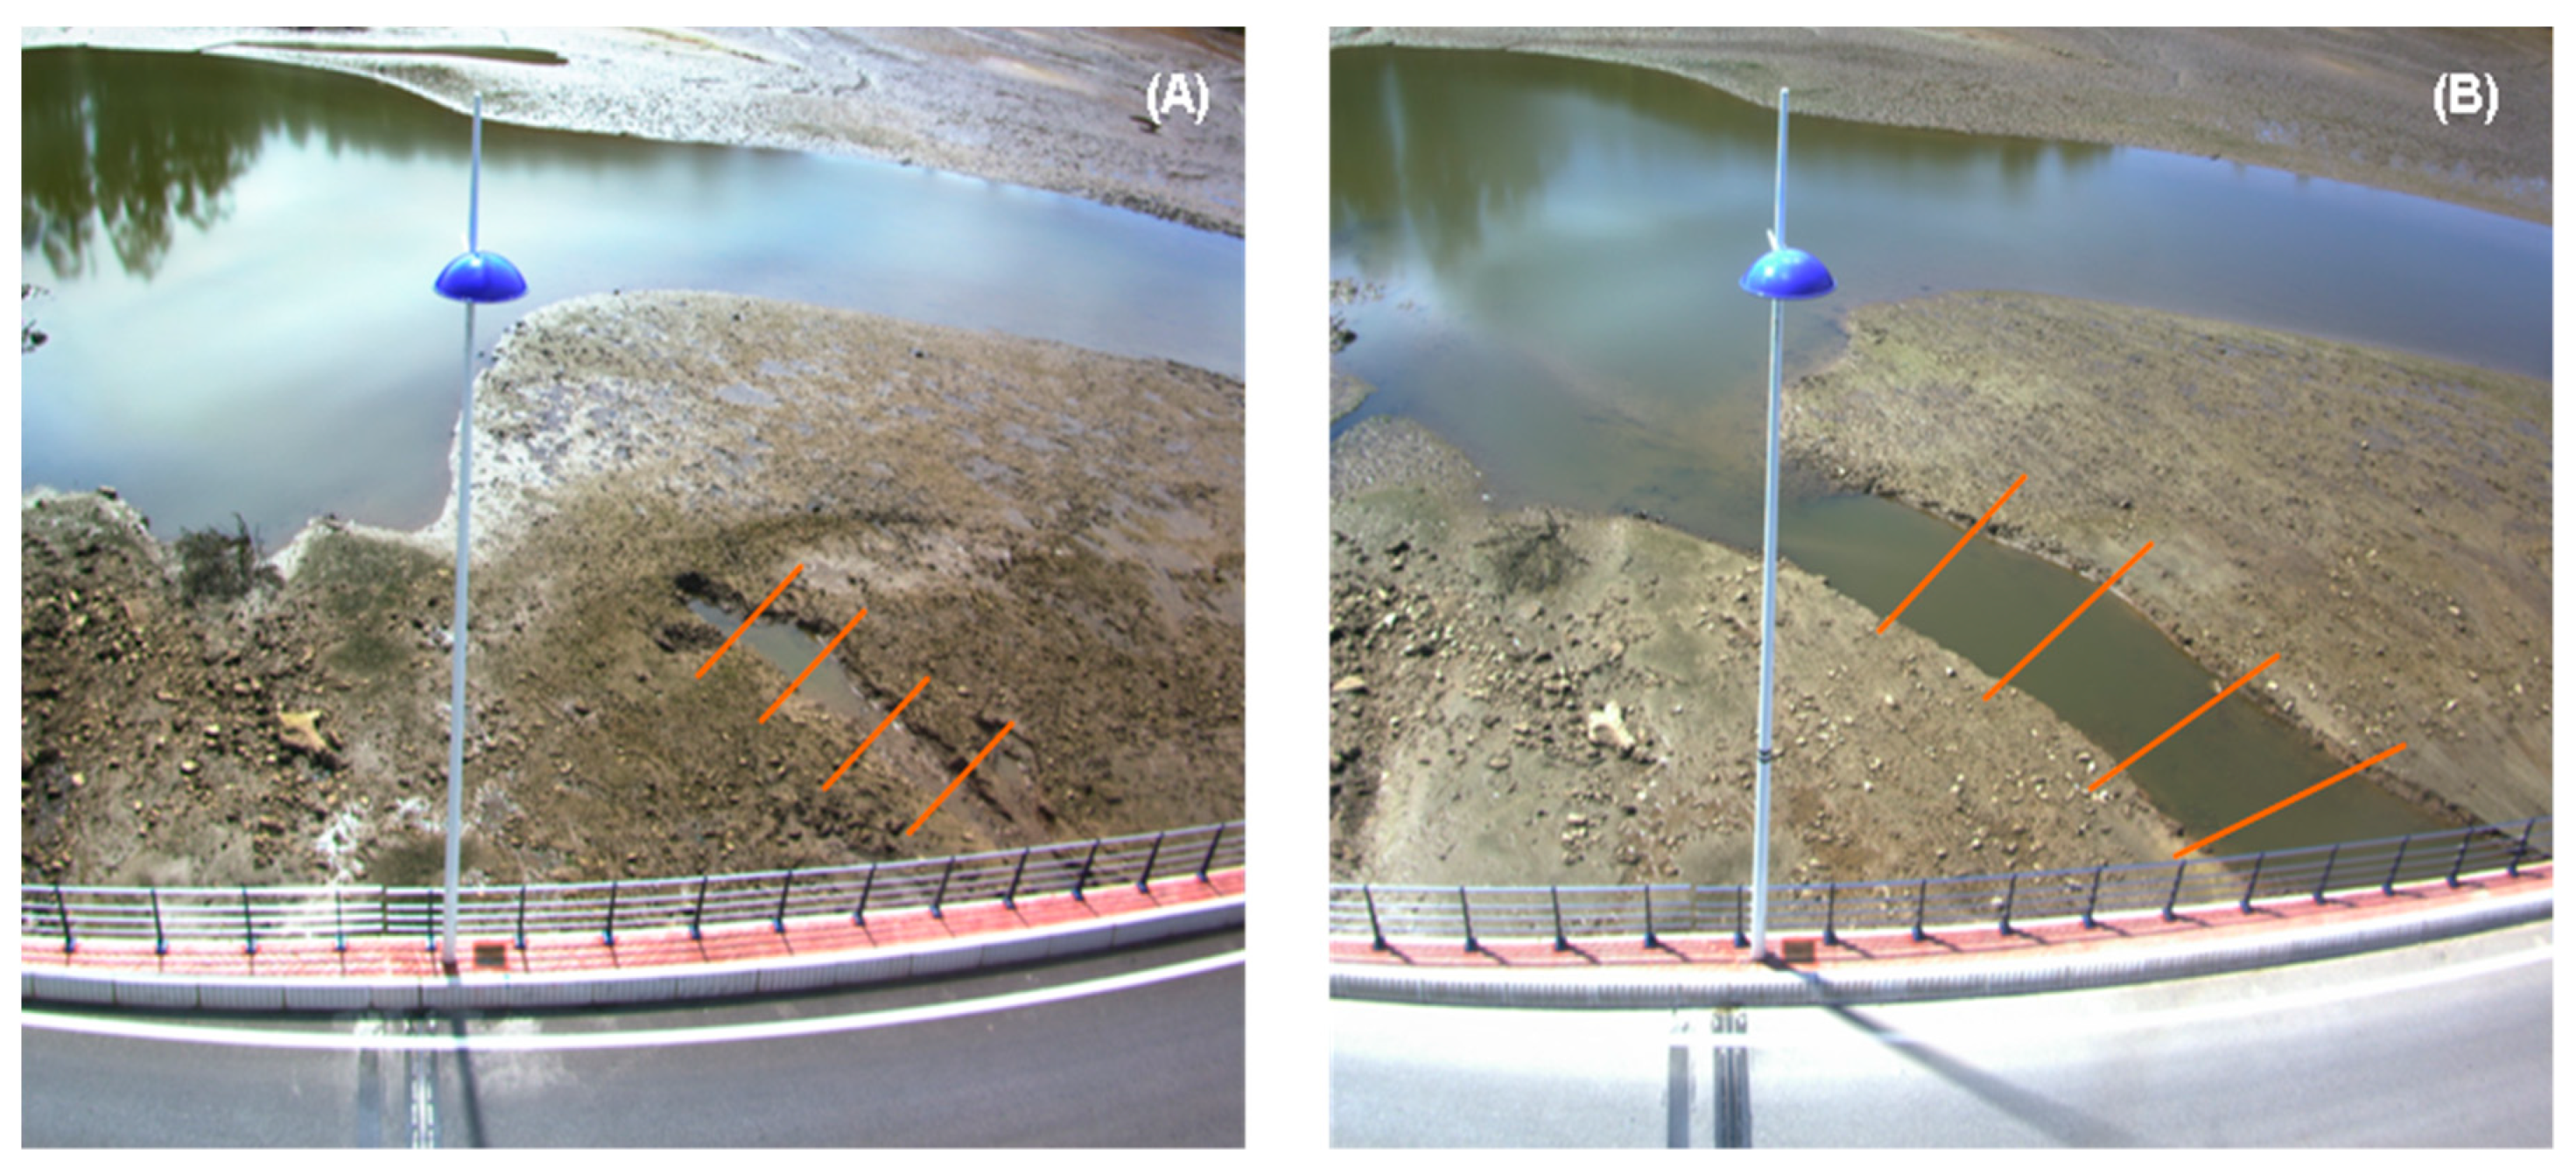
Thanks to the fact that the data acquisition system stores images every 15 min, considerably increasing the temporal resolution of topographic campaigns, it is possible to identify the edges of the new channel throughout the study period. To this end, four transects were defined that will modify their position according to the dimensions acquired by the channel as it evolves towards a new state of equilibrium [
10]. The characteristic width of the channel will be the result of averaging the data obtained for the four transects.
Within each of the transects, the groups of pixels that are part of both edges of the channel are identified, and based on the results obtained in the rectification, it is possible to know the real distance between these edges. This procedure is repeated throughout the study period to determine the evolution of the width of the channel until the equilibrium situation is reached.
4. Results and Discussion
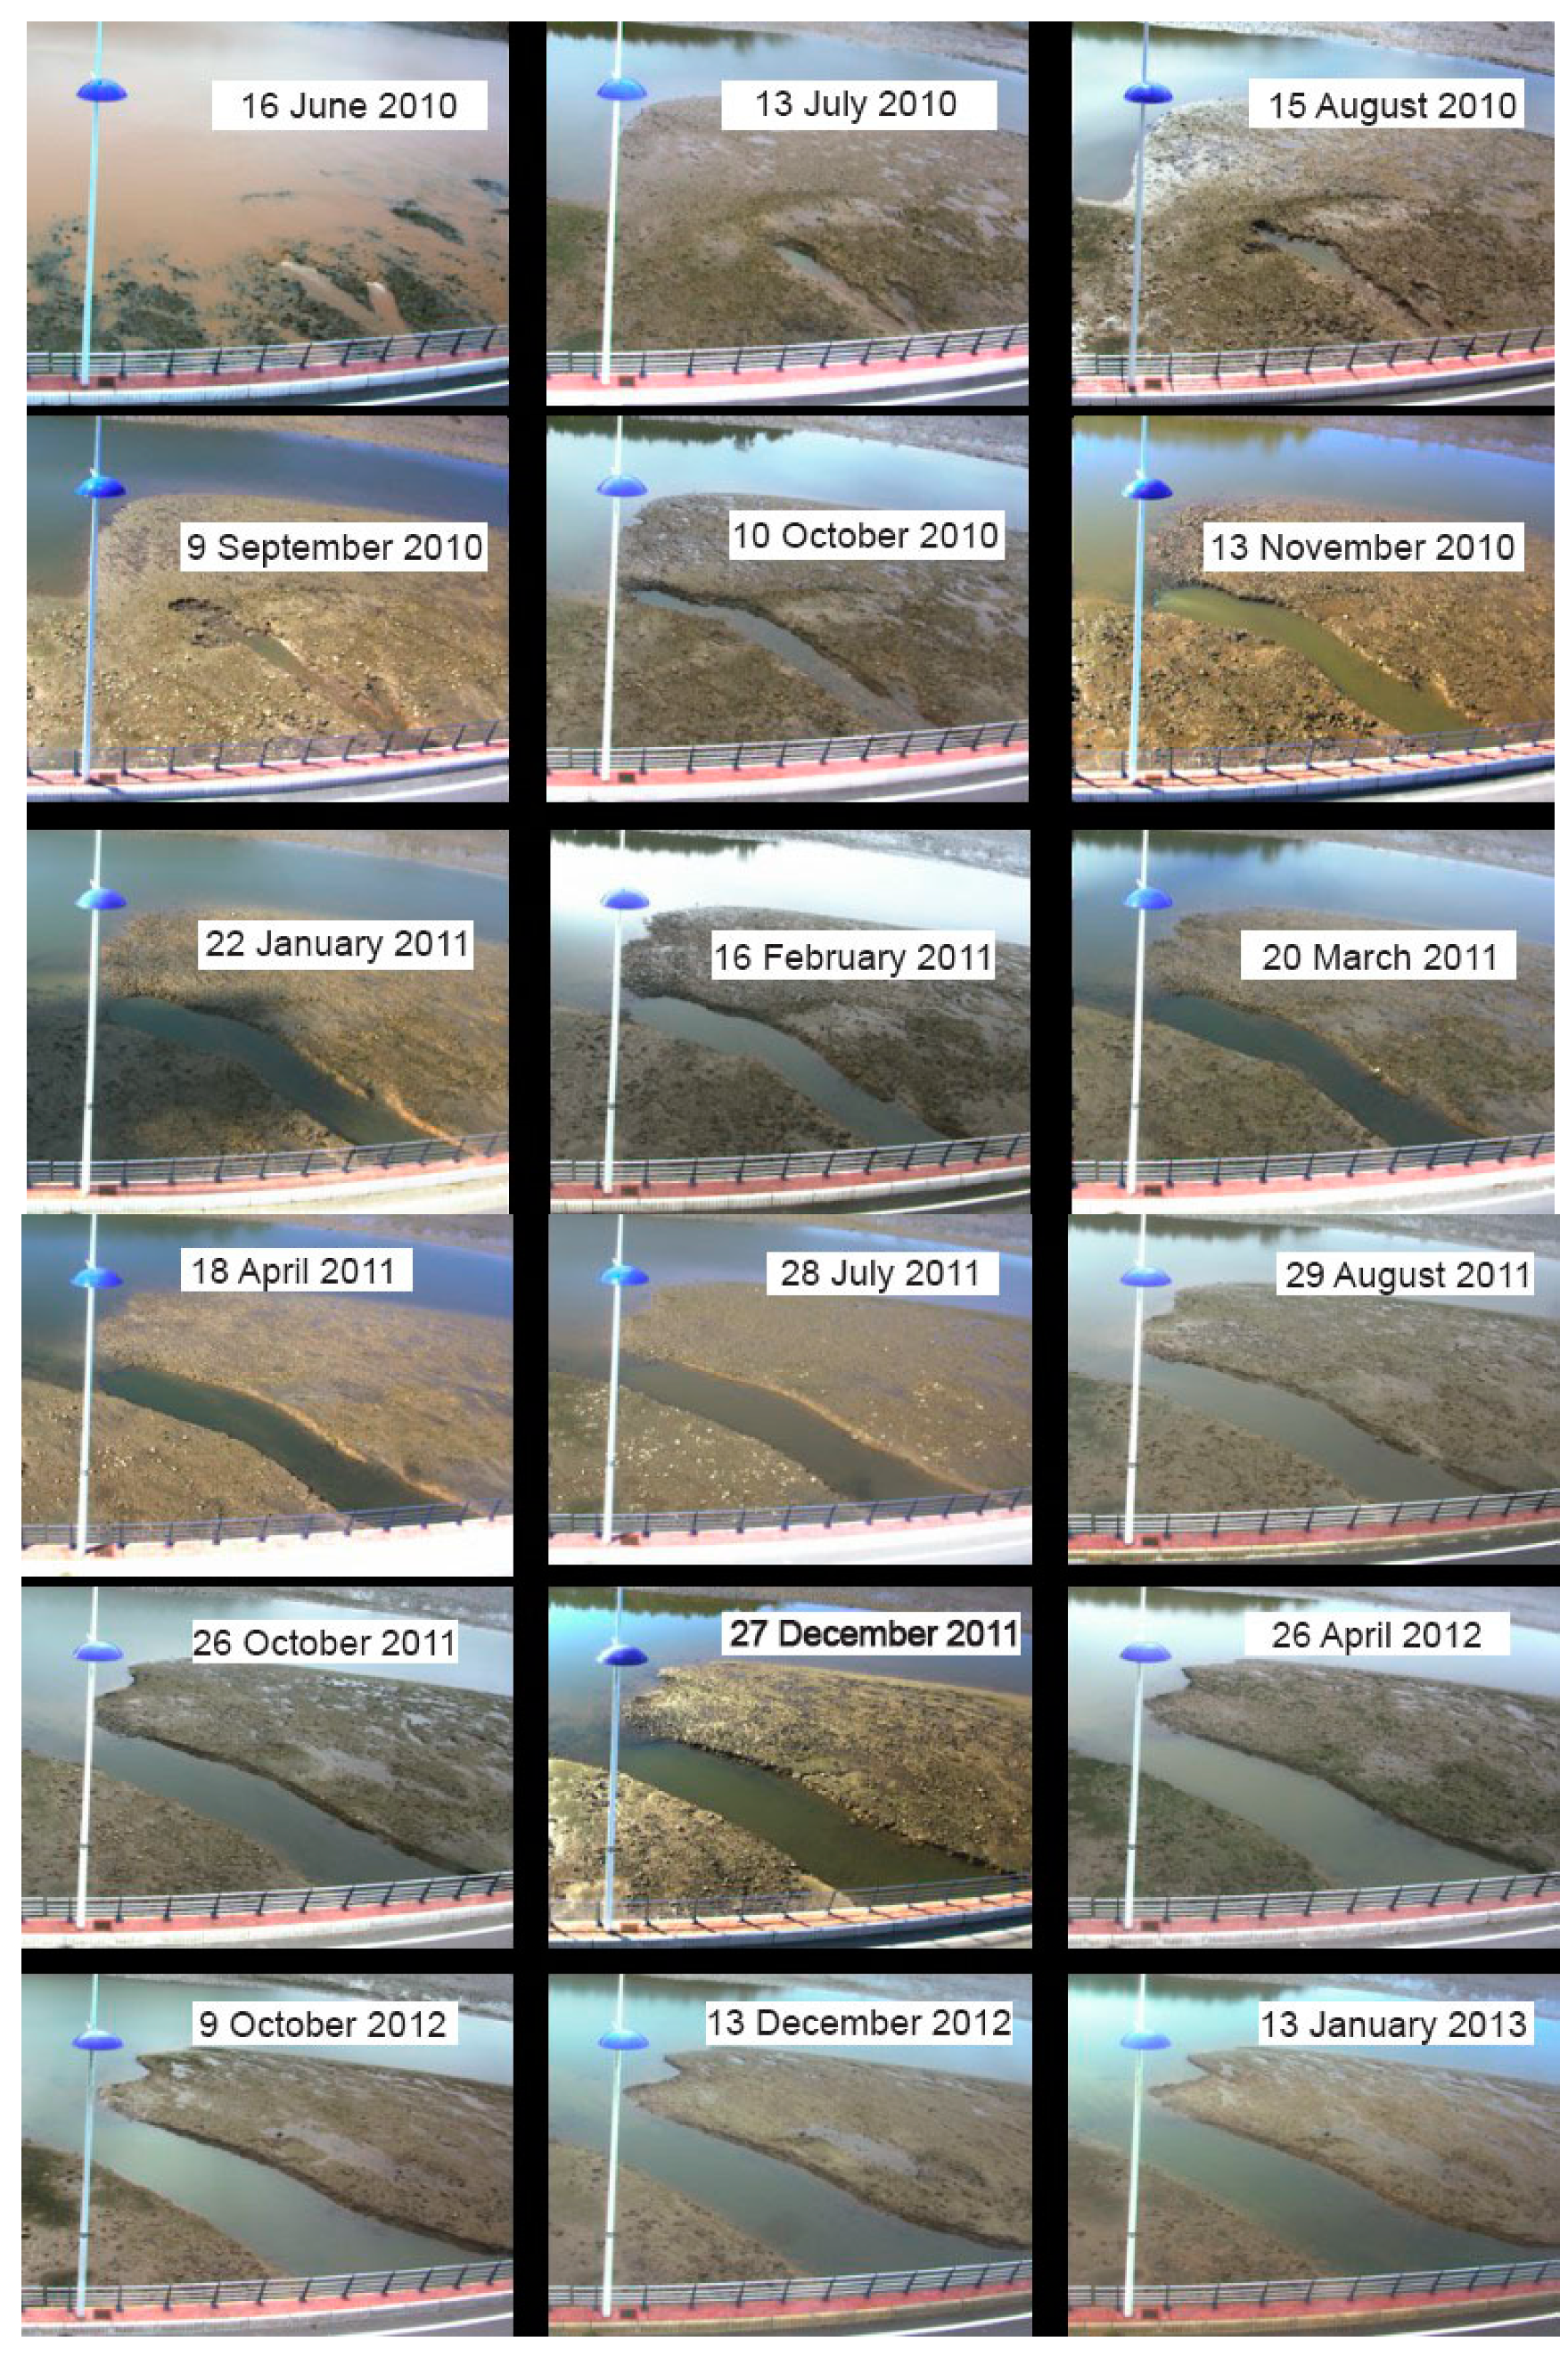
Through the video monitoring station (May 2009) important changes in the morphology of the estuaries have been observed. The most important being the appearance of a new channel, which is visible through Camera 1. Thanks to this camera, we have been able to observe the evolution of the channel, from its birth, up to its stage of equilibrium (
Figure 10).
Figure 11a shows the four selected transects for the initial growth phase in which the secondary channel has not yet developed its entire length. While
Figure 11b shows the location of the transects once the secondary channel has developed its head until it connects with the main channel.
As a result of digitalization, we obtained the pixelated coordinates (u, v) that form part of the borders of the channel at each transect. The same mathematical process was applied to this set of points for the rectification of images, so as to transform the coordinates into the equivalent coordinates of real space (x, y, z).
After the restoration work was completed by the end of October 2009, and after eight months of the continuous ebb and flow of the tide, the channel started to become visible as of 15 June 2010. During these first instances of life (June and July 2010,
Figure 10) the channel showed us two branches, of which only the one situated on the left area of the image managed to develop.
Also, during the first four months of the life of the channel (
Figure 10), we can see how its development is characterized by rapid “incisional narrowing” [
11] in the sense of the longitude of the current. This phenomenon can be explained from the point of view of the shear stress distribution. The shear stress for a given section has a maximum value within the central area of the channel, which falls to zero within its edges [
12]. In this way, the erosion tends to concentrate in the centre of the channel during its incision, causing the channel to narrow while it increases its depth.
The narrow erosion process continued until the transportation of the lateral sediments from the walls of the channel slowed enough to halt the degradation and narrowing of the channel [
11]. The channel began to increase its width as of this moment, as it cut its way into the estuary.
This last behavior can be observed in the new channel as of the first equinoctial spring tides in September 2010. This is when the channel began to increase its width to a greater extent than before. As of November of the same year, the channel began to develop the connection of its head with the main channel, until about the month of March 2011 and subsequent months (
Figure 10).
5. Conclusions
The Oyambre estuary is an environment of high ecological and socioeconomic value, which has suffered strong anthropogenic pressures throughout its history due to the padding and insulation of much of its surface.
Throughout much of the estuary, within the La Rabia estuary, the restoration policies carried out have been derived from the recovery of its old hydraulic regime, making it a uniquely natural place for the study of the formation and evolution of tidal channels.
As described in specialized literature, we have been able to observe how the restoration work carried out has caused a series of responses in the estuary, which tend to seek a new equilibrium by redefining the patterns of its sediment transportation within the estuary, which in turn lead to changes in its morphology.
During this process, we have been able to verify that the video monitoring system constitutes a high space-time data collection infrastructure that enabled us to extract the relevant information at a relatively low cost. As such, we have been able to carry out follow-ups of the incisional narrowing process during the initial formation of the channel, as well as in the subsequent processes of its widening width, as described by [
11].
Based on this, it is possible to conclude that the proposed methodology constitutes a valid, efficient, and economical path for obtaining the high-quality information necessary for the monitoring and control of the morphological evolution of an estuary.

 ,
, 


