Article

Coupling Ultrasound with Heat-Reflux to Improve the Extraction of Quercetin, Kaempferol, Ginkgetin and Sciadopitysin from Mairei Yew Leaves

1
Key Laboratory of Forest Plant Ecology, Ministry of Education, Northeast Forestry University, Harbin 150040, China
2
Engineering Research Center of Forest Bio-Preparation, Ministry of Education, Northeast Forestry University, Harbin 150040, China
3
State Engineering Laboratory for Bio-Resource Eco-Utilization, Northeast Forestry University, Harbin 150040, China
*
Author to whom correspondence should be addressed.
Appl. Sci. 2019, 9(4), 795; https://doi.org/10.3390/app9040795
Submission received: 15 January 2019 / Revised: 19 February 2019 / Accepted: 22 February 2019 / Published: 24 February 2019
(This article belongs to the Section Chemical and Molecular Sciences)

Abstract

:
The coupling of ultrasound and heat–reflux extraction (UHRE) was developed for separation for quercetin (QU), kaempferol (KA), ginkgetin (GI) and sciadopitysin (SC) from Mairei Yew leaves. The Box–Behnken design was used to optimize the UHRE conditions for obtaining the maximum yield of flavonoids. The optimal extraction conditions were as follows: boiling 80% methanol (V/V) for extraction solvent, 20 min for the extraction time, 200 W for the ultrasonic power and 26 mL/g for the liquid–solid ratio. By UHRE, the yields of QU, KA, GI and SC were, respectively, 0.109, 0.406, 0.031 and 0.355 mg/g, and total yield of four flavonoids was 0.901 mg/g, which were, respectively, 1.25-fold and 1.23-fold higher than those by using ultrasonic-assisted extraction (UAE) and heating reflux extraction (HRE). Moreover, the extraction time for the equilibrium yields of flavonoids using UHRE was 83.3% and 27.8%, respectively, less than the corresponding time using UAE and HRE. Compared with HRE and UAE, UHRE showed the increase of cell disruption degree as observed by scanning electron microscopy, which may be the reason for high yield and rapid extraction of target compounds.

1. Introduction

Mairei Yew (Taxus chinensis var. mairei) is a unique yew variety of China. Recently, the studies on active compounds of Mairei Yew mainly have been focused on taxanes, especially paclitaxel, which has antitumor activity [1,2,3]. However, there are many active ingredients in branches and leaves of Taxus, such as flavonoids, polyphenols, volatile oils, polysaccharides, tannins, etc. [4].
Natural flavonoids from plants have antioxidant, anti-cancer, anti-inflammatory and heart protecting functions [5,6,7,8]. Quercetin (QU), kaempferol (KA), ginkgetin (GI) and sciadopitysin (SC) are mainly the flavonoids in Taxus chinensis var. mairei leaves [9,10,11,12]. The chemical structural formulas of QU, KA, GI and SC are shown in Figure 1. These four flavonoids have many pharmacological activities, including anti-inflammatory, anti-tumor, anti-influenza virus, anti-platelet aggregation, cardiovascular protection and blood glucose regulation, improving depression associated with epilepsy and immunosuppressive activity [13,14,15,16,17,18,19,20,21,22].
The traditional method for extraction of flavonoids is mainly heating reflux extraction (HRE). However, the yield of flavonoids obtained by HRE is low and extraction time is long [23]. Thus, it is necessary to propose a more effective method for extracting flavonoids. Lately, ultrasound-assisted extraction (UAE) has been applied for extraction of natural active ingredients, including flavonoids [24,25,26,27,28]. Because of ultrasonic vibration, high speed, strong cavitation effect and mixing effect constantly producing numerous internal pressure, reach thousands of atmospheric pressure microcavitation, and constantly “blasting” produce microscopic powerful shock wave on plant material. Thus, the matrix of plant materials was constantly eroded, and the active ingredients that were not belonging to plant structure were separated continuously [29,30,31]. In addition, cell walls’ expansion can decrease the barrier of mass transfer between plant cell walls and solvents, thus accelerating the release of target components in a shorter time [32].
Temperature is an important parameter affecting the yield of target components in the process of ultrasonic extraction [33]. With the increase of extraction temperature, the solvent permeability and the solubility of target components increase, while the viscosity of solution decreases [24]. Thus, the increase of temperature can increase the yields of target components [34]. However, it is also reported that excessive temperature may lead to degradation of some thermal unstable components [33,35]. In the known reports, the extraction temperatures used in ultrasound extraction are all less than the boiling point of solvents [36]. In fact, when the solvent reaches its boiling point, a part of the solvent going into the cell can be transformed from the liquid to the gaseous, which promotes destroying the cell wall, accelerating the separation of target components from the plant matrix. Therefore, the ultrasound extraction using boiling solvents may increase the yield of target components.
Maran et al. found that the yield of flavonoides from Nephelium lappaceum L. fruit peel increased as the extraction temperature from 30 °C to 50 °C and the yields reached the maximum at 50 °C in the process of ultrasonic extraction [37]. Khan et al. demonstrated that the yield of flavanone glycosides from orange increased as the increase of temperature with the range between 10 °C and 40 °C [38] and the maximum yield of flavanone glycosides was reached at 40 °C. Prommuak et al. [39] found that the highest yields of flavonoids from Thai silk waste were obtained at the highest of 70 °C. In addition, Zhang et al. [40] found that the highest yields of flavonoids from Prunella vulgaris L. were obtained at the highest of 79 °C. Moreover, it has been reported that flavonoids will not be degraded less than 75 °C [41]. Therefore, it is very possible to improve the flavonoid yield by ultrasonic extraction with a boiling solvent whose boiling point is lower than 75 °C. The boiling point of methanol is 65 °C, which is lower than that of flavonoid degradation. At present, methanol has been applied in the extraction of flavonoids from plant materials [35,36]. Therefore, it is imperative to study the effect of boiling methanol on the yield of flavonoids in ultrasonic extraction.
In this study, in order to overcome the disadvantage of conventional heating reflux extraction, a novel coupling ultrasound with heat–reflux extraction method (UHRE), i.e., the ultrasonic extraction method with boiling methanol for improvement of the extraction of QU, KA, GI and SC from Mairei Yew leaves was developed. The method of UHRE combined with the advantages of UAE and HRE was used to shorten the time and improve the yield of compounds.
Several conditions that could influence the yields of flavonoids, such as the ultrasonic power, time and liquid–solid ratio were evaluated and optimized using response surface methodology (RSM) with a Box–Behnken design (BBD). Furthermore, the yield of the flavonoids obtained by UHRE and the yield obtained by conventional extraction methods (UAE and HRE) were also compared. In addition, the extraction kinetics were fitted and cell disruption by three extraction methods (UAE, HRE and UHRE) was further discussed to demonstrate the advantage of UHRE.

2. Materials and Methods

2.1. Materials and Chemicals

Mairei Yew leaves were harvested from Fuyang, Zhejiang Province, China. These leaves were dried, milled, sieved (250 μm) and placed in a closed desiccator until use. Quercetin (98%), kaempferol (98%), ginkgetin (98%) and sciadopitysin (98%) were obtained from Sigma Aldrich (Shanghai, China). HPLC grade methanol was purchased from DIKMA Technologies (Beijing, China). Analytical grade reagents were obtained from Tianjin Tianli Reagent Company (Tianjin, China).

2.2. Extraction Process

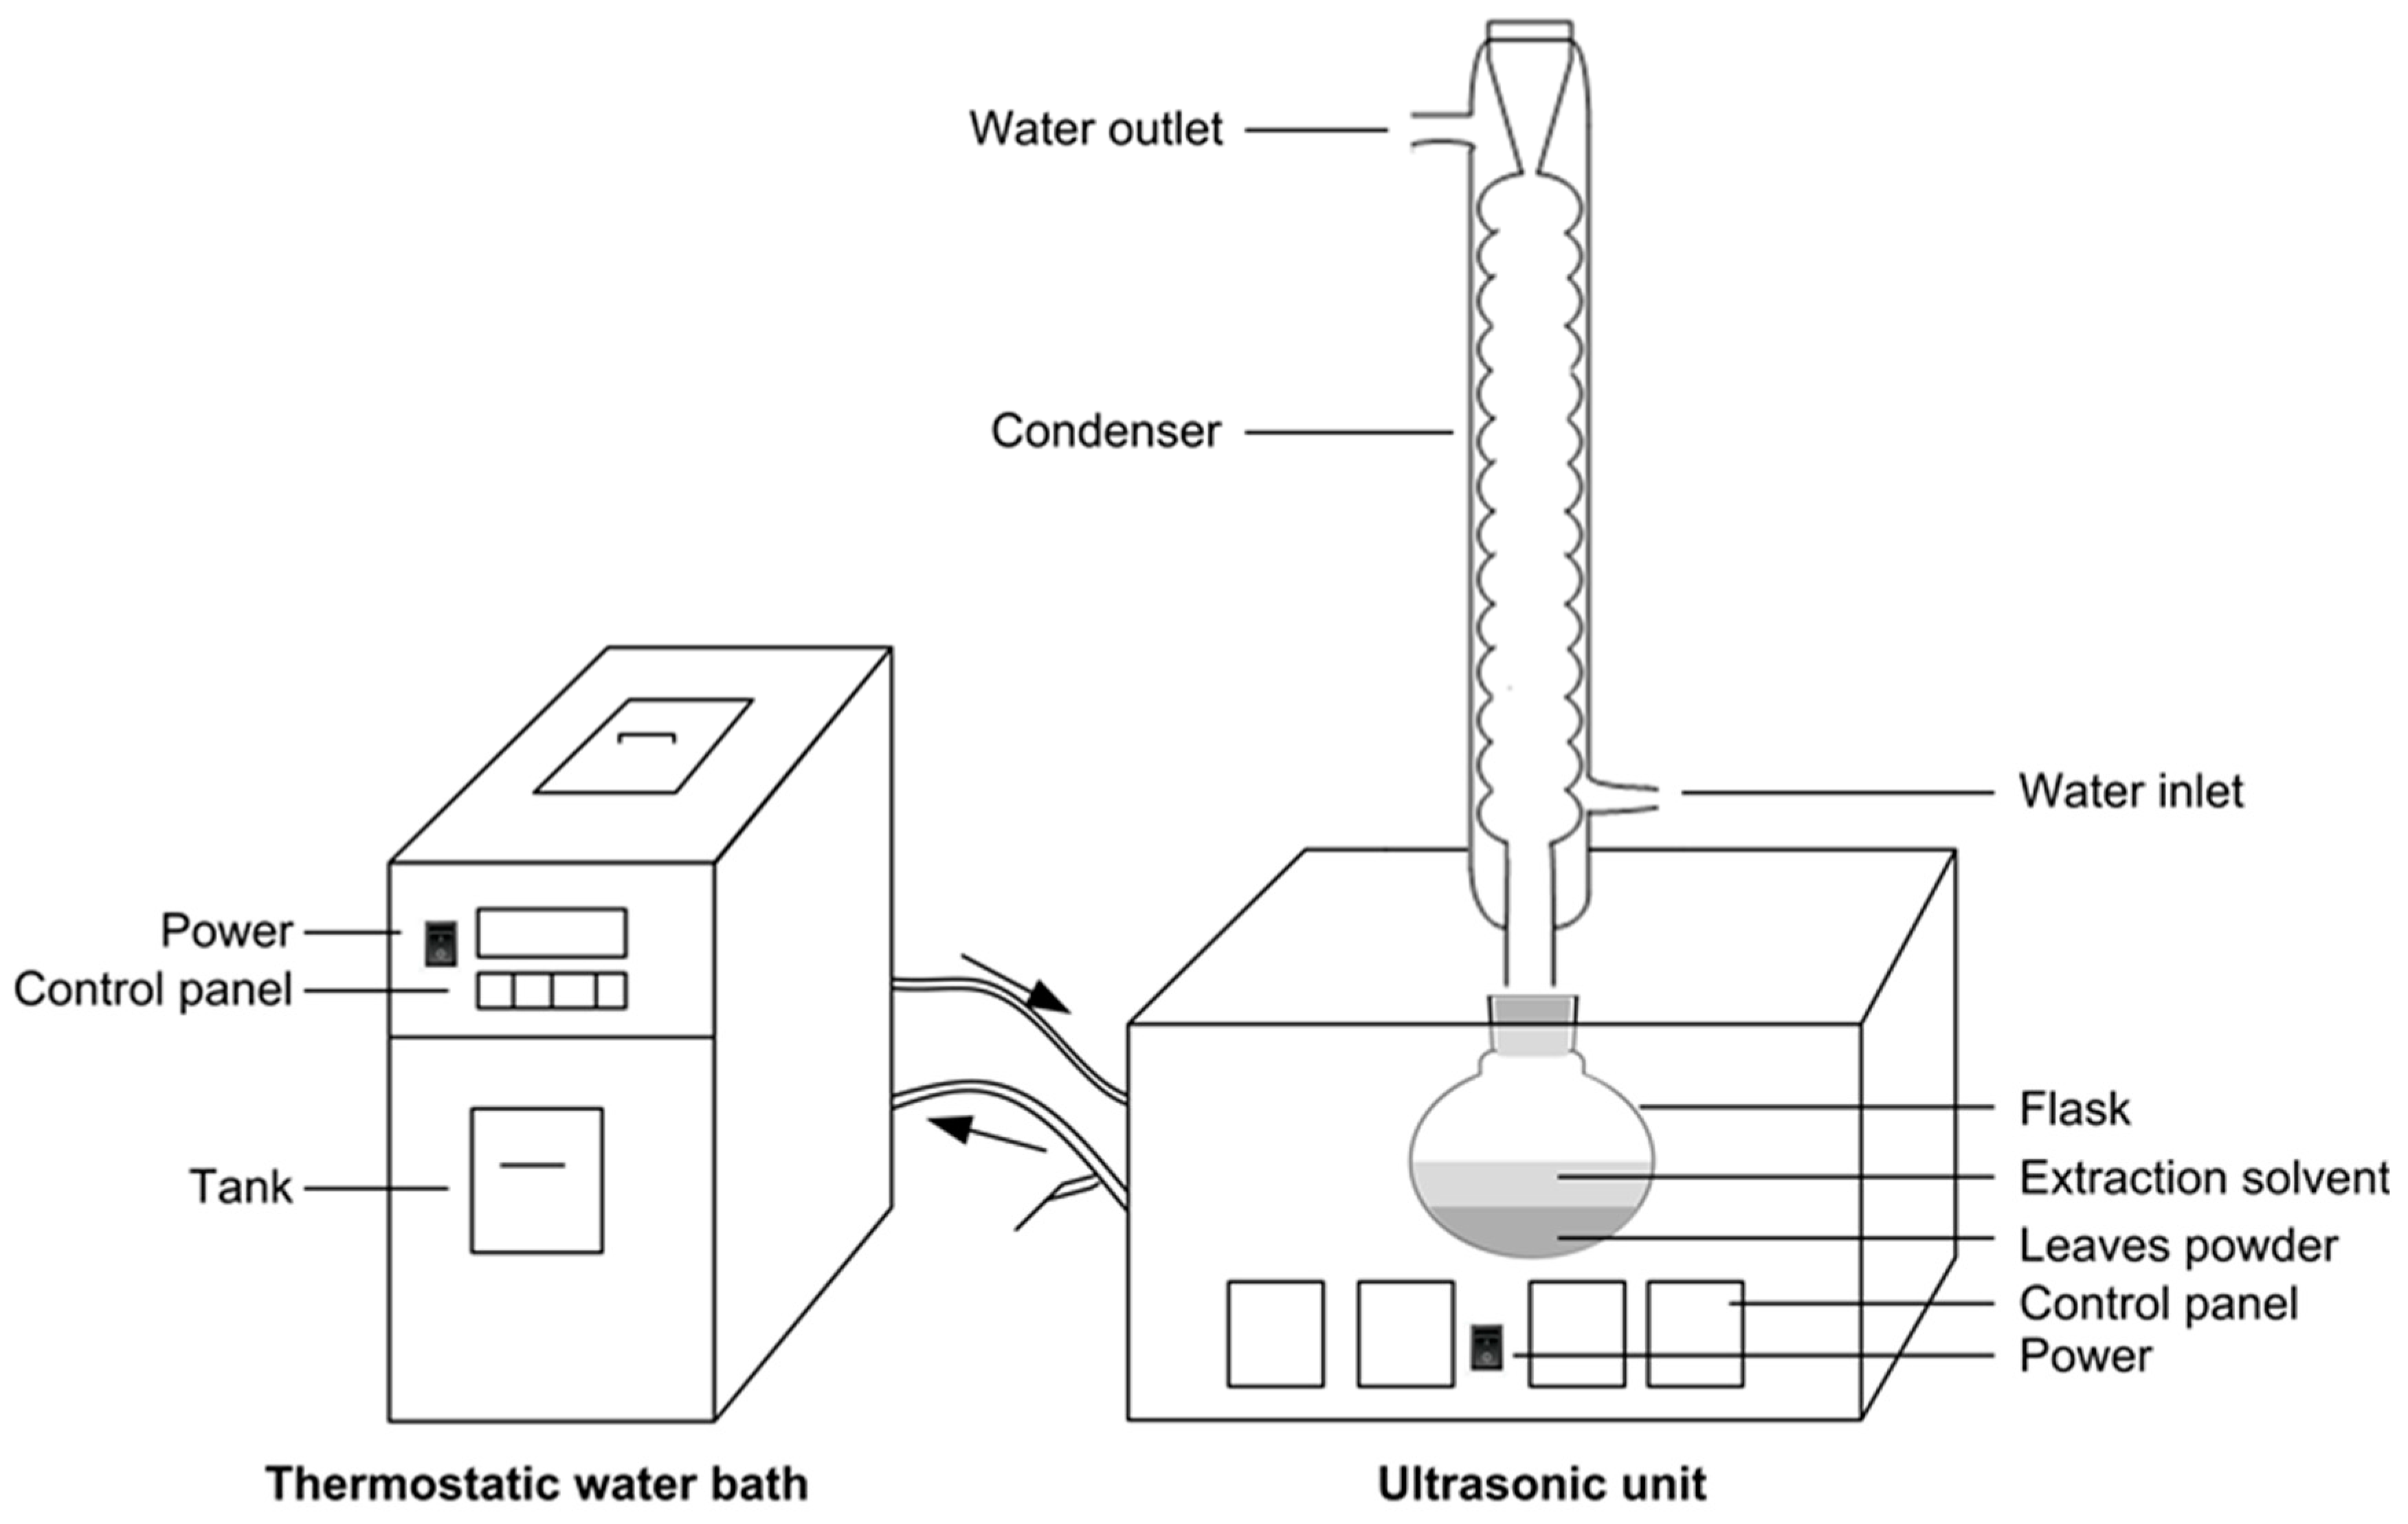
2.2.1. Ultrasonic Heat–Reflux Extraction

The UHRE equipment was composed of a thermostatic temperature water bath and an ultrasonic unit according to reference [32]. The schematic diagram of device is seen in Figure 2. The water bath with a temperature controller and ultrasonic devices were connected by a circulating water system. A round-bottom flask was connected to the spherical condenser in the ultrasonic unit.
Three grams of Mairei Yew leaves powder were added to a 250 mL of flask with a proper volume of methanol; then, the flask was put in a water bath of the UHRE apparatus set at 70 °C. Finally, the extraction procedure was performed according to the set parameters of the experiment design.

2.2.2. Heat–Reflux Extraction

Three grams of leaves powder were placed into a 250 mL flask with 90 mL methanol, and the flask was put in a water bath at 70 °C. The extraction process was performed in 180 min.

2.2.3. Ultrasonic-Assisted Extraction

Three grams of leaves powder were placed into 250 mL flask with 90 mL methanol, the flask was put in the KQ-250 DE ultrasonic unit with 250 W of power, and then extracted for 60 min. The extraction temperature was kept at 25 °C with a constant temperature water bath.

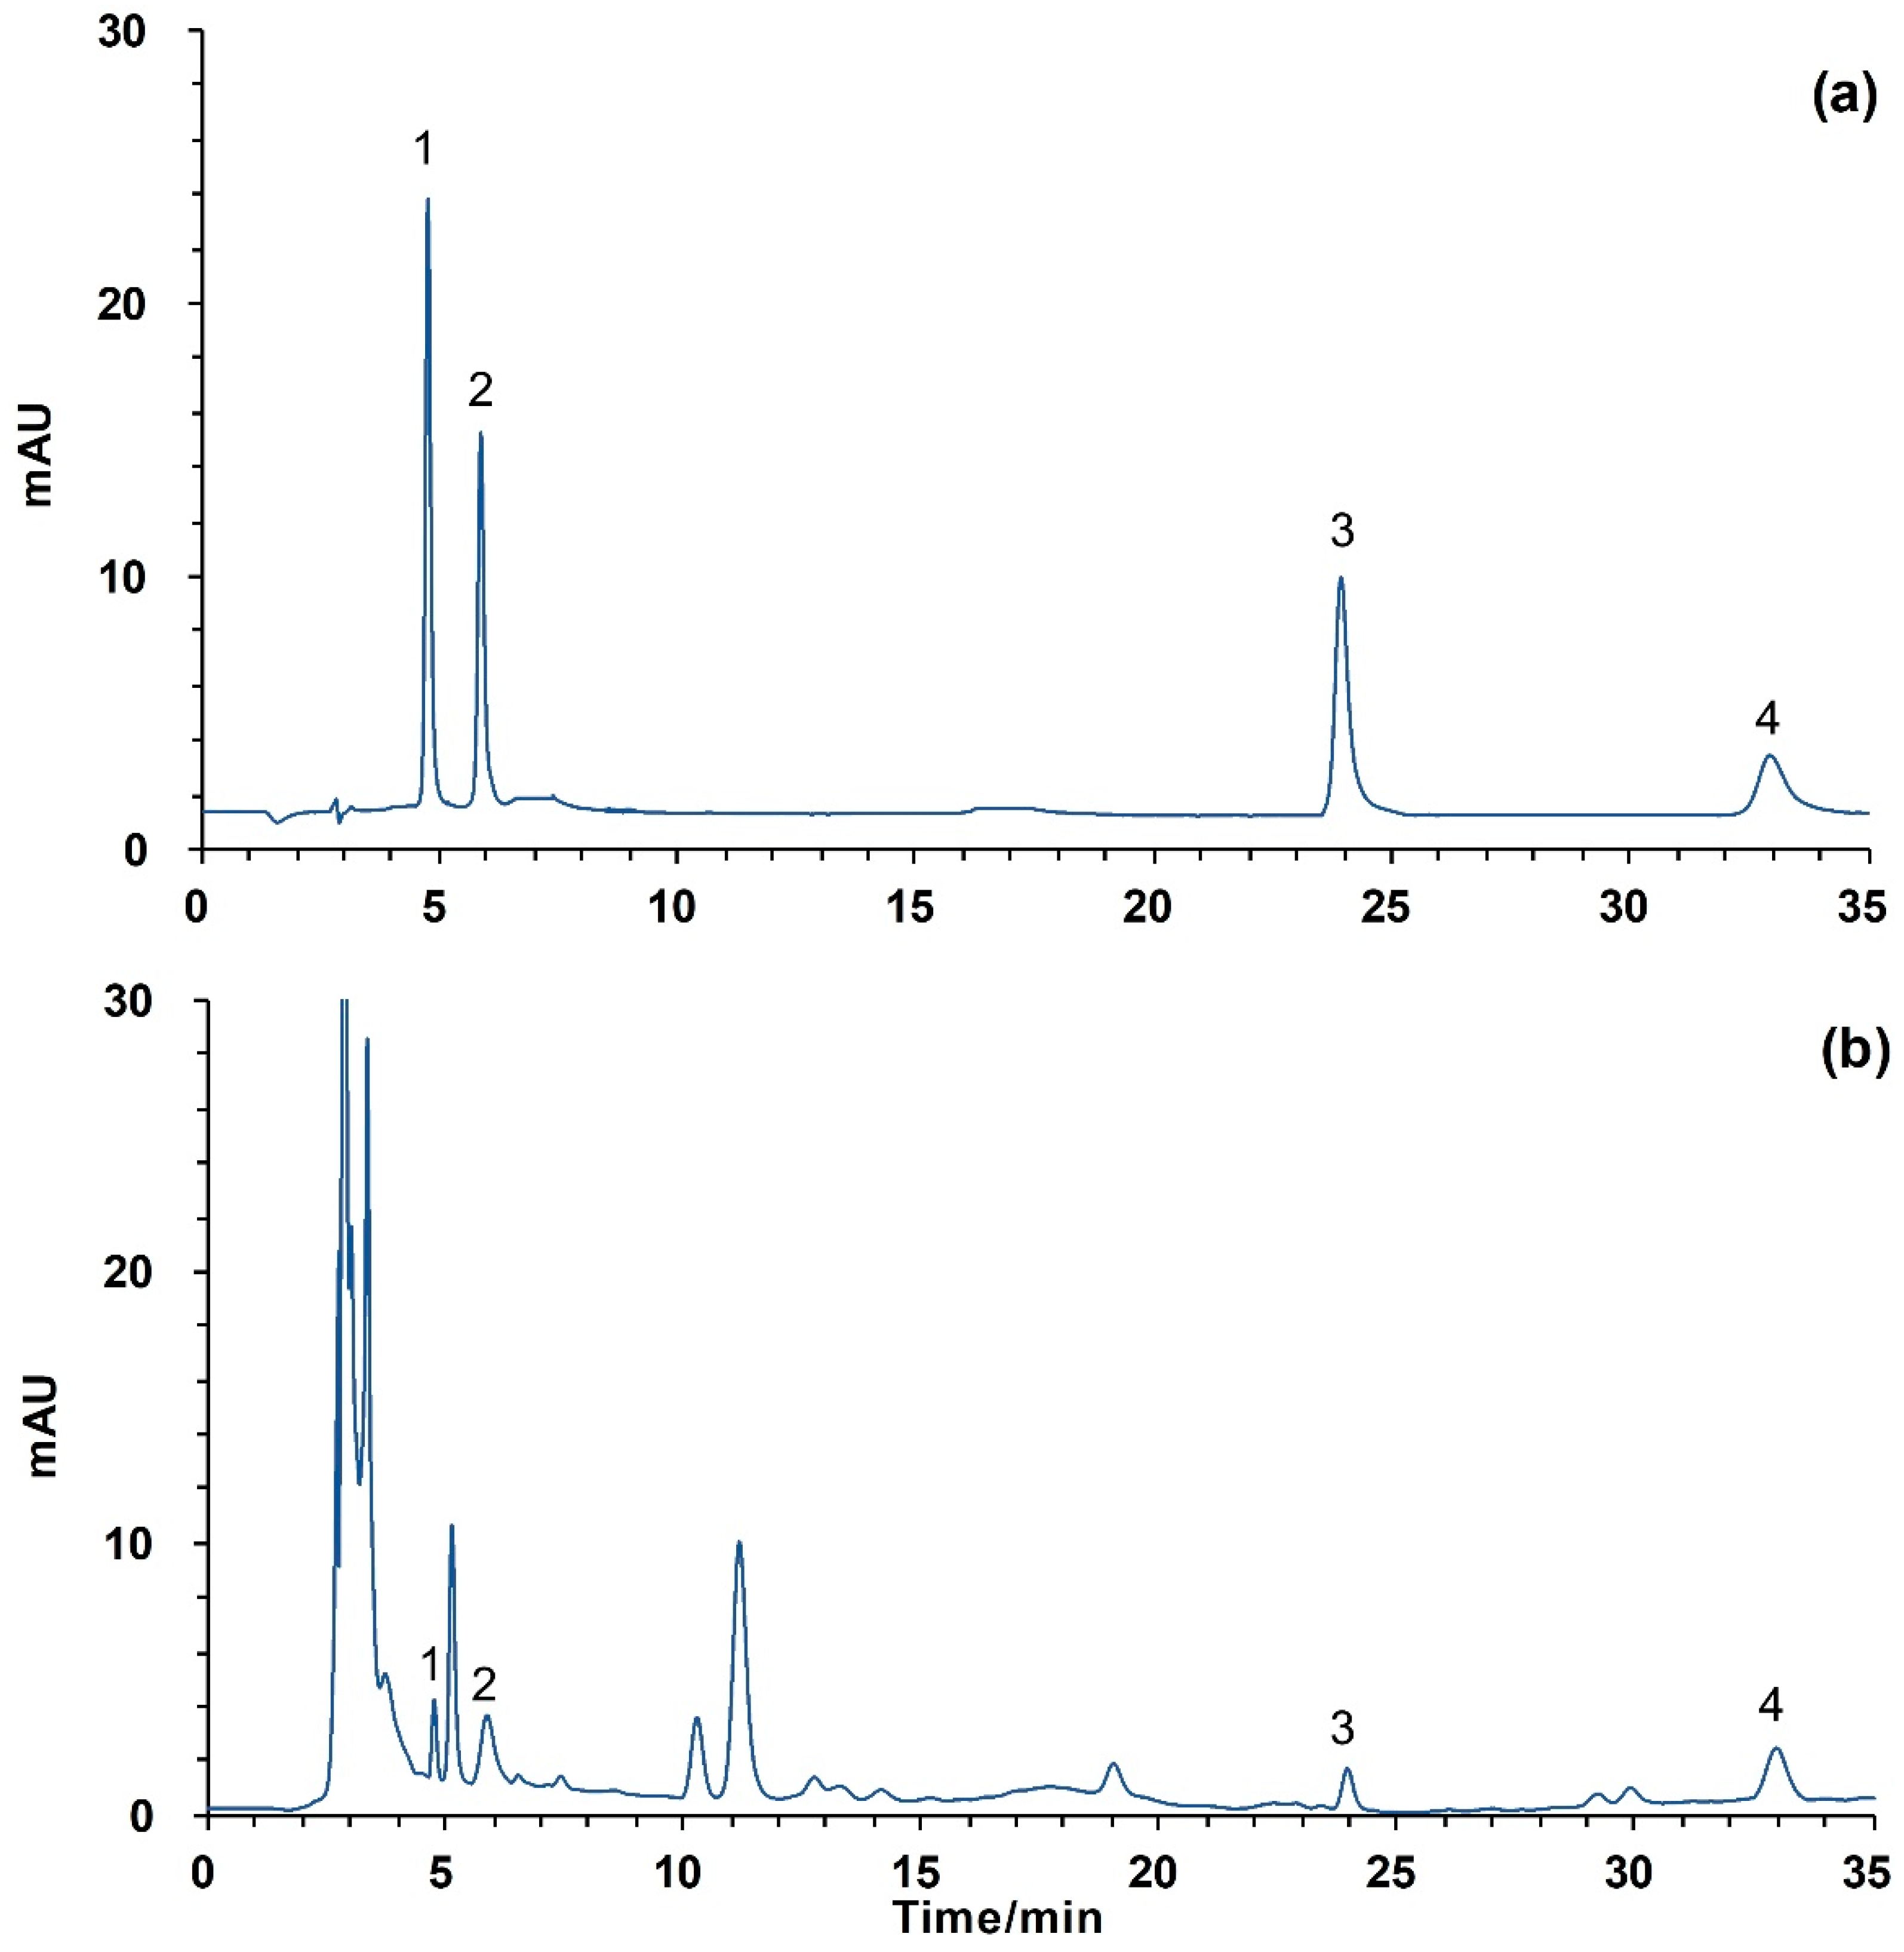
2.3. Determination of Four Flavonoids by HPLC

An Agilent 1260 HPLC system (Agilent Technologies infinity, Santa Clara, CA, USA) were used to determine four flavonoids in extracts. Chromatographic column separation was achieved on an ODS (octadecyl silane) reversed-phase column (4.6 mm × 250 mm, 5 μm, KYA Technologies, Tokyo, Japan) and the column temperature was kept at 30 °C. Mobile phase A was methanol-acetic acid (99:1, v/v), and mobile phase B was water-acetic acid (99:1, v/v). The mobile phase A and B were used as mobile phases for gradient elution. The gradient composition was used: 80% A, in the first 8 min; decreased to 70% A, 8–15 min; 70% A, after 15 min. After the end of each gradient step, the column was re-equilibrated for 10 min with 80% A before the next analysis. In addition, 1.0 mL/min of flow rate and 10 μL of injection volume were used. The chromatograms of standards and extract were supervised at 337 nm.
After extraction, the extracts were filtered using filter paper and filtrates were kept at a constant volume to 100 mL with the extraction solvent. The solution was filtered using a 0.45 μm nylon membrane before HPLC analysis. The quantitative analysis of flavonoids in extract solution was performed using the standard addition method and the solution was determined in triplicates. The HPLC chromatograms for standards and extract from Mairei Yew leaves are shown in Figure 3.

2.4. Experimental Design of UHRE

After testing the initial range of the extraction variables, a single factor experiment was conducted. Three factors (10–30 min for extraction time, X1; 150–250 W for ultrasonic powder, X2; 20–40 mL/g for liquid–solid ratio, X3) combined with BBD were chosen to estimate the main effect and mutual effect of various factors with experimental range by RSM to allow the yields for QU (Y1), KA (Y2), GI (Y3) and SC (Y4) to be obtained. The experimental data were fitted by second-order polynomial equation:
Y = β 0 + i = 1 3 β i X i + i = 1 3 β i i X i 2 + i = 1 2 j = i + 1 3 β i j X i X j ,
where Y represented the response variable; β0, βi, βii and βij were the regression coefficients, Xi and Xj were the independent variables.

2.5. Kinetic Model

The kinetics for the yield of flavonoids from Mairei Yew versus extraction time was fitted by mathematical models. The yield of four flavonoids was evaluated using UAE, HRE and UHRE methods. Each group was operated three times, and the extraction yields were averaged. Experimental data were fitted to different extraction kinetic models (Table 1) using the “Regression Wizard” module of SigmaPlot 10.0 software (version, Systat software, Inc., San Jose, CA, USA. The choice of the optimal model was based on the analysis of the highest correlation coefficient (R2), and the lowest standard error of estimate of experimental data to fitted value of the equations.

2.6. Estimation of cell Disruption by Scanning Electron Microscopy (SEM)

The plant samples treated by different method were observed by high vacuum SEM at 450 × magnification by reference [45].

2.7. Statistical Analysis

The data values are averages ± SD (standard deviation) of three independent recorded values. One-way analysis of variance with p < 0.05 by Office Excel 2013 (Microsoft, Redmond, WA, USA) was used for experimental data acceptance.

3. Results and Discussion

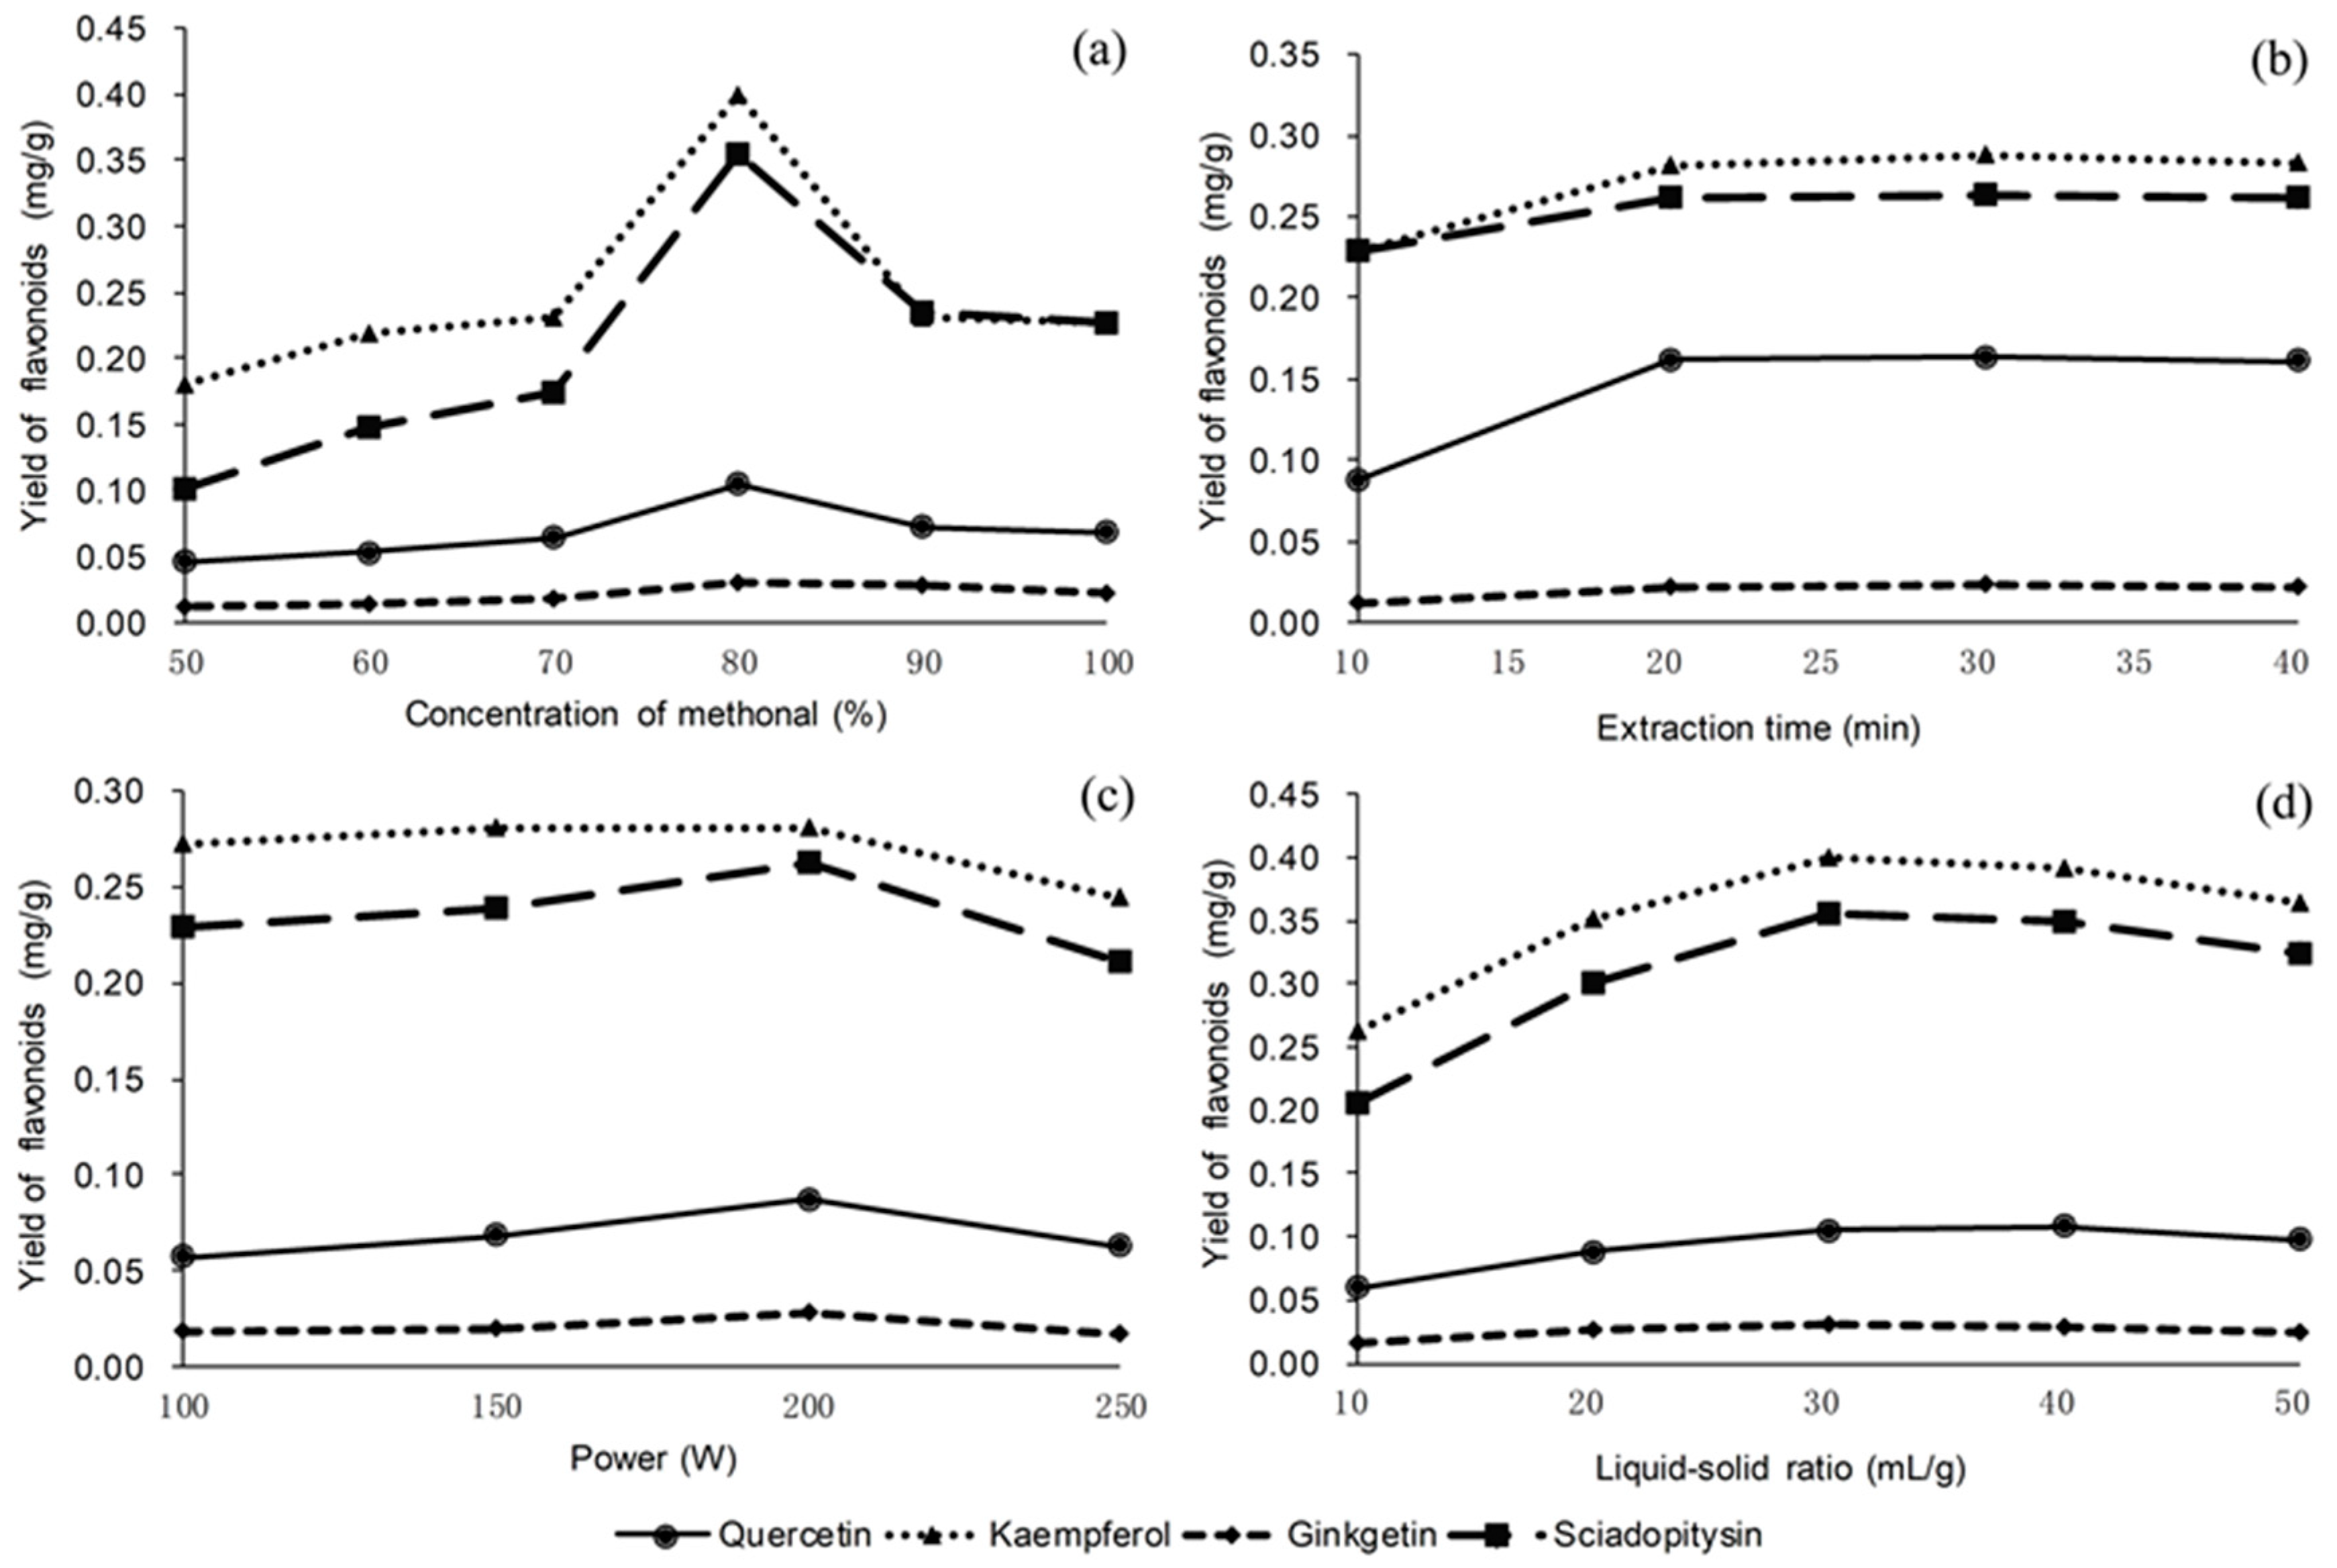
3.1. Effect of Single Factors on Four Flavonoids Yields

3.1.1. Effect of Methanol Concentration on the Flavonoids Yield

The concentration of solvent plays a key role on the selectivity and solubility of the four flavonoids. The effect of methanol concentration (from 50% to 100%, V/V) on the yields of the four flavonoids was investigated at the same time (20 min), ultrasonic power (200 W) and liquid–solid ratio (30 mL/g). Figure 4a showed that the yields of four flavonoids increased greatly with the increase of methanol concentration from 50% to 80%. However, with further increases in the methanol concentration from 80% to 100%, slight decreases of the four flavonoids yields were observed. Therefore, 80% methanol was chosen as the suitable solvent for the subsequent experiments.

3.1.2. Effect of Extraction Time on the Flavonoids Yield

The effect of extraction time on the yields four flavonoids was evaluated with a range of 10–40 min by 200 W of ultrasonic power at the 30 mL/g of liquid–solid ratio. Figure 4b shows that the yields of the four compounds increase firstly with the extraction time increasing, the highest yields of the four flavonoids were obtained at 20 min and then the four target compounds yields did not significantly change after 20 min. Thus, the 20 min of extraction time was chosen for the further experiments.

3.1.3. Effect of Ultrasonic Power on the Yield of Flavonoids

The effect of ultrasonic power on the yield of four flavonoids was evaluated with a range of 100–250 W using 20 min of extraction time at 30 mL/g of liquid–solid ratio. It can be seen from Figure 4c that the increase of the ultrasonic power from 100–200 W, and the yields of target flavonoids increased continuously. However, declined yields were found when ultrasonic power exceeded 200 W. Hence, 200 W was used as the appropriate ultrasonic power for the subsequent experiments.

3.1.4. Effect of Liquid–solid Ratio on the Flavonoids Yield

The effect of various liquid–solid ratio from 10 to 50 mL/g on the yields of QU, KA, GI and SC was studied for optimizing the extraction conditions. The results are shown in Figure 4d. The yield of the four flavonoids increased with the increase of liquid–solid ratio from 20 to 30 mL/g, reaching the maximum at 30 mL/g of the liquid–solid ratio. When the liquid–solid ratios continue decreasing, the yields of target compounds decreased slightly. Therefore, 30 mL/g of the liquid–solid ratio was selected as the further optimization study.

3.2. Optimization of UHRE Conditions

The BBD was used for optimizing the experimental conditions for extracting the four flavonoids. The experimental runs were randomized for minimizing the effects of uncontrollable factors. The test results of 17 runs are shown in Table 2.
Using multiple regression analysis based on the experimental data, the response variables and independent variables were expressed by second-order polynomial equations:
Y1 = 0.105 − 6.76 × 10−4X1 + 8.68 × 10−4X2 1.43 × 10−2X3 + 4.06 × 10−3X1X2 5.34 × 10−3X1X3 3.35 × 10−3X2X3 7.25 × 10−3X12 − 1.25 × 10−2X22 − 1.34 × 10−2X32,
Y2 = 0.400 − 5.00 × 10−3X1 + 3.84 × 10−3X2 3.39 × 10−2X3 + 1.61 × 10−2X1X2 1.49 × 10−2X1X3 3.12 × 10−2X2X3, −2.09 × 10−2X12 − 5.01 × 10−2X22 − 5.02 × 10−2X32,
Y3 = 3.01 × 10⁻² − 5.46 × 10−4X1 9.03 × 10−4X2 3.07 × 10−3X3 + 9.38 × 10−4X1X2 1.81 × 10−3X1X3 + 3.29 × 10−5X2X3 3.67 × 10−3X12 − 3.95 × 10−3X22 − 3.58 × 10−3X32,
Y4 = 0.355 + 3.18 × 10−5X1 + 6.56 × 10−4X2 4.46 × 10−2X3 + 1.90 × 10−2X1X2 1.72 × 10−2X1X3 1.49 × 10−2X2X3 3.48 × 10−2X12 − 4.26 × 10−2X22 − 3.79 × 10−2X32,
where Y1, Y2, Y3 and Y4 represent yields of quercetin, kaempferol, ginkgetin and sciadopitysin (mg/g), respectively; X1, X2 and X3 respectively represent extraction time (min), ultrasonic power (W) and liquid–solid ratio (mL/g).
Analysis of variance (ANOVA) for second-order polynomial models is shown in Table 3. The statistical significance and adequacy of the regression model are evaluated by F-value and p-value. As can be seen from Table 3, greater F-values (F > 7.84) and low p-values (p < 0.01) for model terms displayed that the four fitting models were statistically significant and indicated that the yields of four flavonoids by UHRE could be well described with those models.
A 3D surface plot visualizes the correlation between responses and two independent variables, by viewing a three-dimensional surface of the predicted responses. The effects of the extraction time, ultrasonic power and the liquid–solid ratio on the flavonoids yield and their interactions are seen in Figure 5.

3.3. Verification Test under Optimum Conditions

Based on Equations (2)–(5), the appropriate extraction condition (independent variables) proposed by the Design Expert software was as follows: extraction time 20.4 min, ultrasonic power 202.5 W and liquid–solid ratio 26.2 mL/g. From the consideration on the yield of flavonoids and operation, extraction time, ultrasonic power and liquid–solid ratio were respectively modified as 20 min, 200 W and 26 mL/g. Based on these conditions, the yields of QU, KA, GI and SC were respectively 0.109, 0.406, 0.031 and 0.355 mg/g obtained by UHRE. The above experimental values showed agreement with fitting values (RSD < 1.72%) according to the predictive RSM models.

3.4. Comparison of Different Extraction Methods

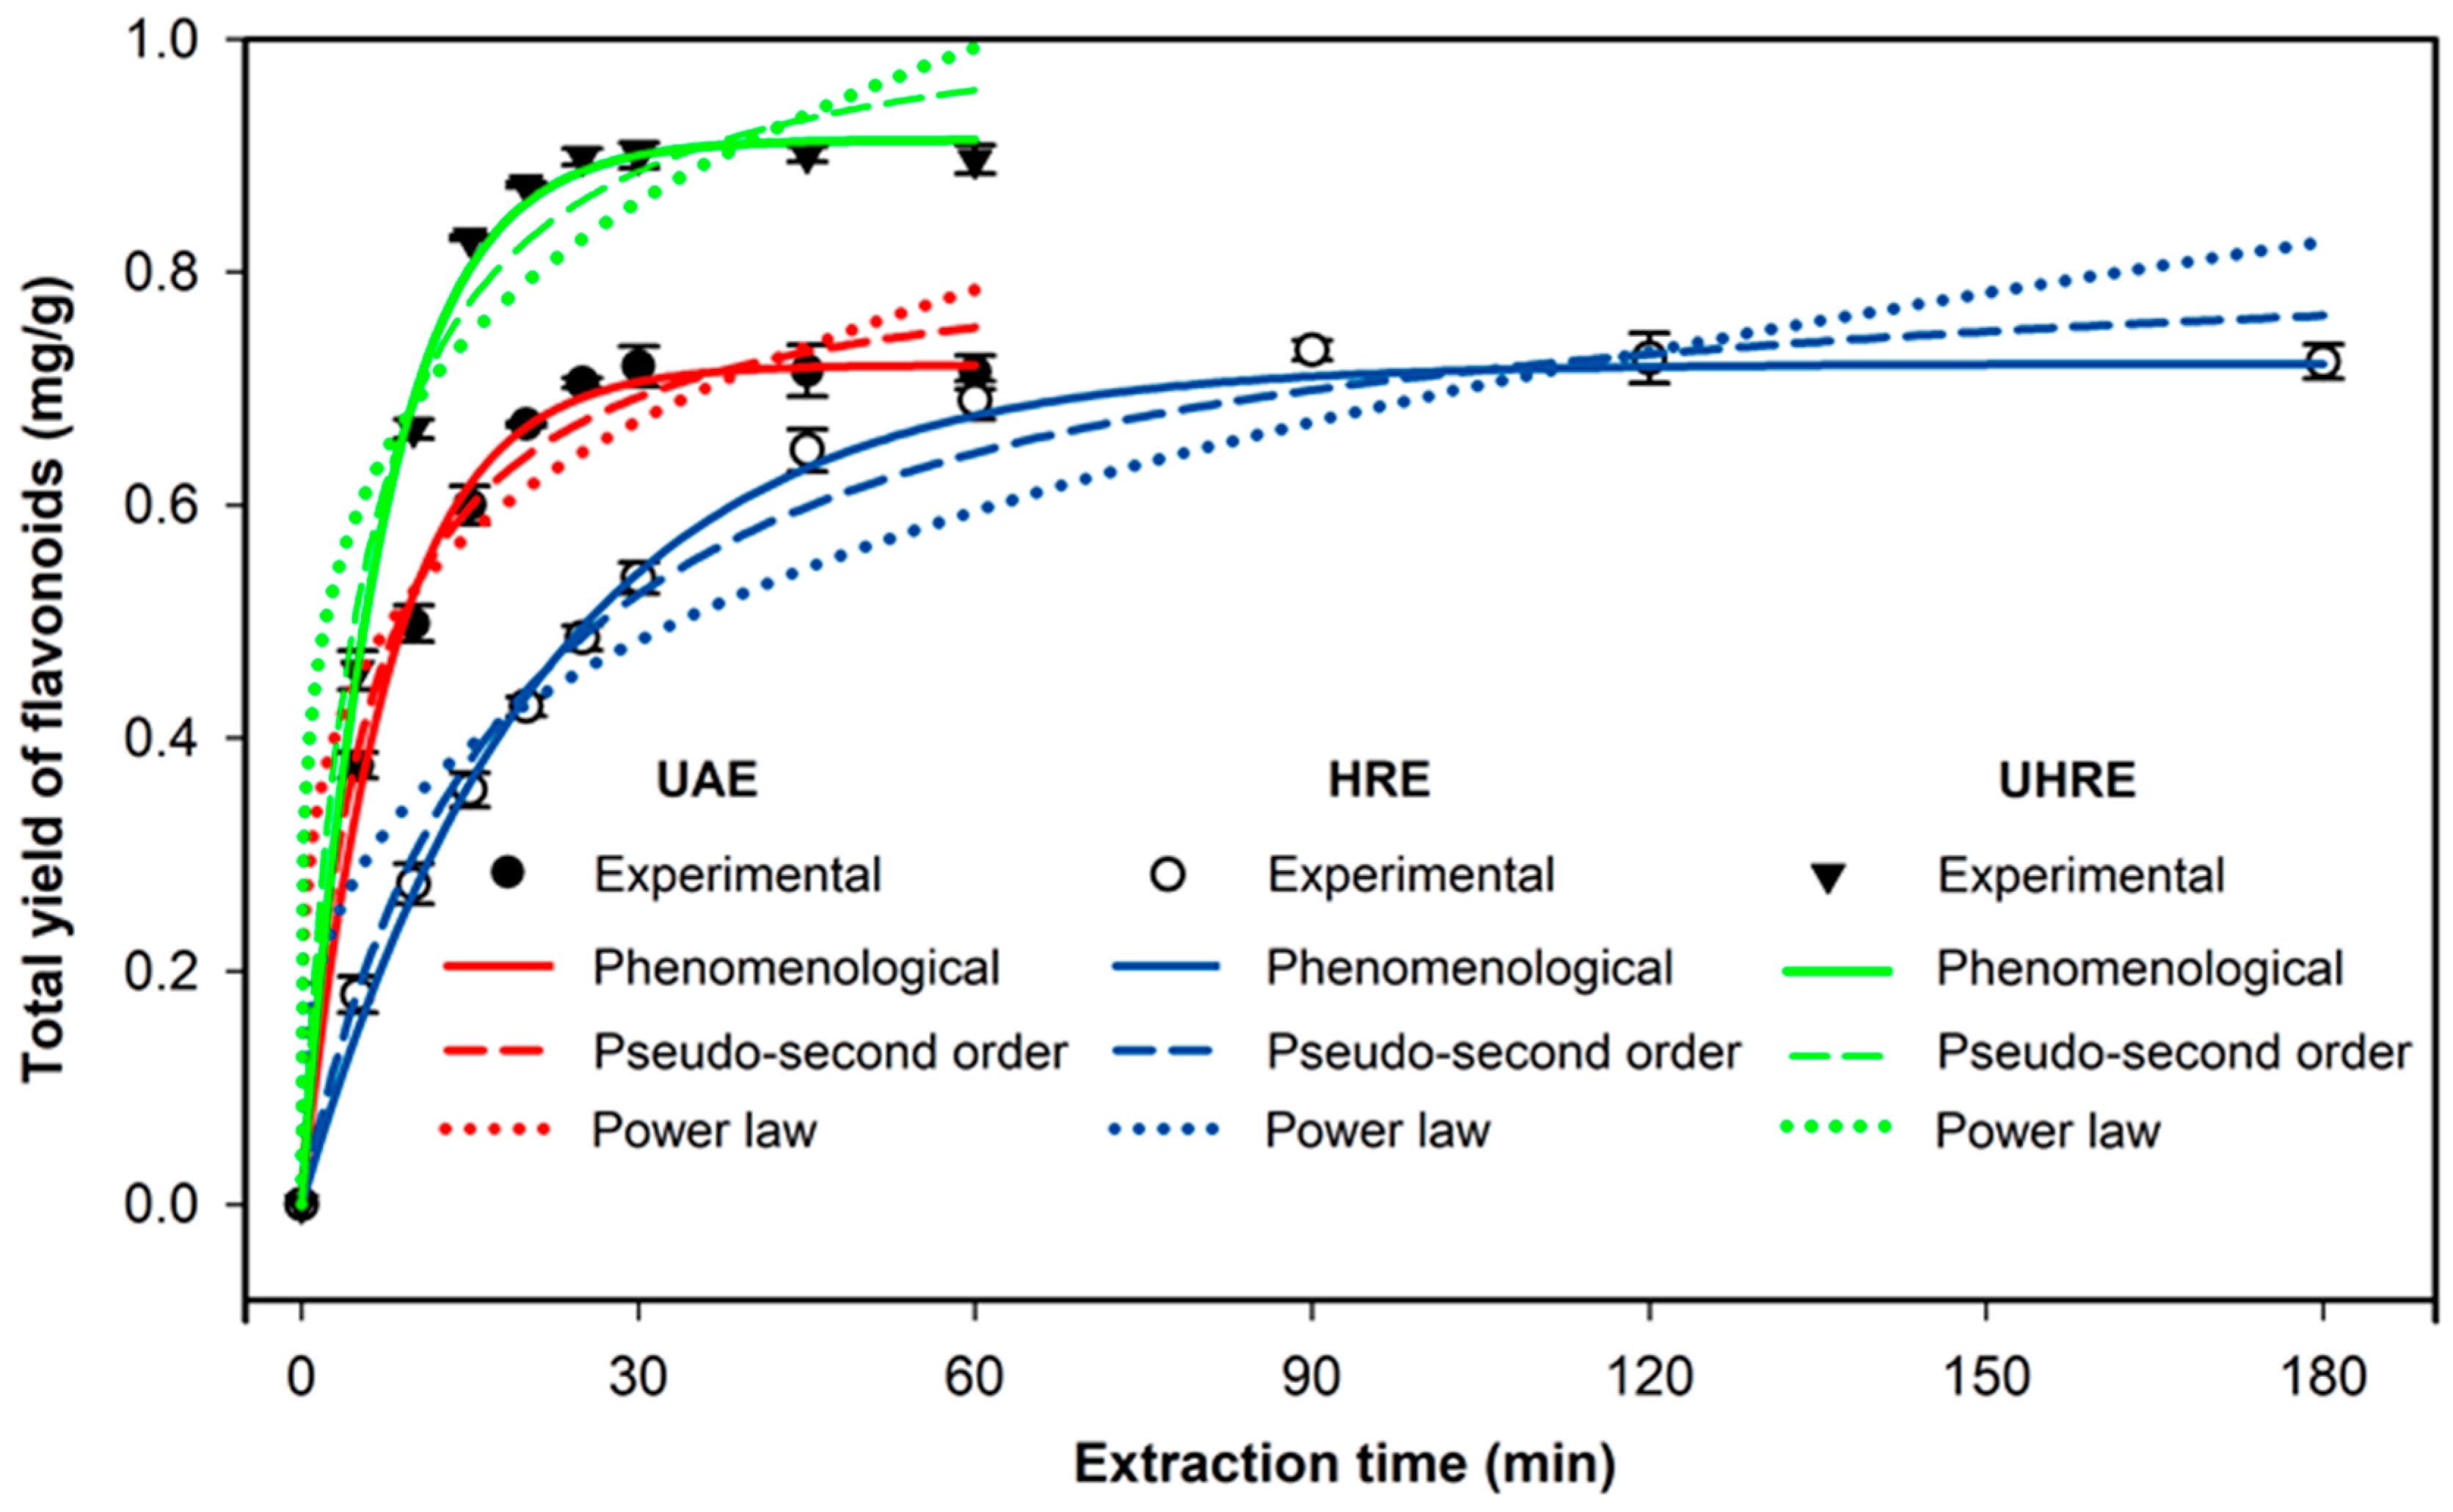
3.4.1. Extraction Kinetics for Flavonoids

It can be seen from Figure 6 that the yields of flavonoids are different at different extraction times. As can be shown from experimental data in Figure 6 that the total yield of flavonoids obtained by UAE, HRE and UHRE was significantly dependent on extraction time. The extraction of flavonoids could be finished by three successive steps: (i) a rapid increase in flavonoids yield, which was attributed to the penetration of extraction solvent into the cellular interior and the dissolution of most of the flavonoids into extraction solvent, combined with the destruction of cell walls; (ii) a slower increase in flavonoids yield, which may be due to the exhaustion of flavonoids contained in the plant materials, reducing the release of flavonoids into extraction solution; (iii) the yield of flavonoids did not significantly change, which may be due to distribution of flavonoids in plant materials, and, in the extraction solution, reached equilibrium.
Compared with UAE and HRE, UHRE was found to reduce the time consumption. The time to reach extraction equilibrium was 25 min for UHRE, 30 min for UAE and 90 min for HRE, respectively. Moreover, when the extraction equilibrium is reached, UHRE had a higher total yield of flavonoids (0.901 mg/g) than UAE (0.719 mg/g) and HRE (0.733 mg/g). The difference in yields of flavonoids was statistically significant (p < 0.01). Higher extraction efficiency of flavonoids obtained in the UHRE process from Mairei Yew leaves might be attributed to the combined effect of the boiling solvent and ultrasound. The cavitation effect is decreased when the temperature is near the solvent’s boiling point, thus causing a reduction in the desorption of target compounds from the plant matrix [24]. Therefore, using boiling 80% methanol as solvent, it is highly probably that the efficiency of ultrasound was dramatically reduced. However, compared with UAE and HRE, the increase in extraction yields of flavonoids obtained by UHRE can probably mainly be related to the shaking effect due to ultrasonic baths.
The fitting mathematical model is a useful engineering tool for the optimization, simulation, design and control of processes and contributes to better use of energy, time and solvents. The phenomenological, pseudo-second order and power law model listed in Table 1 have modeled the solid–liquid extraction process for natural products from plant materials [42,43,44,46,47]. The extraction kinetics of flavonoids (mg/g) from Mairei Yew for HRE, UAE and UHRE were investigated according to three models listed in Table 1.
The kinetic curves fitted by the models for yield of flavonoids obtained by three various methods are demonstrated in Figure 6. Figure 6 showed the kinetic curves fitted by the phenomenological models were in accordance with the experimental data, but the curves fitted by the pseudo-second order and power law model are not in accordance with the experimental data. The results of correlation coefficient (R2), standard error (SE) of estimation for the different model are presented in Table 4. Generally, phenomenological models demonstrate a good relationship with experimental data with higher R2 and lowest SE. Those phenomenological models could be applied to describe the dynamic process of extraction for flavonoids.

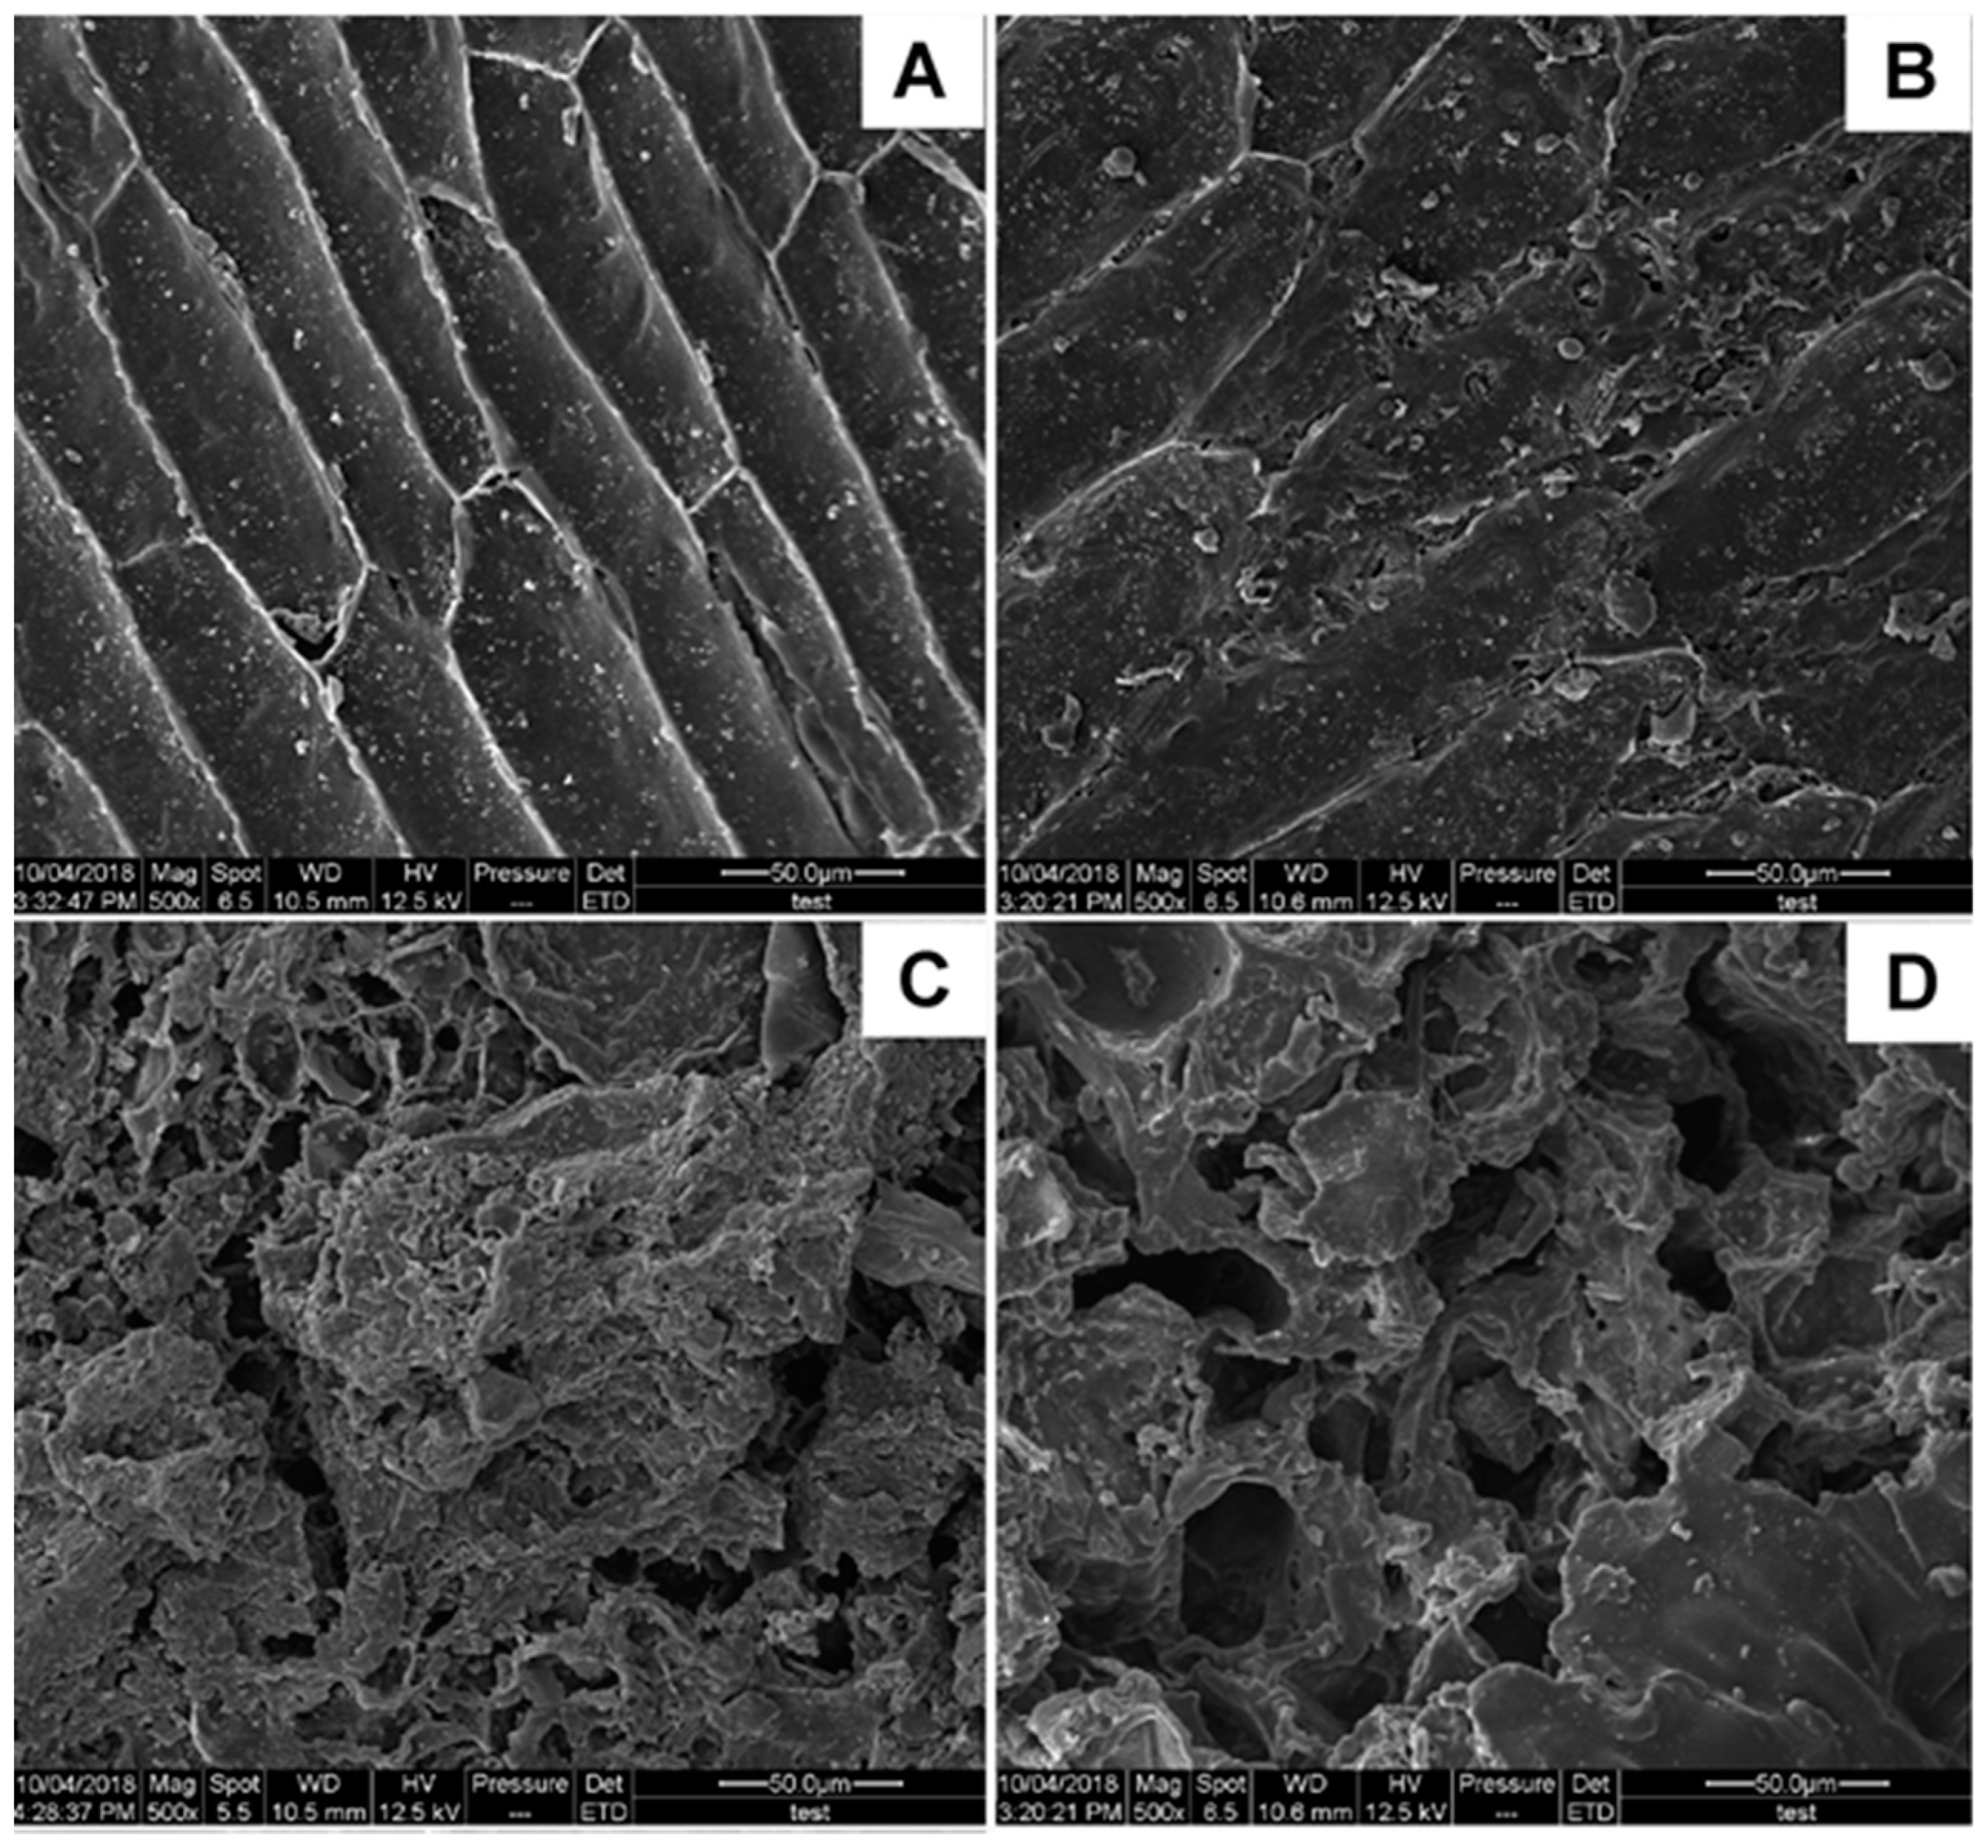
3.4.2. Estimation of Cell Disruption by Scanning Electron Microscopy (SEM)

For evaluating the relationship between yield of flavonoids and cell disruption, SEM was applied to observe the structure of raw and treated samples by different extraction methods (UAE, HRE and UHRE). Different extraction methods have different influences on the tissue of Mairei Yew leaves (Figure 7A–D). Figure 7A obviously shows that the external surface of the tissues of untreated sample was intact. Using HRE, some of the cells were partially destroyed (Figure 7B), and more cells were destroyed by UAE (Figure 7C); however, most cells were totally destroyed and collapsed using UHRE (Figure 7D). This showed that UHRE destructs cell walls more efficiently, which resulted in the higher yield of flavonoids.

4. Conclusions

In this work, it has been experimentally verified that UHRE is an effective method on the extraction of four flavonoids in Mairei Yew leaves. After single factor experiments and BBD experiments, the optimized best condition was 20 min for extracted time, 200 W for ultrasonic power and 26 mL/g for a liquid–solid ratio. By UHRE, the yields of QU, KA, GI and SC were, respectively, 0.109, 0.406, 0.031 and 0.355 mg/g, and total yield of four flavonoids was 0.901 mg/g, which were, respectively, 1.23-fold and 1.25-fold higher than those by using HRE and UAE. The reason may be that the coupling effect of ultrasound and heat–reflux increased the yield of target compounds. The extraction time was only 20 min by UHRE, relatively short, and the yields of four flavonoids were higher than those by HRE and UAE. Thus, UHRE shows an obvious advantage over HRE and UAE. Therefore, UHRE is an advantageous extraction method and it can be used well in the extraction of natural products from plants.

Author Contributions

Methodology, C.Z.; software, X.R.; validation, formal analysis and data curation, X.R., H.J., J.G., W.S., Y.L., Y.T., T.W. and S.L.; writing—original draft preparation, C.Z. and X.R.; writing—review and editing, C.Z. and C.L.; supervision, C.L.; project administration, C.Z.

Funding

This research was funded by the National Key Research and Development project of China (2017YFD0601306), the Fundamental Research Fund for Central Universities (2572017CA11), the National Natural Science Foundation (31870609) and the Natural Science Foundation of Heilongjiang province (LC2017005).

Acknowledgments

We sincerely thank two anonymous reviewers for their constructive suggestions which would help us both in English and in depth to improve the quality of the paper.

Conflicts of Interest

The authors declare no conflict of interest.

References

  1. Horwitz, S.B. Mechanism of action of taxol. Trends Pharmacol. Sci. 1992, 13, 134–136. [Google Scholar] [CrossRef]
  2. Li, W.; Liu, M.L.; Cai, J.H.; Tang, Y.X.; Zhai, L.Y. Effect of the combination of a cyclooxygenase-1 selective inhibitor and taxol on proliferation, apoptosis and angiogenesis of ovarian cancer in vivo. Oncol. Lett. 2012, 4, 168–174. [Google Scholar] [CrossRef] [PubMed] [Green Version]
  3. El-Khattouti, A.; Selimovic, D.; Haikel, Y.; Megahed, M.; Gomez, C.R.; Hassan, M. Identification and analysis of CD133(+) melanoma stem-like cells conferring resistance to taxol: An insight into the mechanisms of their resistance and response. Cancer Lett. 2014, 343, 123–133. [Google Scholar] [CrossRef] [PubMed]
  4. Zhao, C.; He, X.; Li, C.; Yang, L.; Fu, Y.; Wang, K.; Zhang, Y.; Ni, Y. A microwave-assisted simultaneous distillation and extraction method for the separation of polysaccharides and essential oil from the leaves of Taxus chinensis var. mairei. Appl. Sci. 2016, 6, 19. [Google Scholar] [CrossRef]
  5. Dhiman, A.; Nanda, A.; Ahmad, S. A quest for staunch effects of flavonoids: Utopian protection against hepatic ailments. Arab. J. Chem. 2012, 12, 1702–1711. [Google Scholar] [CrossRef]
  6. Testai, L. Flavonoids and mitochondrial pharmacology: A new paradigm for cardioprotection. Life Sci. 2015, 135, 68–76. [Google Scholar] [CrossRef] [PubMed]
  7. Raffa, D.; Maggio, B.; Raimondi, M.V.; Plescia, F.; Daidone, G. Recent discoveries of anticancer flavonoids. Eur. J. Med. Chem. 2017, 142, 213–228. [Google Scholar] [CrossRef] [PubMed]
  8. Spagnuolo, C.; Moccia, S.; Russo, G.L. Anti-inflammatory effects of flavonoids in neurodegenerative disorders. Eur. J. Med. Chem. 2018, 153, 105–115. [Google Scholar] [CrossRef] [PubMed]
  9. Cao, J.; Tong, C.; Liu, Y.; Wang, J.; Ni, X. Ginkgetin inhibits growth of breast carcinoma via regulating MAPKs pathway. Biomed. Pharmacother. 2017, 96, 450–458. [Google Scholar] [CrossRef] [PubMed]
  10. You, O.H.; Kim, S.H.; Kim, B.; Sohn, E.J.; Lee, H.J. Ginkgetin induces apoptosis via activation of caspase and inhibition of survival genes in PC-3 prostate cancer cells. Bioorg. Med. Chem. Lett. 2013, 23, 2692–2695. [Google Scholar] [CrossRef] [PubMed]
  11. Cao, J.; Lu, Q.; Liu, N.; Zhang, Y.X.; Wang, J. Sciadopitysin suppresses RANKL-mediated osteoclastogenesis and prevents bone loss in LPS-treated mice. Int. immunopharmacol. 2017, 49, 109–117. [Google Scholar] [CrossRef] [PubMed]
  12. Suh, K.S.; Lee, Y.S.; Kim, Y.S.; Choi, E.M. Sciadopitysin protects osteoblast function via its antioxidant activity in MC3T3-E1 cells. Food Chem. Toxicol. 2013, 58, 220–227. [Google Scholar] [CrossRef] [PubMed]
  13. Singh, T.; Kaur, T.; Goel, R.K. Adjuvant quercetin therapy for combined treatment of epilepsy and comorbid depression. Neurochem. Int. 2017, 104, 27–33. [Google Scholar] [CrossRef] [PubMed]
  14. Znati, M.; Hichem, B.J.; Cazaux, S.; Bouajila, J. Chemical composition, biological and cytotoxic activities of plant extracts and compounds isolated from Ferula lutea. Molecules 2014, 19, 2733–2747. [Google Scholar] [CrossRef] [PubMed]
  15. Ragab, F.A.; Yahya, T.A.; El-Naa, M.M.; Arafa, R.K. Design, synthesis and structure-activity relationship of novel semi-synthetic flavonoids as antiproliferative agents. Eur. J. Med. Chem. 2014, 82, 506–520. [Google Scholar] [CrossRef] [PubMed]
  16. El, H.A.; Shah, S.A.; Hassan, N.B.; EI, M.N.; Ahmad, R. Antioxidant activity of hispidin oligomers from medicinal fungi: A DFT study. Molecules 2014, 19, 3489. [Google Scholar]
  17. Ola, M.S.; Ahmed, M.M.; Shams, S.; Al-Rejaie, S.S. Neuroprotective effects of quercetin in diabetic rat retina. Saudi J. Biol. Sci. 2016, 24, 1186–1194. [Google Scholar] [CrossRef] [PubMed]
  18. Choi, J.H.; Park, S.E.; Kim, S.J.; Kim, S. Kaempferol inhibits thrombosis and platelet activation. Biochimie 2015, 115, 177–186. [Google Scholar] [CrossRef] [PubMed]
  19. Liao, W.; Chen, L.; Ma, X.; Jiao, R.; Li, X. Protective effects of kaempferol against reactive oxygen speciesinduced hemolysis and its antiproliferative activity on human cancer cells. Eur. J. Med. Chem. 2016, 114, 24–32. [Google Scholar] [CrossRef] [PubMed]
  20. Zou, D.L.; Chen, T.; Li, H.M.; Chen, C.; Zhao, J.Y.; Li, Y.L. Separation of three phenolic high-molecular-weight compounds from the crude extract of Terminalia chebula Retz. By ultrasound-assisted extraction and high-speed counter-current chromatography. J. Sep. Sci. 2016, 39, 1278–1285. [Google Scholar] [CrossRef] [PubMed]
  21. Ramalhete, N.; Machado, A.; Serrano, R.; Gomes, E.T.; Mota-Filipe, H. Comparative study on the in vivo antidepressant activities of the Portuguese Hypericum foliosum, Hypericum androsaemum and Hypericum perforatum medicinal plants. Ind. Crops Prod. 2016, 82, 29–36. [Google Scholar] [CrossRef]
  22. Miki, K.; Nagai, T.; Suzuki, K.; Tsujimura, R.; Koyama, K. Anti-influenza virus activity of bioflavonoids. Bioorg. Med. Chem. Lett. 2007, 17, 772–775. [Google Scholar] [CrossRef] [PubMed]
  23. Tang, X.; Zhu, D.; Huai, W.; Zhang, W.; Fu, C.; Xie, X.; Quan, S.; Fan, H. Simultaneous extraction and separation of flavonoids and alkaloids from Crotalaria sessiliflora L. by microwave-assisted cloud-point extraction. Sep. Purif. Technol. 2017, 175, 266–273. [Google Scholar]
  24. Chemat, F.; Rombaut, N.; Sicaire, A.G.; Meullemiestre, A.; Fabiano-Tixier, A.S.; Abert-Vian, M. Ultrasound assisted extraction of food and natural products. Mechanisms, techniques, combinations, protocols and applications. A review. Ultrason. Sonochem. 2017, 34, 540–560. [Google Scholar] [CrossRef] [PubMed]
  25. Åahin, S.; Samlä, R. Optimization of olive leaf extract obtained by ultrasound-assisted extraction with response surface methodology. Ultrason. Sonochem. 2013, 20, 595–602. [Google Scholar]
  26. Toma, M.; Vinatoru, M.; Paniwnyk, L.; Mason, T.J. Investigation of the effects of ultrasound on vegetal tissues during solvent extraction. Ultrason. Sonochem. 2001, 8, 137–142. [Google Scholar] [CrossRef]
  27. Carrera, C.; Ruiz-Rodriguez, A.; Palma, M.; Barroso, C.G. Ultrasound assisted extraction of phenolic compounds from grapes. Anal. Chim. Acta 2012, 732, 100–104. [Google Scholar] [CrossRef] [PubMed]
  28. Rostagno, M.A.; Palma, M.; Barroso, C.G. Ultrasound-assisted extraction of isoflavones from soy beverages blended with fruit juices. Anal. Chim. Acta 2007, 597, 265–272. [Google Scholar] [CrossRef] [PubMed]
  29. Roselló-Soto, E.; Parniakov, O.; Deng, Q.; Patras, A.; Kouba, M. Application of non-conventional extraction methods: Toward a sustainable and green production of valuable compounds from mushrooms. Food Eng. Rev. 2016, 8, 214–234. [Google Scholar] [CrossRef]
  30. Barba, F.J.; Zhu, Z.; Koubaa, M.; Sant’Ana, A.S.; Orlien, V. Green alternative methods for the extraction of antioxidant bioactive compounds from winery wastes and by-products: A review. Trends Food Sci. Technol. 2016, 49, 96–109. [Google Scholar] [CrossRef]
  31. Zhu, Z.; Guan, Q.; Guo, Y.; He, J.; Liu, G.; Li, S.I.; Barba, F.J.; Jaffrin, M.Y. Green ultrasound-assisted extraction of anthocyanin and phenolic compounds from purple sweet potato using response surface methodology. Int. Agrophys. 2016, 30, 113–122. [Google Scholar] [CrossRef] [Green Version]
  32. Li, C.; Zhang, Y.; Zhao, C.; Ni, Y.; Wang, K.; Zhang, J.; Zhao, W. Ultrosonic assisted-reflux synergistic extraction of camptothecin and betulinic acid from Camptotheca acumunata Decne. Fruits. Molecules 2017, 22, 1076. [Google Scholar] [CrossRef] [PubMed]
  33. Soria, A.C.; Villamiel, M. Effect of ultrasound on the technological properties and bioactivity of food: A review. Trends Food Sci. Technol. 2010, 21, 323–331. [Google Scholar] [CrossRef]
  34. Spigno, G.; Tramelli, L.; De Faveri, D.M. Effects of extraction time, temperature and solvent on concentration and antioxidant activity of grape marc phenolics. J. Food Eng. 2007, 81, 200–208. [Google Scholar] [CrossRef]
  35. Routray, W.; Orsat, V. Microwave-assisted extraction of flavonoids: A review. Food Bioprocess Technol. 2012, 5, 409–424. [Google Scholar] [CrossRef]
  36. Vilkhu, K.; Mawson, R.; Simons, L.; Bates, D. Applications and opportunities for ultrasound assisted extraction in the food industry—A review. Innov. Food Sci. Emerg. Technol. 2008, 9, 161–169. [Google Scholar] [CrossRef]
  37. Maran, J.P.; Manikandan, S.; Nivetha, C.V.; Dinesh, R. Ultrasound assisted extraction of bioactive compounds from Nephelium lappaceum L. fruit peel using central composite face centered response surface design. Arab. J. Chem. 2017, 10, S1145–S1157. [Google Scholar] [CrossRef]
  38. Khan, M.K.; Abert-Vian, M.; Fabiano-Tixier, A.S.; Dangles, O. Ultrasound-assisted extraction of polyphenols (flavanone glycosides) from orange (Citrus sinensis L.) peel. Food Chem. 2010, 119, 851–858. [Google Scholar] [CrossRef]
  39. Prommuak, C.; De-Eknamkul, W.; Shotipruk, A. Extraction of flavonoids and carotenoids from Thai silk waste and antioxidant activity of extracts. Sep. Purif. Technol. 2008, 62, 444–448. [Google Scholar] [CrossRef]
  40. Zhang, G.; He, L.; Hu, M. Optimized ultrasonic-assisted extraction of flavonoids from Prunella vulgaris L. and evaluation of antioxidant activities in vitro. Innov. Food Sci. Emerg. Technol. 2011, 12, 18–25. [Google Scholar] [CrossRef]
  41. Martínez-Patiño, J.C.; Gullón, B.; Romero, I.; Ruiz, E. Optimization of ultrasound-assisted extraction of biomass from olive trees using response surface methodology. Ultrason. Sonochem. 2019, 51, 487–495. [Google Scholar] [CrossRef] [PubMed]
  42. Dias, A.L.; Sergio Arroio, C.S.; Santos, P.; Barbero, G.F.; Rezende, C.A. Ultrasound-assisted extraction of bioactive compounds from dedo de moça pepper (Capsicum baccatum L.): Effects on the vegetable matrix and mathematical modeling. J. Food Eng. 2017, 198, 36–44. [Google Scholar] [CrossRef]
  43. Tušek, A.J.; Benković, M.; Cvitanović, A.B.; Valinger, D. Kinetics and thermodynamics of the solid–liquid extraction process of total polyphenols, antioxidants and extraction yield from Asteraceae plants. Ind. Crops Prod. 2016, 91, 205–214. [Google Scholar] [CrossRef]
  44. Patil, D.M.; Akamanchi, K.G. Ultrasound-assisted rapid extraction and kinetic modelling of influential factors: Extraction of camptothecin from Nothapodytes nimmoniana plant. Ultrason. Sonochem. 2017, 37, 582–591. [Google Scholar] [CrossRef] [PubMed]
  45. Li, C.; Zhang, J.; Zhao, C.; Yang, L.; Zhao, W.; Jiang, H.; Ren, X.; Su, W.; Li, Y.; Guan, J. Separation of the main flavonoids and essential oil from seabuckthorn leaves by ultrasonic/microwave-assisted simultaneous distillation extraction. R. Soc. Open Sci. 2018, 5, 180133. [Google Scholar] [CrossRef] [PubMed]
  46. Alexander, N.S. Separation and evaluation of free radical-scavenging activity of phenol components of Emblica officinalis extract by using an HPTLC-DPPH method. J. Sep. Sci. 2007, 30, 1250–1254. [Google Scholar]
  47. Xia, Y.G.; Yang, B.Y.; Wang, Q.H.; Liang, J.; Wei, Y.H.; Yu, H.D. Quantitative analysis and chromatographic fingerprinting for the quality evaluation of Forsythia suspensa extract by HPLC coupled with photodiode array detector. J. Sep. Sci. 2009, 32, 4113–4125. [Google Scholar] [CrossRef] [PubMed]
Figure 1. The chemical structures of quercetin (QU), kaempferol (KA), ginkgetin (GI) and sciadopitysin (SC).
Applsci 09 00795 g001
Figure 2. The schematic representation of the ultrasonic heat–reflux extraction device.
Applsci 09 00795 g002
Figure 3. The HPLCchromatograms for standards (a) and extract from Mairei Yew leaves (b). Peak 1 for QU (quercetin), Peak 2 for KA (kaempferol), Peak 3 for GI (ginkgetin) and Peak 4 for SC (sciadopitysin).
Applsci 09 00795 g003
Figure 4. The effect of methanol concentration (a), extraction time (b), ultrasonic power (c) and the ratio of liquid–solid (d) on the flavonoids yields.
Applsci 09 00795 g004
Figure 5. Response surface diagrams indicating the effects of variables (ultrasonic power, W; extraction time, min; liquid–solid ratio, mL/g) on the yields of QU, KA, GI and SC.
Applsci 09 00795 g005
Figure 6. The dynamic curves of total yield of flavonoids obtained using three different methods on extraction time. Total yield of flavonoids (mg/g) = QU yield + KA yield + GI yield + SC yield.
Applsci 09 00795 g006
Figure 7. SEM images of Mairei Yew leaves samples. (A) is raw materials; (BD) are, respectively, samples after HRE, UAE and UHRE.
Applsci 09 00795 g007
Table 1. Theoretical kinetic models for the extraction of flavonoids in Mairei Yew leaves.
ModelEquationReference
Phenomenological Y t = A 1 ( 1 e A 2 t ) [42]
Pseudo-second order Y t = t B 1 + B 2 t [43]
Power law Y t = C 1 t C 2 [44]
* Yt is the flavonoids yield (mg/g) at extraction time t; A1, A2, B1, B2, C1, C2 are the constants.
Table 2. The Box–Behnken design of independent variables for process optimization.
RunsIndependent VariablesYield (mg/g)
Extraction Time (X1, min)Ultrasonic Power (X2, W)Liquid–Solid Ratio (X3, mL/ g)QUKAGISC
130 (1)150 (−1)30 (0)0.0830.3260.0230.278
210 (−1)250 (1)30 (0)0.0800.2990.0200.240
320 (0)200 (0)30 (0)0.1050.4000.0300.355
420 (0)250 (1)20 (−1)0.0630.2440.0170.211
530 (1)250 (1)30 (0)0.0930.3510.0240.317
630 (1)200 (0)20 (−1)0.0600.2620.0170.207
720 (0)200 (0)30 (0)0.1050.4000.0300.355
820 (0)150 (−1)40 (1)0.0890.2930.0280.309
910 (−1)150 (−1)30 (0)0.0860.3390.0230.277
1030 (1)200 (0)40 (1)0.1010.3560.0250.319
1120 (0)200 (0)30 (0)0.1050.4000.0300.355
1220 (0)150 (−1)20 (−1)0.0680.2830.0200.239
1310 (−1)200 (0)20 (−1)0.0790.3310.0250.280
1410 (−1)200 (0)40 (1)0.0980.3650.0250.324
1520 (0)200 (0)30 (0)0.1050.4000.0300.355
1620 (0)250 (1)40 (1)0.0970.3780.0250.341
1720 (0)200 (0)30 (0)0.1050.4000.0300.355
* QU, KA, GI and SC are quercetin, kaempferol, ginkgetin and sciadopitysin, respectively.
Table 3. Analysis of variance (ANOVA) for response surface quadratic model.
SourceSum of SquaresDegrees of FreedomMean SquareF-valuep-ValueSignificance a
Yield of quercetin (QU)
Model3.68 × 10394.09 × 10432.800.000**
X13.66 × 10613.66 × 1060.290.605ns
X26.03 × 10616.03 × 1060.480.509ns
X31.64 × 10311.64 × 103131.400.000**
X1X26.59 × 10516.59 × 1055.290.055ns
X1X31.14 × 10411.14 × 1049.150.019*
X2X34.49 × 10514.49 × 1053.610.099ns
X122.21 × 10412.21 × 10417.760.004**
X226.57 × 10416.57 × 10452.730.000**
X327.52 × 10417.52 × 10460.370.000**
Residual8.72 × 10571.25 × 105
Lack of fit8.72 × 10532.91 ×105
Pure error0.0040.00
Yield of kaempferol (KA)
Model4.07 × 10294.52 × 10314.360.001**
X12.00 × 10412.00 × 1040.640.451ns
X21.18 × 10411.18 × 1040.370.560ns
X39.19 × 10319.19 × 10329.210.001**
X1X21.04 × 10311.04 × 1033.290.112ns
X1X38.88 × 10418.88 × 1042.820.137ns
X2X33.91 × 10313.91 × 10312.420.010*
X121.84 × 10311.84 × 1035.860.046*
X221.06 × 10211.06×10233.600.001**
X321.06 × 10211.06 × 10233.740.001**
Residual2.20 × 10373.15 × 104
Lack of fit2.20 × 10337.34 × 104
Pure error0.0040.00
Yield of ginkgetin (GI)
Model2.98 × 10493.31 × 1057.840.006**
X12.39 × 10612.39 × 1060.560.477ns
X26.52 × 10616.52 × 1061.540.254ns
X37.56 × 10517.56 × 10517.890.004**
X1X23.52 × 10613.52 × 1060.830.391ns
X1X31.31 × 10511.31 × 1053.110.121ns
X2X34.34 × 10914.34×1090.000.975ns
X125.67×10515.67 × 10513.420.008**
X226.58 × 10516.58 × 10515.590.006**
X325.38 × 10515.38 × 10512.750.009**
Residual2.96 × 10574.22 × 106
Lack of fit2.96 × 10539.85 × 106
Pure error0.0040.00
Yield of sciadopitysin (SC)
Model4.05 × 10294.50 × 1039.600.004**
X18.07 × 10918.07 × 1091.72 × 10−50.997ns
X23.45 × 10613.45 × 1067.35 × 10−30.934ns
X31.59 × 10211.59 × 10234.030.001**
X1X21.44 × 10311.44 × 1033.080.123ns
X1X31.19 × 10311.19 × 1032.540.155ns
X2X38.91 × 10418.91 × 1041.900.210ns
X125.11 × 10315.11 × 10310.920.013*
X227.65 × 10317.65 × 10316.320.005**
X326.06 × 10316.06 × 10312.940.009**
Residual3.28 × 10374.68 × 104
Lack of fit3.28 × 10331.09 × 103
Pure error0.0040.00
a * Significant, p < 0.05; ** Highly significant, p < 0.01; ns, not significant, p ≥ 0.05
Table 4. The kinetics models and parameters for extraction of flavonoid by UAE, HRE and UHRE.
Kinetic ModelExtraction Method *
UAEHREUHRE
Phenomenological
Equation Y t = 0.720 ( 1 e 0.130 t ) Y t = 0.721 ( 1 e 0.046 t ) Y t = 0.913 ( 1 e 0.141 t )
A10.7200.7210.913
A20.1300.0460.141
Correlation coefficient (R2)0.99480.99760.9972
Standard error (SE)0.0190.0120.016
Pseudo-second order
Equation Y t = t 6.854 + 1.215 t Y t = t 21.571 + 1.192 t Y t = t 4.932 + 0.964 t
B16.85421.5714.932
B21.2151.1920.964
Correlation coefficient (R2)0.98870.98790.9802
Standard error (SE)0.0270.0270.042
Power law
Equation Y t = 0.314 t 0.224 Y t = 0.175 t 0.299
C10.3140.1750.426
C20.2240.2990.207
Correlation coefficient (R2)0.95400.91530.9340
Standard error (SE)0.0550.0720.077
* UAE, HRE and UHRE are ultrasonic-assisted extraction, heating reflux extraction, and ultrasound and heat–reflux extraction, respectively.

