Article

A Study on Affective Dimensions to Engine Acceleration Sound Quality Using Acoustic Parameters

1
Department of Industrial Engineering & Institute for Industrial System Innovation, Seoul National University, Seoul 08826, Korea
2
Interdisciplinary Program in Cognitive Science, Seoul National University, Seoul 08826, Korea
3
Department of Industrial and Systems Engineering, North Carolina State University, Raleigh, NC 27695, USA
4
Sound Design Research Lab, Hyundai Motor Company R & D Division, Gyeonggi-do 18280, Korea
*
Author to whom correspondence should be addressed.
Appl. Sci. 2019, 9(3), 604; https://doi.org/10.3390/app9030604
Submission received: 3 December 2018 / Revised: 7 February 2019 / Accepted: 8 February 2019 / Published: 12 February 2019
(This article belongs to the Special Issue Psychoacoustic Engineering and Applications)

Abstract

:
The technical performance of recent automobiles is highly progressed and standardized across different manufacturers. This study seeks to derive a semantic space of engine acceleration sound quality for end users and identify the relation with sound characteristics. For this study, two affective attributes: ‘refined’ and ‘powerful’, and eight acoustic parameters considering revolutions per minute were used to determine the correlation coefficient for those affective attributes. In the experiment, a total of 35 automobiles were selected. Each of the 3rd gear wide open throttle sounds was recorded and evaluated by 42 adult subjects with normal hearing ability and driving license. Their subjective evaluations were analyzed using factor analysis, independent t-test, correlation analysis, and regression analysis. The prediction models for the affective dimensions show distinct differences for the revolutions per minute. From the experiment, it was confirmed that the customers’ affective response can be predicted through the acoustic parameters. In addition, it was found that the initial revolutions per minute in the accelerated condition had the greatest influence on the affective response. This study can be a useful guideline to design engine acceleration sounds that satisfy customers’ affective experience.

1. Introduction

People evaluate vehicles based on a variety of design factors such as the overall appearance of the vehicle or the sound of the engine [1,2]. In response to consumers’ tendency to be satisfied when they come across products that exceed their expectations with superior features, many companies in the automotive industry have focused on developing design elements that satisfy the human senses [3,4].
Previous studies on the engine sound of an automobile have focused on reducing noise [5]. This is because drivers are constantly exposed to the engine sound while driving and the noise has a deleterious effect on human health [6]. Sleep disorders, learning impairment, heart disease, and emotional annoyance have been reported to be related to the exposure to the noise of automobiles [7,8,9,10].
Among various types of design elements that make up an automobile, sounds provide people with a variety of affective experiences. As a result, automobile companies seek to satisfy their customers by making efforts to advance the sound qualities, while establishing their own brand identity [11,12]. For example, when designing their automobiles, Maserati designs optimum engine sounds according to the drive-mode through consultation with pianists and composers. In addition, bayerische motoren werke (BMW) is seeking to apply its brand identity to engine sound with active sound design (ASD) system.
A variety of studies have been carried out to understand the semantic space of automobile sound quality, and the semantic space of customers has been derived from various components, such as engine, door, HVAC (heat ventilation air-conditions), etc. [13,14]. These studies generally begin with the collection of affective vocabulary associated with automobile sound from a variety of sources. In the previous studies on the collection of affective vocabulary, methodologies such as free verbalization, expert interview, and literature review were mainly used [15]. These methods have the advantage of collecting affective vocabulary related to a target object fast and diversely.
Most of the previous research on the sound quality of automobile engines have performed a sound evaluation for experts and trained evaluators to derive the semantic space of a specific sound source [16,17]. However, the expected affect of the expert on the sound quality of automobiles, and the degree of auditory affect and taste may be different from that of the consumer. Therefore, it is important to derive a proper semantic space from the viewpoint of the consumer by identifying various affective variables expressing the sound quality of the automobile engine [18]. In addition, customers’ expectation of the sound quality of the automobile engine varies depending on the types of vehicle.
The sound quality of an automobile engine is structured by complicated phenomena, and various emotions, perceptions, and interpretations of people play an important role in evaluating it [19]. Therefore, it is very important to determine a common affective vocabulary that appropriately expresses the sound quality of the automobile engine. Also, previous studies have shown that engine sounds have different affective responses to people according to various states such as idle, constant and acceleration speed [4,5]. In an automobile driven by an internal combustion engine, the engine has the greatest influence on the interior sound of the automobile [20], and it generates a characteristic sound according to revolutions per minute (RPM).
The purpose of this study is to derive the representative affective dimensions of sound quality for automobile engine sound created by vehicle characteristics only for the end user, who has little prior knowledge or technical background on automobile sound. In addition, in this study, the relation with the RPM-based acoustic parameter was investigated in order to quantitatively explain the affective dimension. The remainder of this paper is organized as follows. Section 2 introduces the background theories related to this study. Section 3 describes data acquisition and research methods, and Section 4 shows the results of the experiments. Finally, the discussions and results of this study are described in Section 5 and Section 6, respectively.

2. Background

2.1. Soundscape in Automobile

Soundscape is defined as “an environment of sound with an emphasis on the way it is perceived and understood by the individual, or by a society” by Truax [21]. In recent years, the major concept of soundscape has focused on the emotional approach that affects humans [22,23]. Soundscape in automobiles is not just about eliminating noise but is also involved in providing people with specific affective experiences [24]. The soundscape in an automobile is a complex environment, relating psychological, physical, and context factors. Therefore, it is important to understand the core factors that determine the characteristics of a soundscape considering the environment of an automobile.
Affective adjectives or variables delivered through linguistic play an important role in auditory judgment based on the psychological dimension in which sound stimuli are evaluated [25]. Previous studies have focused on the interpretation of a person’s complex perception of sound through Likert’s or semantic differential scale [26]. A multidimensional evaluation of the sound of an automobile has been conducted, and it has identified the major components of their subjective feelings through questionnaires or field tests [15].
Principal component analysis (PCA) and factor analysis (FA) are commonly used to identify relationships between components of soundscape [27]. These two methods can be distinguished by the linear independence of the latent variable from the linear combination. Dunne and his colleagues conducted PCA on the power train of 33 automobiles to derive two main components: pleasant and powerful [28]. Västfjäll et al. [24] reported that there are five components of subjective feelings in automobile sounds using FA. Swart et al. [29] confirmed that the subjective dimensions of electric vehicles consist of three factors.
In order to quantitatively explain the dimension of the derived soundscape in an automobile, previous researchers used psychoacoustic parameters [30]. Huang et al. [31] designed a model to predict the sound quality of the vehicle interior noise through 10 psychoacoustic parameters, such as loudness, sharpness, roughness, etc. Li and Huang [32] proposed a prediction model of discomfort according to different road conditions and vehicle types based on psychoacoustic parameters.

2.2. Psychoacoustics

Psychoacoustics is the study of the relationship between the physical quantity of sound and subjective auditory emotion [11]. To demonstrate this relationship, physical parameters such as loudness, sharpness, roughness, SPL, and frequency are used. Loudness is a measure of acoustic intensity using size estimation in relation to human auditory perception [33]. This is a dominant feature in sound quality assessment, and loudness is the most important parameter in the preference test of vehicle design [34]. The sound pressure level (SPL) is defined as "the SPL of a 1 kHz tone in a plane wave and frontal incident that is as loud as the sound; its unit is phone, and the unit is phone" [35]. The critical band is a specific range of audio frequencies in 24 bands of Bark, and the intensity of a specific sound is the calculated volume of each important band. The mathematical equation of the loudness is shown in Equation (1).
N = 0 24 B a r k N d z
where N is the overall loudness and N′ is the specific loudness. The variable z represents the critical band.
Sharpness is related to auditory perception, which is a measure of tone and is used to measure the sound at high frequencies that play an important role in sound quality evaluation [36]. The sharpness can be estimated relatively easily by calculating the weighted area of loudness [35]. The sharpness is due to the narrowband noise corresponding to one critical bandwidth at the center frequency of 1 kHz at a level of 60 dB, where the unit is defined as 1 acum. Aures modified the Bismarck model to reflect the effect of loudness on the sharpness [37]. The mathematical expression of the sharpness calculation is shown in Equation (2).
S = 0.11 0 24 B a r k N g ( z ) z d z 0 24 B a r k N d z
where is N′ is the specific loudness, z is critical band rate and g′(z) is if z < 14, then g′(z) = 1, and if z > 14, then g′(z) = 0.00012z4 −0.0056z3 + 0.1z2−0.81z + 3.51.
Roughness has been considered as one of the important psychoacoustic parameters for its significant influence on the reduction of pleasantness [35,38], which leads to a negative effect of sound quality. The roughness is a subjective perception evoked from rapid (15–300 Hz) amplitude modulation of a sound, and Aures [38] introduced a calculation model of roughness for sound. The unit of roughness is asper and the equation of the roughness is shown in Equation (3).
R = 0.3 f mod k H z 0 24 B a r k Δ L ( z ) d z d B / B a r k
where fmod is the frequency of modulation, and ΔL(z) is the perceived masking depth.
Tonality is a measure of the ratio of tonal elements in a spectrum of complex signals. Aures and Terhardt proposed a method of calculating tonality [39,40]. According to their study, the measurement unit of tonality is tu, and 1 tu is the sine tone of 60 dB, 1 kHz. Aures [39] proposed a calculation method of tonality considering the influence of frequency, bandwidth, level, and noise of all tone components.

3. Method

3.1. Samples and Subjects

Engine sounds of 35 well-known global brand automobiles, ranging from compact to luxury, sporty cars, were recorded for jury test. In order to measure only engine noise, each sound source was recorded in a semi-anechoic chamber (See Figure 1) and as shown in Figure 2, a dummy head was placed on the front passenger seat to record. Because the sound of the engine varies according to the RPM, a sound source capable of representing various RPM is needed to analyze the more accurate affective response to the engine sound. Therefore, all sound sources of this study used 3rd gear wide open throttle (WOT) condition.
A total of 42 people participated in the jury test. The subject group was composed of 30 males and 12 females with normal hearing ability. Their ages were from 20 to 40 years (M = 31.62, SD = 6.09) and the average value of driving experience was 11.89 and the standard deviation was 5.89. To avoid owners’ preferences on car sound, which were found in the study by Kubo et al. [41], luxury car or sports car owners were excluded from the participants.

3.2. Psychoacoustic Parameter

In order to determine affective dimension to automobile engine acceleration, psychoacoustic parameters and SPL were selected. In this study, five metrics of the psychoacoustic parameter: loudness, sharpness, roughness, fluctuation strength, and tonality and three metrics of SPL: SPL, SPL-A weighted, and SPL-C weighted were used. In addition, in this study, the parameters were designed considering the revolutions per minute (RPM) of the automobile in acceleration condition. All parameters are calculated and used in three different conditions: 2000 to 5000 RPM, 2000 to 3500 RPM, and 3500 to 5000 RPM. The descriptive statistics of each parameter are shown in Table 1 below. Skewness is a measure of the degree for symmetry. The value of skewness in the dataset with a symmetric distribution is zero. Kurtosis is a measure of the degree for the combined tails in data distribution. The value of the kurtosis in the normal distribution is three. According to Hu et al. [42], if the values of skewness and kurtosis do not exceed 3.0 and 8.0 respectively, then the normality of the data distribution is assumed. The values of skewness and kurtosis the parameters used in this study were found to meet the relevant criteria.

3.3. Procedure of Sound Evaluation

The sensory evaluation was performed while listening to the recorded sound through the headphones in the listening room. The headphone used in the evaluation was Sennheiser HD850. The sensory evaluation was presented to the subjects in order of the Latin square design. The evaluation sound was freely repeated until subjective evaluation of each sound was completed. This study was approved by the research ethics committee of Seoul National University (SNUIRB NO. 1607/001-013) and was therefore conducted according to the guidelines laid down in the Declaration of Helsinki. The questionnaire consisted of 7-point Likert scale based on 12 affective adjectives as shown in Table 2. The vehicle information for each sound source was not disclosed and the sensory evaluation for each sound was performed at intervals of 1 to 2 min. The total experiment time per each evaluator took about 90 min.

3.4. Statistical Analysis

In this study, four methods of statistical analysis were used to identify the level of affect on users caused by vehicle segment. First, exploratory factor analysis (EFA) was performed to derive the representative affective dimension of engine acceleration sound. A principal component analysis was used to extract representative factors, and only those factors with an eigenvalue of 1 or more were selected [43]. The factors were rotated using the Varimax method to maintain independence among the factors. Second, in order to confirm whether there is a difference in each affective dimension according to the characteristics of the automobile, such as cylinder or size, analysis of variance (ANOVA) was performed. Third, the relationship between affective dimensions and acoustic parameters were analyzed through correlation analysis. Finally, stepwise multiple regression was performed for all automobiles, and the predictive model of each affective dimension was derived. All statistical analyses were conducted using IBM SPSS Statistics Version 24 (IBM Corp., Armonk, NY, USA).

4. Results

4.1. Extracting Representative Affective Dimension through Factor Analysis

As a result of the factor analysis, the number of factors with an eigenvalue of 1 or more was 2 (See Figure 3), and the cumulative percentage of the total variance explained was 92.804%. The value of commonalities of all affective adjectives was more than 0.5, and the results of the factor analysis are shown in Table 3 below. According to Swisher et al. [44], the value of cut-off of the appropriate factor loading in EFA is between 0.30 and 0.55. Therefore, in this study, if the value of factor loading is under 0.5, the values are not shown in the table for readability. Of the total 12 affective adjectives, seven were affective adjectives belonging to factor 1, which were luxury, harmonic, stable, refined, comfort, soft and calm. All of these variables showed factor loadings of 0.7 or more and the total cumulative was 48.814%. In this study, factor 1 was defined as ‘Refined’. In factor 2, five affective adjectives were classified as sporty, fast, powerful, sharp, and rumbling. The percentage of variance in factor 2 was 43.990%, which is defined as ‘Powerful’ in this study.

4.2. Descriptive Statistics

The outcomes of the descriptive statistics on the two representative affective dimensions derived from the factor analysis are shown in Table 4. In order to confirm an existing difference between affective dimensions in two specifications of automobiles, ANOVA was performed. First, the normality test of the data was performed through Shapiro-Wilk. As shown in Table 5, the value of p in all cases was higher than 0.05. Thus, it is evident that the normality of the data is assumed. As a result of ANOVA analysis, there was no statistically significant difference between affective dimensions according to the cylinder (V4, V6, and V8) and body size (Compact, Luxury, and Sports) (See Table 6). Therefore, in this study, the relationship between affective dimensions and acoustic parameters for all automobiles were examined.

4.3. Correlation Analysis

The results of the correlation analysis between the representative dimensions derived from the factor analysis (‘Refined’ and ‘Powerful’) and acoustic parameters (Loudness, Sharpness, Roughness, Fluctuation, Tonality, and SPL) of each RPM are shown in Table 7 below. First, in the case of ‘Refined’, the highest value of the correlation coefficient was Sharpness2000–5000 (−0.566). Sharpness in all RPM range and roughness3500–5000 showed a negative correlation with ‘Refined’, and SPL2000–5000 and SPL-A2000–3500 showed a positive correlation. This indicates that as sharpness and roughness increased, perceived refined decreased.
Second, as a result of the correlation analysis for the ‘Powerful’, the all psychoacoustic parameters in 2000 to 5000 RPM, except fluctuation, were found to be significantly related. Loudness is the parameter with the highest correlation coefficient with ‘Powerful’. In addition, unlike ‘Refined’, the psychoacoustic parameters in the 2000 to 3500 RPM also showed a significant correlation.

4.4. Regression Analysis

Stepwise multiple linear regression analysis was performed to design a model that predicts each affective dimension through acoustic parameters. Since the VIF (variance influence factor) values of all designed models were less than 10, it was found that there was no multi-collinearity. The results of the regression analysis for each range of RPM are shown in Table 8, Table 9 and Table 10. All the results in the table are shown only for the case where the R2 is highest among the results obtained through the stepwise regression analysis. First, regression analysis for the range of entire RPM from 2000 to 5000 shows that SPL, sharpness, and fluctuation are included in the predictive model for ‘Refined’. When the sharpness and fluctuation decreased and SPL increased, the value of perceived refined increased. In the case of ‘Powerful’, roughness, SPL, and SPL-A constituted the model. At the value of the standardization beta, the parameter that has the greatest influence on ‘Powerful’ is SPL-A.
Second, regression analysis was performed based on the parameters of RPM divided by 2000 to 3500 and 3500 to 5000. In the case of ‘Refined’, the regression model consisted of SPL3500–5000, sharpness3500–5000, and roughness3500–5000. In this model, SPL3500–5000 is the most dominant parameter (β = 0.835). The regression model of ‘Powerful’, the coefficient of determination from tonality3500–5000, SPL2000–3500, and SPL-A3500–5000 was 0.926.
Finally, as a result of regression analysis with all parameters, the coefficient of determination was the highest for each affective dimension. Especially, ‘Powerful’ had the highest value of the coefficient of determination among all derived regression models (R2 = 0.936), and SPL-A was the most dominant parameter (β = 1.726). In the model of ‘Refined’, SPL, SPL-A, sharpness, and fluctuation consisted of a predictive model, and the value of the coefficient of determination was 0.892. The equations derived from the regression analysis for each affective dimension were shown in Equations (4) and (5) below.
Refined = 0.045 SPL 3500 5000 3.311 S 2000 5000 0.481 F 2000 5000 + 0.023 SPL A 3500 5000 + 1.430
Powerful = 0.114 SPL 2000 5000 + 0.134 SPL A 2000 5000 0.051 SPL 2000 3500 + 10.688
where S is sharpness, F is fluctuation.

5. Discussion

This study aimed to verify that the affective response of the engine acceleration sound through acoustic parameters based on RPM occurs even for consumers who have no empirical knowledge about the automobile sound. In addition, it is found that a model can be designed to predict affective dimensions through acoustic parameters. As a result of the analysis, it was found that the engine acceleration sound developed a specific affective response of customers and the acoustic parameters based on RPM were suitable for explaining the affective response. It can be assumed that the subjects heard the engine acceleration sound for each automobile and recognized the developed affective dimensions relatively accurately.
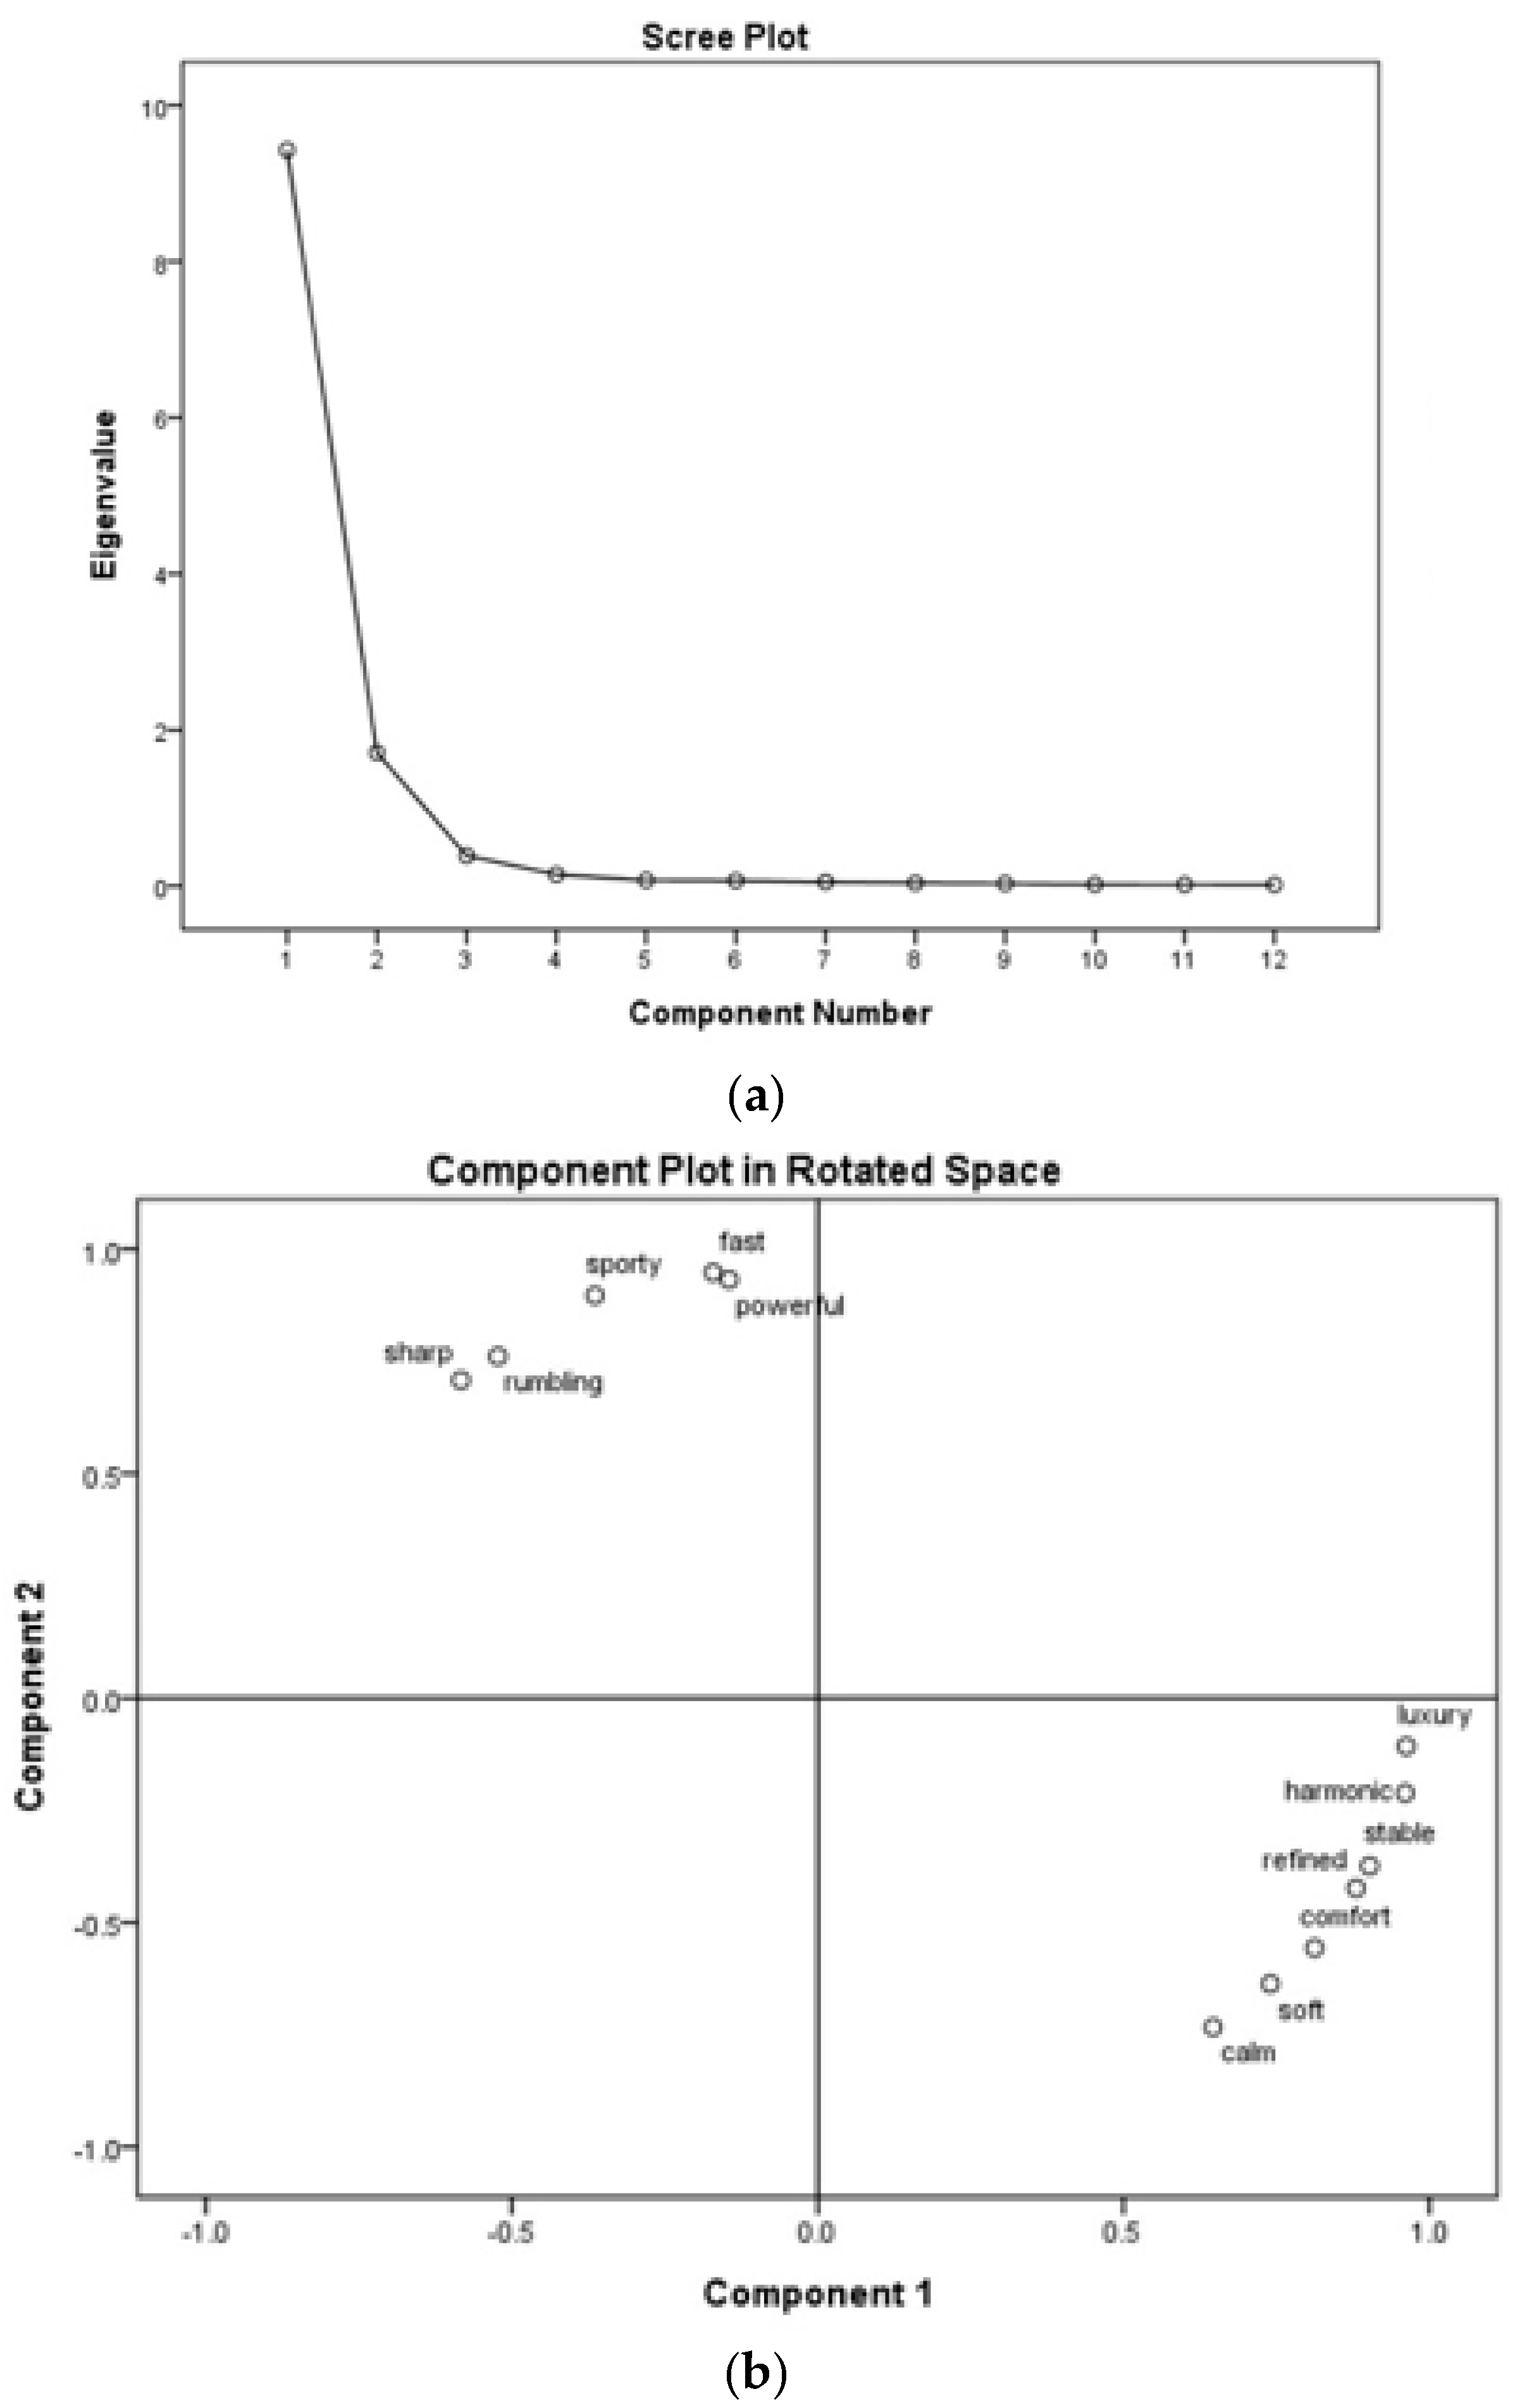
As a result of the factor analysis, two representative factors: ‘Powerful’ and ‘Refined’ in the engine acceleration sound were extracted. Previous studies on automobile sounds that explored the relationship with various acoustic parameters, where ‘Luxurious’ and ‘Sporty’ were the representative affective dimension [45,46]. Kubo et al. [41], have shown that the degree of the auditory affect felt by the driver varies depending on two driving circumstances. In the case of constant speed, two factors: ‘Pleasant’ and ‘Metallic’ were selected in 15 affective adjectives, but in the case of acceleration speed, three factors: ‘Powerful’, ‘Pleasant’ Three factors of ’Metallic’ were selected as 16 affective adjectives. Genell et al. [47] derive three representative affective adjective factors for sound interior sound in the truck. Kuwano et al. [48] selected 15 affective adjectives that user-perceived door sound in an automobile. From the factor analysis, three representative affective dimensions: metallic, pleasant, and powerful were derived.
In this study, seven affective adjectives belonged to ‘Refined’ and five affective adjectives belonged to ‘Powerful’. Compared to the research of Kubo et al. [41], they performed an auditory evaluation on Germans, but this study was conducted on Koreans. As a result, it can be seen that there is a difference in the degree of the auditory affect to the engine acceleration sound depending not only on the automobile types but also on the races. Therefore, in a future study, it is necessary to clarify the difference of the affective dimensions according to race against engine acceleration sound.
According to the results of correlation analysis, in terms of ‘Refined’, it is confirmed that the value of the correlation coefficient is the highest in sharpness. Li and Huang [32] examined the discomfort feeling of the interior noise in automobiles. They found that sharpness is one of the most important parameters when describing the discomfort of automobile sound. In terms of ‘Powerful’, it is correlated with various types of acoustic parameters compared to ‘Refined’. In the previous studies, ‘Powerful’ was one of the most mentioned variables in explaining the affective dimensions in the engine acceleration sound [4,49]. In this study, the acoustic parameters measured at the 2000 to 3500 RPM in the 3rd gear WOT sound showed a significant correlation with ‘Powerful’. Therefore, in designing the engine sound of an automobile such as sports car or muscle car that expects ‘Powerful’, the design that considers sound parameters in the corresponding RPM interval will be needed. As a result of the spectrum analysis for both types of automobiles with the same loudness, it was found that the pattern of dB-frequency is different (See Figure 4). Therefore, when evaluating the acceleration sound of an automobile, it may be necessary to consider the various types of acoustic parameters and analyze them.
The results of the regression analysis show that different models were derived for each affective dimension. First, in the case of ‘Refined’, the optimal model considering the value of R2 is consist of SPL3500–5000, Sharpness2000–5000, Fluctuation2000–5000, and SPL-A3500–5000. It can be confirmed that the affective dimensions such as satisfaction and comfort for the engine acceleration sound are similar to which previous researches have predicted through the psychoacoustic parameter [32]. In addition, the value of the standardized beta of sharpness in the entire RPM range was larger than other parameters. Kwon et al. [50] found that the psychoacoustic parameters describing the sporty sound are loudness and sharpness. They validated that sharpness had a negative effect on sound quality, and this study, too, confirmed it by obtaining the same results. In order to compare the high value of perceived refined and a low one, spectrum analysis was performed (See Figure 5). It was established that the distribution of order is different. The sample with high perceived refined is clear in the main order and the value of SPL in the other areas is small. On the other hand, samples with low perceived refined had high SPL values in the entire RPM area and had many numbers of main orders. Therefore, it is necessary to consider additional variables related to the order of the engine sound as well as psychoacoustic parameters.
In the case of ‘Powerful’, a regression model was constructed with three parameters related to SPL. Since the SPL in 2000 to 5000 and 2000 to 3500 RPM is included in the regression model, it is essential to design the source in the direction of lowering the overall SPL and improving SPL-A at low rpm. In order to compare the high value of perceived power and a low one, spectrum analysis was performed (See Figure 6). It can be seen that the band of the frequency at which the highest SPL is distributed is different. When the value of sound that perceived to be powerful was high, the power of the order seemed to be more obvious and it formed in high frequency as well.

6. Conclusions

The purpose of this study was to develop a model for predicting the affective response by acoustic parameters considering RPM on the engine acceleration sounds. In this study, 12 affective adjectives were selected through literature review, and representative affective dimensions of 3rd gear WOT sound was derived through factor analysis. In addition, acoustic parameters were selected to establish the models that predict the affective dimensions in engine acceleration sound. A total of 42 participants were recruited to the jury test. As a result of the analysis, it was confirmed that the acoustic parameters describing the affective dimensions appear differently based on the RPM. Especially, in the case of ‘Powerful’, SPL in two sections of RPM is found to be included in the regression equation. In addition, it was confirmed that the coefficient of determination of the regression equation for ‘Powerful’ is higher than that of ‘Refined’. Finally, through this study, equations for predicting the two kinds of representative affective dimensions of the engine acceleration were derived.
This study is essential to understand that the relationship between affective dimensions and acoustic parameters based on RPM can be different for each affective dimension. As a result of comparing the values of the coefficient of determination, it was confirmed that the range of the acoustic parameter and the range of RPM affecting each affective dimension are different. Therefore, in the future, there is a need to extend the research to the sound sources of various acceleration condition as well as the 3rd gear WOT performed in this study.
However, this study did not perform to examine all the vehicle segments present in the current automotive market, which makes it somewhat unreasonable to extend them to general results. Consequently, it will be possible to study designing and comparing prediction models for the entire vehicle segment by conducting additional research on SUV (sports utility vehicle) in the future. Through the present study, it was confirmed that the value of acoustic parameters at initial RPM is important in studies for the affective response of engine acceleration sound. In that respect, this report can be used as fundamental research to understand the acoustic factors that are necessary for designers when developing engine sound in an automobile. The results of this study are expected to provide a guideline to the design of automobile engine sounds that will understand the differences in perceptions of customers by vehicle segment and reflect actual customers’ needs.

Author Contributions

S.M. contributed to the analyze sound sources and to design experiments and drafted the manuscript. S.P. and D.P. (Donggun Park) contributed to conduct the experiment and they analyzed the relationship between acoustic parameters and affective dimensions. W.K. contributed to design experiments and drafted all sections of the manuscript. In addition, he supervised the entire research and proofreading of the final manuscript. M.H.Y. proposed new insights for discussion on the research and provided advice on English proofreading. D.P. (Dongchul Park) gave advice on recordings for sound sources.

Funding

This research is funded by the BK21 Plus Program (Center for Sustainable and Innovative Industrial Systems, Dept. of Industrial Engineering, Seoul National University) funded by the Ministry of Education of Korea (No. 21A20130012638).

Acknowledgments

This research is supported by the Ministry of Culture, Sports and Tourism (MCST) and Korea Culture & Tourism Institute (KCTI) Research & Development Program 2018 (SF0718205).

Conflicts of Interest

The authors declare no conflict of interest.

References

  1. Jiang, J.; Li, Y. Review of active noise control techniques with emphasis on sound quality enhancement. Appl. Acoust. 2018, 136, 139–148. [Google Scholar] [CrossRef]
  2. Yan, F.; Xiao, S.; Liu, Z.; Du, S.; Lu, C. Study on the order target of the sporty sound quality of the vehicle exhaust noise under acceleration. Proc. Inst. Mech. Eng. D-J. Automob. Eng. 2018. [Google Scholar] [CrossRef]
  3. Al-harthy, I.; Tamura, A. Sound environment evaluation and categorization of audible sounds. J. Acoust. Soc. Jpn. 1999, 20, 353–364. [Google Scholar] [CrossRef]
  4. Kim, T.; Lee, S.; Lee, H. Characterization and quantification of luxury sound quality in premium-class passenger cars. Proc. Inst. Mech. Eng. D-J. Automob. Eng. 2009, 223, 343–353. [Google Scholar] [CrossRef]
  5. Gonzalez, A.; Ferrer, M.; De Diego, M.; Pinero, G.; Garcia-Bonito, J.J. Sound quality of low-frequency and car engine noises after active noise control. J. Sound Vib. 2003, 265, 663–679. [Google Scholar] [CrossRef]
  6. Basner, M.; Babisch, W.; Davis, A.; Brink, M.; Clark, C.; Janssen, S.; Stansfeld, S. Auditory and non-auditory effects of noise on health. Lancet 2014, 383, 1325–1332. [Google Scholar] [CrossRef] [Green Version]
  7. Lercher, P.; Evans, G.W.; Meis, M. Ambient noise and cognitive processes among primary schoolchildren. Environ. Behav. 2003, 35, 725–735. [Google Scholar] [CrossRef]
  8. Bruno, P.; Marcos, Q.; Amanda, C.; Paulo, Z. Annoyance evaluation and the effect of noise on the health of bus drivers. Noise Health 2013, 15, 301. [Google Scholar] [CrossRef]
  9. Sygna, K.; Aasvang, G.M.; Aamodt, G.; Oftedal, B.; Krog, N.H. Road traffic noise, sleep and mental health. Environ. Res. 2014, 131, 17–24. [Google Scholar]
  10. Vienneau, D.; Schindler, C.; Perez, L.; Probst-Hensch, N.; Röösli, M. The relationship between transportation noise exposure and ischemic heart disease: A meta-analysis. Environ. Res. 2015, 138, 372–380. [Google Scholar] [CrossRef]
  11. Duvigneau, F.; Liefold, S.; Hoechstetter, M.; Verhey, J.L.; Gabbert, U. Analysis of simulated engine sounds using a psychoacoustic model. J. Sound Vib. 2016, 366, 544–555. [Google Scholar]
  12. Zhang, L.; Kang, J.; Luo, H.; Zhong, B. Drivers’ physiological response and emotional evaluation in the noisy environment of the control cabin of a shield tunneling machine. Appl. Acoust. 2018, 138, 1–8. [Google Scholar] [CrossRef]
  13. Kim, W.; Park, D.; Kim, Y.M.; Ryu, T.; Yun, M.H. Sound quality evaluation for vehicle door opening sound using psychoacoustic parameters. J. Eng. Res. 2018, 6, 176–190. [Google Scholar]
  14. Poveda-Martinez, P.; Kawaguchi, M.; Yamauchi, K.; Ramis-Soriano, J.J.A.A. Sound pleasantness of electrically adjustable exterior mirrors in vehicles. Appl. Acoust. 2019, 143, 190–199. [Google Scholar] [CrossRef]
  15. Parizet, E.; Guyader, E.; Nosulenko, V.J.A. Analysis of car door closing sound quality. Appl. Acoust. 2008, 69, 12–22. [Google Scholar] [CrossRef]
  16. Lee, K.-H.; Park, D.-C.; Kim, T.-G.; Jong-Kim, S.; Lee, S.-K. Characteristics of the luxury sound quality of a premium class passenger car. D-J. Automob. Eng. 2009, 223, 343–352. [Google Scholar]
  17. Nosulenko, V.; Parizet, E.; Samoylenko, E. The emotional component in perceived quality of noises produced by car engines. Int. J. Veh. Noise Vib. 2013, 9, 96–108. [Google Scholar] [CrossRef]
  18. Poirson, E.; Petiot, J.-F.; Richard, F. A method for perceptual evaluation of products by naive subjects: Application to car engine sounds. Int. J. Ind. Ergon. 2010, 40, 504–516. [Google Scholar] [CrossRef]
  19. Rhiu, I.; Kwon, S.; Yun, M.H.; Park, D.C. Analysis of relationship between brand personality and customer satisfaction on a vehicle exhaust sound. Int. J. Ind. Eng. 2016, 23, 68–82. [Google Scholar]
  20. Cerrato, G. Automotive sound quality–powertrain, road and wind noise. J. Sound Vib. 2009, 43, 16–24. [Google Scholar]
  21. Truax, B. The World Soundscape Project’s Handbook for Acoustic Ecology; Simon Fraser University, and ARC Publications: Vancouver, BC, Canada, 1978. [Google Scholar]
  22. Aletta, F.; Kang, J.; Axelsson, Ö. Soundscape descriptors and a conceptual framework for developing predictive soundscape models. Landsc. Urban Plan. 2016, 149, 65–74. [Google Scholar] [CrossRef] [Green Version]
  23. Wagner, V.; Kallus, K.W.; Foehl, U. Dimensions of vehicle sounds perception. Appl. Ergon. 2017, 64, 41–46. [Google Scholar] [CrossRef] [PubMed]
  24. Västfjäll, D.; Gulbol, M.A.; Kleiner, M. “Wow, what car is that?”: Perception of exterior vehicle sound quality. Noise Control Eng. J. 2003, 51, 253–261. [Google Scholar] [CrossRef]
  25. Cassina, L.; Fredianelli, L.; Menichini, I.; Chiari, C.; Licitra, G. Audio-visual preferences and tranquillity ratings in urban areas. Environments 2018, 5, 1. [Google Scholar] [CrossRef]
  26. Bergman, P.; Sköld, A.; Västfjäll, D.; Fransson, N. Perceptual and emotional categorization of sound. J. Acoust. Soc. Am. 2009, 126, 3156–3167. [Google Scholar] [CrossRef] [PubMed]
  27. Cain, R.; Jennings, P.; Poxon, J. The development and application of the emotional dimensions of a soundscape. Appl. Acoust. 2013, 74, 232–239. [Google Scholar] [CrossRef] [Green Version]
  28. Dunne, G.; Wheeler, A.; Jennings, P. The identification of powertrain sound quality target sounds. In Proceedings of the 29th International Congress and Exhibition on Noise Control Engineering, Nice, France, 27–30 August 2000. [Google Scholar]
  29. Swart, D.J.; Bekker, A.; Bienert, J. The subjective dimensions of sound quality of standard production electric vehicles. Appl. Acoust. 2018, 129, 354–364. [Google Scholar] [CrossRef]
  30. Nykänen, A.; Sirkka, A. Specification of component sound quality applied to automobile power windows. Appl. Acoust. 2009, 70, 813–820. [Google Scholar] [CrossRef]
  31. Huang, H.B.; Huang, X.R.; Li, R.X.; Lim, T.C.; Ding, W.P. Sound quality prediction of vehicle interior noise using deep belief networks. Appl. Acoust. 2016, 113, 149–161. [Google Scholar] [CrossRef]
  32. Li, D.; Huang, Y. The discomfort model of the micro commercial vehicles interior noise based on the sound quality analyses. Appl. Acoust. 2018, 132, 223–231. [Google Scholar] [CrossRef]
  33. Zwicker, E.; Fastl, H.; Widmann, U.; Kurakata, K.; Kuwano, S.; Namba, S. Program for calculating loudness according to DIN 45631 (ISO 532B). J. Acoust. Soc. Jpn. 1991, 12, 39–42. [Google Scholar] [CrossRef]
  34. Sottek, R.; Krebber, W.; Stanley, G.R. Tools and Methods for Product Sound Design of Vehicles; SAE Technical Paper 2005-01-2513; SAE International: Warrendale, Pennsylvania, 2005. [Google Scholar]
  35. Zwicker, E.; Fastl, H. Psychoacoustics: Facts and Models; Springer Science & Business Media: Berlin, Germany, 2013. [Google Scholar]
  36. von Bismarck, G. Sharpness as an attribute of the timbre of steady sounds. Acta Acust. United Acust. 1974, 30, 159–172. [Google Scholar]
  37. Aures, W. Der sensorische wohlklang als funktion psychoakustischer empfindungsgrössen. Acta Acust. United Acust. 1985, 58, 282–290. [Google Scholar]
  38. Aures, W. A procedure for calculating auditory roughness. Acustica 1985, 58, 268–281. [Google Scholar]
  39. Aures, W. Procedure for calculating the sensory euphony of arbitrary sound signals. Acustica 1985, 59, 130–141. [Google Scholar]
  40. Terhardt, E.; Stoll, G.; Seewann, M. Algorithm for extraction of pitch and pitch salience from complex tonal signals. J. Acoust. Soc. Am. 1982, 71, 679–688. [Google Scholar] [CrossRef]
  41. Kubo, N.; Mellert, V.; Weber, R.; Meschke, J. Categorisation of engine sound. In Proceedings of the 33rd International Congress and Exposition on Noise Control Engineering, Prague, Czech Republic, 22–25 August 2004; pp. 2284–2291. [Google Scholar]
  42. Hu, L.T.; Bentler, P.M.; Kano, Y. Can test statistics in covariance structure analysis be trusted? Psychol. Bull. 1992, 112, 351. [Google Scholar] [CrossRef]
  43. Yong, A.G.; Pearce, S. A beginner’s guide to factor analysis: Focusing on exploratory factor analysis. Tutor. Quant. Methods Psychol. 2013, 9, 79–94. [Google Scholar] [CrossRef]
  44. Swisher, L.L.; Beckstead, J.W.; Bebeau, M.J. Factor analysis as a tool for survey analysis using a professional role orientation inventory as an example. Phys. Ther. 2004, 84, 784–799. [Google Scholar]
  45. Brandl, F.; Biermayer, W.; Thomann, S. Objective description of the required interior sound for exclusive passenger cars. Fortschr. Akustik. 2000, 26, 140–141. [Google Scholar]
  46. Kubo, N.; Mellert, V.; Weber, R.; Meschke, J. Engine sound perception: Apart from so-called engine order analysis. In Proceedings of the CFA/DAGA, Strasbourg, France, 22–25 March 2004; pp. 867–868. [Google Scholar]
  47. Genell, A.; Västfjäll, D.; Kleiner, M.; Hedlund, A. Components in evaluation of complex interior truck sounds. J. Low Freq. Noise Vibr. Act. Control 2006, 25, 227–237. [Google Scholar] [CrossRef] [Green Version]
  48. Kuwano, S.; Fastl, H.; Namba, S. Subjective evaluation of car door sound. In Proceedings of the Sound Quality Symposium, Dearborn, MI, USA, 22 August 2002. [Google Scholar]
  49. Fukuhara, C.; Kamura, T.; Suetomi, T. Subjective evaluation of engine acceleration sound with driving simulator. JSAE Rev. 2002, 23, 435–441. [Google Scholar] [CrossRef]
  50. Kwon, G.; Park, H.S.; Lee, S.I.; Kim, Y.S.; Kang, Y.J. Design of Sporty SQI using Semantic Differential and Verification of its Effectiveness. In Proceedings of the Inter-Noise and Noise-Con Congress, Hamburg, Germany, 21 August 2016; pp. 4944–4951. [Google Scholar]
Figure 1. Semi-anechoic room and dynamometer for sound recording.
Applsci 09 00604 g001
Figure 2. Dummy head used in the study and an example of the installation.
Applsci 09 00604 g002
Figure 3. Results of scree plots (a) and principal component analysis (b) for automobile acceleration sound.
Applsci 09 00604 g003
Figure 4. Results of spectrum analysis of engine acceleration sound for the same loudness.
Applsci 09 00604 g004
Figure 5. Results of spectrum analysis for samples with the highest (upper side) and lowest (lower side) score of perceived refined.
Applsci 09 00604 g005
Figure 6. Results of spectrum analysis for samples with the highest (upper side) and lowest (lower side) score of perceived power.
Applsci 09 00604 g006
Table 1. Result of descriptive statistics for psychoacoustic parameters and acoustic parameters.
ParameterMinMaxMeanSDSkewnessKurtosis
Loudness2000–50006.3058.4018.9210.482.255.63
Sharpness2000–50000.741.340.890.112.177.67
Roughness2000–50000.523.671.700.541.474.38
Fluctuation2000–50000.040.850.220.221.822.58
Tonality2000–50000.030.270.120.061.041.00
SPL2000–500079.4299.6490.254.910.20−0.34
SPL-A2000–500050.5485.7266.317.420.961.08
SPL-C2000–500072.9398.2583.745.340.940.91
Loudness2000–35009.9566.9026.9712.661.712.54
Sharpness2000–35000.771.811.080.172.217.38
Roughness2000–35000.944.182.340.541.134.42
Fluctuation2000–35000.040.390.130.091.501.14
Tonality2000–35000.050.390.140.071.312.77
SPL2000–350085.71104.1294.404.480.36−0.48
SPL-A2000–350059.0087.4471.736.921.000.46
SPL-C2000–350079.8097.2886.844.421.140.57
Loudness3500–50008.1162.7022.8711.441.984.01
Sharpness3500–50000.831.570.990.142.357.91
Roughness3500–50000.944.182.340.541.144.42
Fluctuation3500–50000.010.230.040.052.526.77
Tonality3500–50000.040.320.130.061.212.53
SPL3500–500083.63102.1792.884.510.34−0.43
SPL-A3500–500056.6186.6969.857.041.010.54
SPL-C3500–500077.6197.7985.644.711.090.66
Table 2. Seven-point Likert’s scale questionnaire for this study.
Extremely DisagreeDisagreeSlightly DisagreeNeutralSlightly AgreeAgreeExtremely Agree
ComfortV
Stable V
RefinedV
Soft V
Luxury V
Harmonic V
Calm V
Sporty V
Fast V
Powerful V
Sharp V
Rumbling V
Table 3. Results of factor analysis for extracting representative affective dimensions in engine sound.
Component
Factor1Factor2
luxury0.962
harmonic0.960
stable0.902
refined0.880
comfort0.812
soft0.740
calm0.647
fast 0.948
powerful 0.932
sporty 0.897
rumbling 0.761
sharp 0.708
Table 4. Descriptive statistics for affective dimensions in samples.
Sample No.RefinedPowerful
minMaxMeanSDminMaxMeanSD
13.444.724.300.393.534.474.300.39
23.315.144.440.762.834.944.440.88
33.285.294.090.753.924.444.090.21
43.285.183.560.413.423.783.560.13
53.674.644.060.303.724.504.060.32
63.975.354.770.593.365.184.770.54
73.545.144.240.363.194.644.240.59
83.164.313.650.383.754.113.650.15
93.394.734.310.363.424.674.310.47
103.254.954.280.613.394.674.280.53
114.565.754.480.613.864.794.480.59
123.165.173.970.862.865.223.970.94
133.565.064.410.933.694.644.410.40
142.254.613.310.832.813.783.310.31
153.535.604.660.563.945.134.660.17
163.055.254.000.932.834.694.000.69
173.135.064.350.643.864.784.350.28
183.374.894.090.573.674.524.090.22
193.614.974.650.554.065.104.650.09
203.675.014.190.483.894.524.190.12
212.894.233.670.433.314.643.670.53
224.114.754.490.483.574.734.490.34
232.795.434.111.112.895.184.110.88
242.893.923.210.303.273.833.610.29
253.515.174.230.414.004.754.230.33
263.784.964.420.284.084.674.420.28
273.284.834.190.123.284.784.190.7
283.975.474.930.214.395.124.930.23
293.365.434.240.253.654.674.240.29
303.174.673.840.313.704.173.840.09
313.394.974.280.274.084.464.280.13
323.144.694.000.233.674.364.000.34
333.254.744.320.104.294.794.320.21
343.274.834.300.563.484.914.300.53
352.754.934.570.273.765.014.570.81
Table 5. Results for tests of normality.
Affective DimensionCategoryShapiro-Wilk
Statisticdfp
RefinedCylinderV40.947140.517
V60.961110.790
V80.931100.453
PowerfulV40.938140.388
V60.930110.409
V80.920100.356
RefinedTypeCompact0.941140.437
Luxury0.954110.694
Sports0.861100.078
Powerful Compact0.973140.909
Luxury0.931110.422
Sports0.936100.505
Table 6. Results of ANOVA for extracting representative affective dimensions in engine sound.
CategoryAffective DimensionSum of SquaresdfMean SquareFp
CylinderRefinedBetween0.01120.0060.0420.959
Within4.244320.133
Total4.25534
PowerfulBetween0.30520.1530.4430.646
Within11.031320.345
Total11.33634
SizeRefinedBetween1.17720.5881.8530.173
Within10.159320.317
Total11.33634
PowerfulBetween0.37320.1861.5360.231
Within3.882320.121
Total4.25534
Table 7. Results of correlation analysis between affective dimension and acoustic parameter.
Acoustic ParameterRefinedPowerful
Loudness2000–5000 0.624 **
Sharpness2000–5000−0.566 **0.596 **
Roughness2000–5000 0.630 **
Fluctuation2000–5000
Tonality2000–5000 0.519 **
SPL2000–50000.468 **
SPL-A2000–5000 0.619 **
SPL-C2000–5000 0.506 **
Loudness2000–3500 0.575 **
Sharpness2000–3500−0.382 *0.597 **
Roughness2000–3500 0.575 **
Fluctuation2000–3500 0.517 **
Tonality2000–3500 0.475 **
SPL2000–3500
SPL-A2000–35000.489 **0.563 **
SPL-C2000–3500 0.467 **
Loudness3500–5000 0.606 **
Sharpness3500–5000−0.449 *0.629 **
Roughness3500–5000−0.340 *0.577 **
Fluctuation3500–5000
Tonality3500–5000 0.549 **
SPL3500–5000
SPL-A3500–5000 0.577 **
SPL-C3500–5000 0.489 **
Note. *: p < 0.05, **: p < 0.01.
Table 8. Results of regression analysis of affective dimensions for acoustic parameters from 2000 to 5000 RPM.
Affective DimensionAcoustic ParameterBErrorβFpVIFR2
RefinedConstant0.6350.461 1.3790.178 0.858
SPL2000–50000.0640.0050.8858.7820.0000.813
Sharpness2000-5000−2.3700.232−0.736−5.2100.0000.883
Fluctuation2000–5000−0.3690.114−0.231−3.2320.0030.898
PowerfulConstant9.8450.711 13.8510.000 0.907
Roughness2000–50000.0590.1130.0555.5200.0003.746
SPL2000–5000−0.1580.012−1.341−12.6990.0003.717
SPL-A200–50000.1330.0121.70611.2840.0007.616
Table 9. Results of regression analysis of affective dimensions for acoustic parameters from 2000 to 3500 and 3500 to 5000 RPM.
Affective DimensionAcoustic ParameterBErrorβFpVIFR2
RefinedConstant0.5970.754 0.7920.434 0.785
SPL3500–50000.0650.0120.8356.9510.0000.780
Sharpness3500–5000−1.7930.231−0.707−4.7570.0000.818
Roughness3500–5000−0.3520.114−0.192−2.2650.0310.949
PowerfulConstant10.2660.644 5.4720.000 0.926
Tonality3500–50002.7550.5470.2773.4810.0010.782
SPL2000–3500−0.1460.360−1.133−4.3760.0000.382
SPL-A3500–50000.1100.0271.3395.8310.0000.332
Table 10. Results of regression analysis of affective dimensions for all acoustic parameters.
Affective DimensionAcoustic ParameterBErrorβFpVIFR2
RefinedConstant1.4300.592 2.4140.022 0.892
SPL3500–50000.0450.0090.5424.9020.0003.708
Sharpness2000–5000−3.3110.280−0.960−11.8380.0001.996
Fluctuation20005000−0.4810.107−0.281−4.5060.0001.184
SPL-A3500–50000.0230.0070.4233.0940.0045.682
PowerfulConstant10.6880.544 8.0930.000 0.936
SPL2000–5000−0.1140.215−0.966−4.2370.0008.471
SPL-A2000–50000.1340.1071.7268.9360.0003.552
SPL2000–3500−0.0510.083−0.397−3.8490.0015.201

