Article

Influence of Soil Pore System Properties on the Degradation Rates of Organic Substances during Soil Aquifer Treatment (SAT)

Research Group INOWAS, Department of Hydrosciences, Technische Universität Dresden, 01069 Dresden, Germany
*
Author to whom correspondence should be addressed.
Appl. Sci. 2019, 9(3), 496; https://doi.org/10.3390/app9030496
Submission received: 7 December 2018 / Revised: 28 January 2019 / Accepted: 29 January 2019 / Published: 1 February 2019

Abstract

:

Featured Application

The outcomes of the study are useful for the planning and operation of soil aquifer treatment (SAT) facilities. The results of the experiments provide knowledge about the correlations between the grain size fractions of soil and the availability of nutrients as well as oxygen in the soil pore system during the operation of such systems. This makes it possible to choose soils for SAT systems, providing optimal conditions for microbiological growth, and thus to ensure optimal conditions for water quality improvement.

Abstract

Soil aquifer treatment (SAT) is a nature-inspired solution for improving the water quality through soil percolation. The biodegradation of organic matter typically occurs in the shallowest soil layer and it depends on the contaminant’s characteristics (water solubility, molecular structure) and specific soil properties (pore size distribution). The present study aims at identifying which grain size fraction of typically used sandy soils in the shallowest layer of SAT systems can provide the optimal conditions for microbiological growth that can be reached by a trade-off between soil moisture as well as nutrients and oxygen supply. For this, soil columns were used at a laboratory scale to determine the relationship between the pore size distribution of four different grain size fractions and biodegradation rates of organic matter from synthetic wastewater. The results obtained from this experimental setup indicate that bacterial colonies reached optimum growth when about 60% of the available pore space was filled with water. For the selected soil, this was achieved by the fraction with grain sizes in the range of 630 µm to 1000 µm, having pore diameters between 87 µm and 320 µm and a mean pore diameter of 230 µm.

1. Introduction

Nowadays, around 780 million people suffer from water scarcity and the numbers are expected to increase due to population growth, economic development and climate change [1,2,3]. By 2025, two billion people will be living in countries or regions with water scarcity and two-thirds of the world’s population will be living under water-stressed conditions [4,5].
The managed recharge of aquifers (MAR) has been successfully applied in different countries for mitigating the effects of water scarcity [6]. The method implies the use of excess surface water to recharge an aquifer under controlled conditions for later use or environmental benefits [7]. MAR application enhances the capacity of existing water supply systems, contributes to the prevention of saltwater intrusion into coastal aquifers and reduces evaporation by storing water in the subsurface layer [3,7]. Further advantages include the use of soil and aquifer treatment capacity (SAT) for the removal of organic matter, viruses and pathogens from the infiltration water.
The technical performance of SAT systems is characterized by two key factors: the maximum amount of water that can be infiltrated and the degree of water purification during water percolation through the soil. These factors depend mainly on the quality of the infiltration water, the operational conditions and the specific properties of the shallowest soil layer in the infiltration basins. In some cases, facility operators embed sand with very low organic matter in this layer. The sand acts as medium for the filtration of suspended particles and as substrate for bacterial development. Otherwise, infiltration takes place through naturally existing sandy soils with similar characteristics.
For the efficient degradation of organic matter, the shallowest soil layer must provide sufficient water, nutrients and oxygen to native bacterial communities. The supply capacity is influenced by the properties of the soil matrix such as pore size distribution (PSD) [8,9,10]. PSD is defined as the relative abundance of different pore sizes in a representative volume of soil.
Pore sizes in loose rock sediments are characterized according to their drainage or water holding capacity and are divided into fine pores (equivalent diameter < 0.2 µm), medium-sized pores (from 0.2 µm to 10 µm), fine coarse pores (from 10 µm to 50 µm) and wide coarse pores (>50 µm) [11]. Each pore size depicts a different ability to transport and store water, nutrients and oxygen, which is crucial for microbial activity and further for bioavailability of nutrients [11]. The transport of water containing nutrients and oxygen is poorer in less-drainable, fine pores which form low-porosity media than in well-drainable coarse pores. By contrast, water holding capacity (and implicitly the availability of nutrients) is higher in poorly drainable, fine pores than in coarse pores [9,12]. The performance of soil microorganisms is largely dependent on water, nutrients, and soil aeration [13,14,15,16]. If the soil moisture content is too low, the water diffusion into the cell (driven by the concentration gradient of the solute) is reversed, which leads to microbial cellular water loss (desiccation stress), and further to diminished microbial activity [17,18]. Additionally, low soil moisture can also be the reason for insufficient supply of microbes with essential nutrients. In the short term, this may induce states of relative inactivity while in the long term, the starvation of the microbes in unsaturated sites may severely limit the rates of biodegradation [19,20,21,22]. By contrast, a high soil moisture content is correlated with oxygen deficiency in the system and also leads to the reduction of the biodegradation rates [19,23,24,25]. The minimum volume of pore space filled with air should be higher than 10% for the occurrence of aerobic biodegradation [26]. At lower values, the biodegradation process will be anaerobic because of the lack of oxygen.
As a consequence, optimal bacterial activity and development require a trade-off between oxygen (low soil moisture content) and nutrient availability (high soil moisture content). Extreme situations such as very wet or very dry soil conditions significantly reduce the biodegradation rates [27,28]. Aerobic microbial activity increases with soil water content until a point is reached where the diffusion and availability of oxygen are limited by the water [29,30,31]. There is an optimum for microbial activity at a specific water content coupled with a specific exchange of air in the pore space [32].
Often the moisture content in the soil, given in percentage of water saturation, field capacity (FC) or water holding capacity (WHC), is used as a criterion for the evaluation of conditions for biodegradation of organic substances. The field capacity is a range of soil moisture content that represents the amount of water which can be held against gravity through capillary and adsorption forces [33,34]. Water holding capacity is defined as the water retained between field capacity and wilting point [32,34]. Thereby, the soil moisture content is influenced by the bulk density and the pore size distribution [35,36].
Another parameter that can be used as indicator for the suitability of soils for biodegradation of organic substances is the water-filled pore space (WFPS). Determination of WFPS requires knowledge of the soil volume, gravimetric soil water content and soil bulk density. Some studies [19,37,38,39,40,41] indicate that maximum microbial activity can be achieved at WFPS = 60%.
In the case of SAT basins, most microbiological activity occurs in the shallowest soil layer where trade-off conditions for water, nutrients and oxygen supply are easier to be met. Therefore, it is important to select soils that provide a WFPS which can ensure optimal conditions for bacterial growth. Selection of soils with unsuitable grain size distribution can have a negative effect on the overall system’s efficiency, such as poor supply of nutrients and oxygen or low water retention capacity.
In practice, sands or sandy soils in their natural condition are used in the shallowest layer of SAT basins. So the aim of this paper is to identify the relationship between different soil fractions of a sandy soil typically used in SAT systems and the biodegradation of organic compounds. The parameters considered in the analysis are the pore size distribution, the mean pore diameter and the water-filled pore space of four different grain size fractions. Knowledge of the relationship can be helpful during the planning and operation of SAT systems. Thus, it is possible to ensure optimal availability of oxygen and nutrients as well as sufficient soil moisture content needed for purification processes in the shallowest soil layer.
For comparison purposes, the four fractions were obtained from the same soil type, so the results are applied only for this particular example. Nevertheless, the values achieved will be compared with those obtained from experiments run under different boundary conditions in order to confirm the applicability of present results for other site-specific conditions (soil type, organic compounds).

2. Materials and Methods

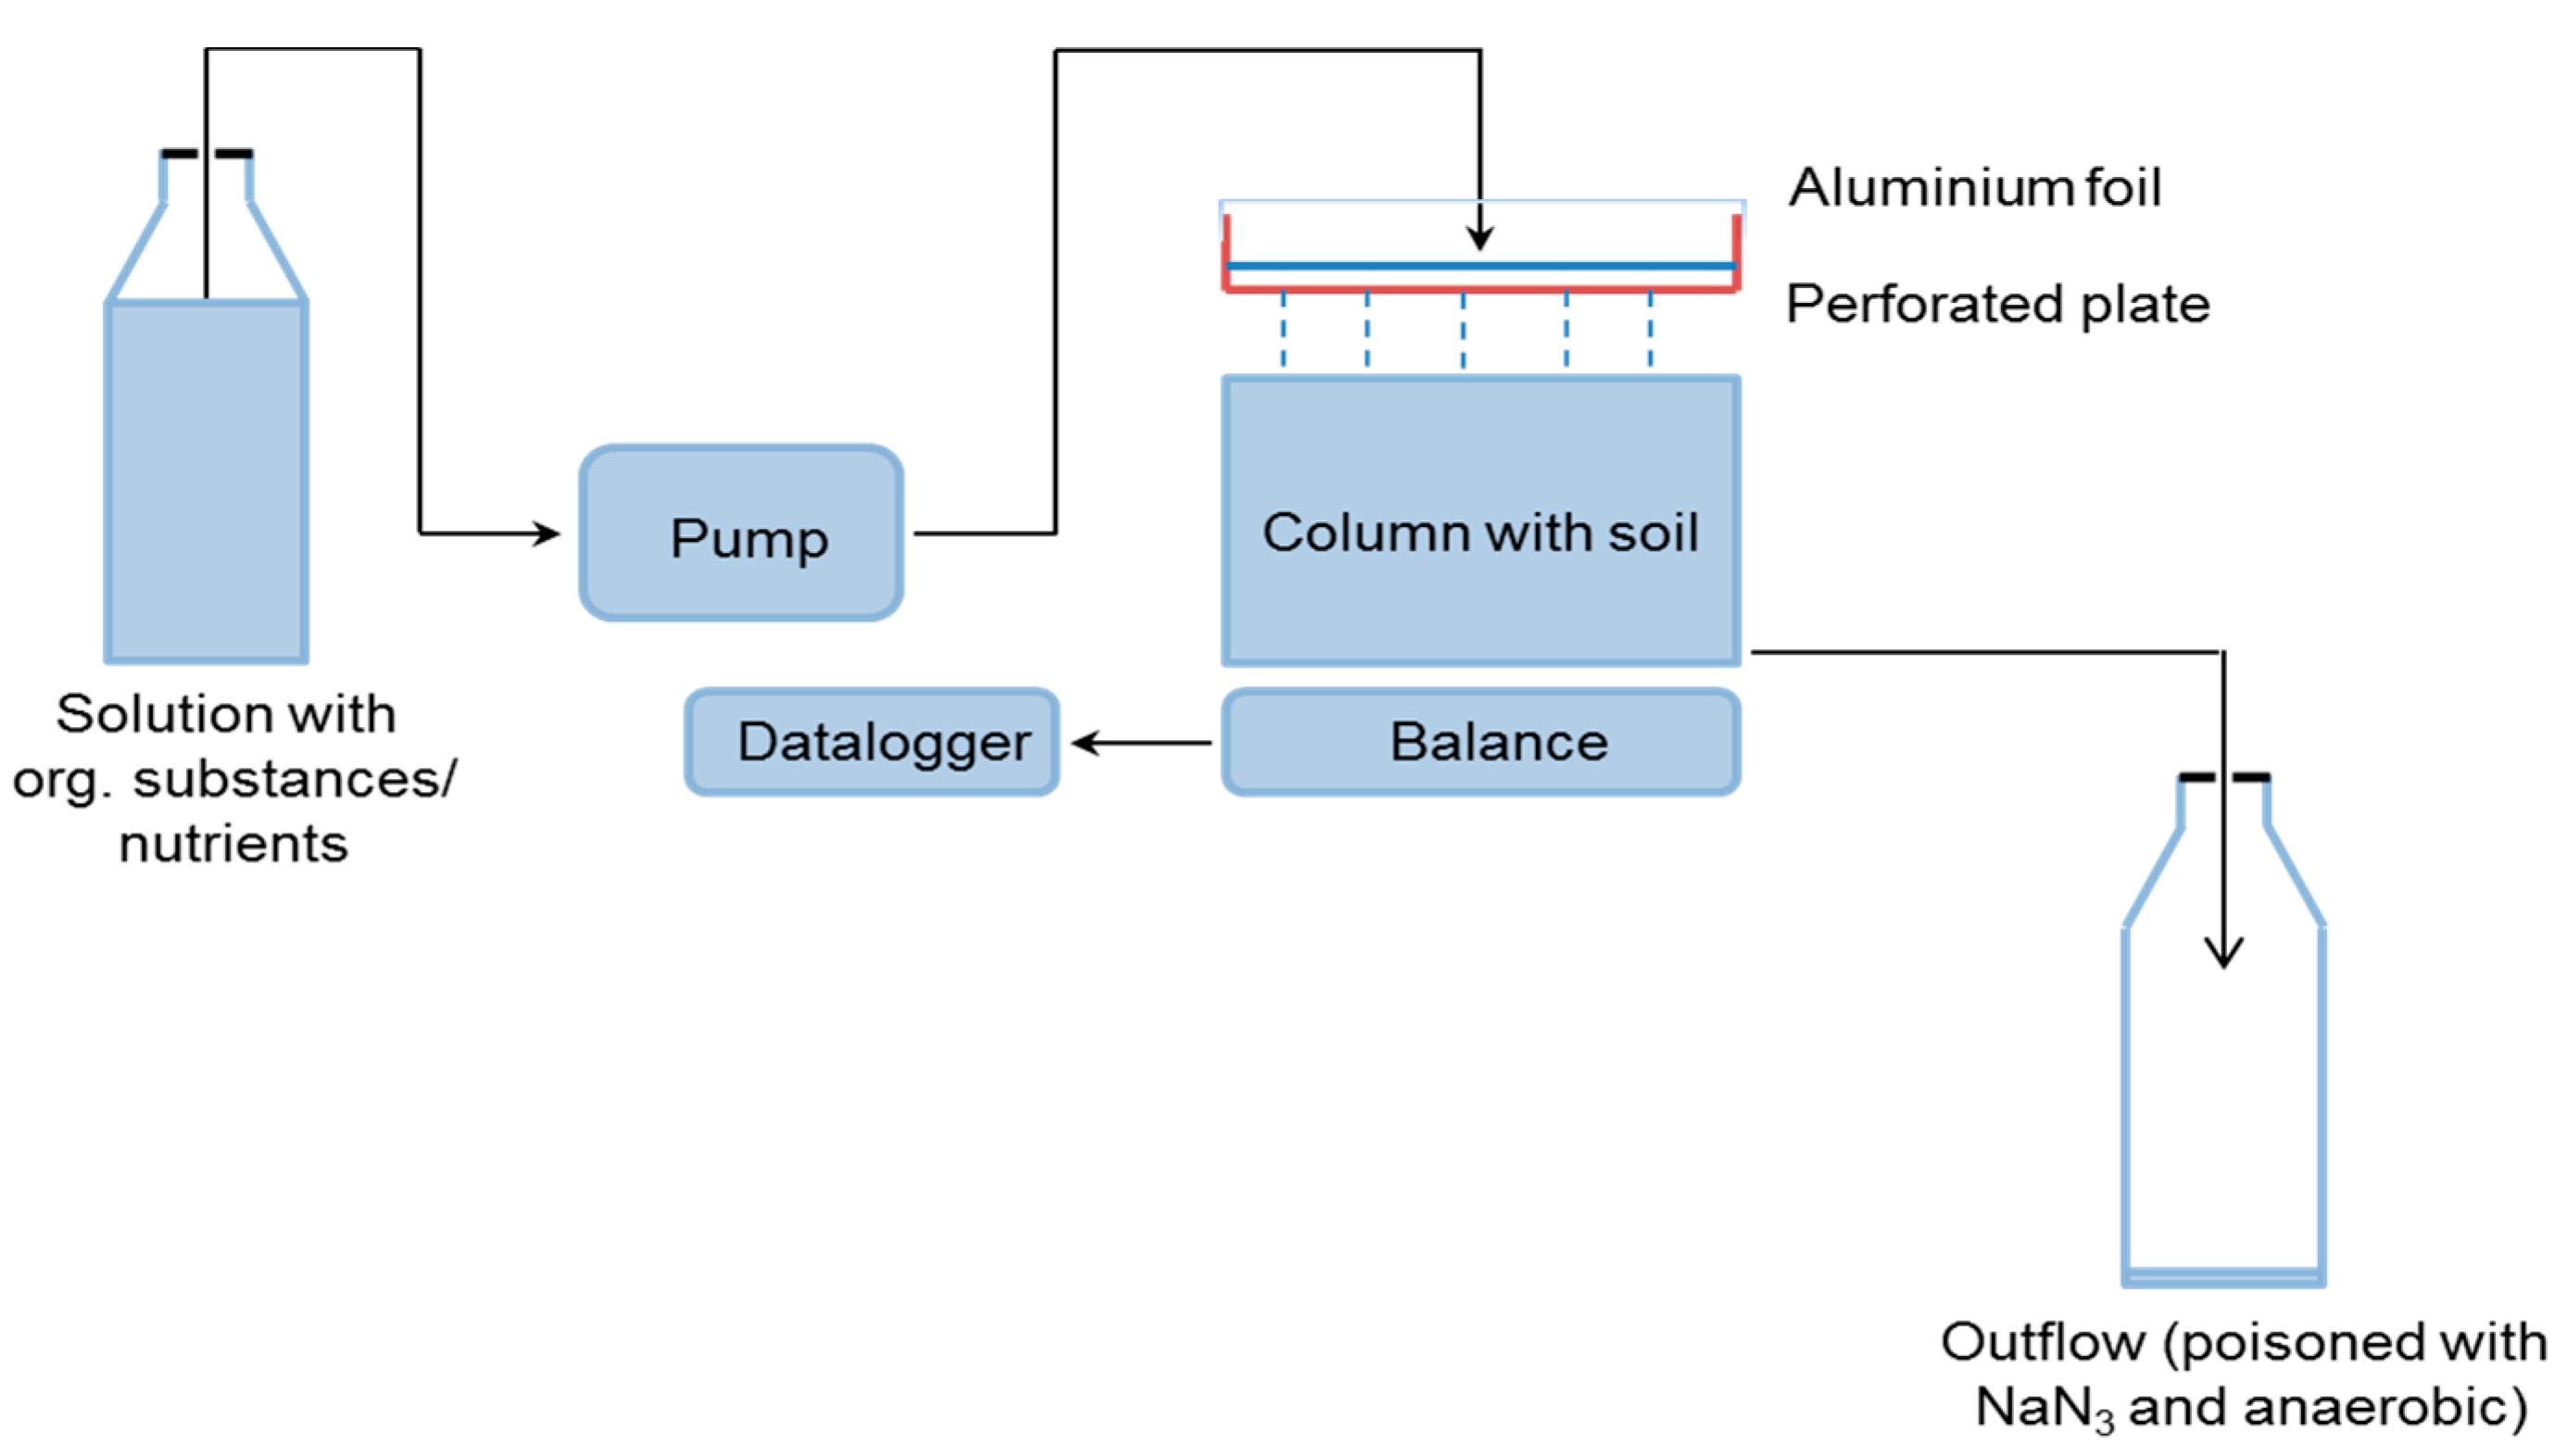
2.1. Experimental Set-up

Laboratory experiments were conducted to analyse the correlation between four grain size fractions of a selected sandy soil and the biodegradation rates of organic substances. The selected fractions are: 125 µm to 200 µm, 200 µm to 630 µm, 630 µm to 1000 µm and 1000 µm to 2000 µm, which represent different soil textures that are characteristic to filter layers in SAT facilities. The selection considered the proportion of different pore sizes, mean pore diameter as well as WFPS. After sieving, the fractions were sterilized and inoculated with Sphingobium yanoikuae (DSMZ-German Collection of Microorganisms and Cell Cultures, registration code 7235), a bacterium occurring naturally in soils. To achieve a homogeneous distribution of the bacteria in the soil, the inoculated solution was mixed with the soil for 24 h using an overhead shaker at 5 rot/min. After mixing, the fractions were dried for three days at 40 °C, the low temperature being selected to prevent bacteria dying. All working steps were carried out under sterile conditions.
After drying, the different fractions were packed in sterilized glass columns (9.5 cm long, 10.5 cm in diameter) (Figure 1). The upper parts of the columns were open to the atmosphere, and a synthetic solution containing organic substances and nutrients was infiltrated from the top. The solution was pumped from a storage bottle and distributed uniformly over the soil surface by a perforated plate (1 hole of 0.3 cm diameter per cm2) installed 1 cm above the soil surface. The perforated plate was covered with aluminium foil to prevent its contamination with other bacteria from the air. The experiment was run at constant temperature (13 °C) for 2 h (infiltration period) followed by a dry period of 22 h. This particular setup was selected to reproduce the infiltration scenarios of treated wastewater in SAT facilities, where infiltration basins are flooded for a specific period followed by a drying phase.
The hydraulic loading rate was set at 15 m per year, which corresponds to a flow rate of 3.0 mL/min during the wet period. This ensures an average residence time in the soil of about one day. This rather high infiltration rate is common in SAT facilities, which are operated using infiltration rates from 10 to 150 m per year, depending on the soil type [42]. The wet/dry ratio of 1:11, the ratio between the length of infiltration and following dry phase, was chosen to strengthen the effect of different pore size distribution on moisture content, oxygen and nutrient supply in the different fractions. A perforated PVC plate (2 holes of 0.3 cm diameter per cm2), covered with a nylon membrane (30 μm mesh size), was placed at the bottom of the column to ensure the free drainage of the water.
Two columns were used for each fraction: an active column and a sterile control column to correct the results from the effects of sorption and chemical oxidation. Microbiological activity in the sterile control system was prevented by adding NaN3 (1 g/L) to the inflow solution and outflow collectors. Dissolved organic carbon (DOC) and oxygen were measured at the inflow and outflow of the columns. The soil moisture content was measured continuously by weighting the columns during the entire duration of the experiment. The water evaporation from the columns, determined by a water mass balance of the system (evaporation = Δinflow–Δoutflow–Δstorage in the soil), amounted to 2 mL per 24 h and was neglected due to its insignificance in the calculations. The field capacity was reached after different times depending on the water holding capacity of the different fractions. The experiment was run for 30 days for the fraction 125 µm to 200 µm, 35 days for the fraction 1000 µm to 2000 µm, and 48 days for the fractions 200 µm to 630 µm and 630 µm to 1000 µm.

2.2. Culture Media

Preliminary tests were conducted to identify most suitable culture media required for controlled bacterial growth under laboratory conditions. The optimum culture medium has to sustain bacterial growth while making possible the differentiation between degradation rates in different grain size fractions. In total, six solutions were tested containing combinations of different carbon sources and common nutritional requirements (Table 1). The elements selected represent naturally occurring substances and ingredients used for the preparation of synthetic wastewater [43,44]. For the experiment, only one culture medium was selected based on its support for microbial growth.

2.3. Analytics

2.3.1. Water Retention Curve

The hydraulic properties of the soil, which are characterized by the relationship between the water content and the soil water potential, were measured using a HYPROP system [45,46,47]. The proportion of the pores with equivalent diameter smaller than 5 µm (corresponding with matric potentials lower than −600 cm) was calculated from specific parametric functions. These describe the hydraulic characteristics of the soil fraction in the area where the tension is so high that the absolute internal pressure is below vacuum and the cavitation of the water phase occurs in the HYPROP tensiometers. The experimental retention curves were fitted with the van Genuchten and Brooks & Corey models [48,49].

2.3.2. Pore Size Distribution (PSD)

PSD of a soil plays an important role in its water retention behavior [50]. Van Genuchten and Brooks & Corey retention models integrate a parameter to represent the distribution of different pore sizes in the soil. The parameter n [-] represents the PSD in the van Genuchten model while the parameter λ [-] describes the distribution of different pore sizes in the retention model of Brooks and Corey. In both cases, the larger the values of n and λ, the more uniform are the pore sizes in the soil.

2.3.3. Mean Pore Diameter

The mean pore diameter was calculated as a function of the PSD represented by the water retention curve. According to the capillary theory, the pressure at which a pore empties (or fills) corresponds to the pore opening size (respectively the pore diameter) and is calculated according to Jurin’s law [51]:
d = 4 × σ h ,
where:
  • d = pore diameter [m]
  • σ = surface tension between water and air (0.0729 N/m)
  • h = soil water potential (Pa)

2.3.4. Water-filled Pore Space (WFPS)

The water-filled pore space was calculated using the following equation [52]:
W F P S = S W C 1 B D P D × 100 ,
where:
  • WFPS = water-filled pore space (%)
  • SWC = volumetric soil water content (vol. %)
  • BD = soil bulk density (g/cm³)
  • PD = particle density (2.65 g/cm³)

2.3.5. Dissolved Organic Carbon (DOC)

The concentration of the dissolved organic carbon was measured in aqueous solutions according to ISO 8245 [53]. Before analysis, the samples were passed through a 0.45 µm membrane filter for the separation of non-dissolved carbon compounds. Shortly before the DOC analyses, the inorganic carbon dioxide (CO2) in the samples was stripped off by gassing with nitrogen for seven minutes. The organic compounds were then photochemically oxidized to CO2 by the irradiation with UV light while the CO2 released was detected by a non-dispersive infrared analyser.

2.3.6. Oxygen Content

The oxygen concentration was measured by miniaturized optical oxygen micro sensors (needle-type) based on 140 µm silica fibre. The reading of the values was done with the oxygen meter Microx TX3 (PreSens Precision Sensing GmbH, Regensburg, Germany)—a temperature compensated system.

2.3.7. Optical Density

Optical density at 600 nm wavelength (OD600) was measured by a photometer to determine the suspended biomass concentration of the microbial growth. The conversion factor between OD600 and the number of bacteria per mL unit volume was 8 × 10⁵ L−1 [54].

2.3.8. Calculation of Degradation Rates

The degradation rates were calculated using the first-order decay rate law according to [55]:
A = A 0 × e k × t ,
where:
  • A = molar concentration of reactant (mol/L)
  • A0 = initial molar concentration of reactant A (mol/L)
  • k = rate constant (s−1)
  • t = time (s)
It was assumed that the oxidation of organic substances took place under constant boundary conditions after a certain period of adaptation. The first-order decay rate is a simplification to replicate bacterial kinetics for even distribution of bacterial cultures.

3. Results and Discussion

3.1. Soil Characterization

The grain size fractions used in the experiment were separated by dry sieving a sandy soil collected from a sand pit in Ottendorf, Germany. The total pore volumes of the resulting fractions varied from 37.4% to 44.3% (Table 2). These values correspond to pore volumes of sandy soils [11], which are in the range of 36% to 56%. The largest pore volume (44.3%) was observed for the fraction 125 µm to 200 µm while the smallest pore volume (37%) was observed for the fraction 1000 µm to 2000 µm. This corresponds to the theory that the smaller the grains, the greater the deviation from the ideal spherical shape that creates larger pore spaces [11].
The PSD index parameters n and λ estimated by fitting the experimental data with the van Genuchten and Brooks/Corey models indicate that the fraction 630 µm to 1000 µm has the widest range of pore sizes while the fraction 125 µm to 200 µm has the most uniform pore size.
The pore diameters are directly proportional to the grain sizes of the different fractions, which is also confirmed by the investigations of [56]. The pore size distribution curve of the fraction 125 µm to 200 µm shows a peak at 47 μm, with 90% of the pores between 30 µm and 70 μm; the fraction 200 µm to 630 µm shows a peak at 95 μm with 90% of the pores between 40 µm and 150 μm; the fraction 630 µm to 1000 µm shows a peak at 230 μm with 90% of the pores between 87 µm and 320 μm and the fraction 1000 µm to 2000 µm shows a peak at 425 μm with 85% of the pores between 230 µm and 800 μm.
The pH values of the individual fractions (Table 2) fall slightly in the acidic range but are within the interval of bacterial optimal growth conditions (pH 6–8) [57].

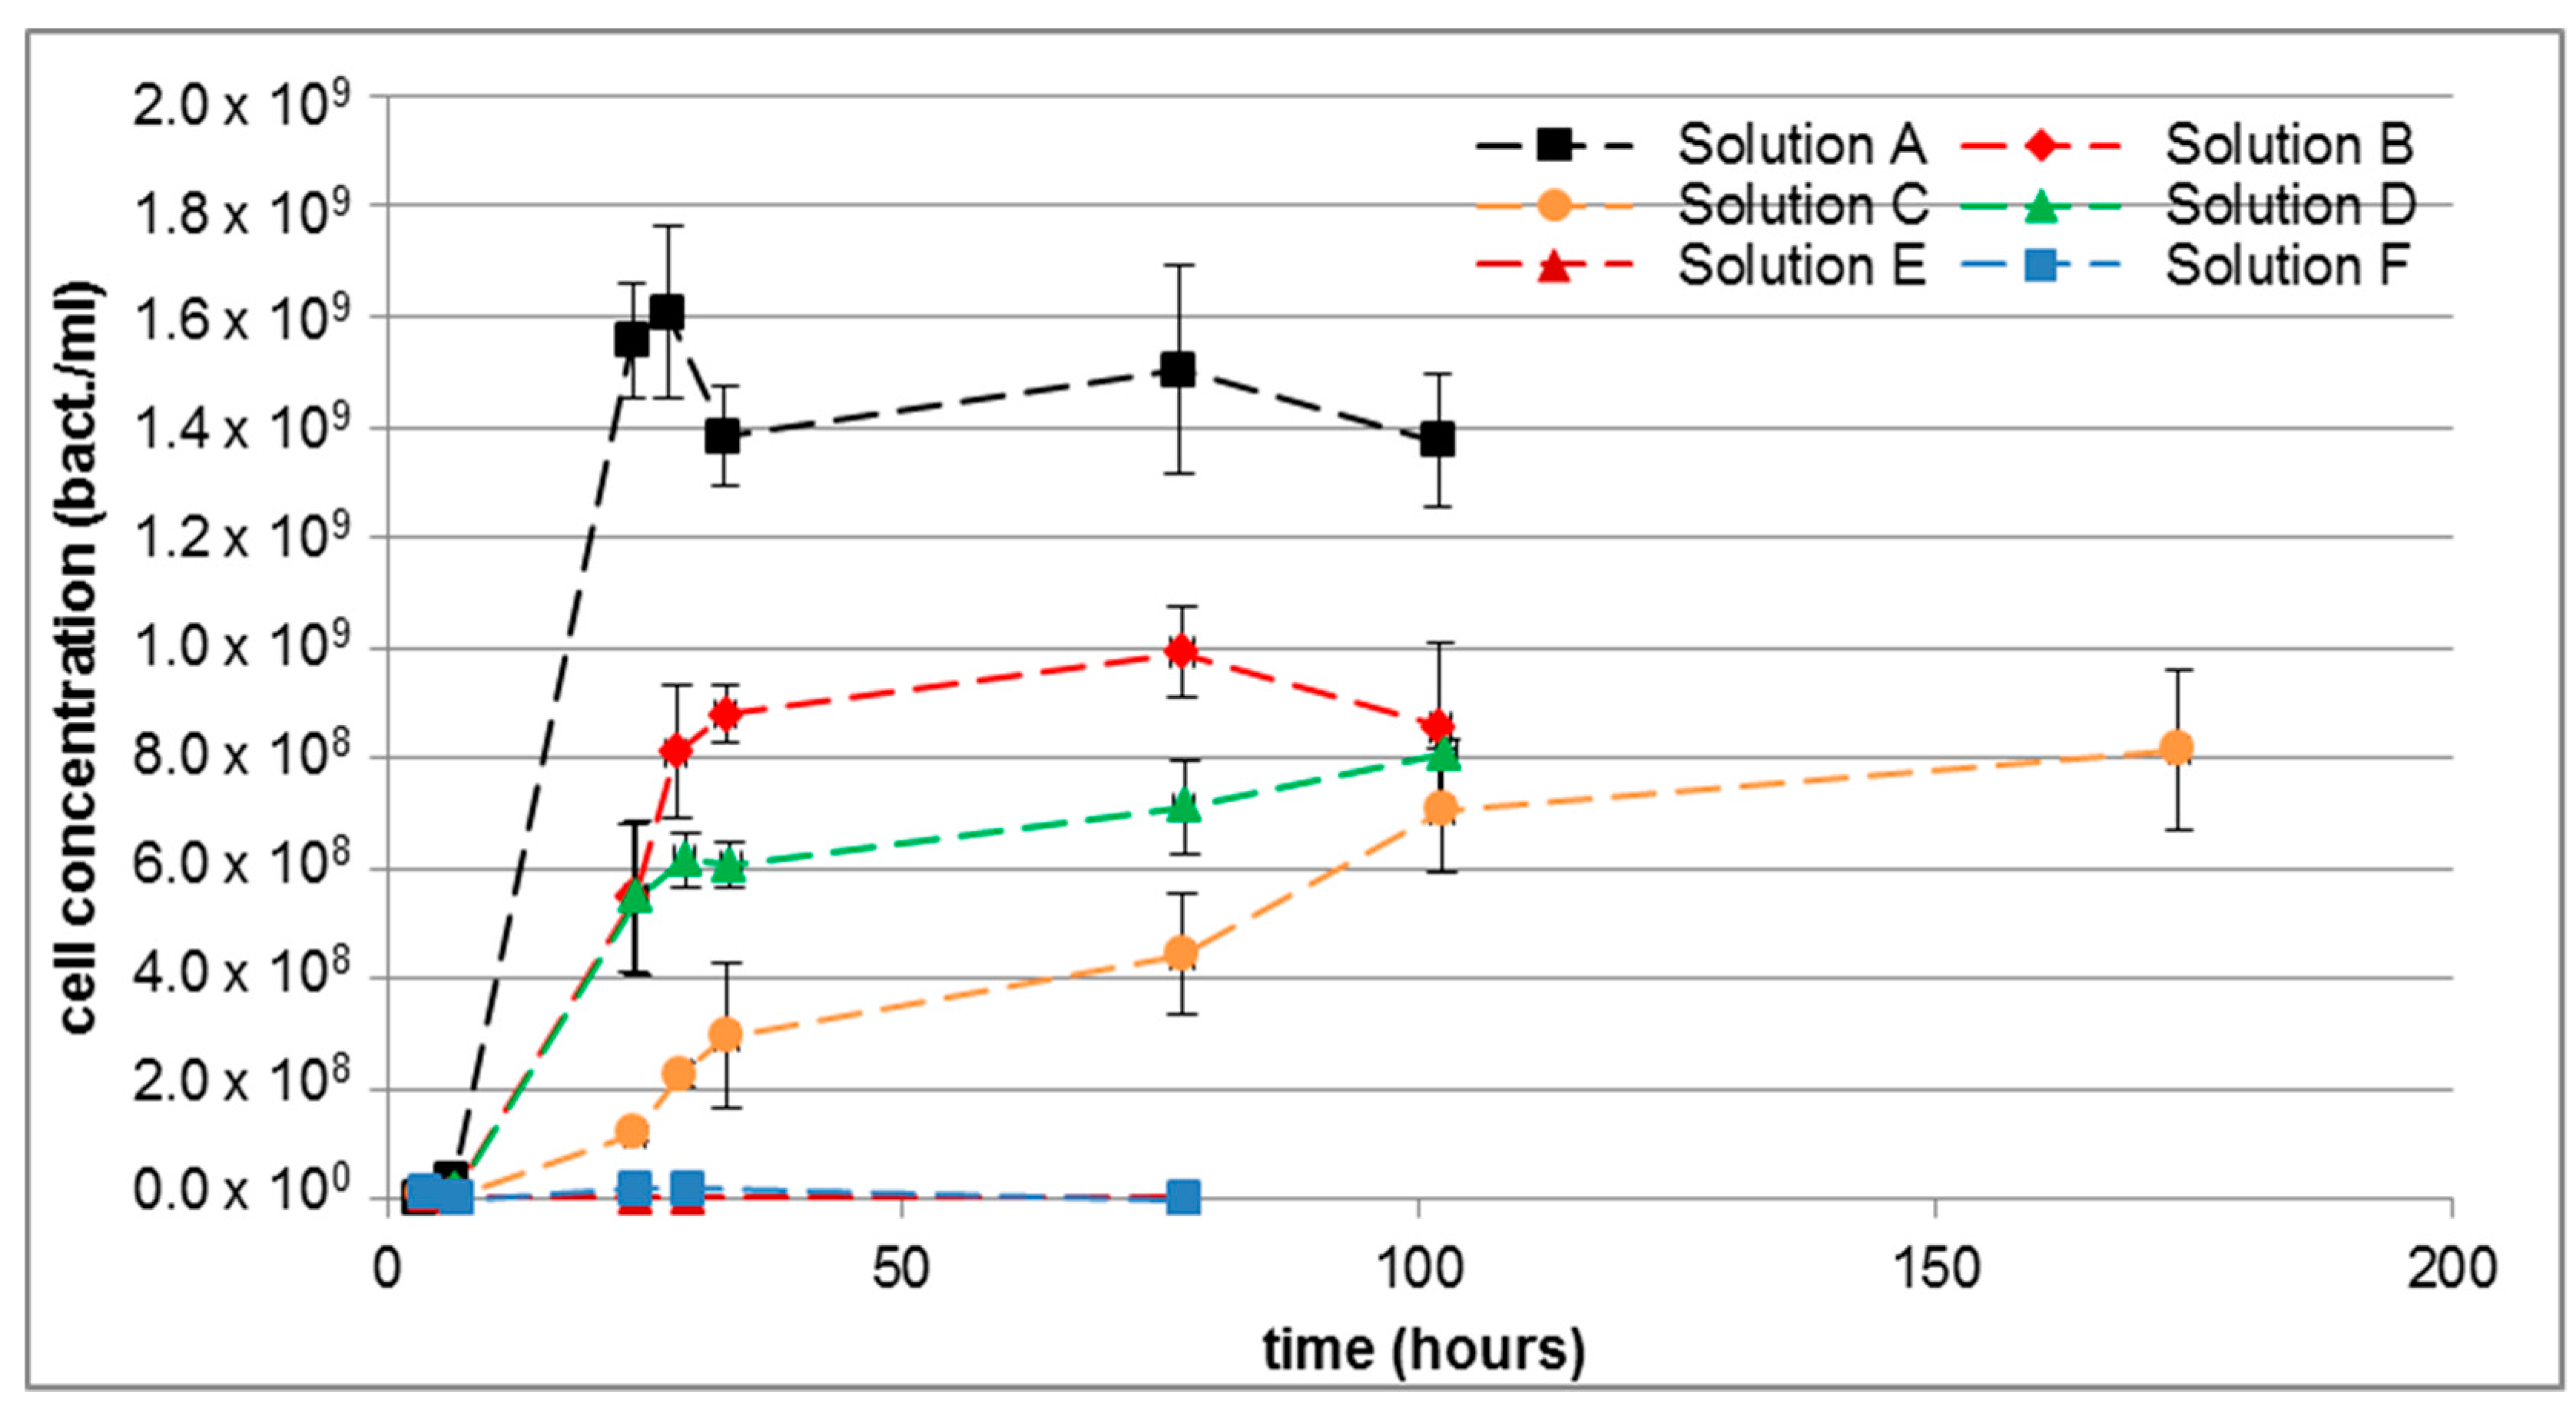
3.2. Selection of Optimum Culture Medium

Six culture media containing combinations of different carbon sources were used to identify the most suitable laboratory conditions for controlled bacterial growth. The fastest bacteria growth was observed when using culture medium A (Figure 2). A very fast exponential growth started after a short lag phase (6.5 h) and the stationary phase was established quickly.
The bacteria grew at similar rates in culture media B and D but with a lower maximum cell concentration. The fast growth of bacteria in these three media was caused by the very good utilization of the available carbon sources. In culture media E and F, the development of bacterial cultures was strongly inhibited by the absence of an appropriate utilizable carbon source and thus no growth could be observed over the duration of the experiment. Culture media C was a mix of several organic and inorganic substances used to reproduce synthetic wastewater. In this case, the bacterial growth curve indicates that the available glucose was sufficient to stimulate growth while the two acids were utilized by bacteria after glucose consumption. The conversion of the cell metabolism from glucose to the two acids is reflected in a temporary slowdown of bacterial cell growth, so that a steady growth was observed over the duration of the experiment (173.5 h). The addition of trace elements and vitamin solution in all culture media did not exert a decisive influence on the growth of bacteria; therefore, they were not used in the column experiments.
Based on these results, culture media C was used in the column experiments, which was crucial for the quantification of the degradation rates of the different grain size fractions. The decisive reason for selection was the inhibited excess growth of bacteria over the duration of the experiment compared to the rapid growth in culture media A, B and D, and the non-existing growth in solutions E and F.

3.3. Soil Water Balance

The soil moisture content was determined by measuring the weight of the soil column between the start of the experiment (dry soil) and the end of each wet/dry cycle. The results indicate that the smaller the grain size of the fraction, the higher the water-filled pore space during wet and dry phases (Table 3). The reason for this is again the different pore size distribution of the fractions resulting in a different storage capacity of the water in the pore system. The water holding capacity by capillary forces was stronger in the fraction with the smallest grain size compared to the fractions with a larger grain size due to the higher content of fine pores with smaller diameter [32,34]. The changes in WFPS between wet and dry phases were quite high for the bigger fractions (>17%) while the change for the smaller fractions was negligibly small (3%).
The average residence time calculation of the daily infiltrated amounts of the synthetic solution occurred based on the estimated pore volumes. It could be observed that the fraction with smaller grain size had higher residence time (125 µm to 200 µm—24.4 h; 1000 µm to 2000 µm—20.4 h). The reason for this behaviour is the different pore size distributions of the fractions resulting in a different hydraulic conductivity and residence time.

3.4. Results of Biodegradation

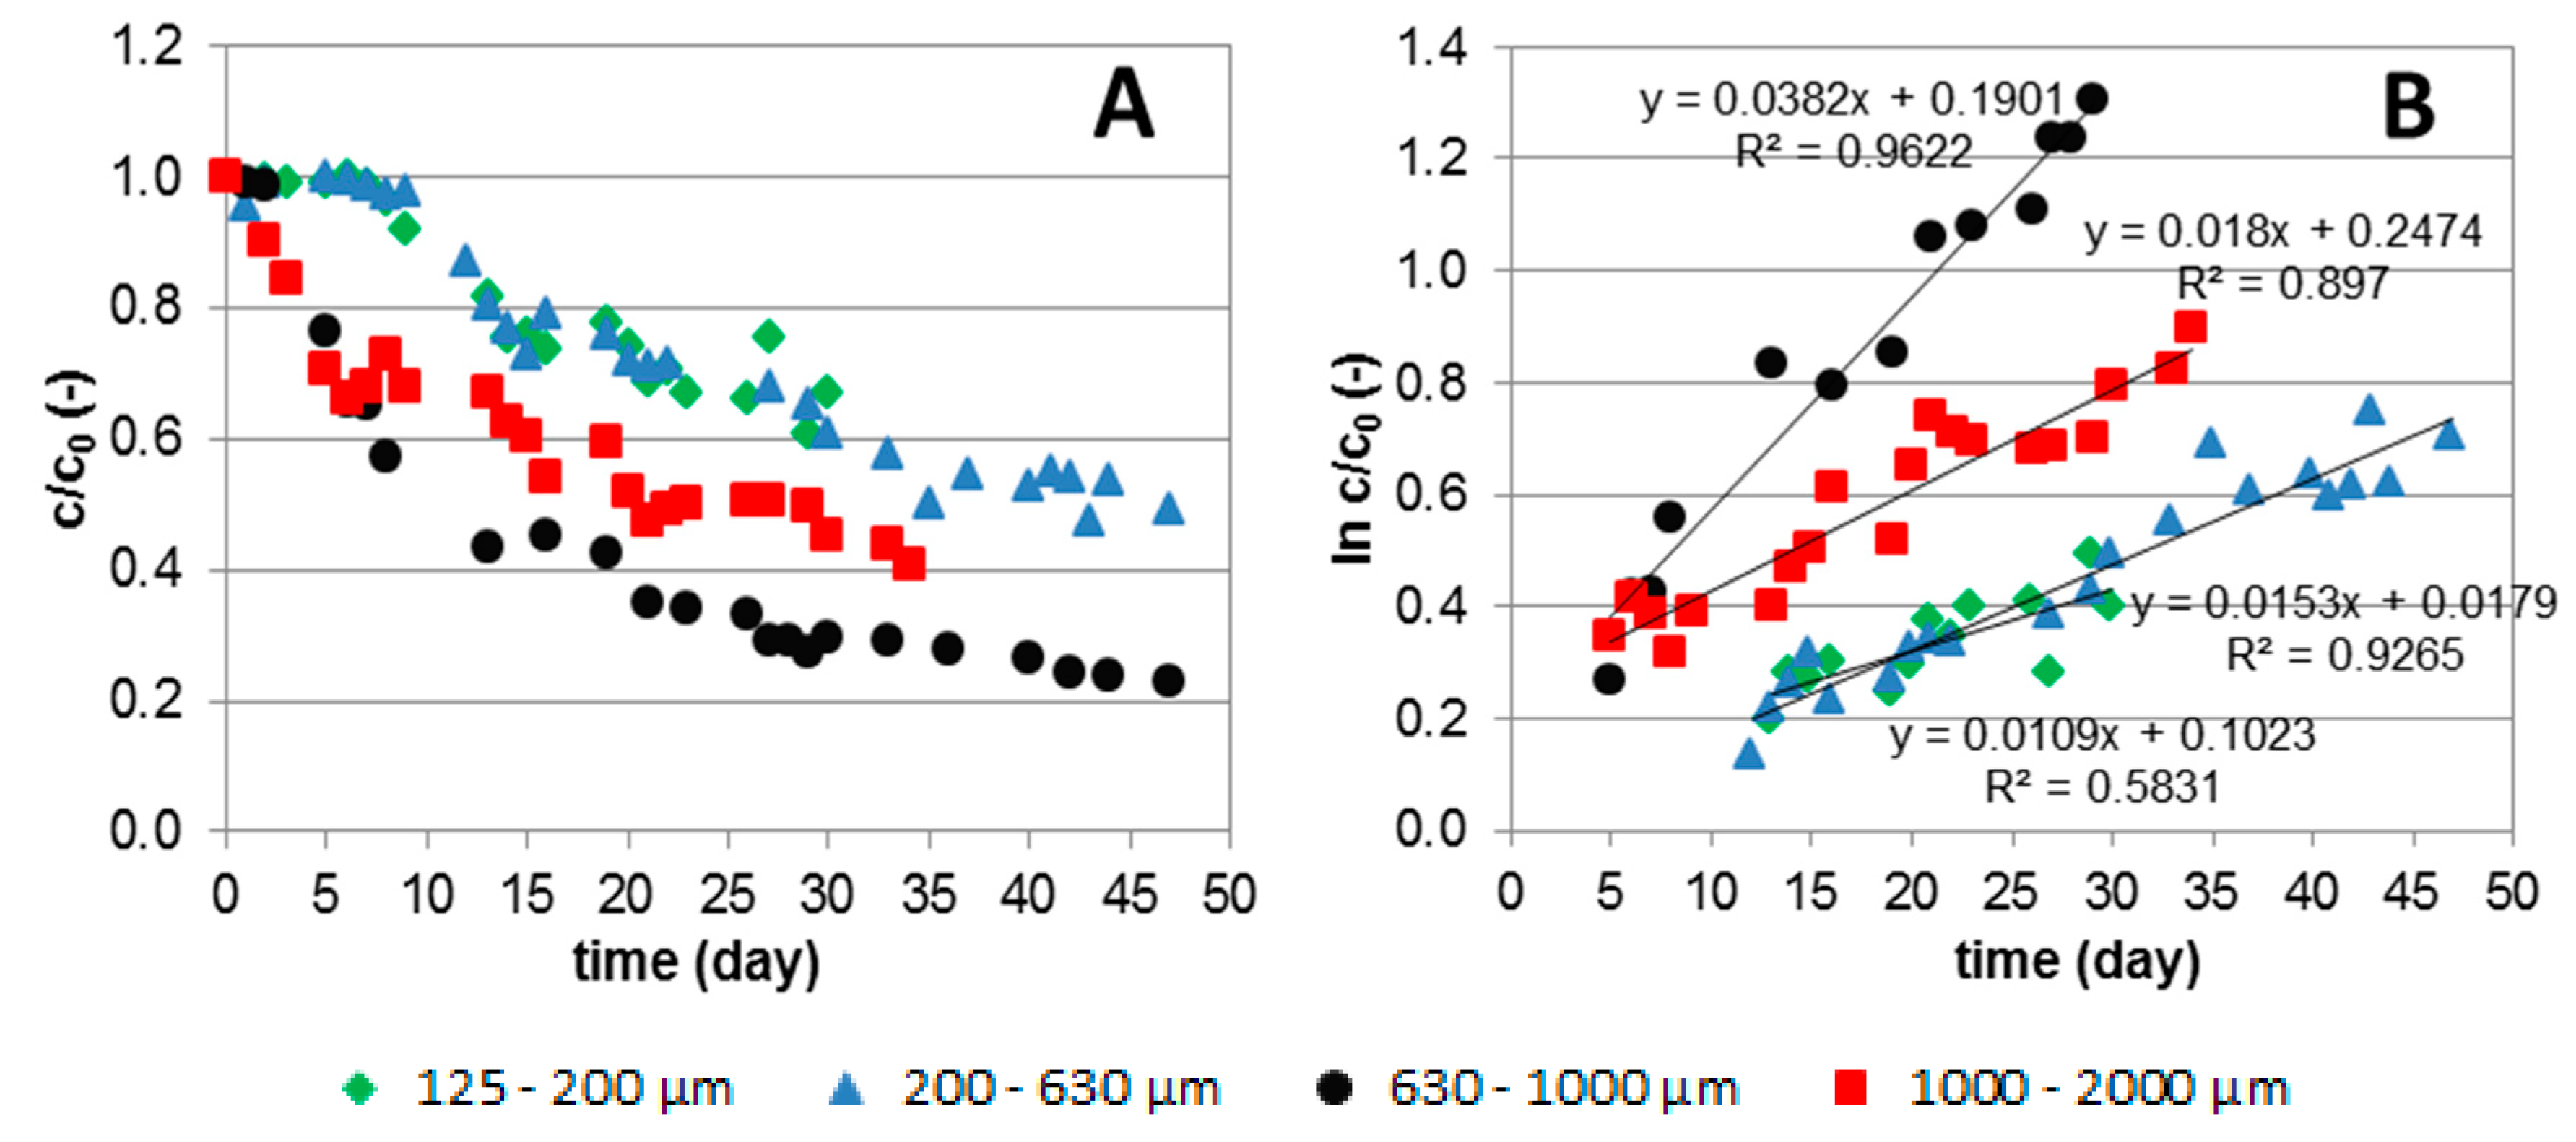
3.4.1. Degradation of DOC

In consideration of the results obtained in the sterile control columns, the decrease of DOC concentration in the active column was only caused by the biodegradation process. Other processes such as sorption or chemical oxidation, potentially responsible for DOC removal, can be neglected in this study.
After different lag phases (4 days for the fractions 630 µm to 1000 µm and 1000 µm to 2000 µm, and 12 days for the fractions 125 µm to 200 µm and 200 µm to 630 µm), the degradation in all soil fractions followed an exponential trend and continued with a stationary phase (Figure 3A).
The highest microbial activity and consequently degradation rate of organic substances for this experimental condition (type of bacteria, temperature, infiltration cycle, water quality) was provided by the fraction 630 µm to 1000 µm (Figure 3B). The supply of oxygen and nutrients to bacteria as well as the soil moisture were optimal here due to the specific pore size distribution of these fraction (widest range of pore sizes defined by the PSD index), which corresponds to a WFPS of 58% in the dry phase. These results are consistent with data reported for other applications [19,37,38,39,40,41,58,59], where the biodegradation was most effective at WFPS 60%.
Further, previous studies (Table 4) involving a wide range of soil types also indicate that the maximum microbial activity and consequently the highest biodegradation of organic substances can be expected between 50% and 70% of a soil’s water holding capacity or field capacity.
The results of the present investigations indicate that the smaller fractions (125 µm to 200 µm and 200 µm to 630 µm) had a higher moisture content and therefore WFPS of 86% and 77% due to higher proportion of fine pores. This soil moisture content should be able to allow high microbial activity, but the growth was limited by the reduced diffusion of air into the soil. The minimum pore space filled with air should be higher than 10% by volume to create conditions for aerobic biodegradation, as reported by [24,26,72]. Moreover, the lower proportion of coarse pores in the smaller fractions slows down and reduces the supply of nutrients in the accessible areas. In contrast, the supply with oxygen and nutrients was more efficient in the largest fraction (1000 µm to 2000 µm) with the lowest WFPS (44%) and the highest air capacity. Nevertheless, the lower moisture content caused by the lower water storage capacity of the coarse pores is the limiting factor here for bacterial growth and the corresponding metabolization of DOC.

3.4.2. Oxygen Consumption

The reduction of dissolved oxygen concentration started at the beginning of the experiment, and the consumption rate caused by microbiological activity followed the individual lag phases of the microorganisms (4–12 days). After these intervals, the oxygen was almost completely consumed in all four experiments. However, because the concentration of dissolved oxygen was measured only in the inflow and outflow of the columns, no differences could be proven in the transport of oxygen through the pores of different fractions.

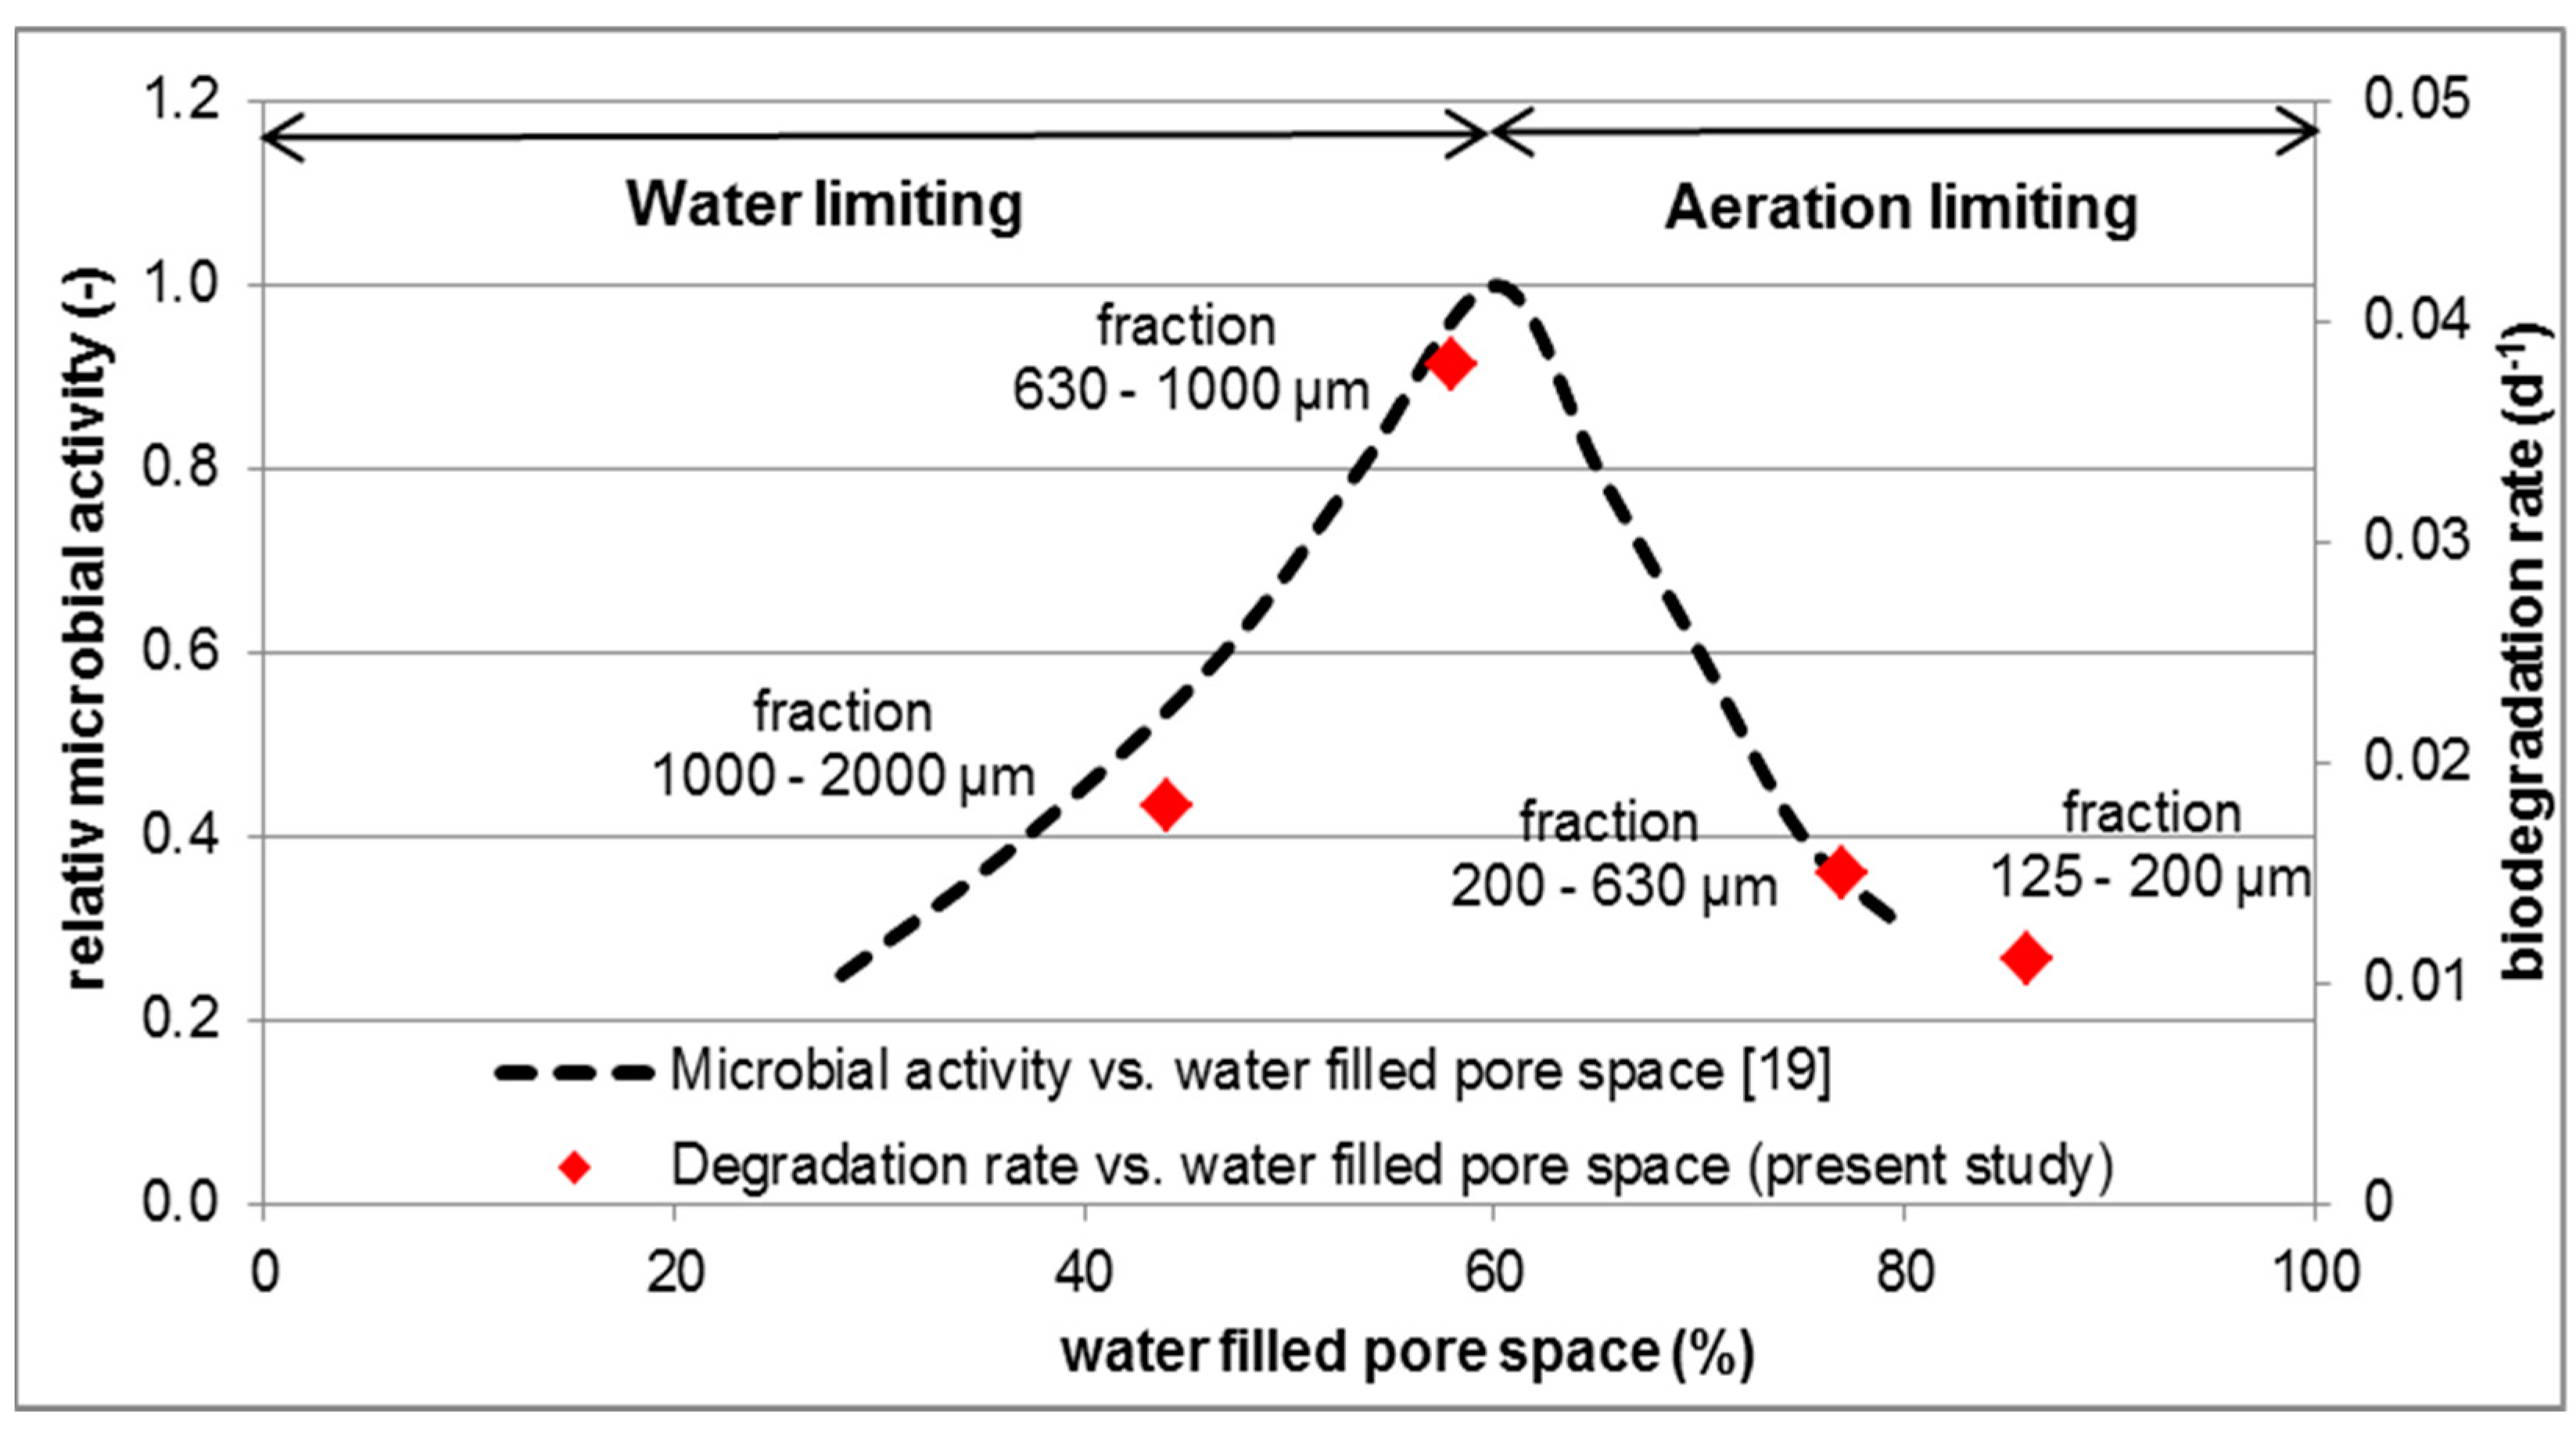
3.4.3. Degradation Rates

The observed degradation followed a first-order order kinetic model, so the rates were calculated based on the first-order decay rate law according to [55] (Table 5). The decay rates for the different fractions correspond to the slope of the trend lines (Figure 3B). As the concentration profiles of DOC indicate, the highest decay rate in the exponential phase was determined for the fraction 630 µm to 1000 µm. This was followed by the fractions 1000 µm to 2000 µm, 200 µm to 630 µm and 125 µm to 200 µm.
The results indicate that soils with lower WFPS corresponding to bigger mean pore diameter and a wider range of pore sizes (Table 2 and Table 3) are more suitable for the metabolization of organic substances than the fractions with higher WFPS and more uniform pore size distribution. This can be explained by better transport of oxygen and nutrients as well as sufficient moisture to support microbial activity (Figure 4).

4. Conclusions

The present study contributed to the identification of a relationship between the biodegradation of organic matter and the texture of a sandy soil typically used in SAT applications, characterized by the pore size distribution; mean pore diameter, and water-filled pore space (WFPS) of the soil. These parameters were selected as evaluation criteria for degradation since they describe both limiting factors in the microbiological development: available soil moisture (responsible for cell desiccation stress when too low) and aeration (supply of oxygen).
The highest biodegradation rate of organic substances percolating under specific experimental conditions (infiltration cycle, water quality, temperature) through the columns filled with the selected soil was obtained from the grain size fraction 630 µm 1000 µm. This is characteristic of the mean pore diameter of 230 µm and a rather wide range of pore sizes (pore size distribution index n = 4.91) and a WFPS of 58% estimated in the dry phases of the infiltration cycle. The high availability of oxygen and nutrients, and the sufficient soil moisture favored the microbial activity and the corresponding metabolization of DOC. By contrast, these processes were partially limited in the smaller fractions (due to insufficient supply of oxygen and nutrients) and the largest fraction (low moisture content).
The values obtained for the selected sandy soil and under the present experimental setup confirm the results reported by previous studies where conditions for microbiological activity were optimal at WFPS of 60%. Contrary to previous investigations, results of the present experiments demonstrate that optimal conditions can be achieved in the soil fraction 630 µm to 1000 µm with an average pore diameter of 230 µm. In the case of embedding sand with very low organic matter in the shallowest soil layer of SAT in filtration basins, it is therefore recommended to use the fraction with grain sizes around the range of 630 µm to 1000 µm. When water is infiltrated into natural sandy soils, the recommended pore diameters are between 90 µm and 320 µm and the mean pore diameter is about 230 µm.
The outcomes of this study can be very useful for planning the infiltration of water with high organic load. In this case, biodegradation processes can be enhanced by providing adequate aeration, nutrient supply and soil moisture content in the shallowest soil layer. The results help in the selection of the granulometric characteristics of the soil filter in order to ensure optimal conditions for purification processes.

Author Contributions

Conceptualization, T.F., C.S.; Investigation, T.F., N.G.; Methodology, T.F., N.G.; Validation, T.F., C.S.; Writing original draft, T.F.; Writing, review & editing, T.F., C.S.

Funding

This work was supported by the German Federal Ministry of Education and Research (BMBF), grant no. 01LN1311A (Junior Research Group “INOWAS”).

Conflicts of Interest

The authors declare no conflict of interest. The funders had no role in the design of the study; in the collection, analyses, or interpretation of data; in the writing of the manuscript, or in the decision to publish the results.

References

  1. Aeschbach-Hertig, W.; Gleeson, T. Regional strategies for the accelerating global problem of groundwater depletion. Nat. Geosci. 2012, 5, 853–861. [Google Scholar] [CrossRef]
  2. Hoekstra, A.Y.; Mekonnen, M.M.; Chapagain, A.K.; Mathews, R.E.; Richter, B.D. Global Monthly Water Scarcity: Blue Water Footprints versus Blue Water Availability. PLoS ONE 2012, 7, e32688. [Google Scholar] [CrossRef] [PubMed]
  3. Kinzelbach, W.; Aeschbach, W.; Alberich, C.; Goni, I.B.; Beyerle, U.; Brunner, P.; Chiang, W.H.; Rueedi, J.; Zoellmann, K. A Survey of Methods for Groundwater Recharge in Arid and Semi-Arid Regions; United Nations Environment Programme: Nairobi, Kenya, 2002; p. 107. [Google Scholar]
  4. Alcamo, J.; Henrichs, T.; Rösch, T. World Water in 2025; Kassel World Water Series; University of Kassel: Kassel, Germany, 2000; p. 49. [Google Scholar]
  5. UNICEF and World Health Organization. Progress on Drinking Water and Sanitation; UNICEF and World Health Organization: Geneva, Switzerland, 2012; p. 66. [Google Scholar]
  6. Stefan, C.; Ansems, N. Web-based global inventory of managed aquifer recharge applications. Sustain. Water Resour. Manag. 2018, 4, 153–162. [Google Scholar] [CrossRef]
  7. Dillon, P.; Pavelic, P.; Page, D.; Behringen, H.; Ward, J. Managed Aquifer Recharge: An Introduction; Waterlines Report Series; National Water Commission: Canberra, Australia, 2009; p. 77. [Google Scholar]
  8. Hillel, D. Environmental Soil Physics, 1st ed.; Elsevier: Amsterdam, The Netherlands, 1998. [Google Scholar]
  9. Kopec, D.M. Soil Characteristics and How They Affect Soil Moisture. TurfTips Univ. Arizona Coop. Ext. 1995, 2. Available online: https://turf.arizona.edu/tips1095.html. (accessed on 30 January 2019).
  10. Xu, Q.; Liu, S.; Wan, X.; Jiang, C.; Song, X.; Wang, J. Effects of rainfall on soil moisture and water movement in a subalpine dark coniferous forest in southwestern China. Hydrol. Process. 2012, 26, 3800–3809. [Google Scholar] [CrossRef]
  11. Blume, H.-P.; Brümmer, G.W.; Fleige, H.; Horn, R.; Kandeler, E.; Kögel-Knabner, I.; Kretzschmar, R.; Stahr, K.; Wilke, B.-M. Scheffer/Schachtschabel Soil Science; Springer: Berlin/Heidelberg, Germany, 2015; ISBN 978-3-642-30942-7. [Google Scholar]
  12. Nimmo, J.R. Porosity and Pore Size Distribution. In Encyclopedia of Soils in the Environment; Elsevier: London, UK, 2004; pp. 295–303. [Google Scholar]
  13. Chen, Y.S.; Chen, S.C.; Kao, C.M.; Chen, Y.L. Effects of soil pH, temperature and water content on the growth ofBurkholderia pseudomallei. Folia Microbiol. 2003, 48, 253–256. [Google Scholar] [CrossRef]
  14. Griffin, D.M. Water and Microbial Stress. In Advances in Microbial Ecology; Alexander, M., Ed.; Advances in Microbial Ecology; Springer: New York, NY, USA, 1981; pp. 91–136. ISBN 978-1-4615-8308-0. [Google Scholar]
  15. Su, J.; Wu, Y.; Ma, X.; Zhang, G.; Feng, H.; Zhang, Y. Soil microbial counts and identification of culturable bacteria in an extreme by arid zone. Folia Microbiol. 2004, 49, 423–429. [Google Scholar] [CrossRef]
  16. Van Gestel, M.; Merckx, R.; Vlassak, K. Microbial biomass responses to soil drying and rewetting: The fate of fast- and slow-growing microorganisms in soils from different climates. Soil Biol. Biochem. 1993, 25, 109–123. [Google Scholar] [CrossRef]
  17. Griffiths, R.I.; Whiteley, A.S.; O’Donnell, A.G.; Bailey, M.J. Physiological and Community Responses of Established Grassland Bacterial Populations to Water Stress. Appl. Environ. Microbiol. 2003, 69, 6961–6968. [Google Scholar] [CrossRef] [Green Version]
  18. Kieft, T.L.; Soroker, E.; Firestone, M.K. Microbial biomass response to a rapid increase in water potential when dry soil is wetted. Soil Biol. Biochem. 1987, 19, 119–126. [Google Scholar] [CrossRef]
  19. Papendick, R.I.; Campbell, G.S. Theory and Measurement of Water Potential. In Water Potential Relations in Soil Microbiology; SSSA: Madison, WI, USA, 1981; pp. 1–22. [Google Scholar]
  20. Schjønning, P.; Thomsen, I.K.; Moldrup, P.; Christensen, B.T. Linking Soil Microbial Activity to Water- and Air-Phase Contents and Diffusivities. Soil Sci. Soc. Am. J. 2003, 67, 156–165. [Google Scholar] [CrossRef]
  21. Yadav, B.K.; Hassanizadeh, S.M. An Overview of Biodegradation of LNAPLs in Coastal (Semi)-arid Environment. Water Air Soil Pollut. 2011, 220, 225–239. [Google Scholar] [CrossRef] [PubMed] [Green Version]
  22. Zhou, J.; Xia, B.; Treves, D.S.; Wu, L.-Y.; Marsh, T.L.; O’Neill, R.V.; Palumbo, A.V.; Tiedje, J.M. Spatial and Resource Factors Influencing High Microbial Diversity in Soil. Appl. Environ. Microbiol. 2002, 68, 326–334. [Google Scholar] [CrossRef] [PubMed] [Green Version]
  23. Grant, R.F.; Rochette, P. Soil Microbial Respiration at Different Water Potentials and Temperatures: Theory and Mathematical Modeling. Soil Sci. Soc. Am. J. 1994, 58, 1681–1690. [Google Scholar] [CrossRef]
  24. Long, Y.H.; Li, R.T.; Wu, X.M. Degradation of S-metolachlor in soil as affected by environmental factors. J. Soil Sci. Plant Nutr. 2014, 14, 189–198. [Google Scholar] [CrossRef]
  25. Skopp, J.; Jawson, M.D.; Doran, J.W. Steady-state aerobic microbial activity as a function of soil water content. Soil Sci. Soc. Am. J. 1990, 54, 1619–1625. [Google Scholar] [CrossRef]
  26. Sims, J.L.; Sims, R.C.; Dupont, R.R.; Matthews, J.E.; Russell, H.H. In situ Bioremediation of Contaminated Unsaturated Subsurface Soils; ResearchGate: Berlin, Germany, 1993. [Google Scholar]
  27. Alvarez, P.J.J.; Illman, W.A. Bioremediation and Natural Attenuation: Process Fundamentals and Mathematical Models; John Wiley & Sons, Inc.: Hoboken, NJ, USA, 2005; ISBN 978-0-471-73862-6. [Google Scholar]
  28. Arora, H.S.; Cantor, R.R.; Nemeth, J.C. Environmental Impact of Petroleum RefiningLand treatment: A viable and successful method of treating petroleum industry wastes. Environ. Int. 1982, 7, 285–291. [Google Scholar] [CrossRef]
  29. Bhaumik, H.D.; Clark, F.E. Soil Moisture Tension and Microbiological Activity. Soil Sci. Soc. Am. J. 1948, 12, 234–238. [Google Scholar] [CrossRef]
  30. Miller, R.D.; Johnson, D.D. The Effect of Soil Moisture Tension on Carbon Dioxide Evolution, Nitrification, and Nitrogen Mineralization. Soil Sci. Soc. Am. J. 1964, 28, 644–647. [Google Scholar] [CrossRef]
  31. Parker, D.T.; Larson, W.E. Nitrification as Affected by Temperature and Moisture Content of Mulched Soils. Soil Sci. Soc. Am. J. 1962, 26, 238–242. [Google Scholar] [CrossRef]
  32. Hazelton, P.A.; Murphy, B.W. Interpreting Soil Test Results: What Do All the Numbers Mean? Csiro Publishing: Collingwood, Australia, 2007; ISBN 978-0-643-09225-9. [Google Scholar]
  33. Bear, J.; Verruijt, A. Modeling Groundwater Flow and Pollution; Springer: New York, NY, USA, 2012; ISBN 978-94-009-3379-8. [Google Scholar]
  34. Lambers, H.; III, F.S.C.; Pons, T.L. Plant Physiological Ecology; Springer: New York, NY, USA, 2008; ISBN 978-0-387-78341-3. [Google Scholar]
  35. Lyman, W.J.; Reidy, P.J.; Levy, B. Mobility and Degradation of Organic Contaminants in Subsurface Environments; CRC PRESS: Boca Raton, FL, USA, 1992. [Google Scholar]
  36. Meikle, A.; Amin-Hanjani, S.; Anne Glover, L.; Killham, K.; Prosser, J.I. Matric potential and the survival and activity of a Pseudomonas fluorescens inoculum in soil. Soil Biol. Biochem. 1995, 27, 881–892. [Google Scholar] [CrossRef]
  37. Franzluebbers, A.J. Microbial activity in response to water-filled pore space of variably eroded southern Piedmont soils. Appl. Soil Ecol. 1999, 11, 91–101. [Google Scholar] [CrossRef]
  38. Gilmour, C.M.; Broadbent, F.E.; Beck, S.M. Recycling of Carbon and Nitrogen through Land Disposal of Various Wastes. In Soils for Management of Organic Wastes and Waste Waters; ACSESS: Sydney, Australia, 1977; pp. 171–194. [Google Scholar]
  39. Linn, D.M.; Doran, J.W. Effect of Water-Filled Pore Space on Carbon Dioxide and Nitrous Oxide Production in Tilled and Nontilled Soils. Soil Sci. Soc. Am. J. 1984, 48, 1267–1272. [Google Scholar] [CrossRef]
  40. Pal, D.; Broadbent, F.E. Influence of Moisture on Rice Straw Decomposition in Soils. Soil Sci. Soc. Am. J. 1975, 39, 59–63. [Google Scholar] [CrossRef]
  41. Stehfest, E.; Heistermann, M.; Priess, J.A.; Ojima, D.S.; Alcamo, J. Simulation of global crop production with the ecosystem model DayCent. Ecol. Model. 2007, 209, 203–219. [Google Scholar] [CrossRef]
  42. Bouwer, H. Design and management of infiltration basin for artificial recharge of groundwater. In Proceedings of the 32nd Annual New Mexico Conference on Ground Water Management, Albuquerque, NM, USA, 5–6 November 1987. [Google Scholar]
  43. Jagadamma, S.; Mayes, M.A.; Phillips, J.R. Selective Sorption of Dissolved Organic Carbon Compounds by Temperate Soils. PLoS ONE 2012, 7, e50434. [Google Scholar] [CrossRef] [PubMed]
  44. Kim, S.-H.; Ngo, H.-H.; Chaudhary, D.; Kim, J.-C.; Vigneswaran, S.; Moon, H. Characterization procedure for adsorption of DOC (Dissolved Organic Carbon) from synthetic wastewater. Korean J. Chem. Eng. 2002, 19, 888–894. [Google Scholar] [CrossRef]
  45. Peters, A.; Durner, W. Simplified evaporation method for determining soil hydraulic properties. J. Hydrol. 2008, 356, 147–162. [Google Scholar] [CrossRef]
  46. Schindler, U.; Müller, L. Simplifying the evaporation method for quantifying soil hydraulic properties. J. Plant Nutr. Soil Sci. 2006, 169, 623–629. [Google Scholar] [CrossRef]
  47. Wind, G.P. Capillary Conductivity Data Estimated by a Simple Method. proceedings of the Wageningen Symposium, Wageningen, The Netherlands, 1966; pp. 181–191. [Google Scholar]
  48. Van Genuchten, M.T. A closed-form equation for predicting the hydraulic conductivity of unsaturated soils. Soil Sci. Soc. Am. J. 1980, 44, 892–898. [Google Scholar] [CrossRef]
  49. Brooks, R.H.; Corey, A.T. Hydraulic Properties of Porous Media; Colorado State University: Fort Collins, CO, USA, 1964. [Google Scholar]
  50. Berkowitz, B.; Ewing, R.P. Percolation Theory and Network Modeling Applications in Soil Physics. Surv. Geophys. 1998, 19, 23–72. [Google Scholar] [CrossRef]
  51. Rousseva, S.; Kercheva, M.; Shishkov, T.; Lair, G.J.; Nikolaidis, N.P.; Moraetis, D.; Krám, P.; Bernasconi, S.M.; Blum, W.E.H.; Menon, M.; et al. Chapter Two—Soil Water Characteristics of European SoilTrEC Critical Zone Observatories. In Advances in Agronomy; Banwart, S.A., Sparks, D.L., Eds.; Quantifying and Managing Soil Functions in Earth’s Critical Zone; Academic Press: New York, NY, USA, 2017; Volume 142, pp. 29–72. [Google Scholar]
  52. Paul, E.A. Soil Microbiology, Ecology and Biochemistry; Academic Press: New York, NY, USA, 2006; ISBN 978-0-08-047514-1. [Google Scholar]
  53. International Organization for Standardization. ISO 8245 Water Quality—Guidelines for the Determination of Total Organic Carbon (TOC) and Dissolved Organic Carbon (DOC); IOS: Amsterdam, The Netherlands, 1999. [Google Scholar]
  54. Myers, J.A.; Curtis, B.S.; Curtis, W.R. Improving accuracy of cell and chromophore concentration measurements using optical density. BMC Biophys. 2013, 6, 4. [Google Scholar] [CrossRef] [PubMed]
  55. Silberberg, M. Principles of General Chemistry, 2nd ed.; McGraw-Hill Science/Engineering/Math: Dubuque, IA, USA, 2009; ISBN 978-0-07-727432-0. [Google Scholar]
  56. Lubelli, B.; van Hees, R.P.J. Desalination of masonry structures: Fine tuning of pore size distribution of poultices to substrate properties. J. Cult. Herit. 2010, 11, 10–18. [Google Scholar] [CrossRef]
  57. Pepper, I.L.; Gerba, C.P.; Gentry, T.J.; Maier, R.M. Environmental Microbiology; Academic Press: New York, NY, USA, 2011; ISBN 978-0-08-091940-9. [Google Scholar]
  58. Kononova, M.M. Soil Organic Matter: Its Nature, Its Role in Soil Formation and in Soil Fertility; Pergamon: Oxford, UK, 1966; ISBN 978-1-4831-6987-3. [Google Scholar]
  59. Seifert, J. The influence of moisture and temperature on the number of bacteria in the soil. Folia Microbiol. 1961, 6, 268–272. [Google Scholar] [CrossRef]
  60. Dibble, J.T.; Bartha, R. Effect of environmental parameters on the biodegradation of oil sludge. Appl. Environ. Microbiol. 1979, 37, 729–739. [Google Scholar] [PubMed]
  61. Pramer, D.; Bartha, R. Preparation and Processing of Soil Samples for Biodegradation Studies. Environ. Lett. 1972, 2, 217–224. [Google Scholar] [CrossRef]
  62. Briglia, M.; Middeldorp, P.J.M.; Salkinoja-Salonen, M.S. Mineralization performance of Rhodococcus chlorophenolicus strain PCP-1 in contaminated soil simulating on site conditions. Soil Biol. Biochem. 1994, 26, 377–385. [Google Scholar] [CrossRef]
  63. Hinchee, R.E.; Downey, D.C.; Dupont, R.R.; Aggarwal, P.K.; Miller, R.N. Enhancing biodegradation of petroleum hydrocarbons through soil venting. J. Hazard. Mater. 1991, 27, 315–325. [Google Scholar] [CrossRef]
  64. Okeke, B.C.; Smith, J.E.; Paterson, A.; Watson-Craik, I.A. Influence of environmental parameters on pentachlorophenol biotransformation in soil by Lentinula edodes and Phanerochaete chrysosporium. Appl. Microbiol. Biotechnol. 1996, 45, 263–266. [Google Scholar] [CrossRef] [PubMed]
  65. Rice, P.J.; Anderson, T.A.; Coats, J.R. Degradation and persistence of metolachlor in soil: Effects of concentration, soil moisture, soil depth, and sterilization. Environ. Toxicol. Chem. 2002, 21, 2640–2648. [Google Scholar] [CrossRef] [PubMed] [Green Version]
  66. Dupont, R.R.; Doucette, W.J.; Hinchee, R.E. Assessment of in situ bioremediation potential and application of bioventing at a fuel-contaminated site. In In Situ Bioreclamation; Butterworth-Heinemann: Oxford, UK, 1991. [Google Scholar]
  67. Holman, H.Y.; Tsang, Y.W. Influence of soil moisture on biodegradation of petroleum hydrocarbons. In In Situ Aeration: Air Sparging, Bioventing, and Related Remediation Processes; Battelle Press: Columbus, OH, USA, 1995. [Google Scholar]
  68. Bossert, I.; Kachel, W.M.; Bartha, R. Fate of Hydrocarbons During Oily Sludge Disposal in Soil. Appl. Environ. Microbiol. 1984, 47, 763–767. [Google Scholar] [PubMed]
  69. Deuel, L.E.; Brown, K.W.; Thomas, J.C. Soil Disposal of API Pit Waste. In Proceedings of the 85th National Meeting of the American Institute of Chemical Engineers, Philadelphia, PA, USA, 4–8 June 1987. [Google Scholar]
  70. Chen, M.-M.; Zhu, Y.-G.; Su, Y.-H.; Chen, B.-D.; Fu, B.-J.; Marschner, P. Effects of soil moisture and plant interactions on the soil microbial community structure. Eur. J. Soil Biol. 2007, 43, 31–38. [Google Scholar] [CrossRef] [Green Version]
  71. Uhlirova, E.; Elhottova, D.; Triska, J.; Santruckova, H. Physiology and microbial community structure in soil at extreme water content. Folia Microbiol. 2005, 50, 161–166. [Google Scholar] [CrossRef]
  72. Wise, D.L. Remediation of Hazardous Waste Contaminated Soils; CRC Press: Boca Raton, FL, USA, 1994; ISBN 978-0-8247-9160-5. [Google Scholar]
Figure 1. Experimental set-up.
Applsci 09 00496 g001
Figure 2. Bacterial growth curves in different culture media.
Applsci 09 00496 g002
Figure 3. Degradation of DOC for the different fractions presented as c/c0 versus time (A) and exponential degradation phase of DOC presented as logarithm of c/c0 versus time (B).
Applsci 09 00496 g003
Figure 4. Correlation between experimental biodegradation rates and WFPS in the used grain size fractions.
Applsci 09 00496 g004
Table 1. Composition of culture media (in g/L).
SubstanceFormulaCAS-No.Nutrient Solution
ABCDEF
D-GlucoseC6H12O650-99-71111--
Peptonn.a.n.a.0.5-----
StarchC6H10O59005-25-80.5-----
Yeast extractn.a.n.a.0.5-----
Casamino acidn.a.n.a.0.5-----
Pyruvic acidC3H4O3127-17-30.3-----
Sodium acetateC2H3NaO2127-09-30.51----
Oxalic acidC2H2O4144-62-7--0.5--1
Salicylic acidC7H6O369-72-7--0.5-1
Kaliumdihydrogen-phosphatKH2PO47778-77-00.32.652.652.652.652.65
MagnesiumsulfatMgSO4 × 7H2O10034-99-80.050.20.20.20.20.2
Dinatriumhydrogen-phosphatNa2HPO47558-79-4-4.334.334.334.334.33
Ammoniumsulfat(NH4)2SO47783-20-2-0.50.50.50.50.5
CalciumchloridCaCl × 2H2O10035-04-8-0.050.050.050.050.05
Table 2. Characterization of the grain size fractions.
Fraction (µm)Porosity (vol.%)Bulk Density (g/cm³)PSD Index van Genuchten (-)PSD Index Brooks/Corey (-)Mean Pore Diameter (µm)pH Value (-)
125–20044.31.488.804.13476.49
200–63041.51.555.712.50956.36
630–100038.51.634.912.472306.38
1000–200037.01.665.862.704256.52
Table 3. Parameters of water balance.
Soil FractionVolumetric Soil Moisture Content–Wet Phase (vol. %)Volumetric Soil Moisture Content–Dry Phase (vol. %)Water Filled Pore Space–Wet Phase (%)Water Filled Pore Space–Dry Phase (%)Water-Air-Ratio–Wet Phase [-]Water-Air-Ratio–Dry Phase [-]
125–200 µm0.390.3889867.96.1
200–630 µm0.330.3280774.03.3
630–1000 µm0.290.2275583.11.4
1000–2000 µm0.240.1665441.90.8
Table 4. Water saturation and matric potential ranges for optimal biodegradation conditions.
Water Saturation (%)Water Saturation (%FC)Water Saturation (%WHC)Matric Potential (Pa)Soil TypeApplication (Biodegradation of)Source
28–95n.a.30–90400–5000Loamy sandHydrocarbons[60]
30–98n.a.25–85300–4000n.a.n.a.[26]
53–71n.a.50–701000–2000n.a.Pesticides[61]
58–82n.a.58–82n.a.Peat and sandPentachlorophenol[62]
70–93n.a.n.a.n.a.Sand/gravel with clayHydrocarbons [63]
26–47n.a.n.a.n.a.Sandy loamPentachlorophenol[64]
21–83n.a.n.a.n.a.Sandy loamMetolachlor[65]
70–9335–50n.a.500–1000n.a.Fuel and solvent[66]
53–7050–70n.a.1000–2000Silty loamHydrocarbons[67]
n.a.n.a.50–80n.a.Sandy loamPolynucleararomatics (PNAs)[68]
n.a.n.a.66–100n.a.n.a.Constituents in waste fluid[69]
n.a.60–80n.a.n.a.Silty sandn.a.[70]
n.a.n.a.41–62n.a.Sandy loamn.a.[71]
Note: n.a.—not available.
Table 5. Calculated degradation rates for each fraction.
Runtime [d]Degradation Rate for Fraction 125–200 µm [d1]Runtime [d]Degradation Rate for Fraction 200–630 µm [d1]Runtime [d]Degradation Rate for Fraction 630–1000 µm [d1]Runtime [d]Degradation Rate for Fraction 1000–2000 µm [d1]
0–12No degr.0–12No degr.0–4No degr.0–4No degr.
13–300.01113–470.0155–290.0385–340.018

