Spatio-Temporal Variability of Drought in Pakistan Using Standardized Precipitation Evapotranspiration Index


Abstract
:Featured Application
Abstract
1. Introduction
2. Methods
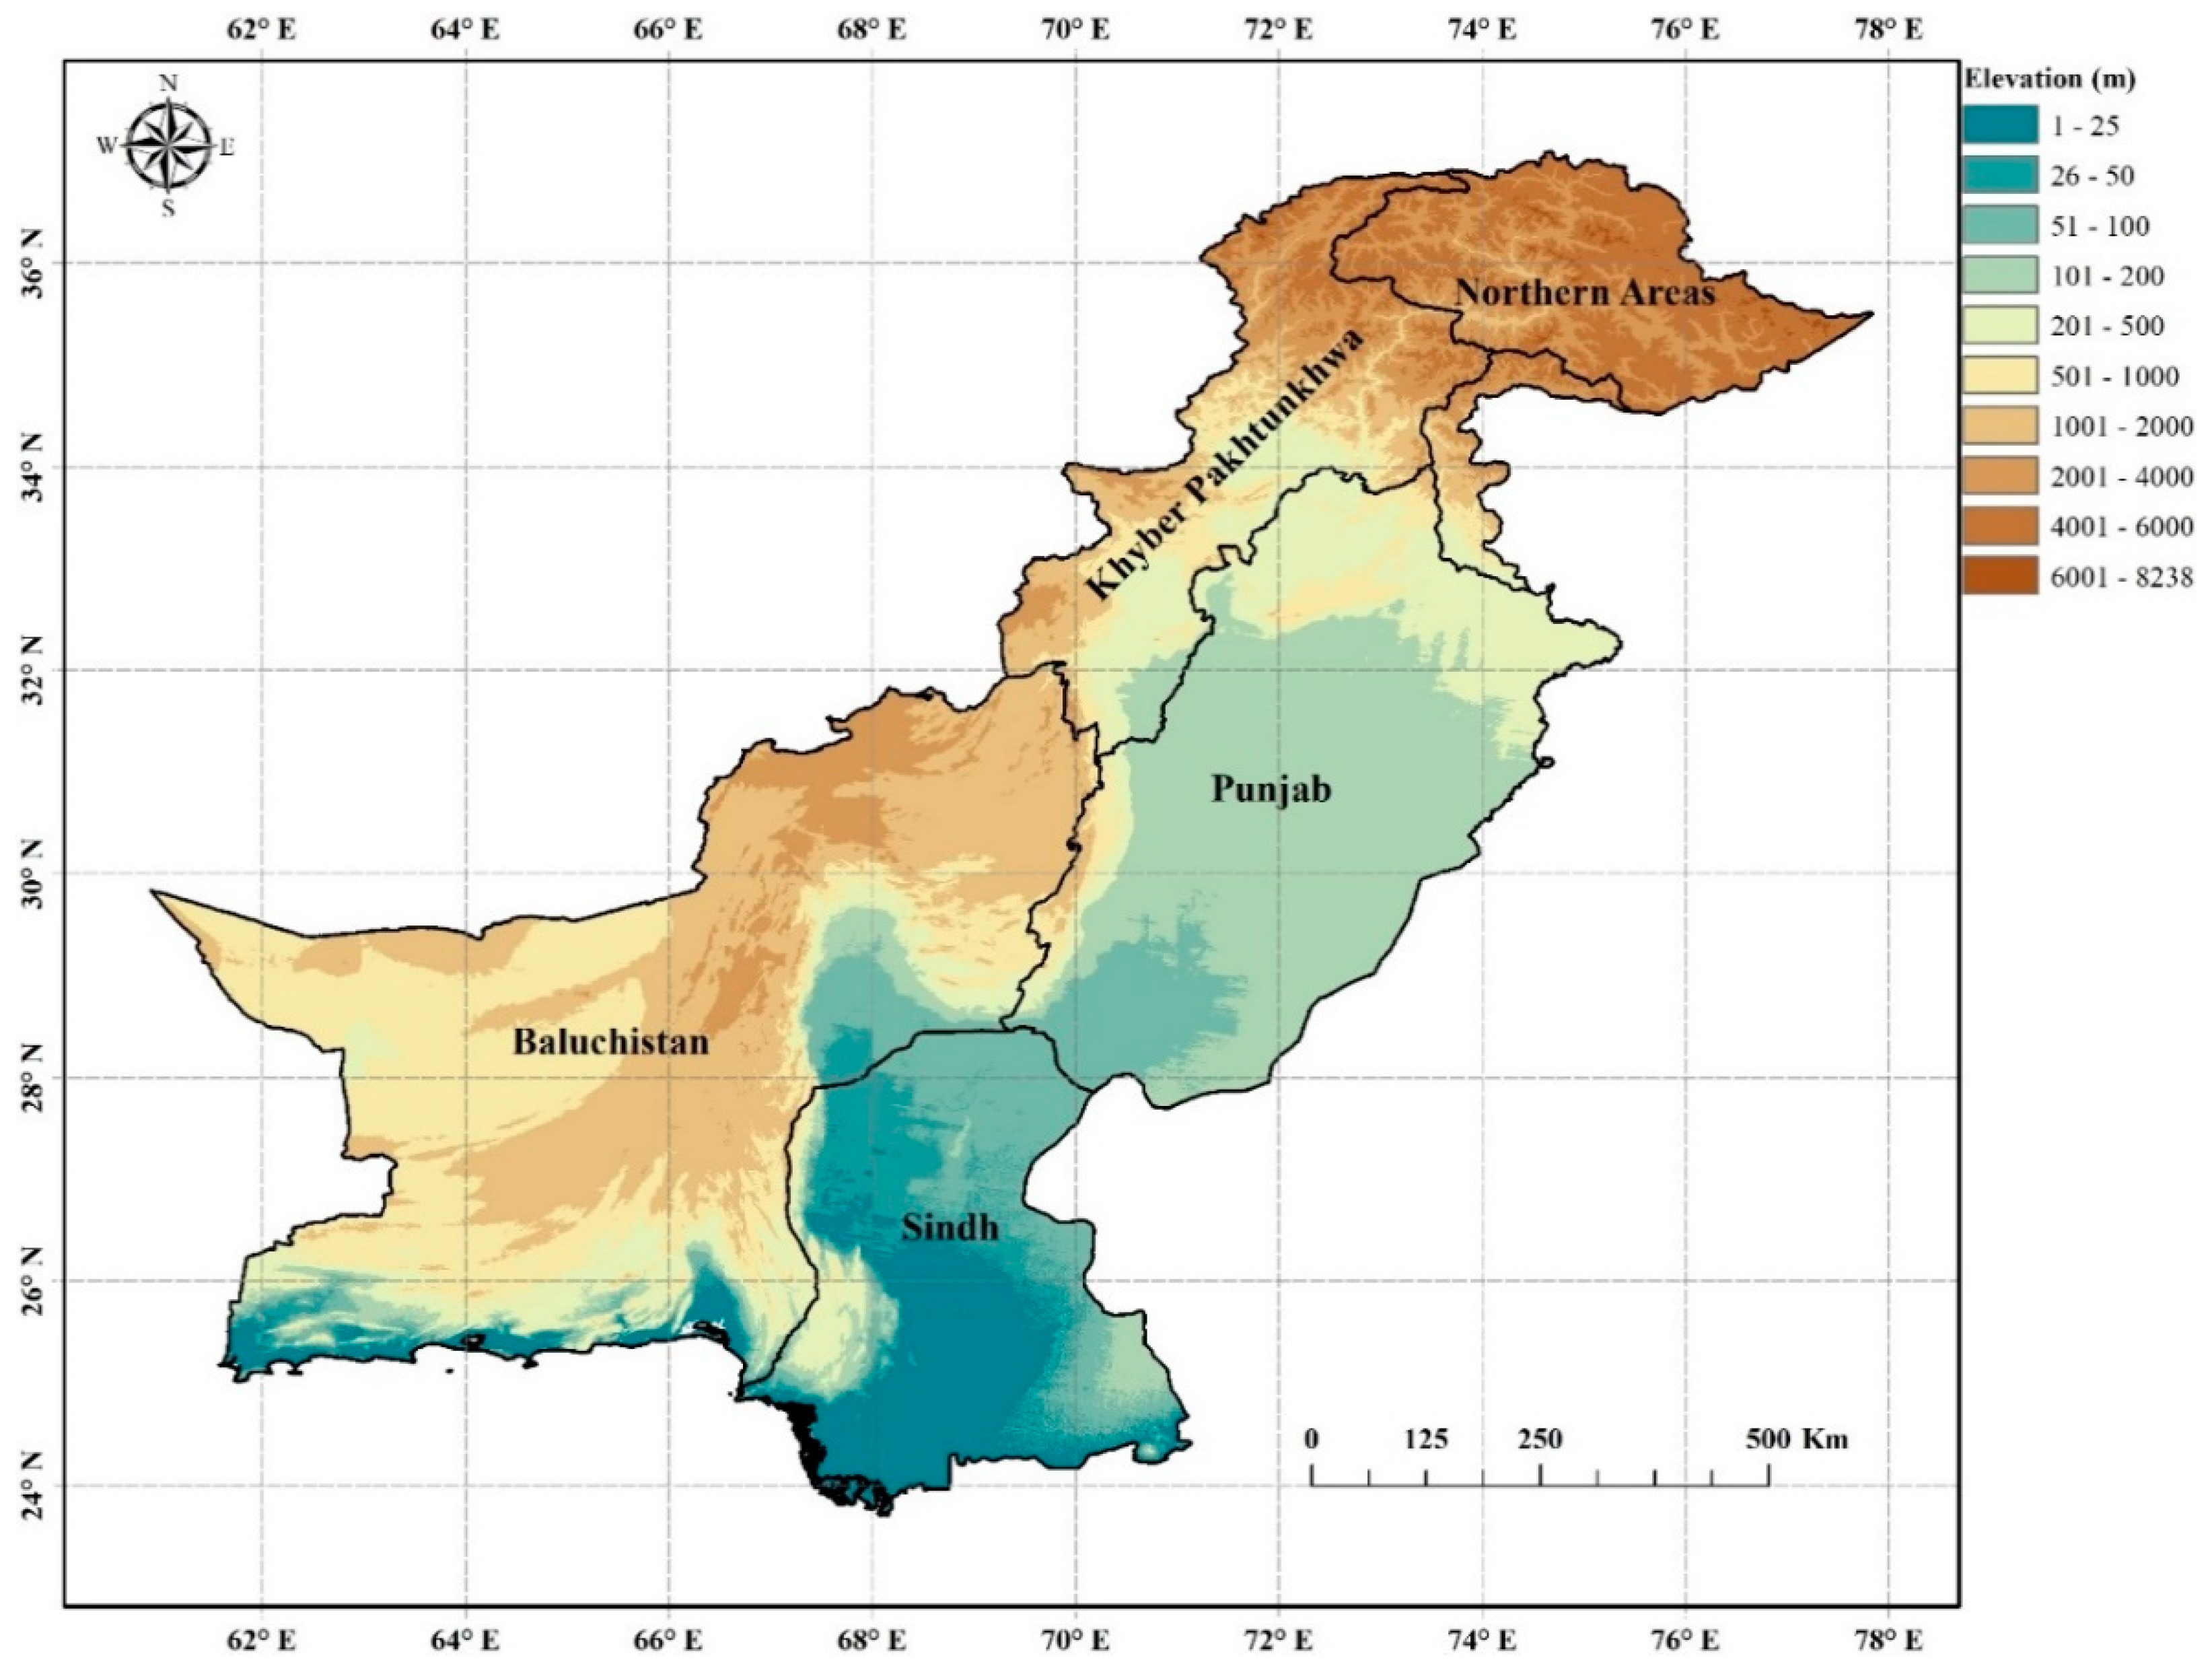
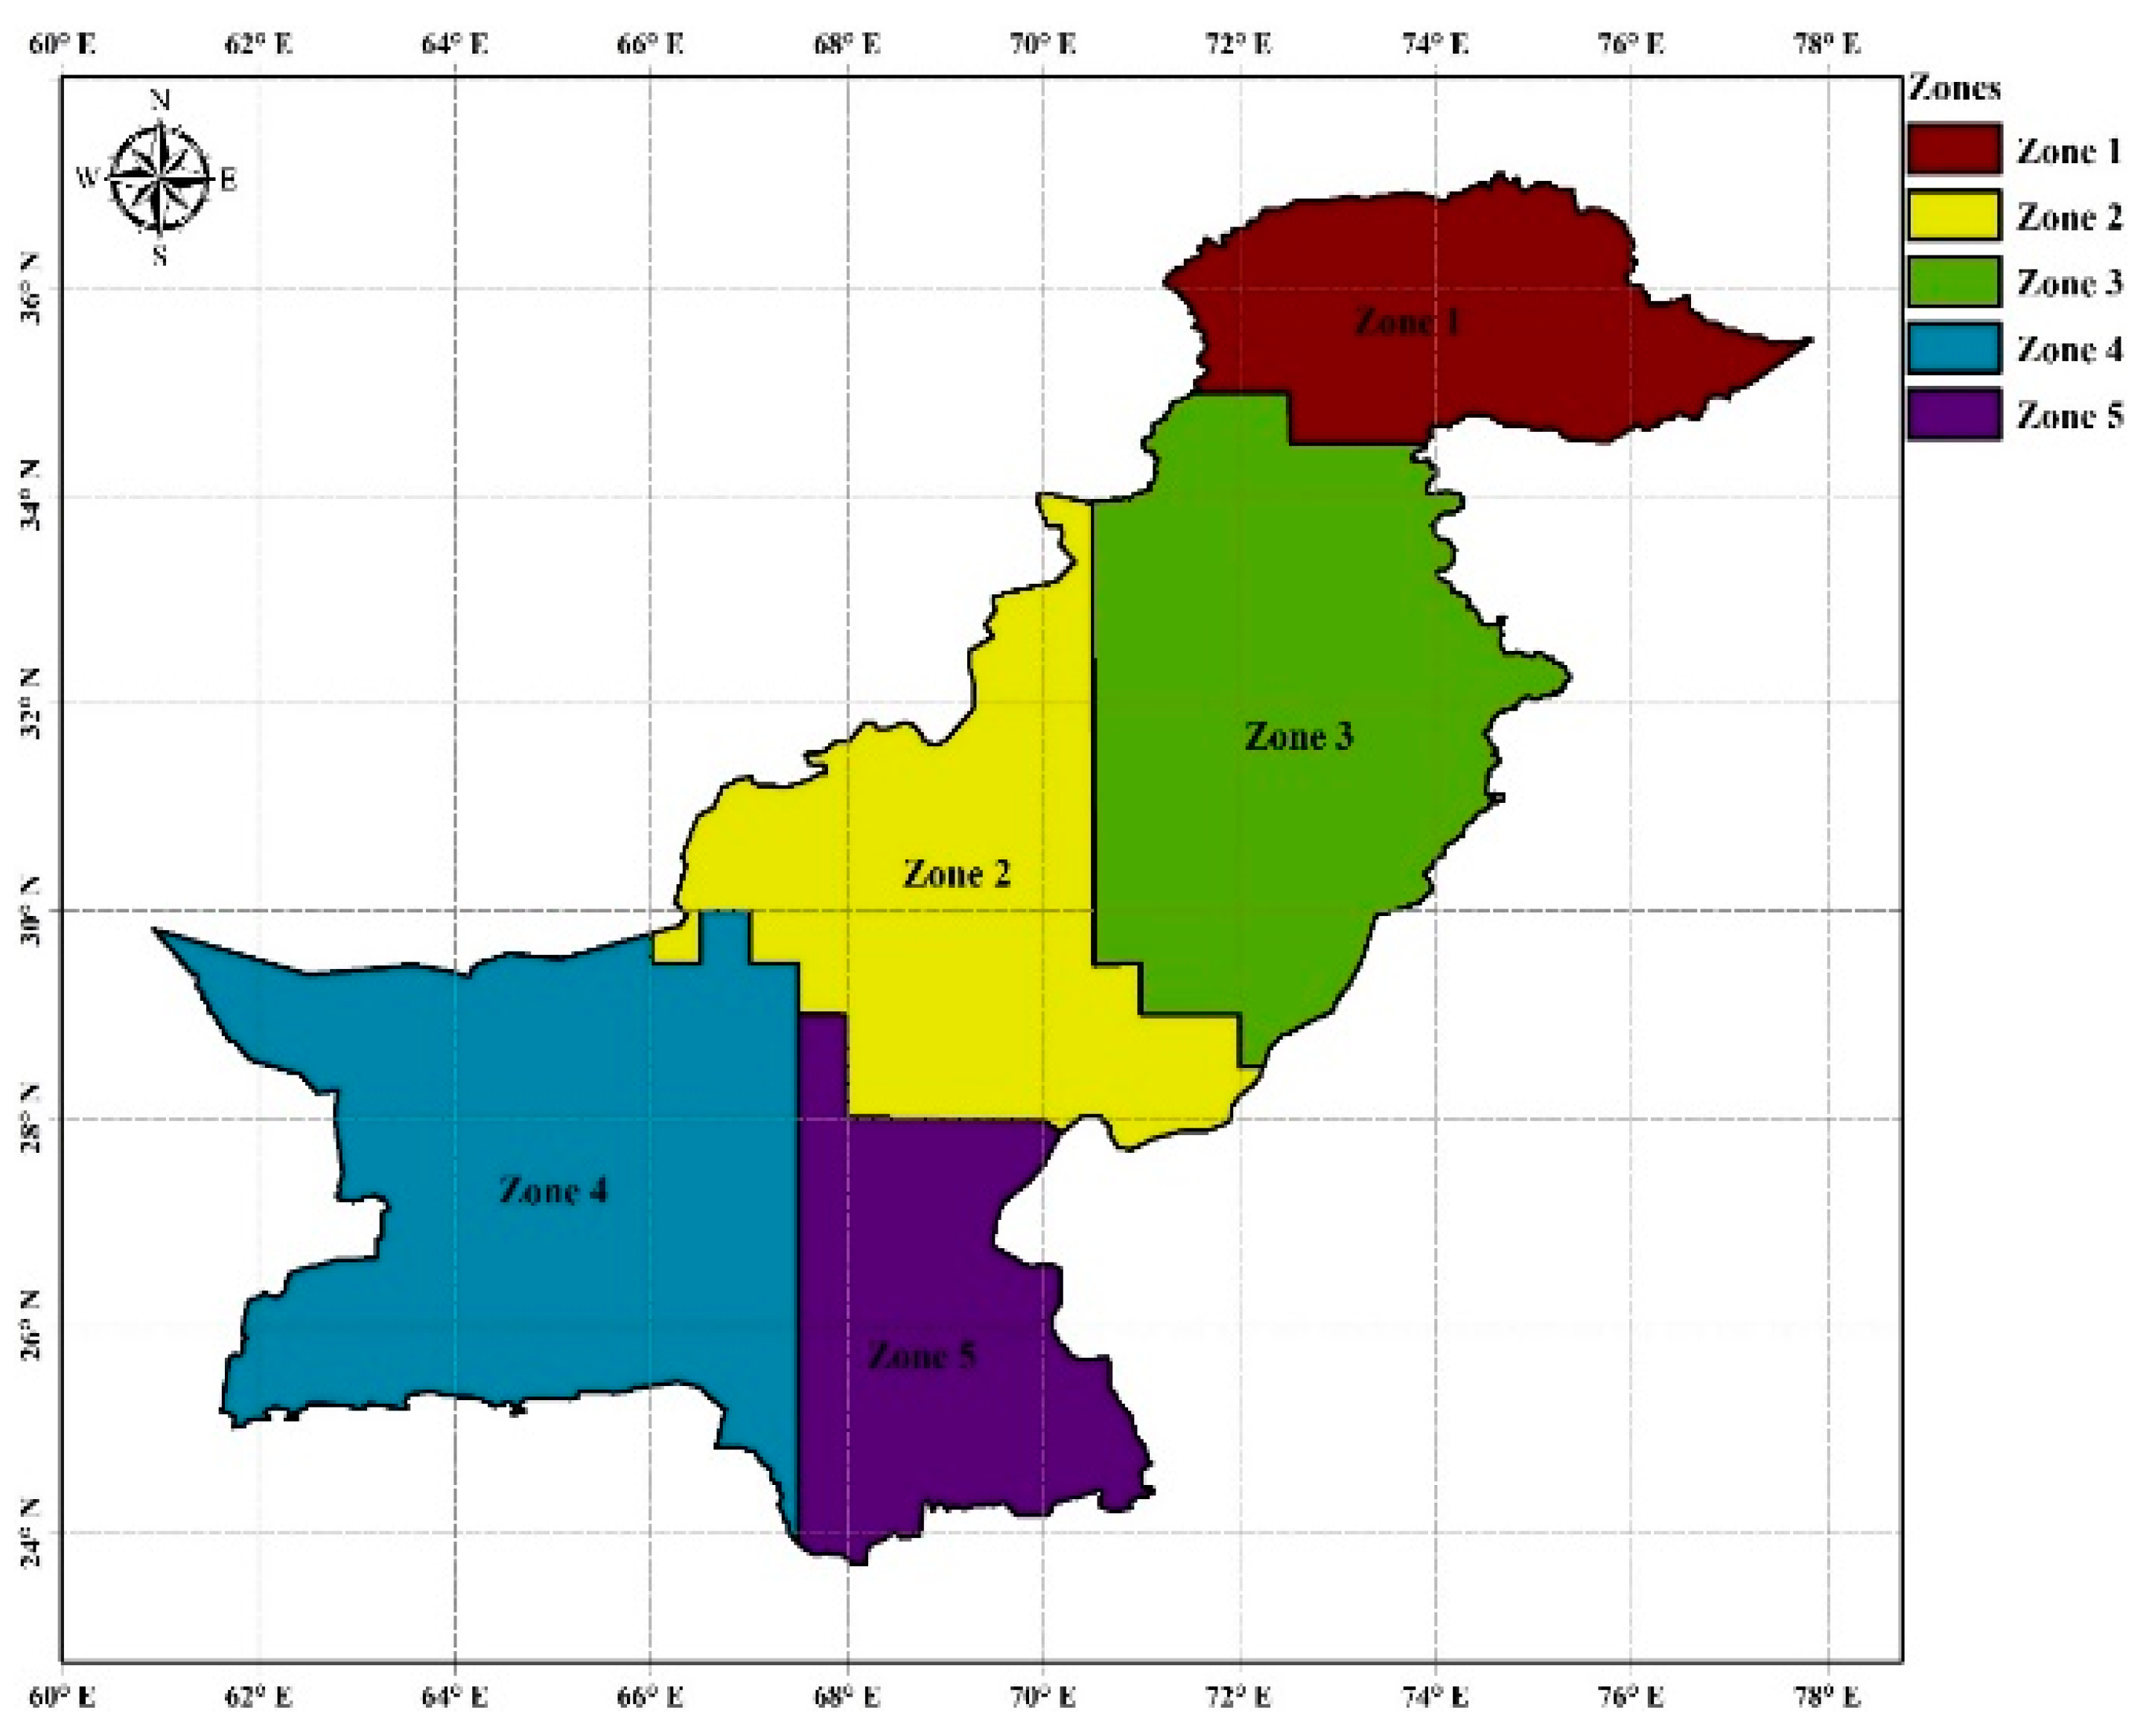
2.1. Study Area
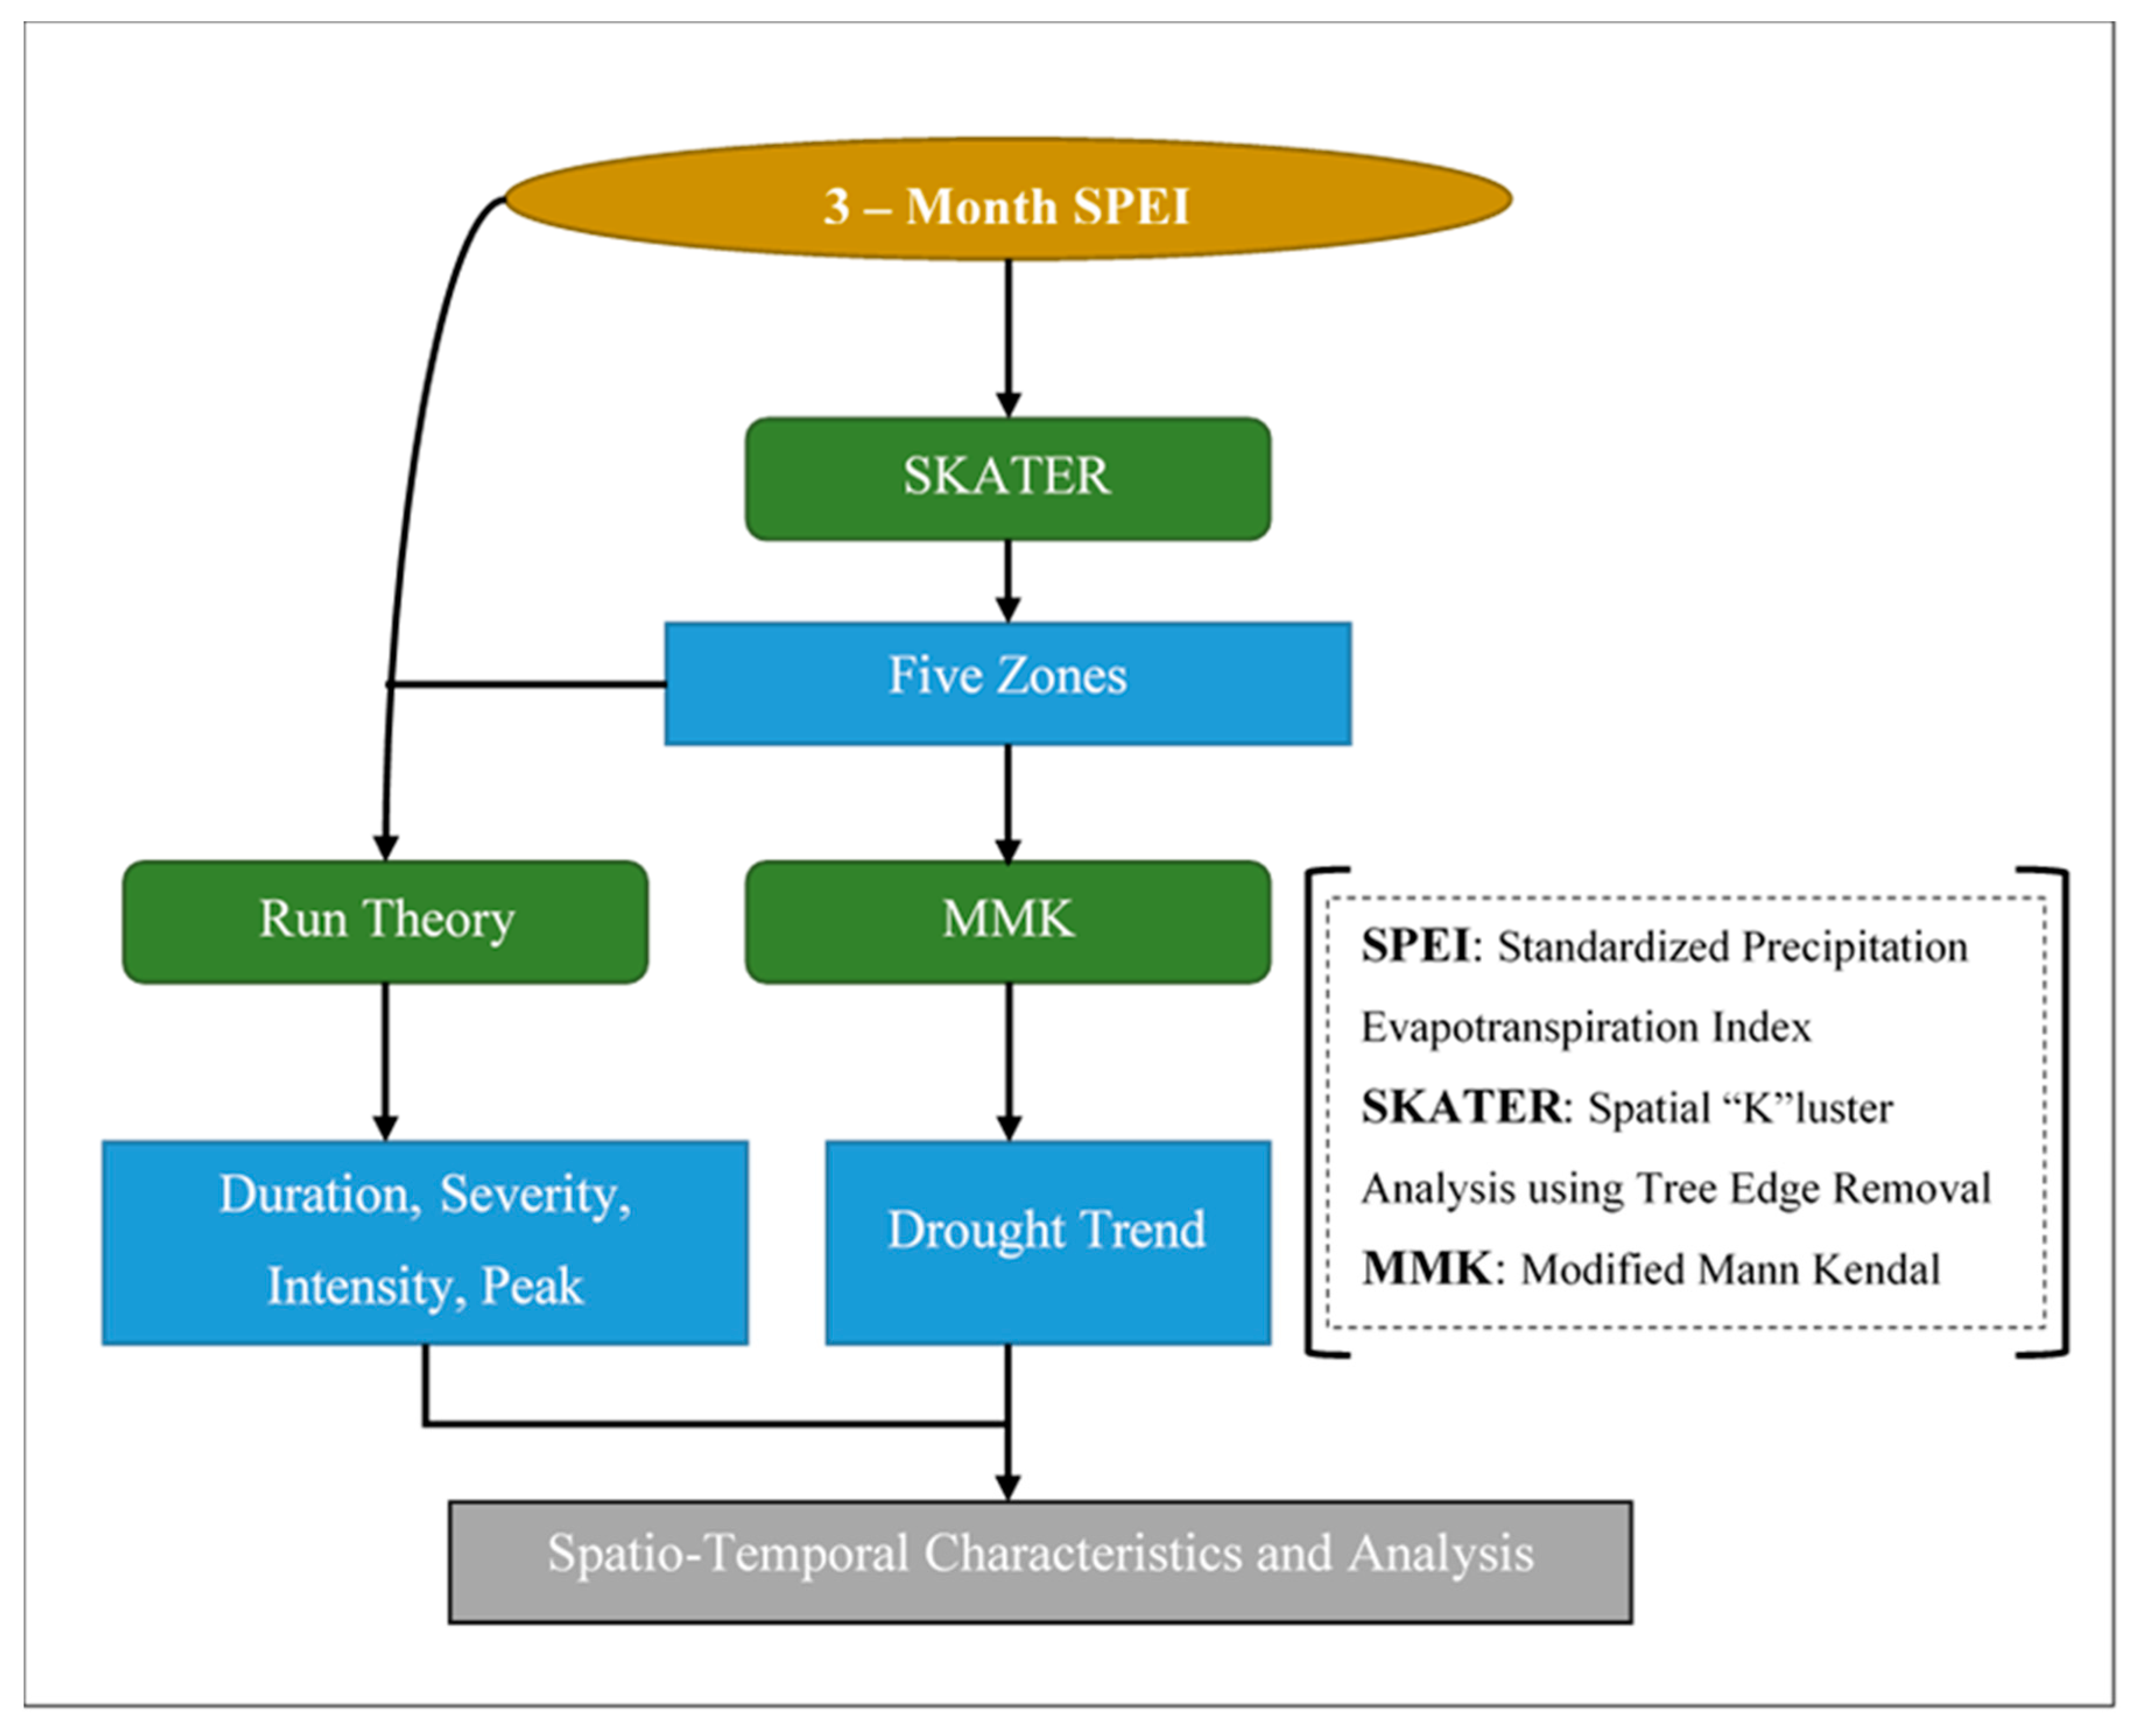
2.2. Methodological Framework
2.3. Meteorological Data
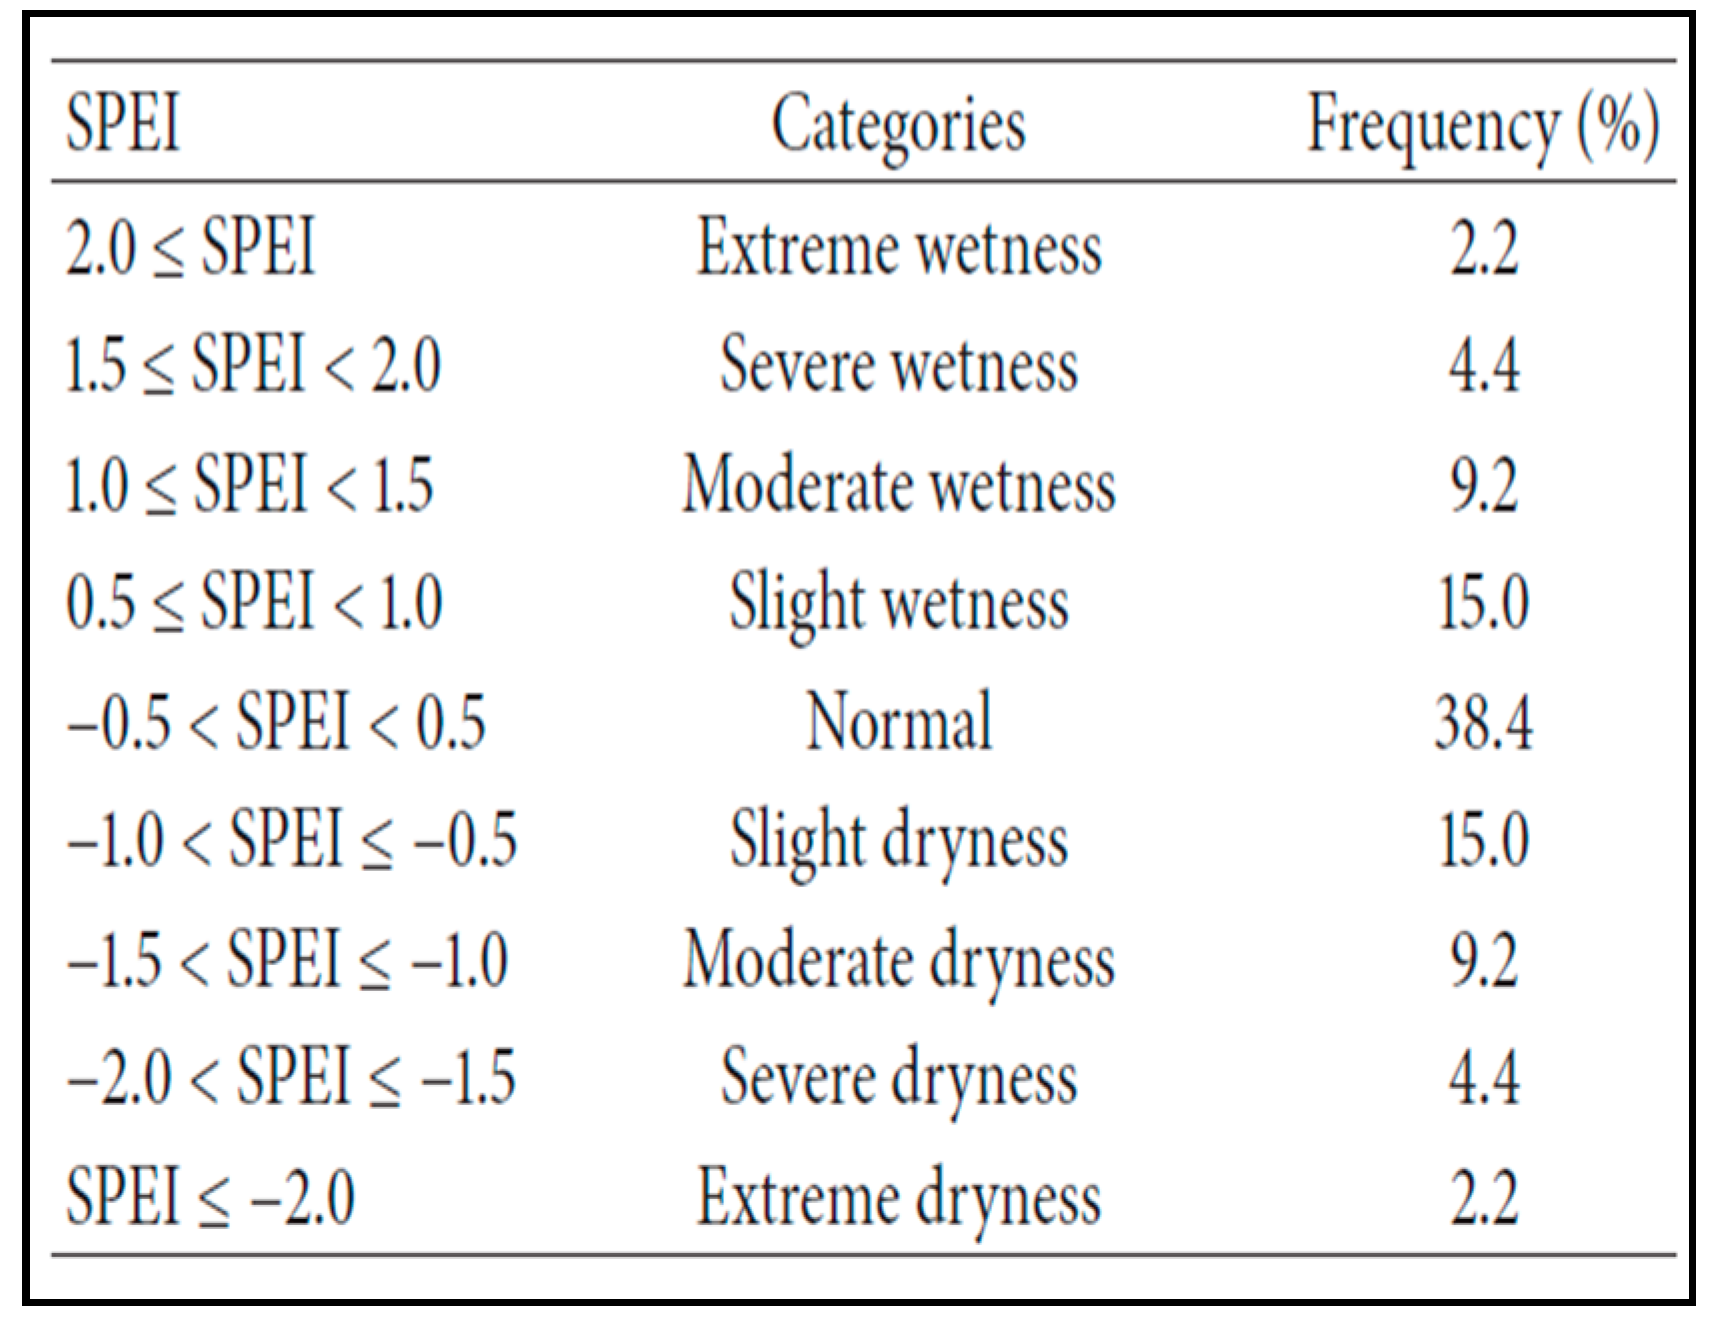
2.4. Standardized Precipitation Evapotranspiration Index (SPEI)
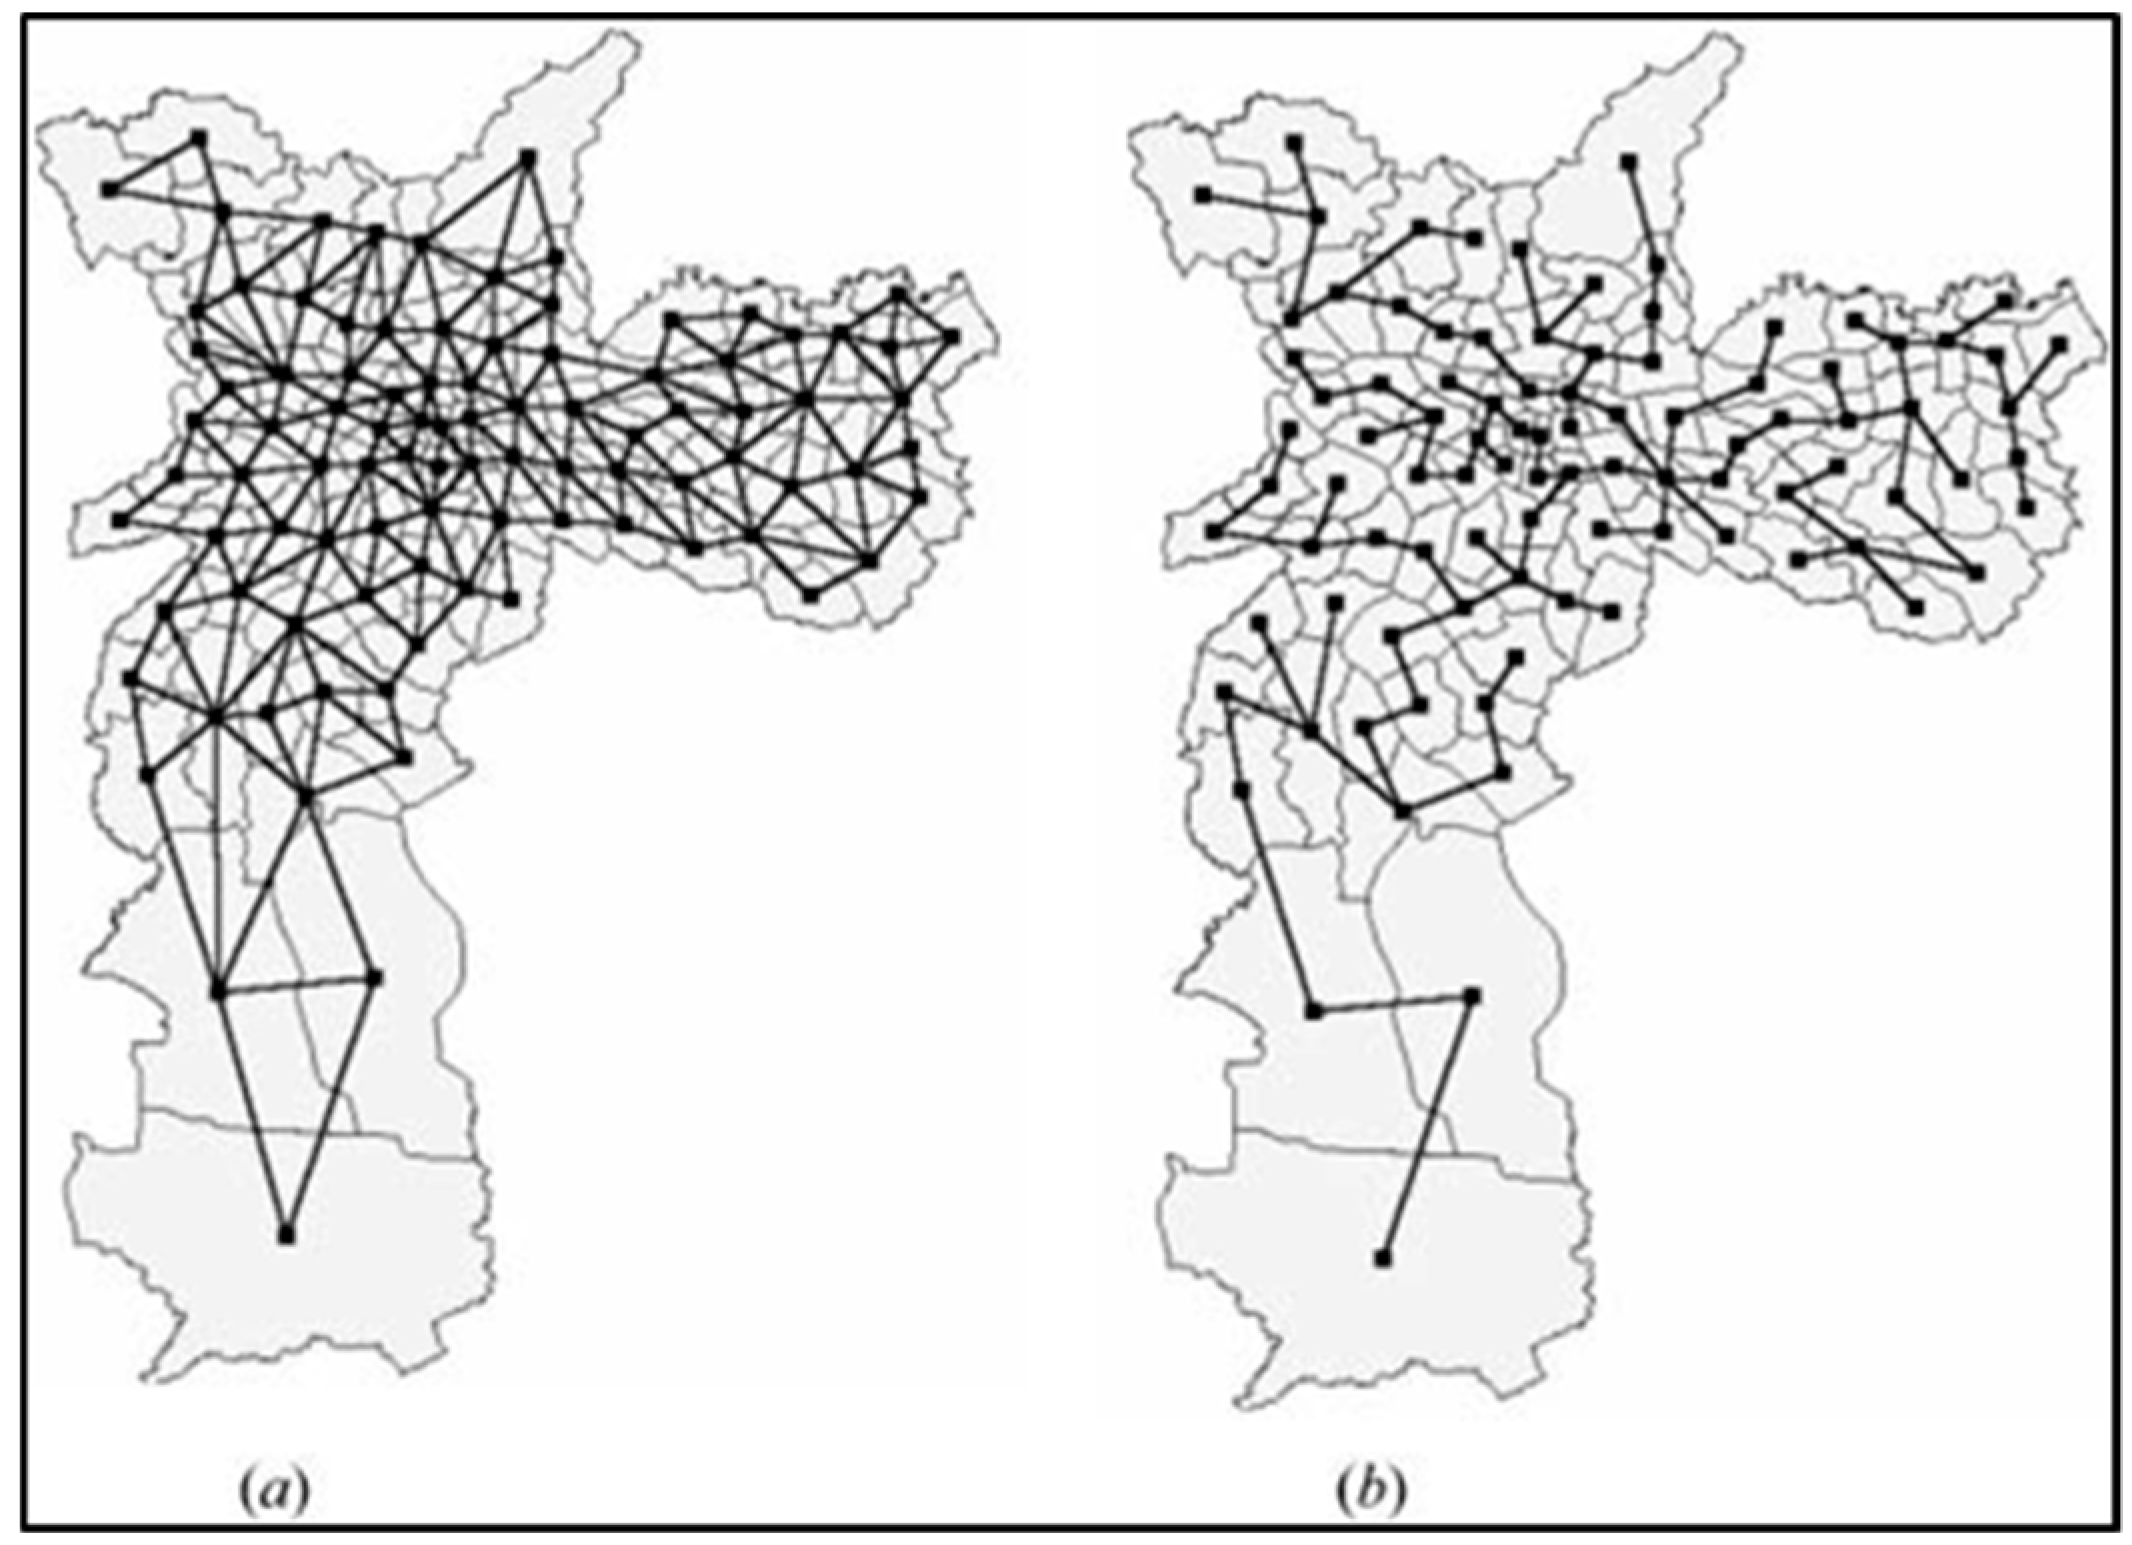
2.5. Drought Regionalization
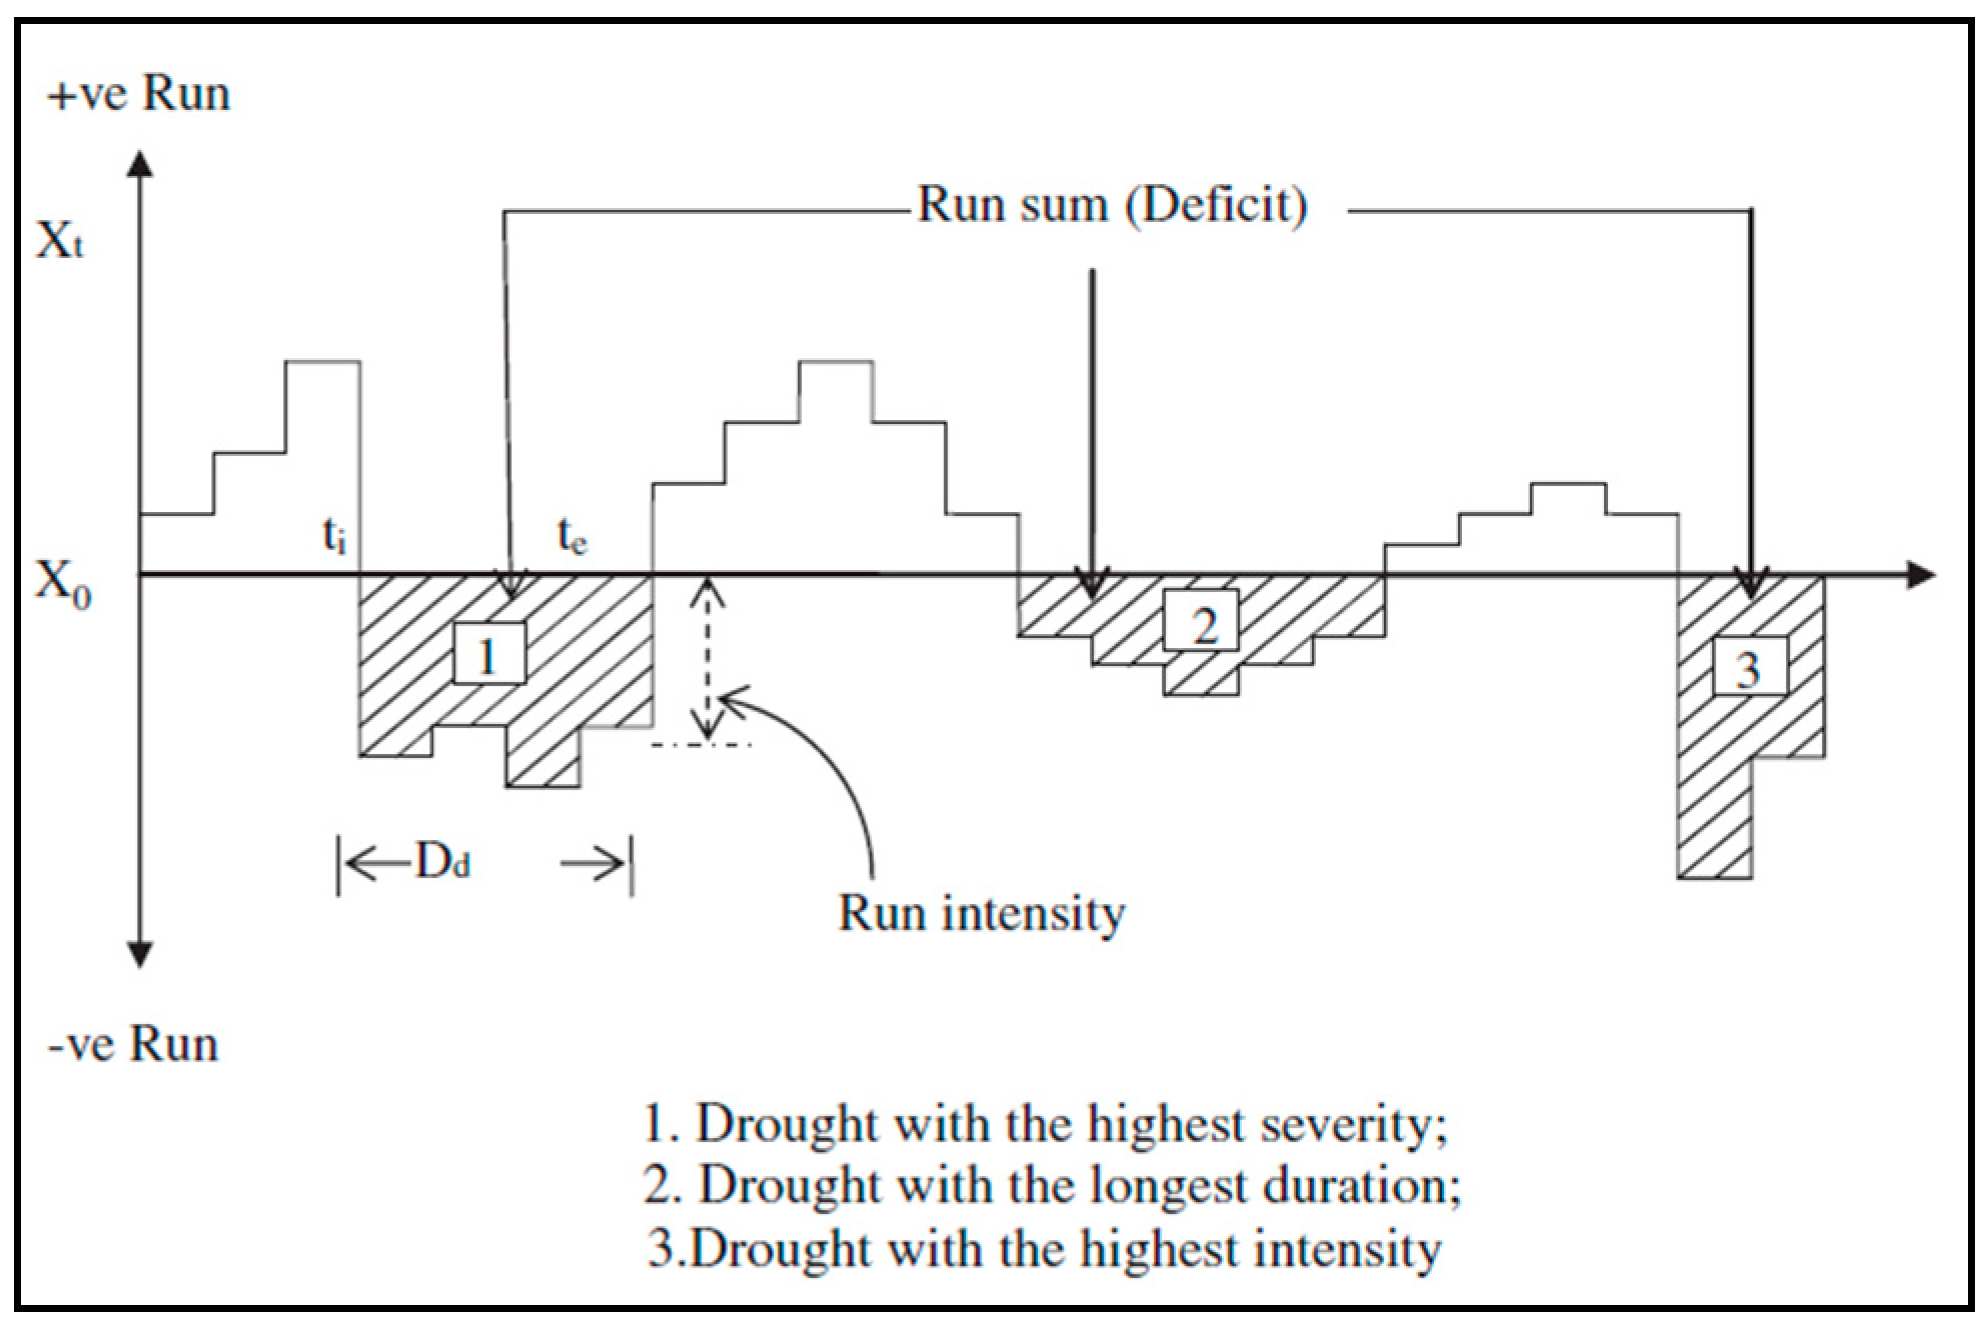
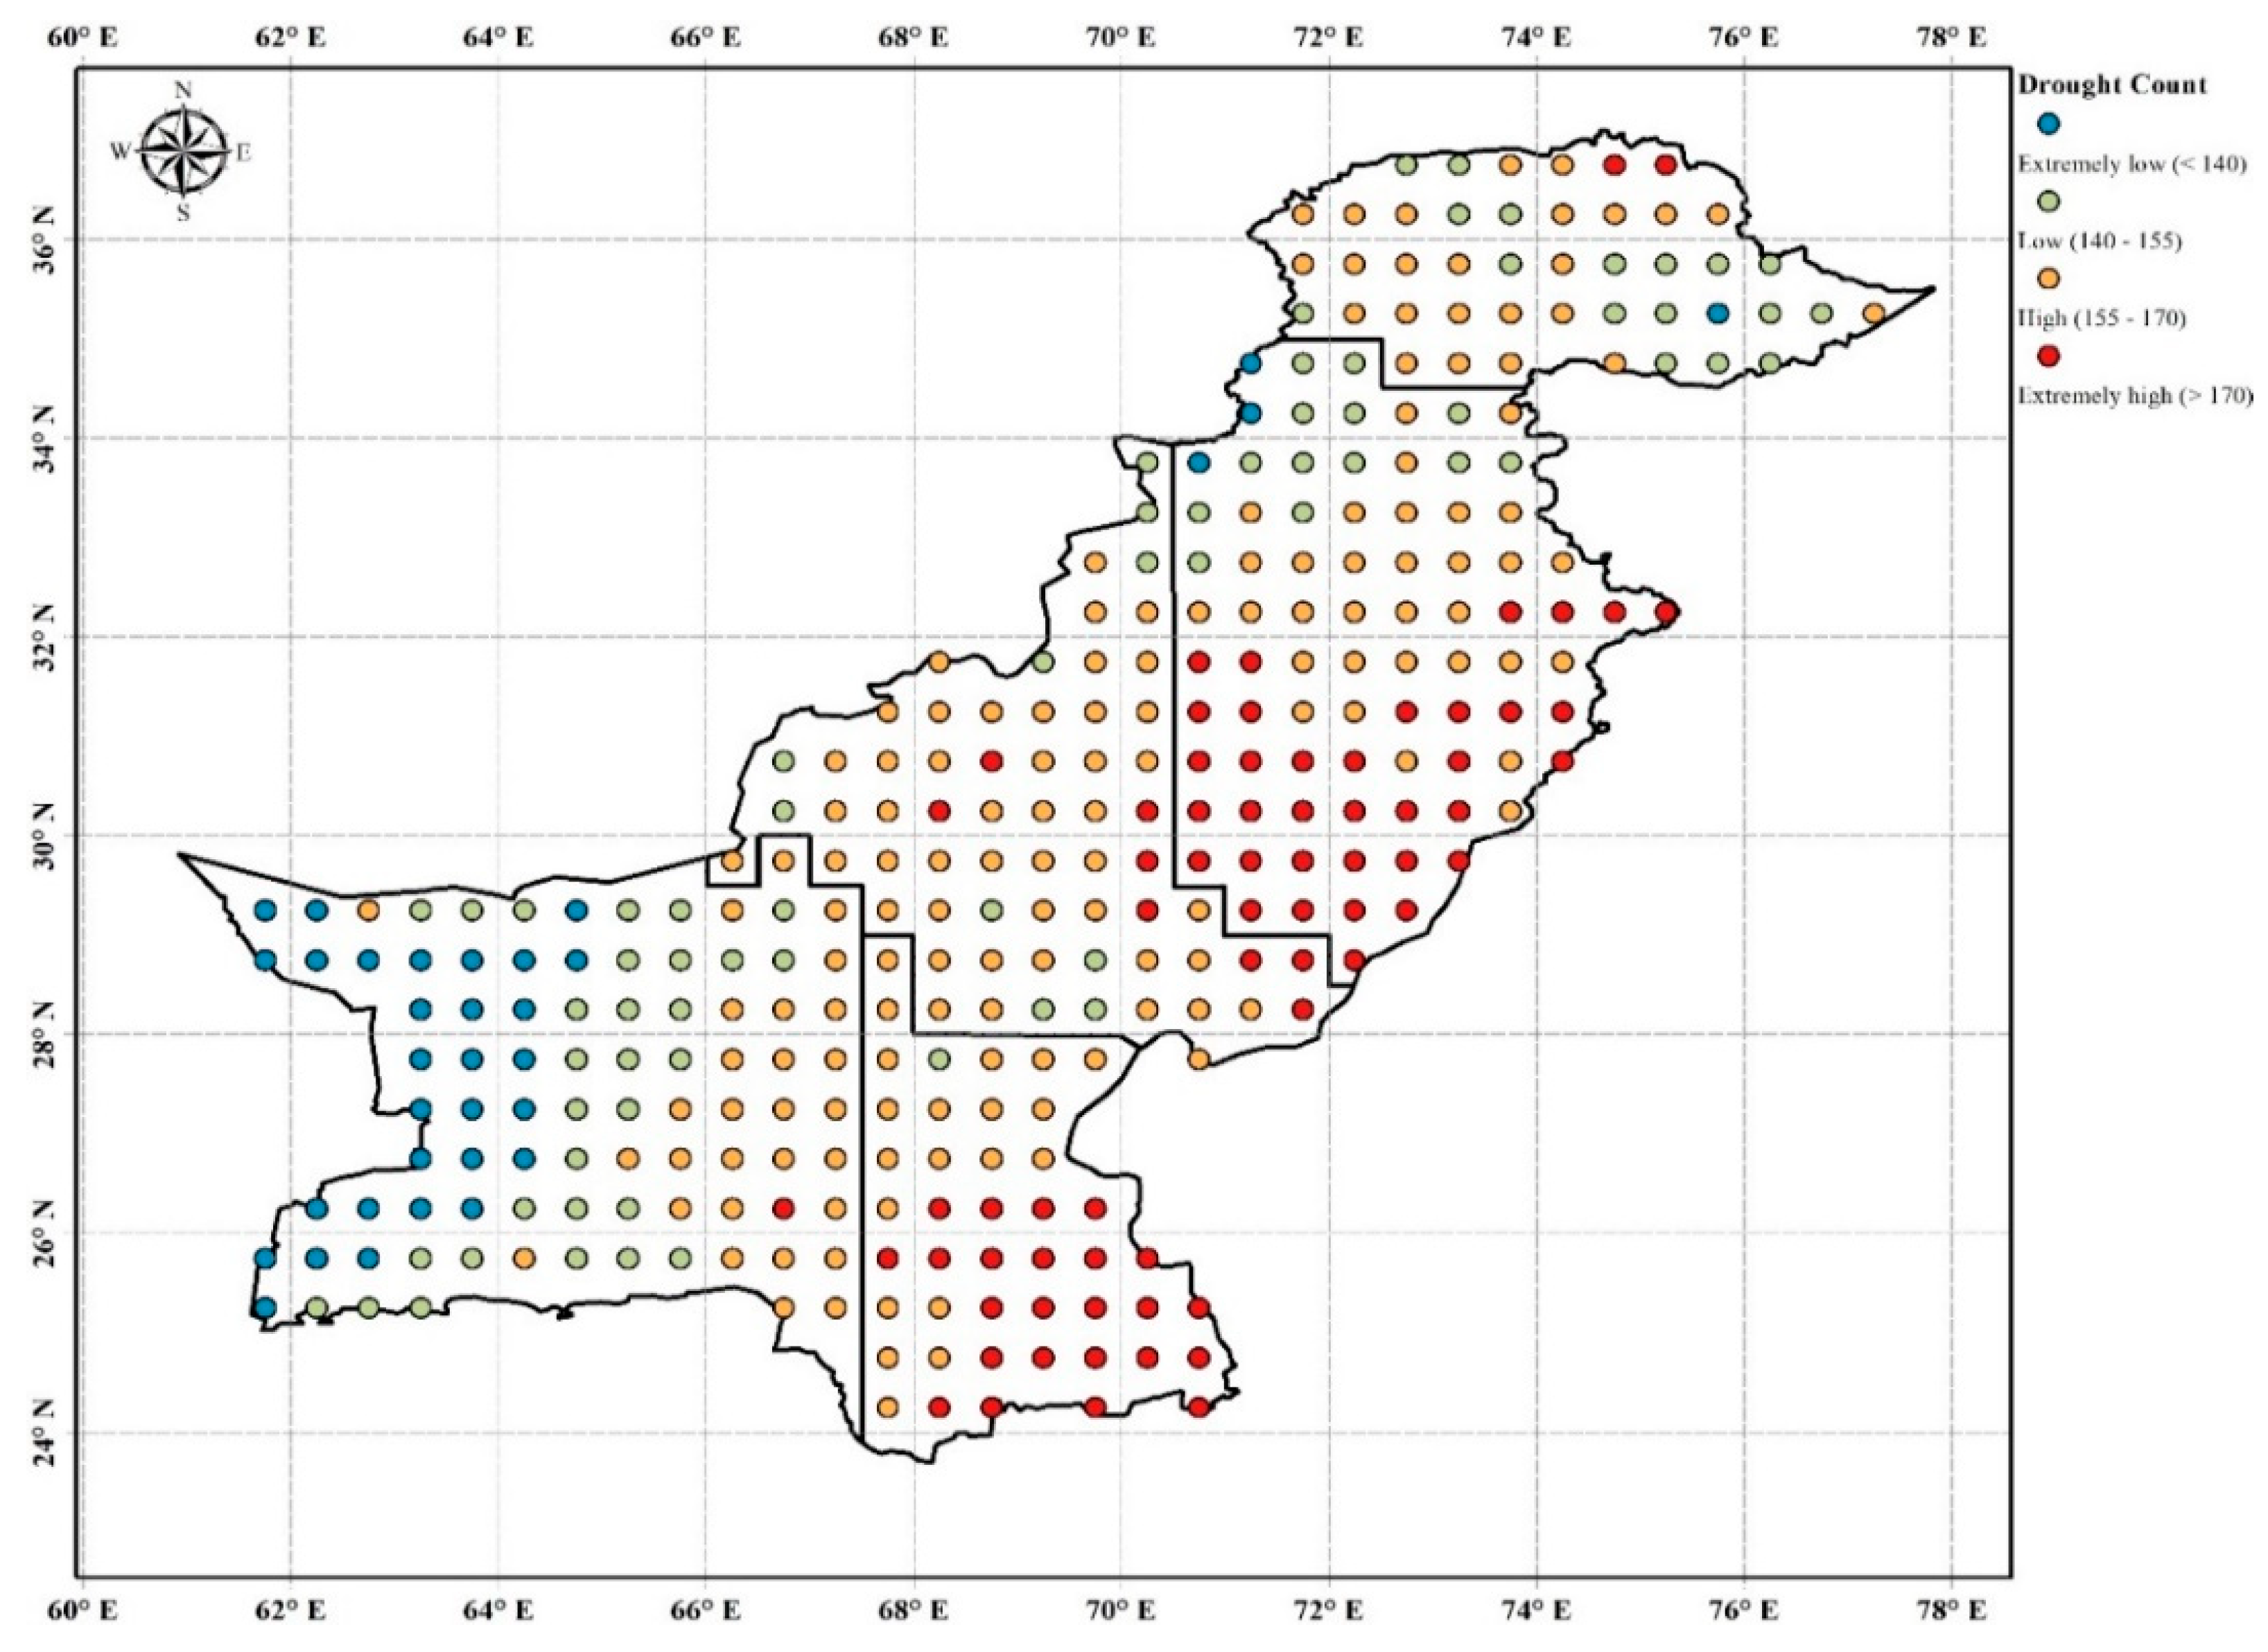
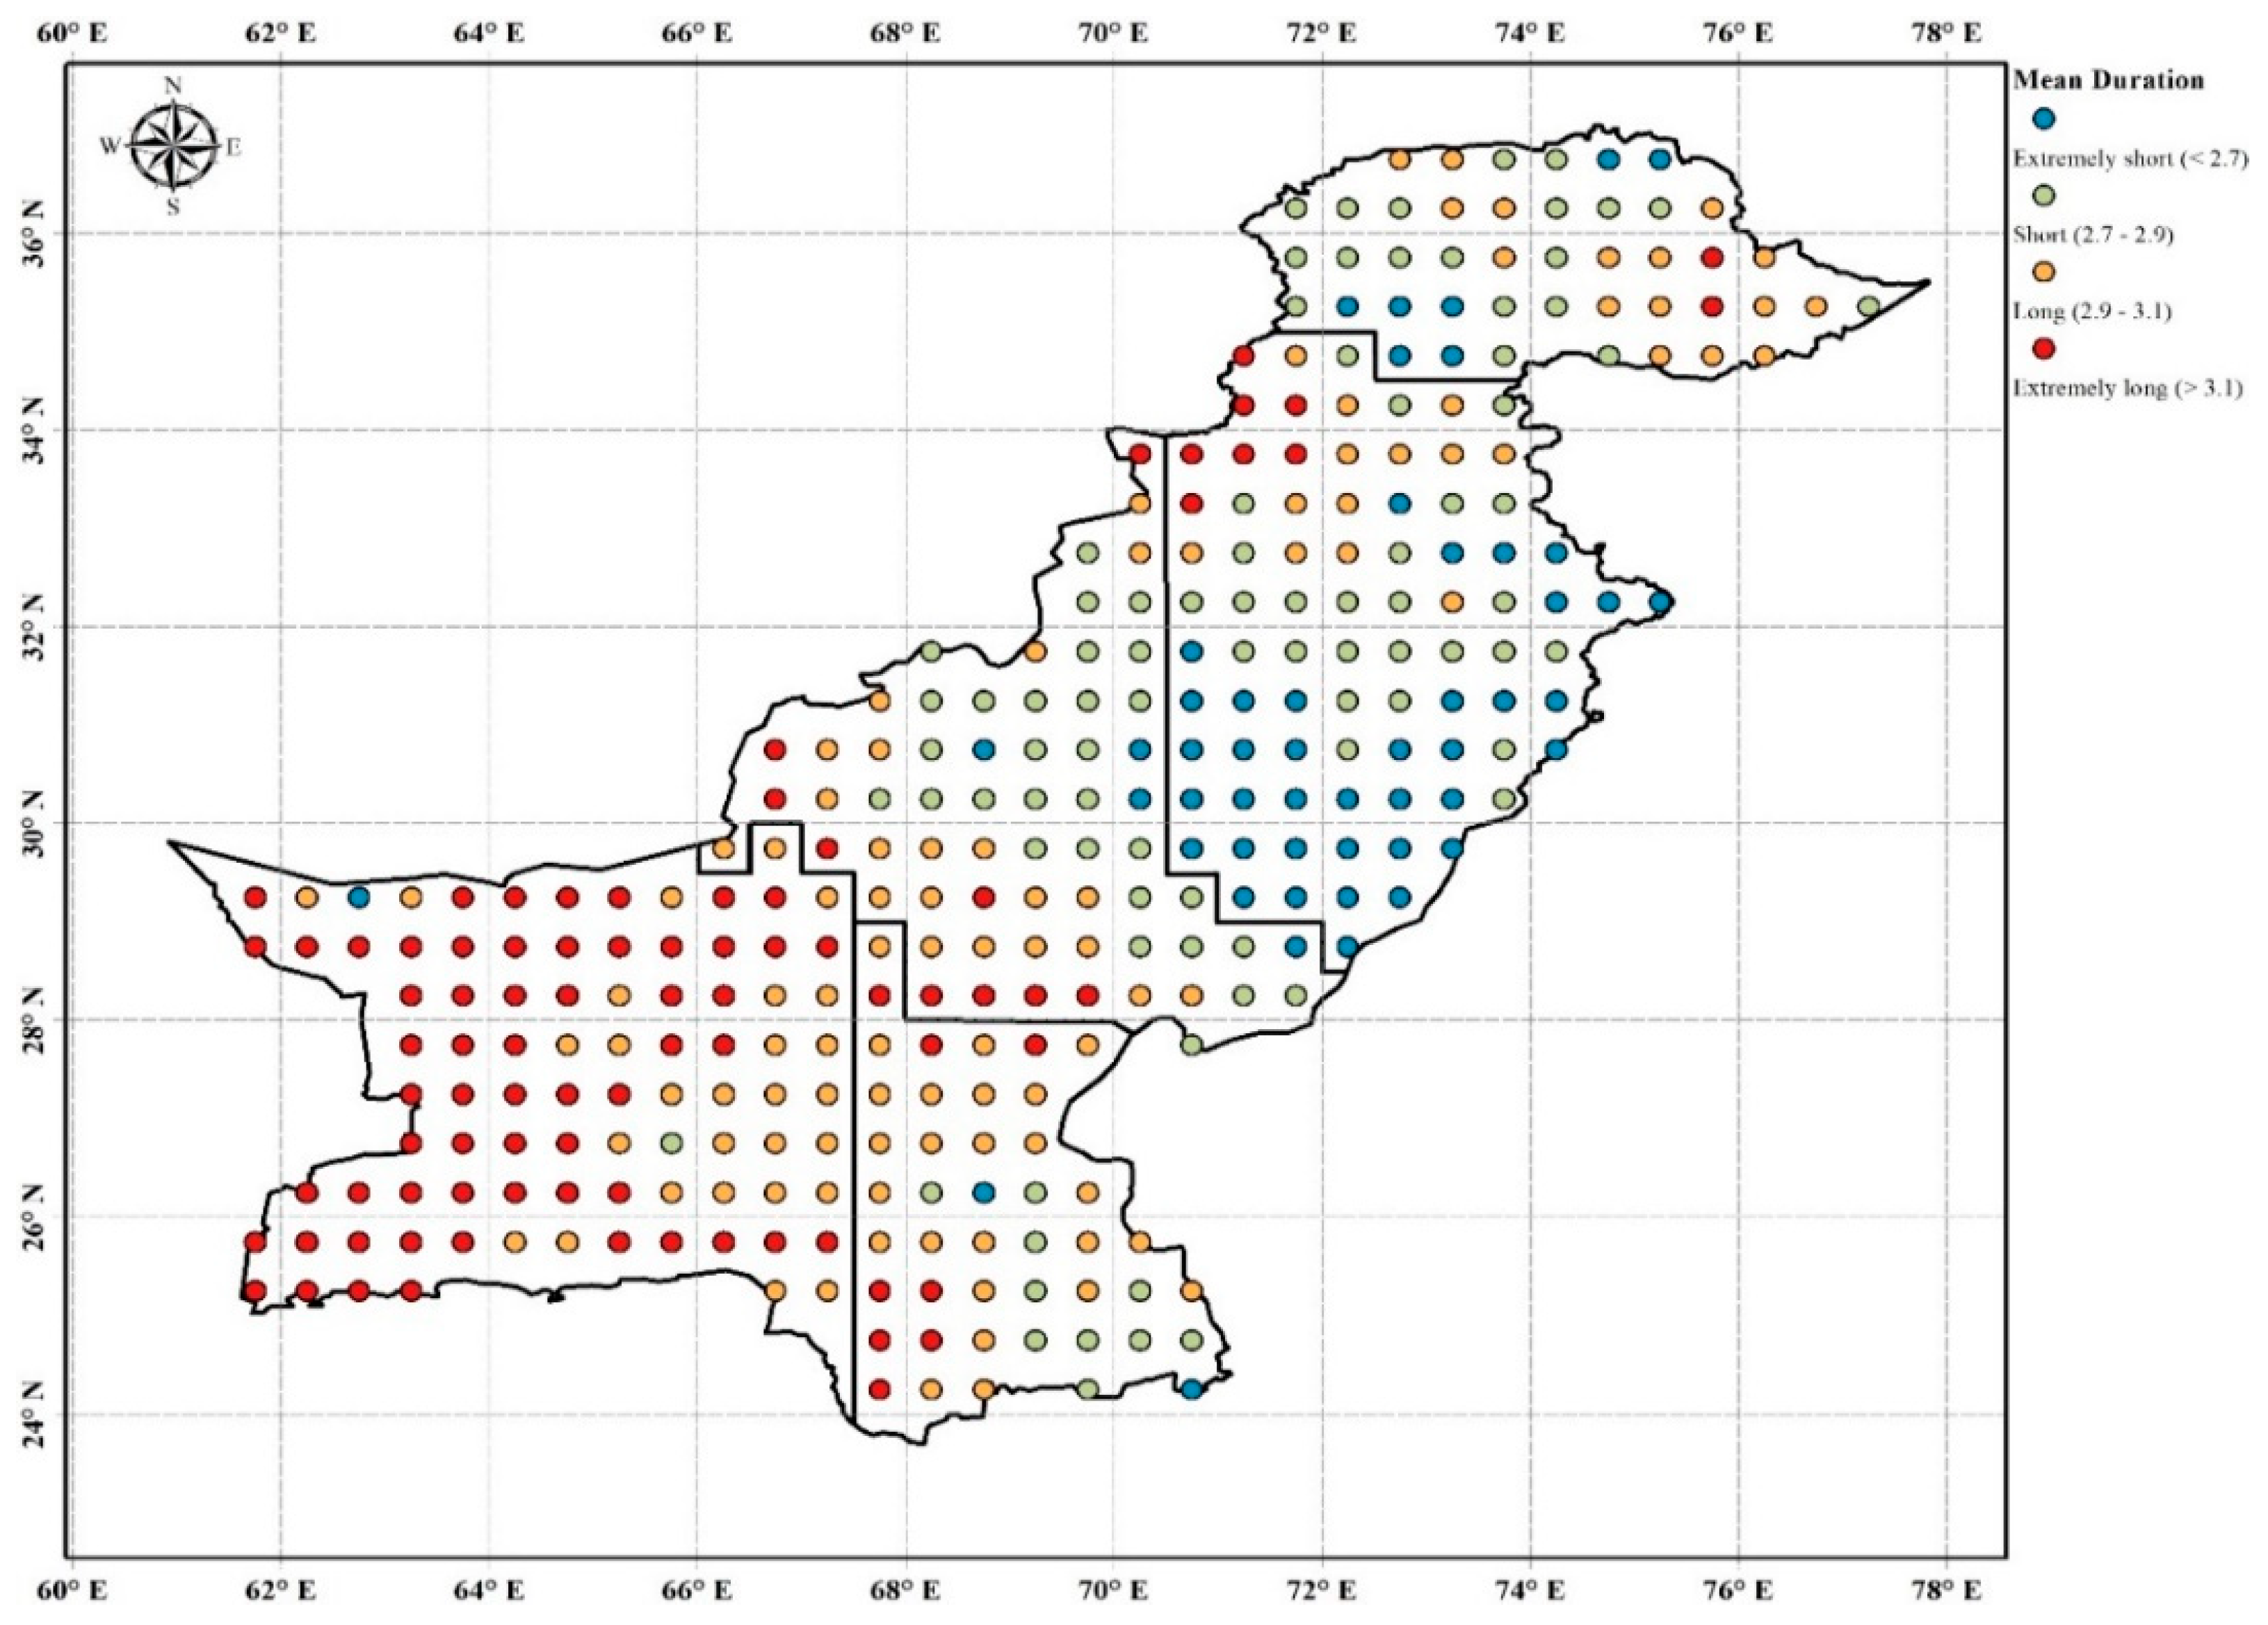
2.6. Drought Characterization
2.7. Trend Analysis
3. Results
3.1. Drought Regionalization
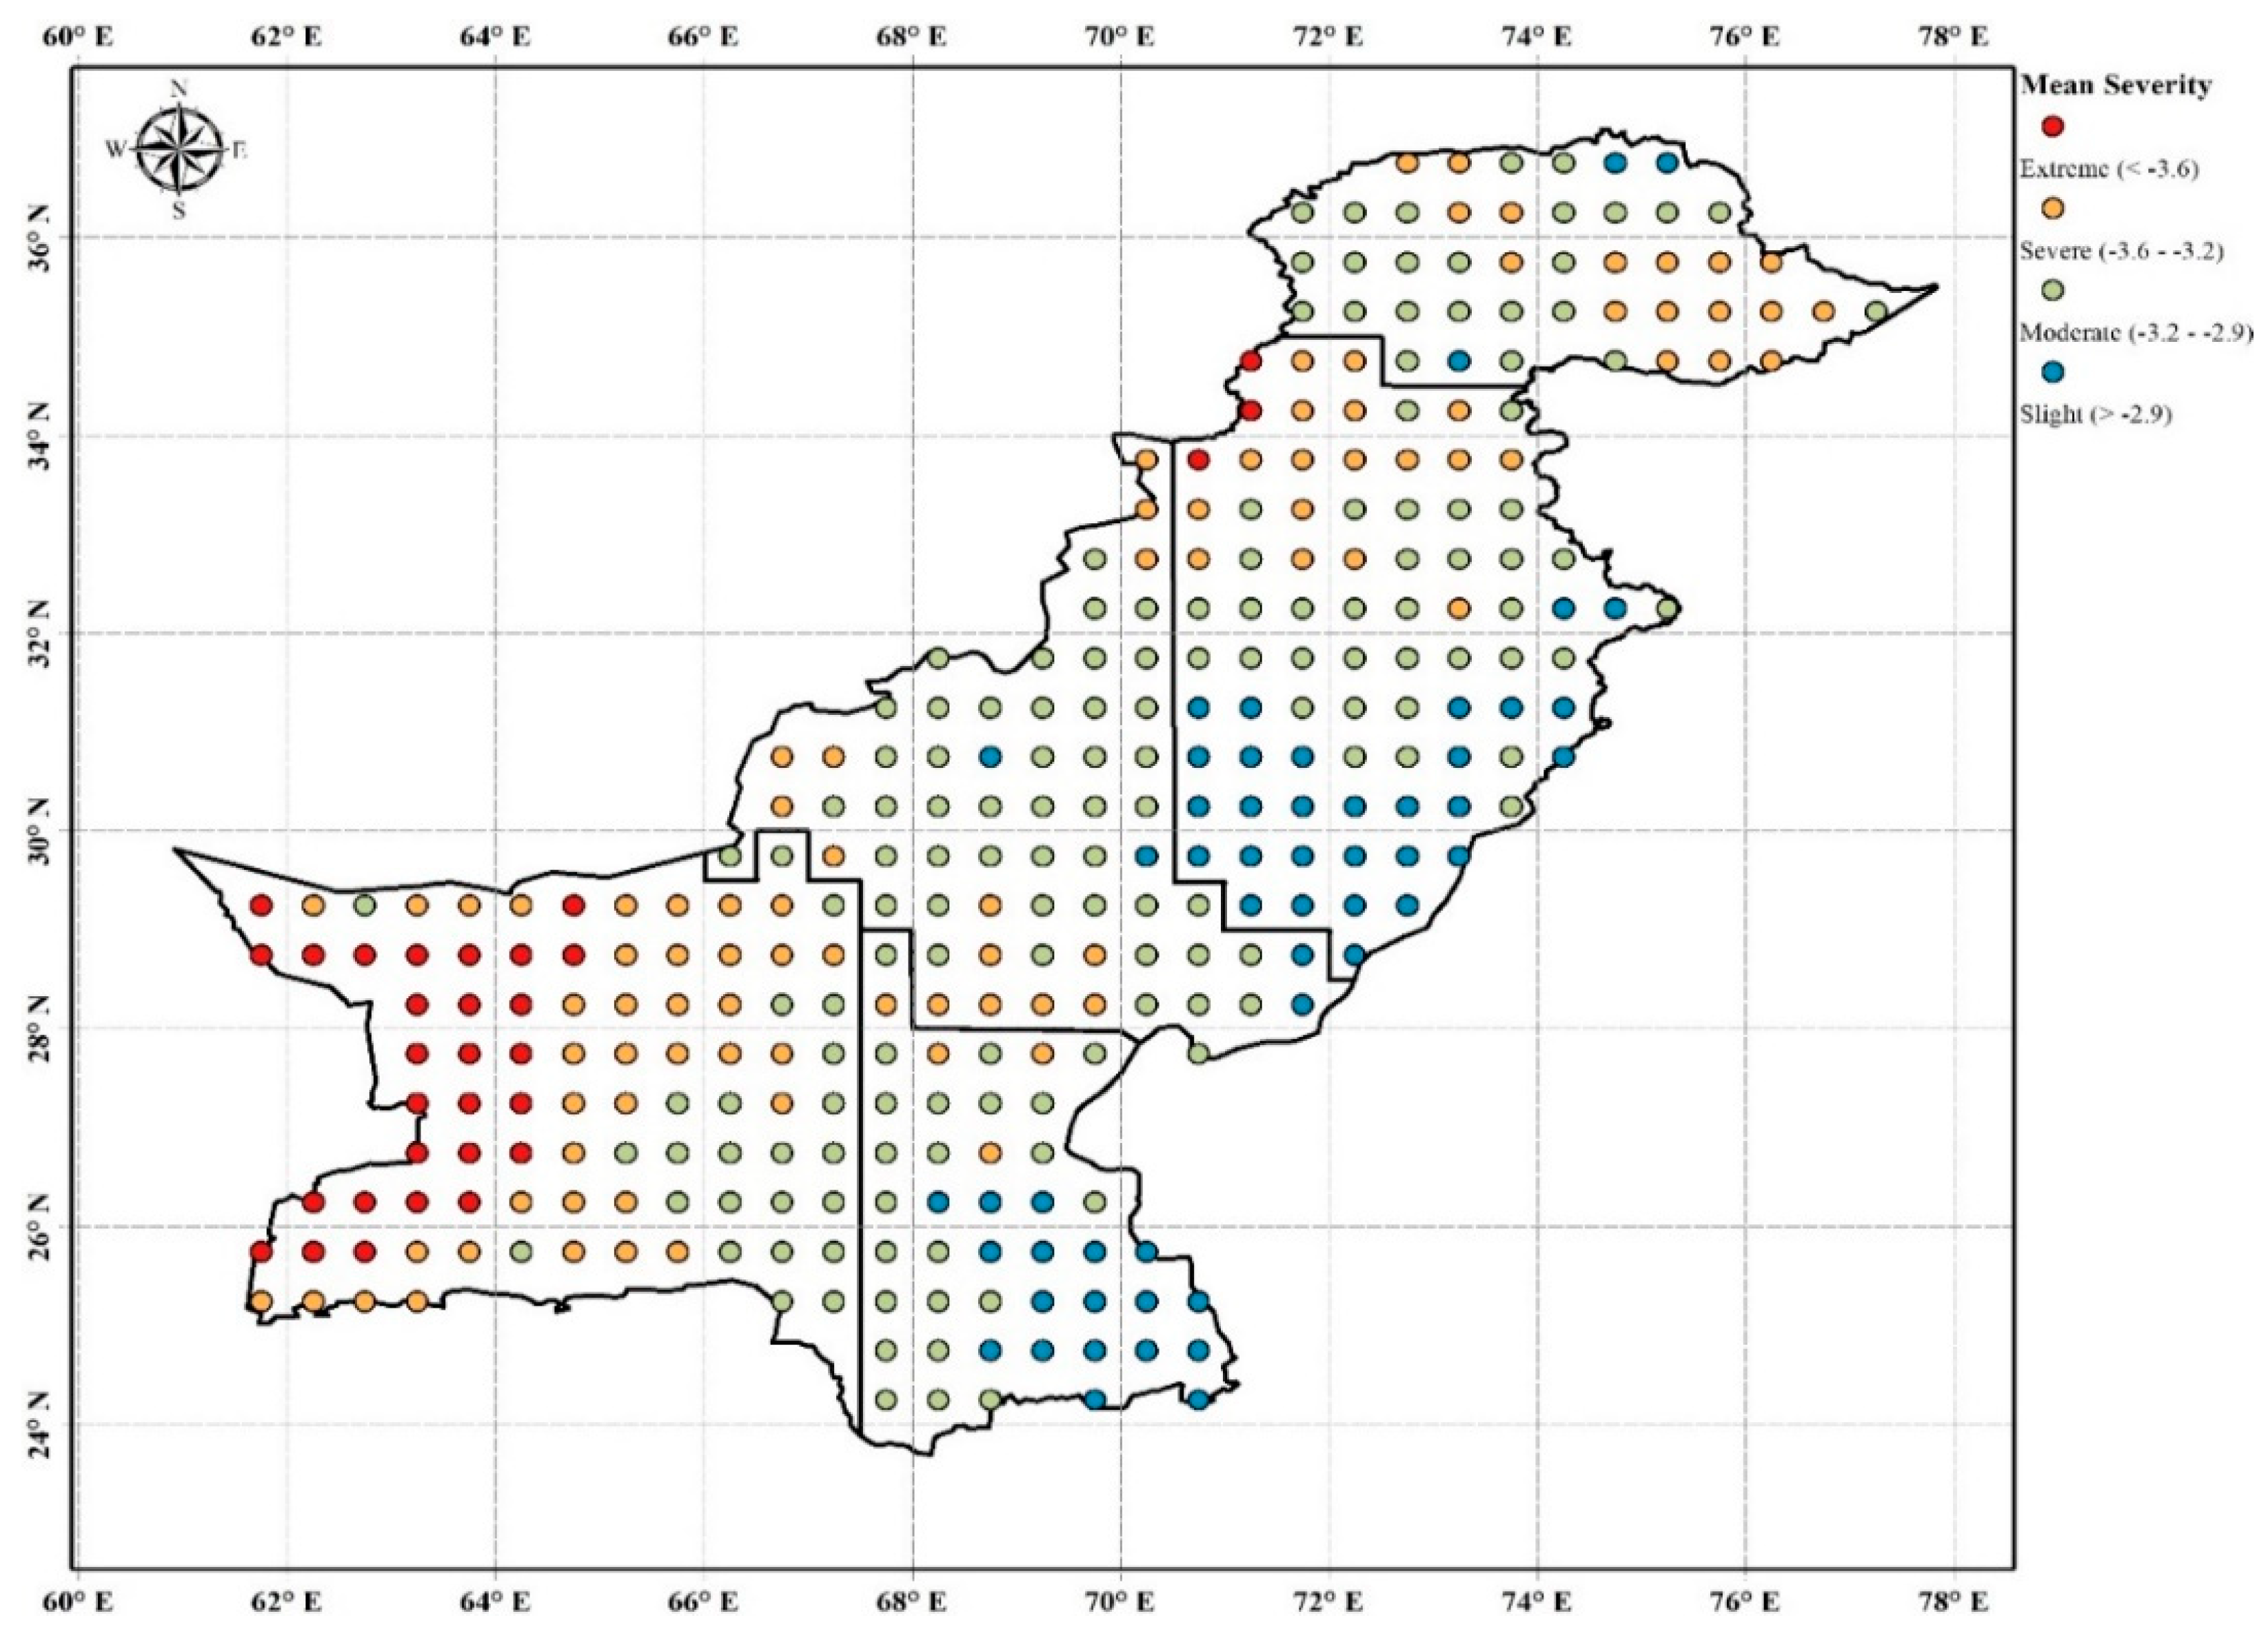
3.2. Spatial Analysis
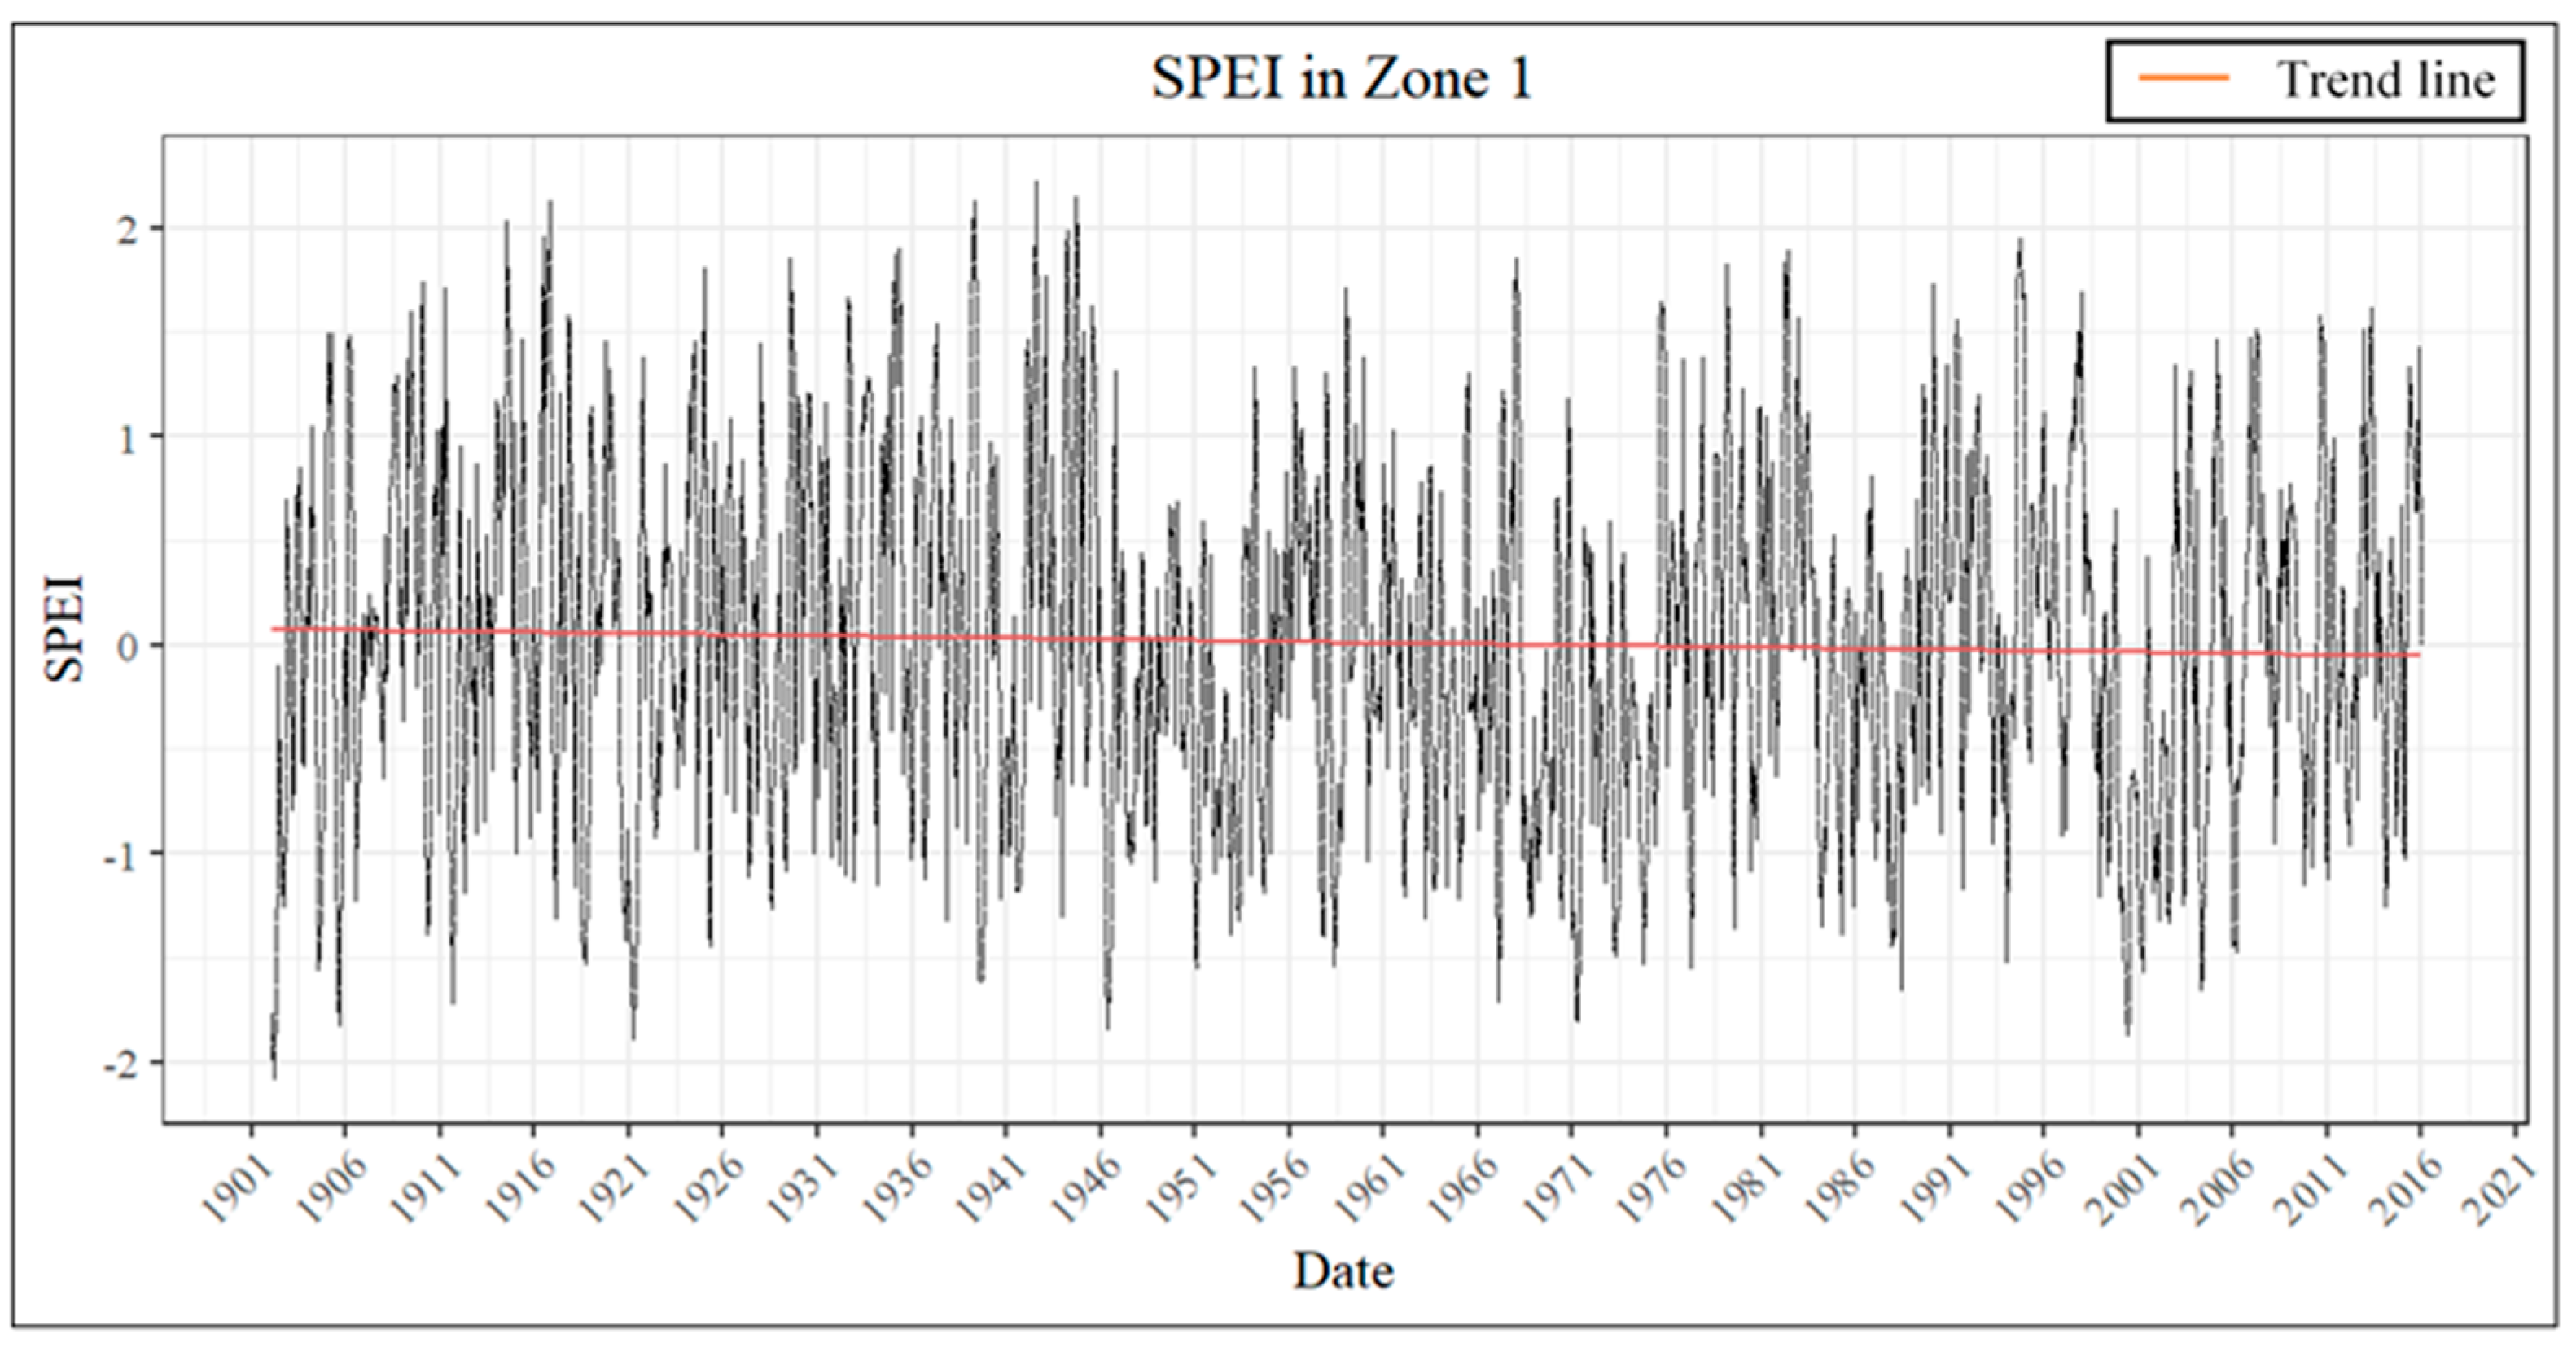
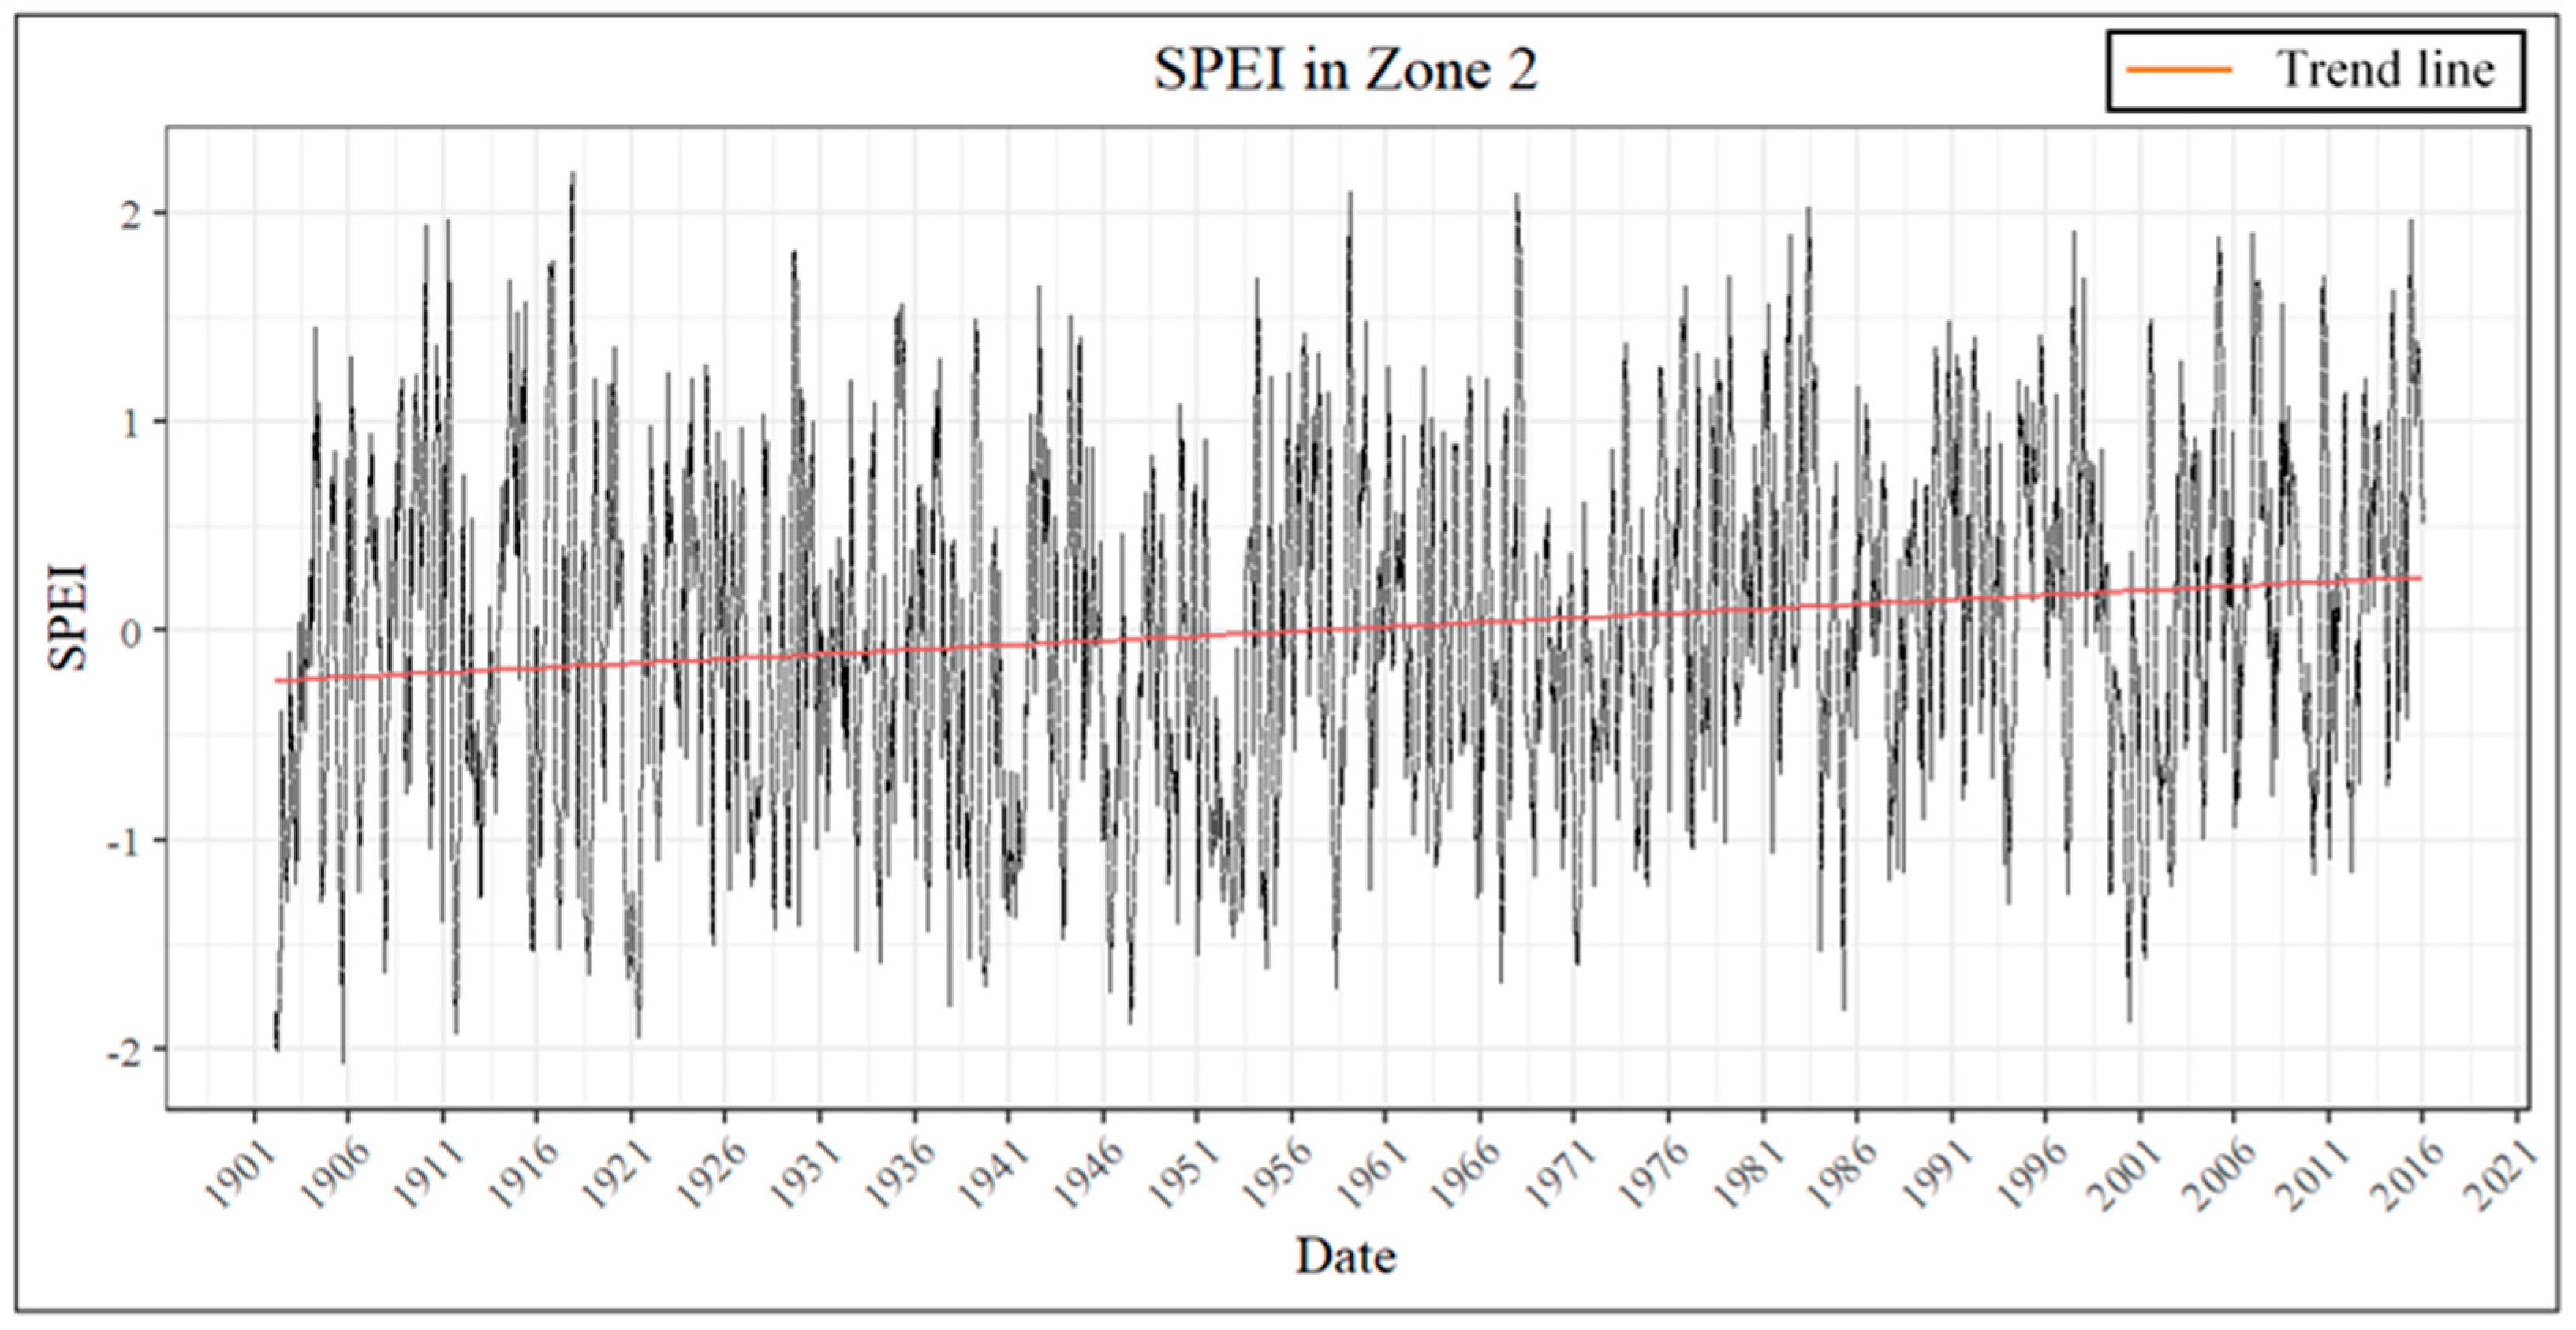
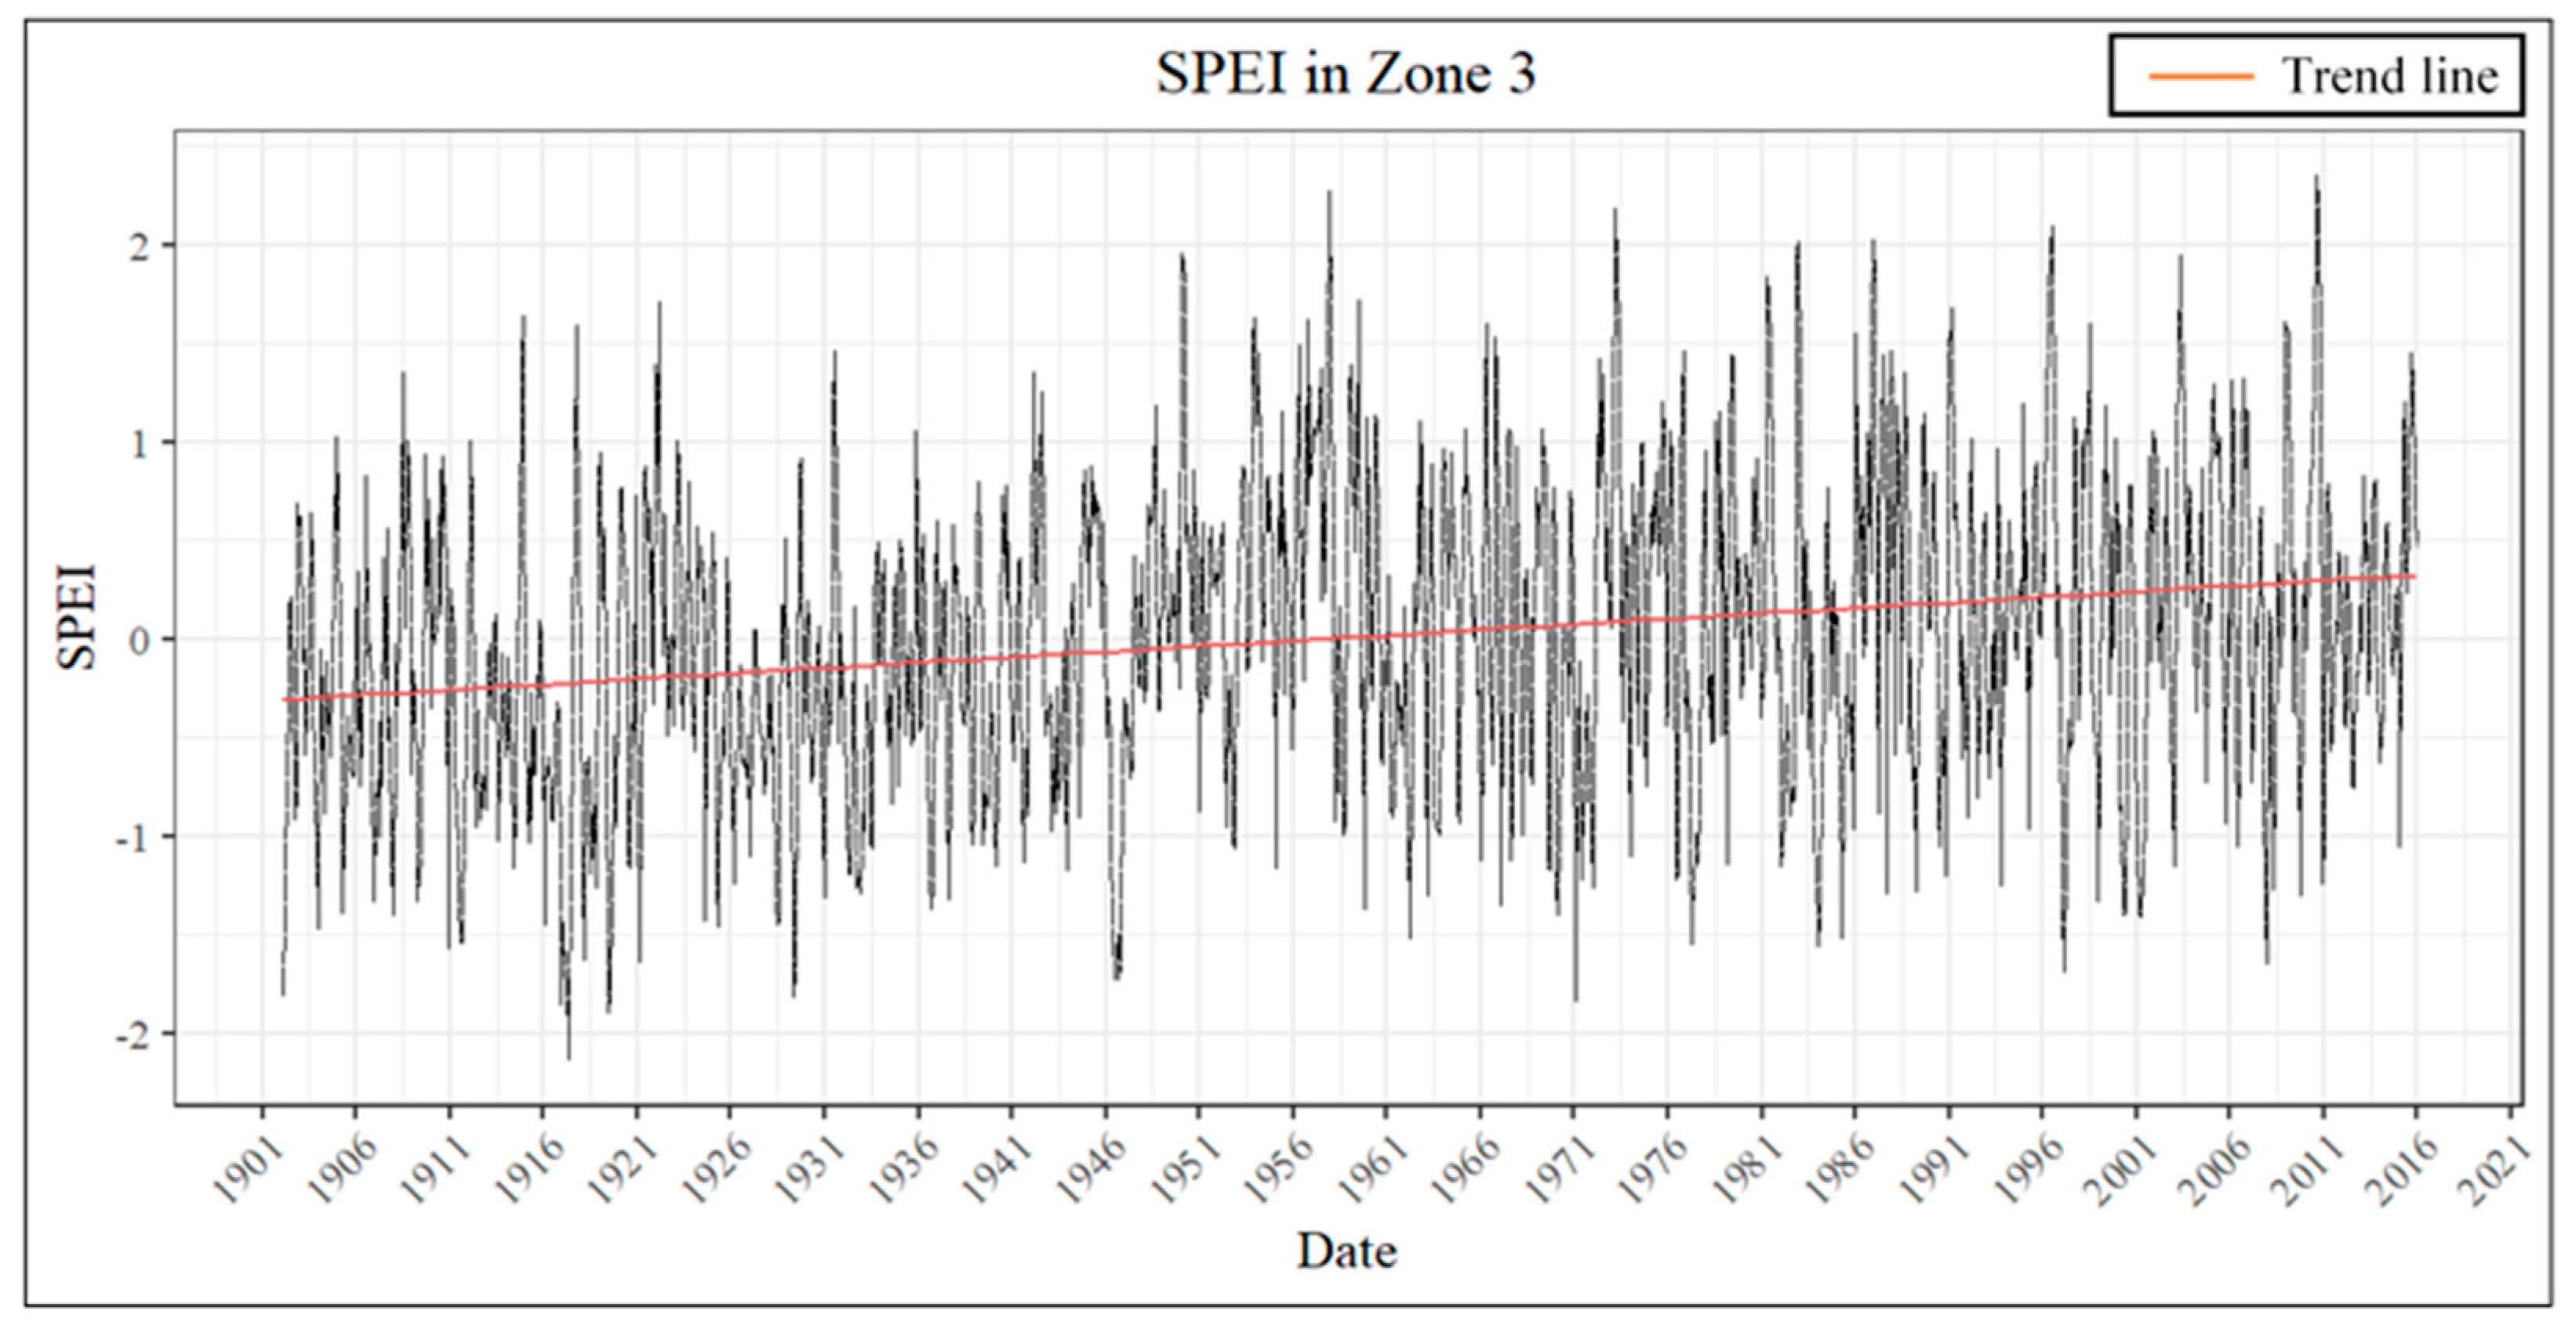
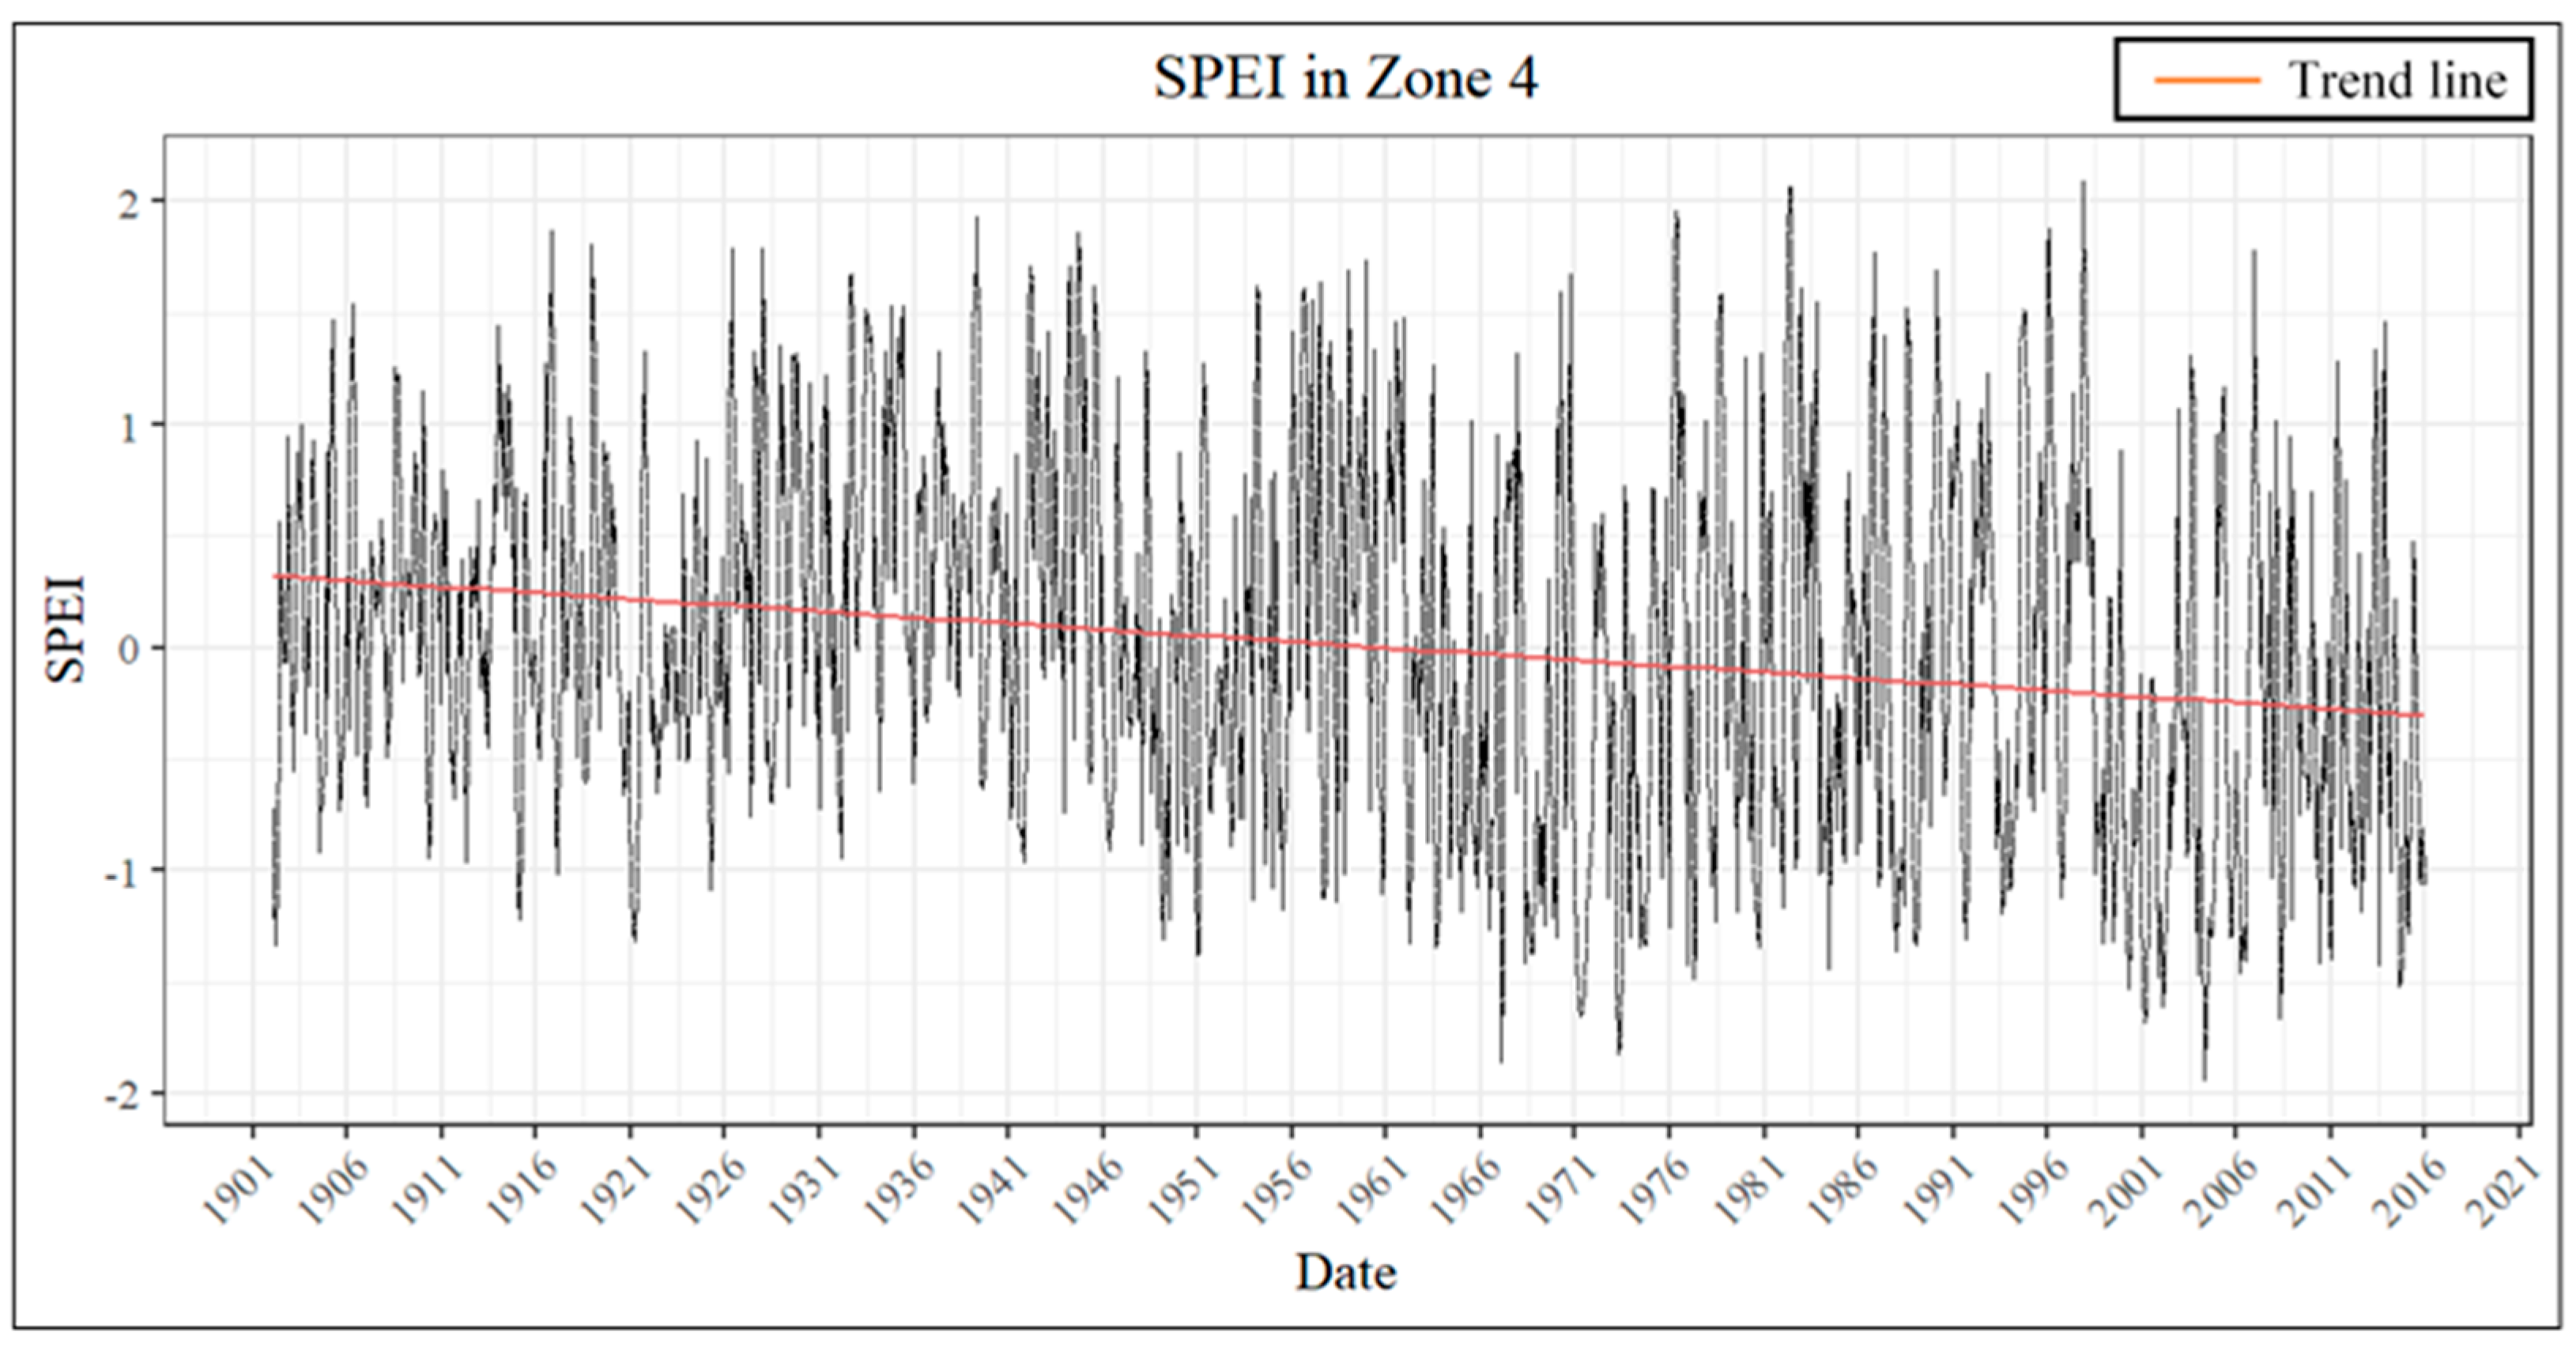
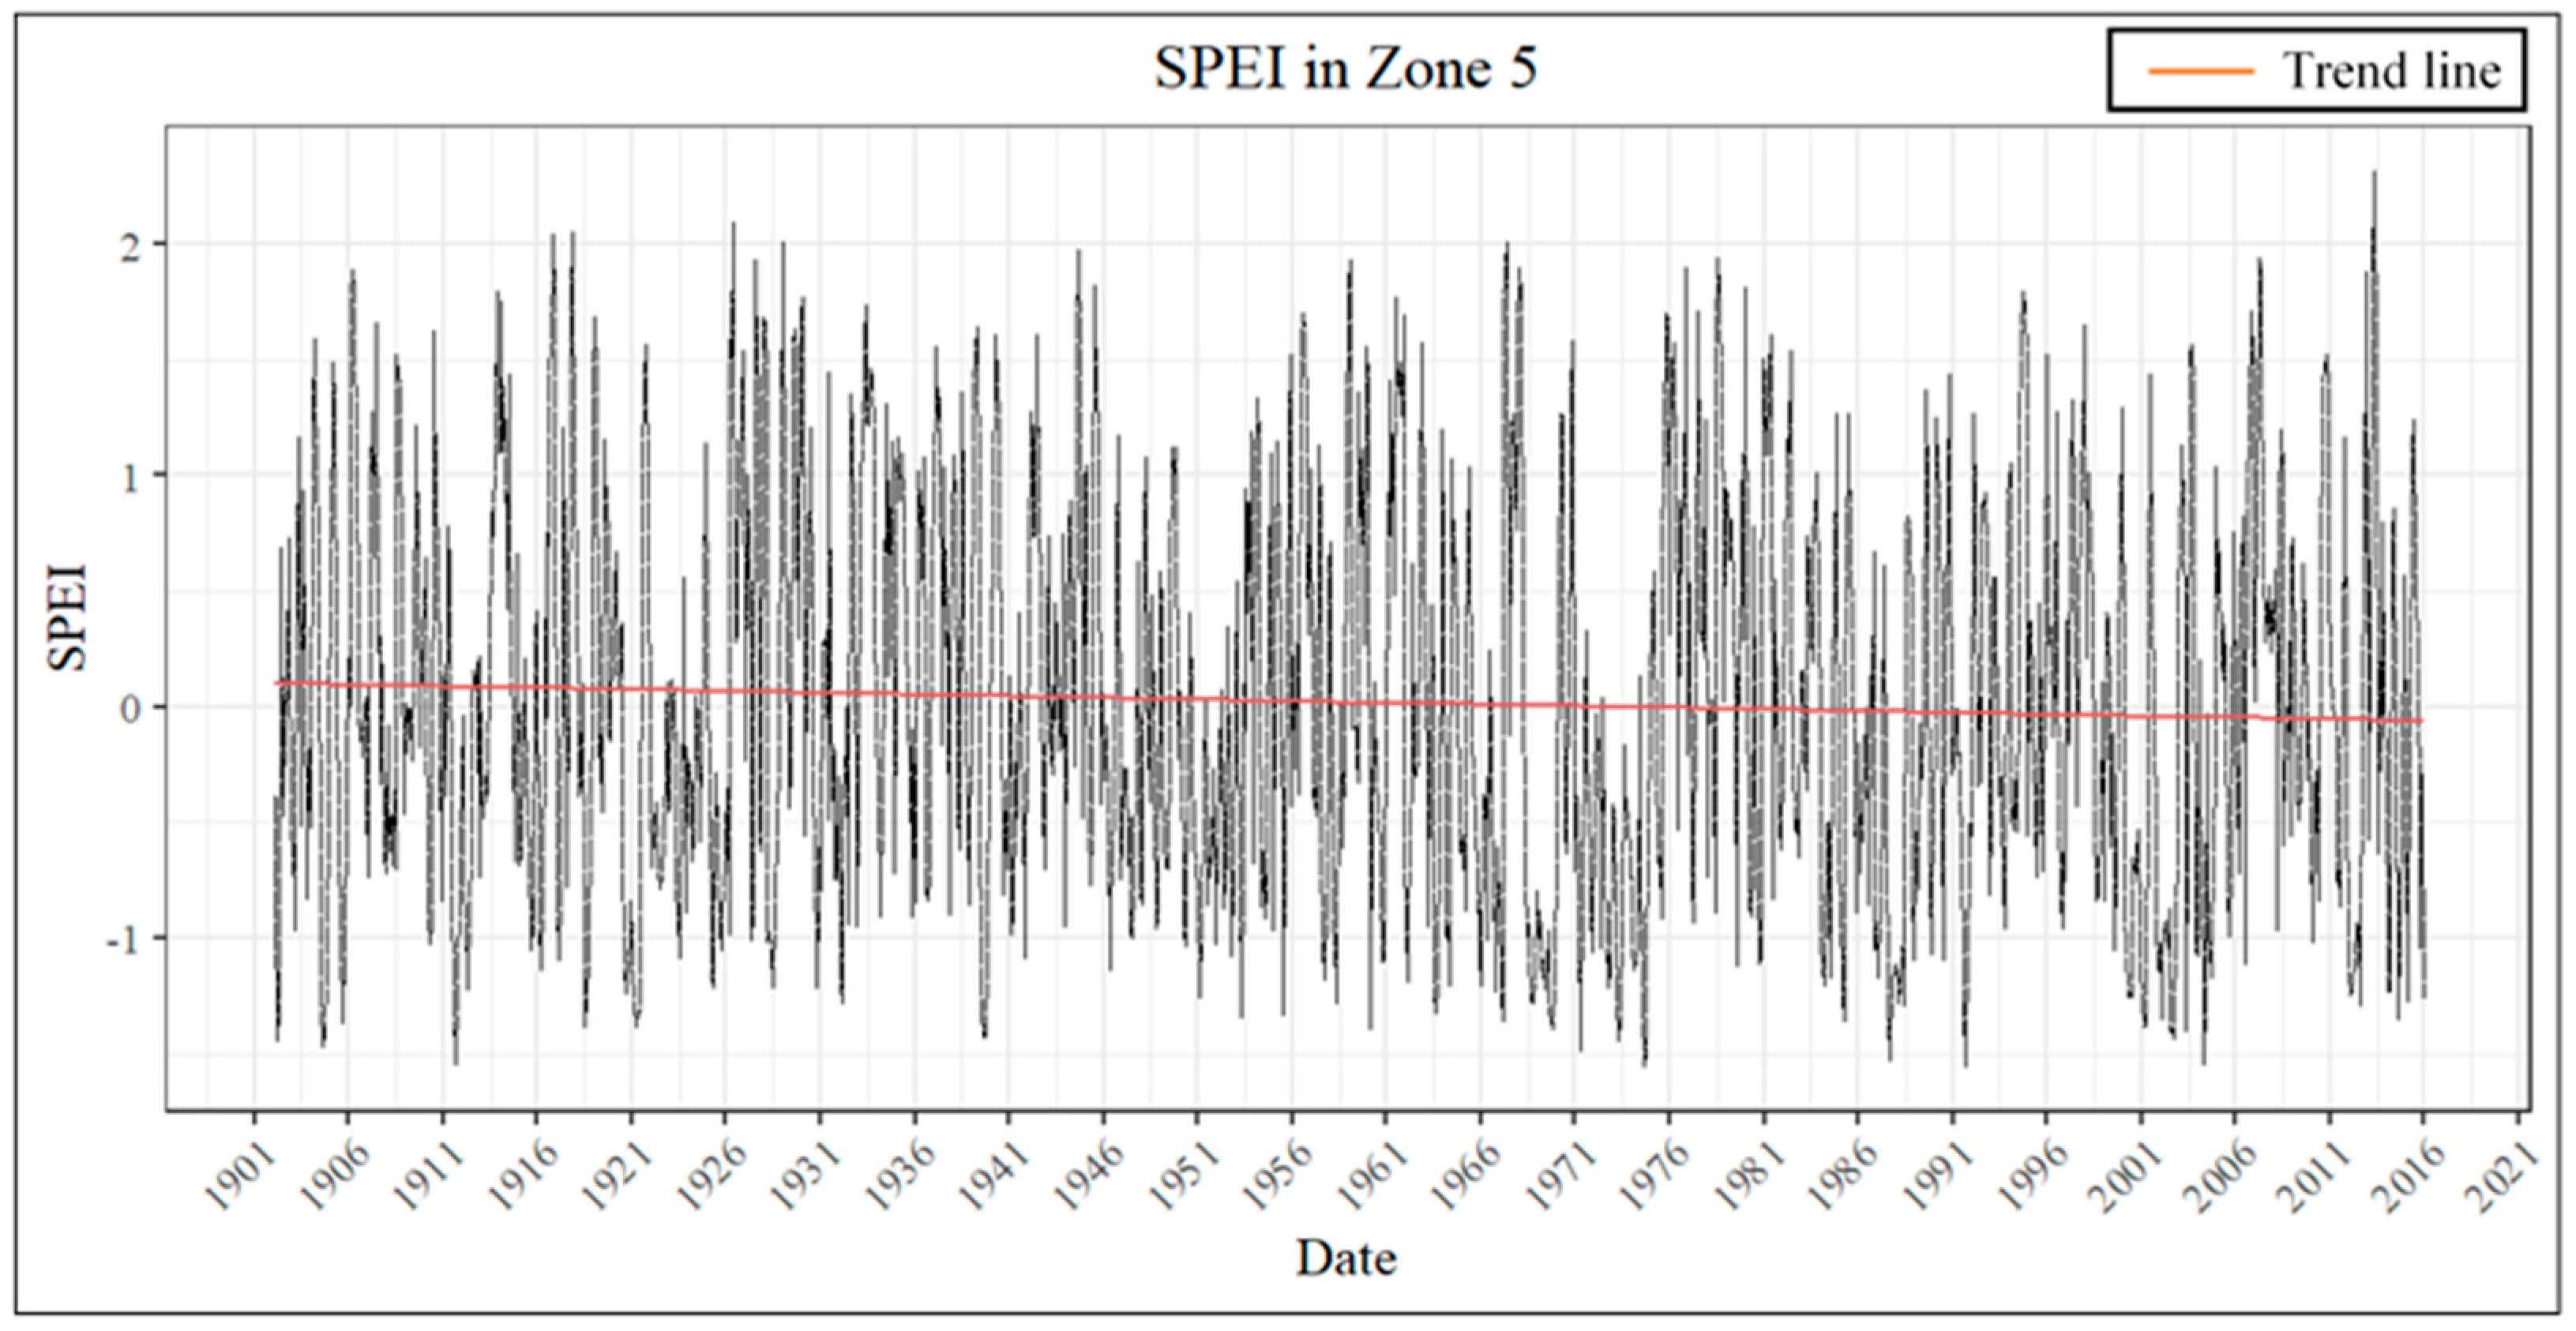
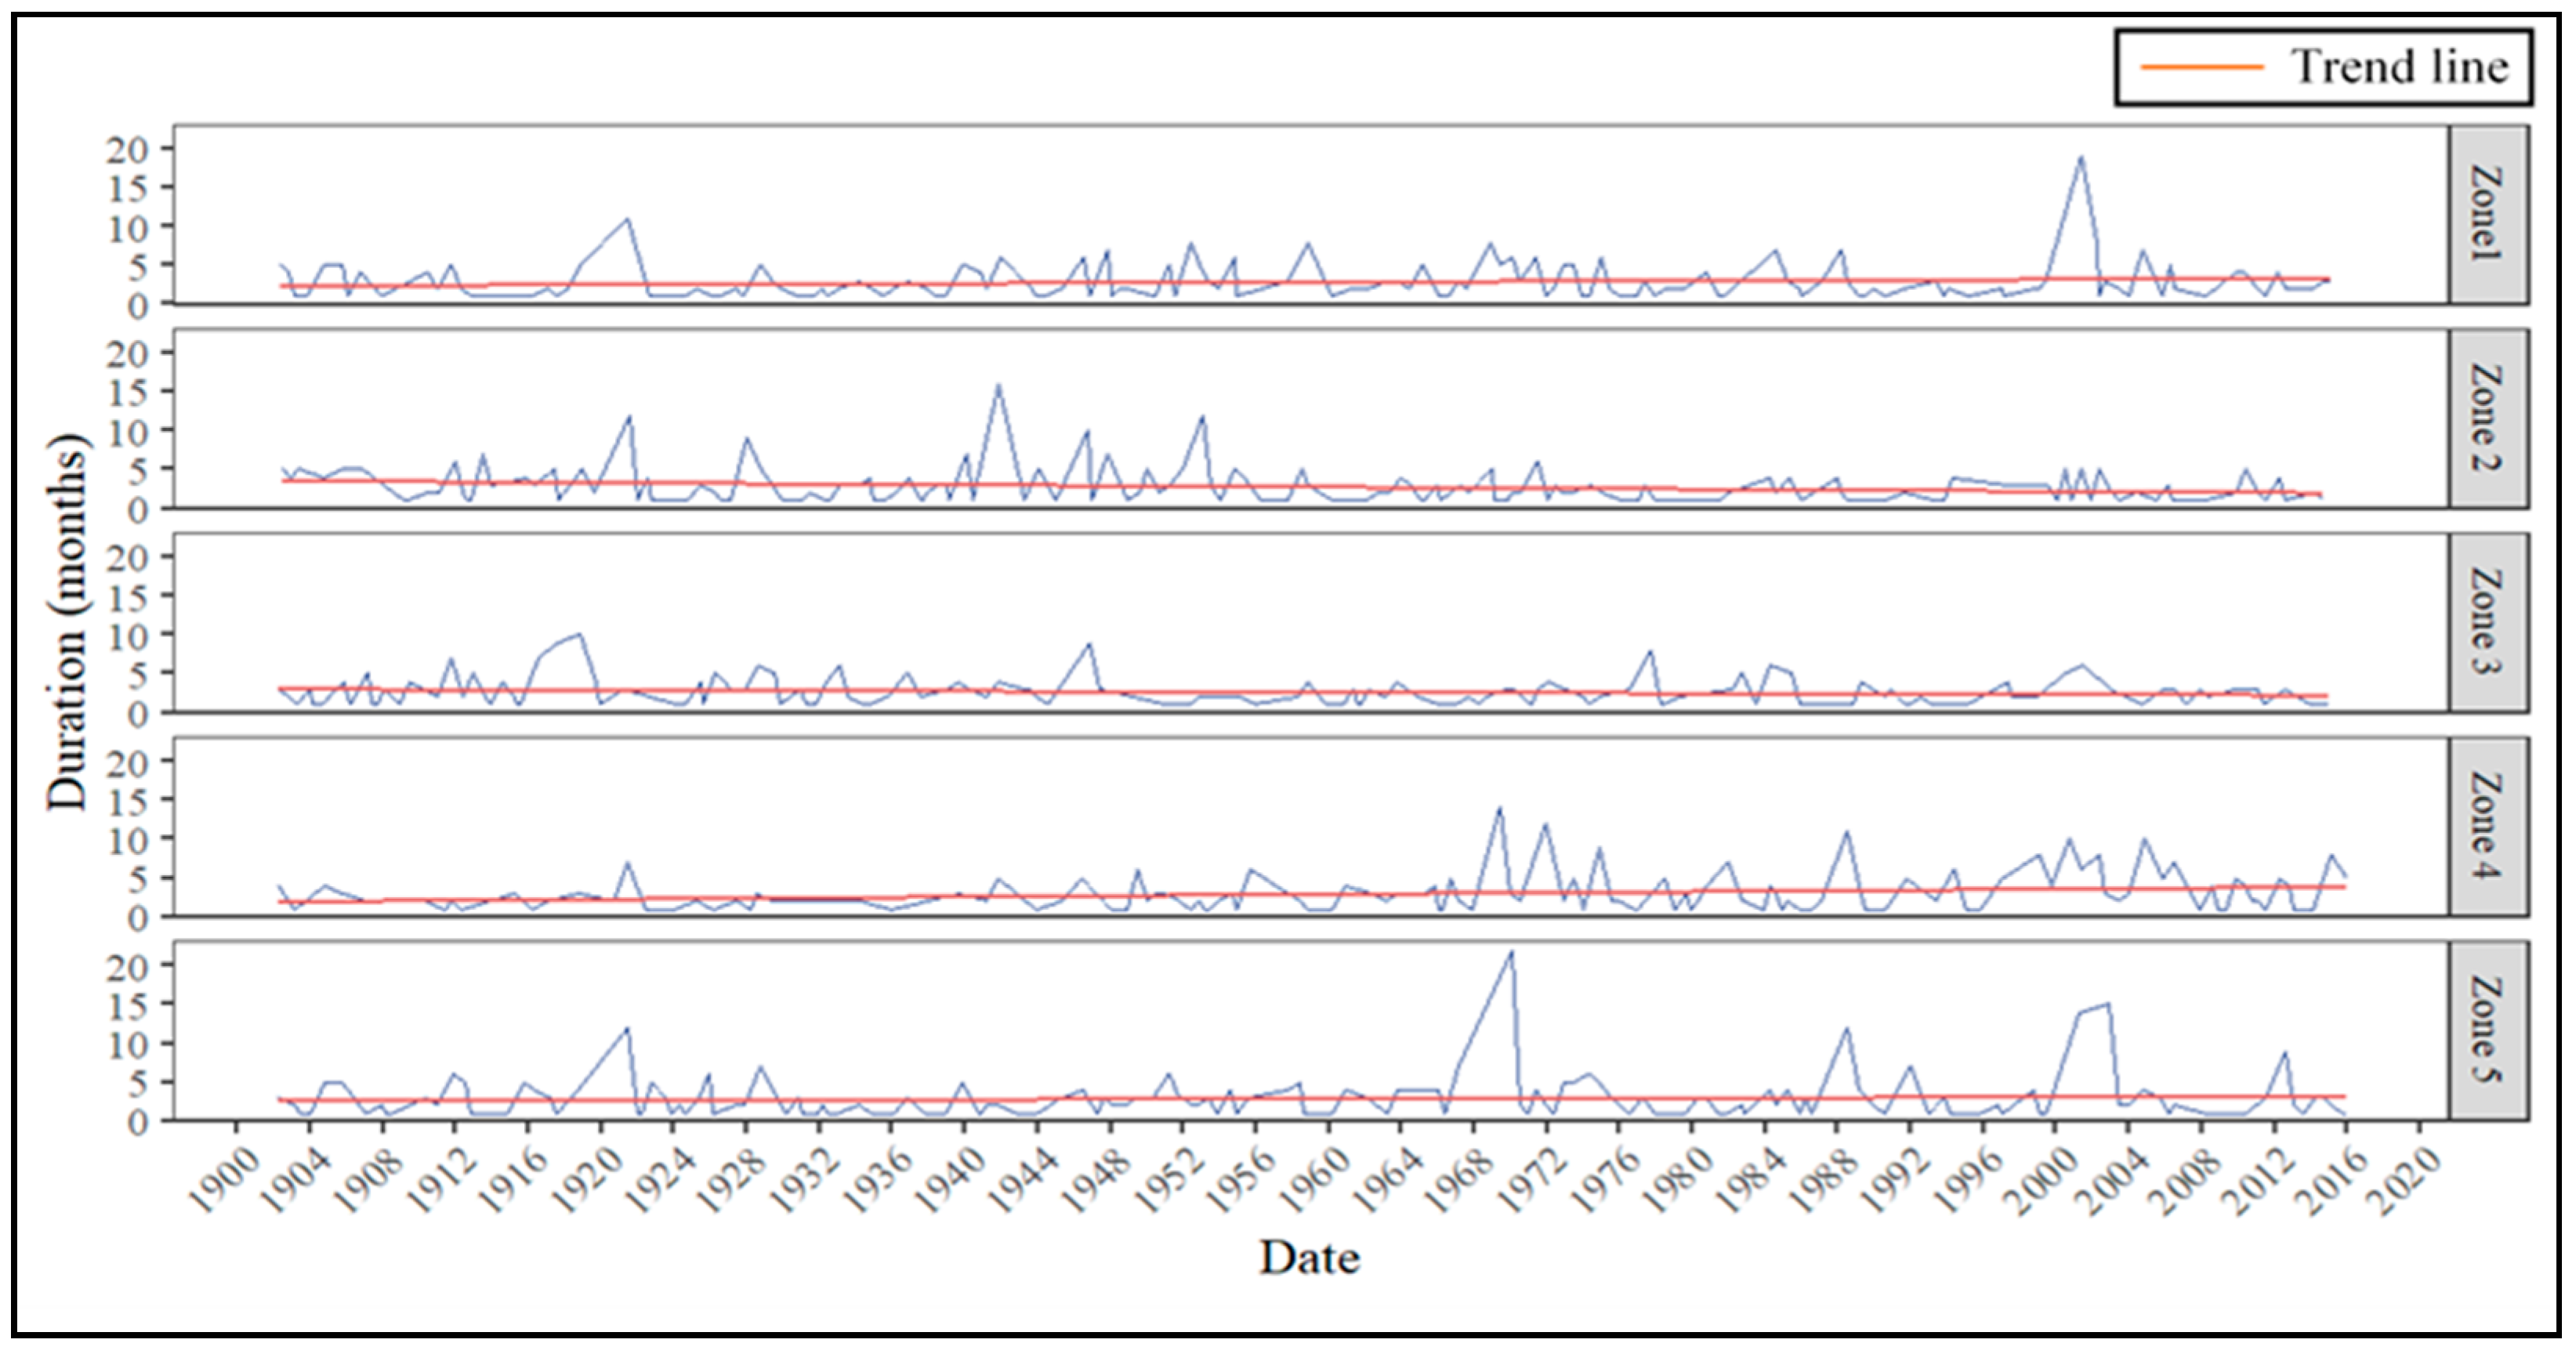
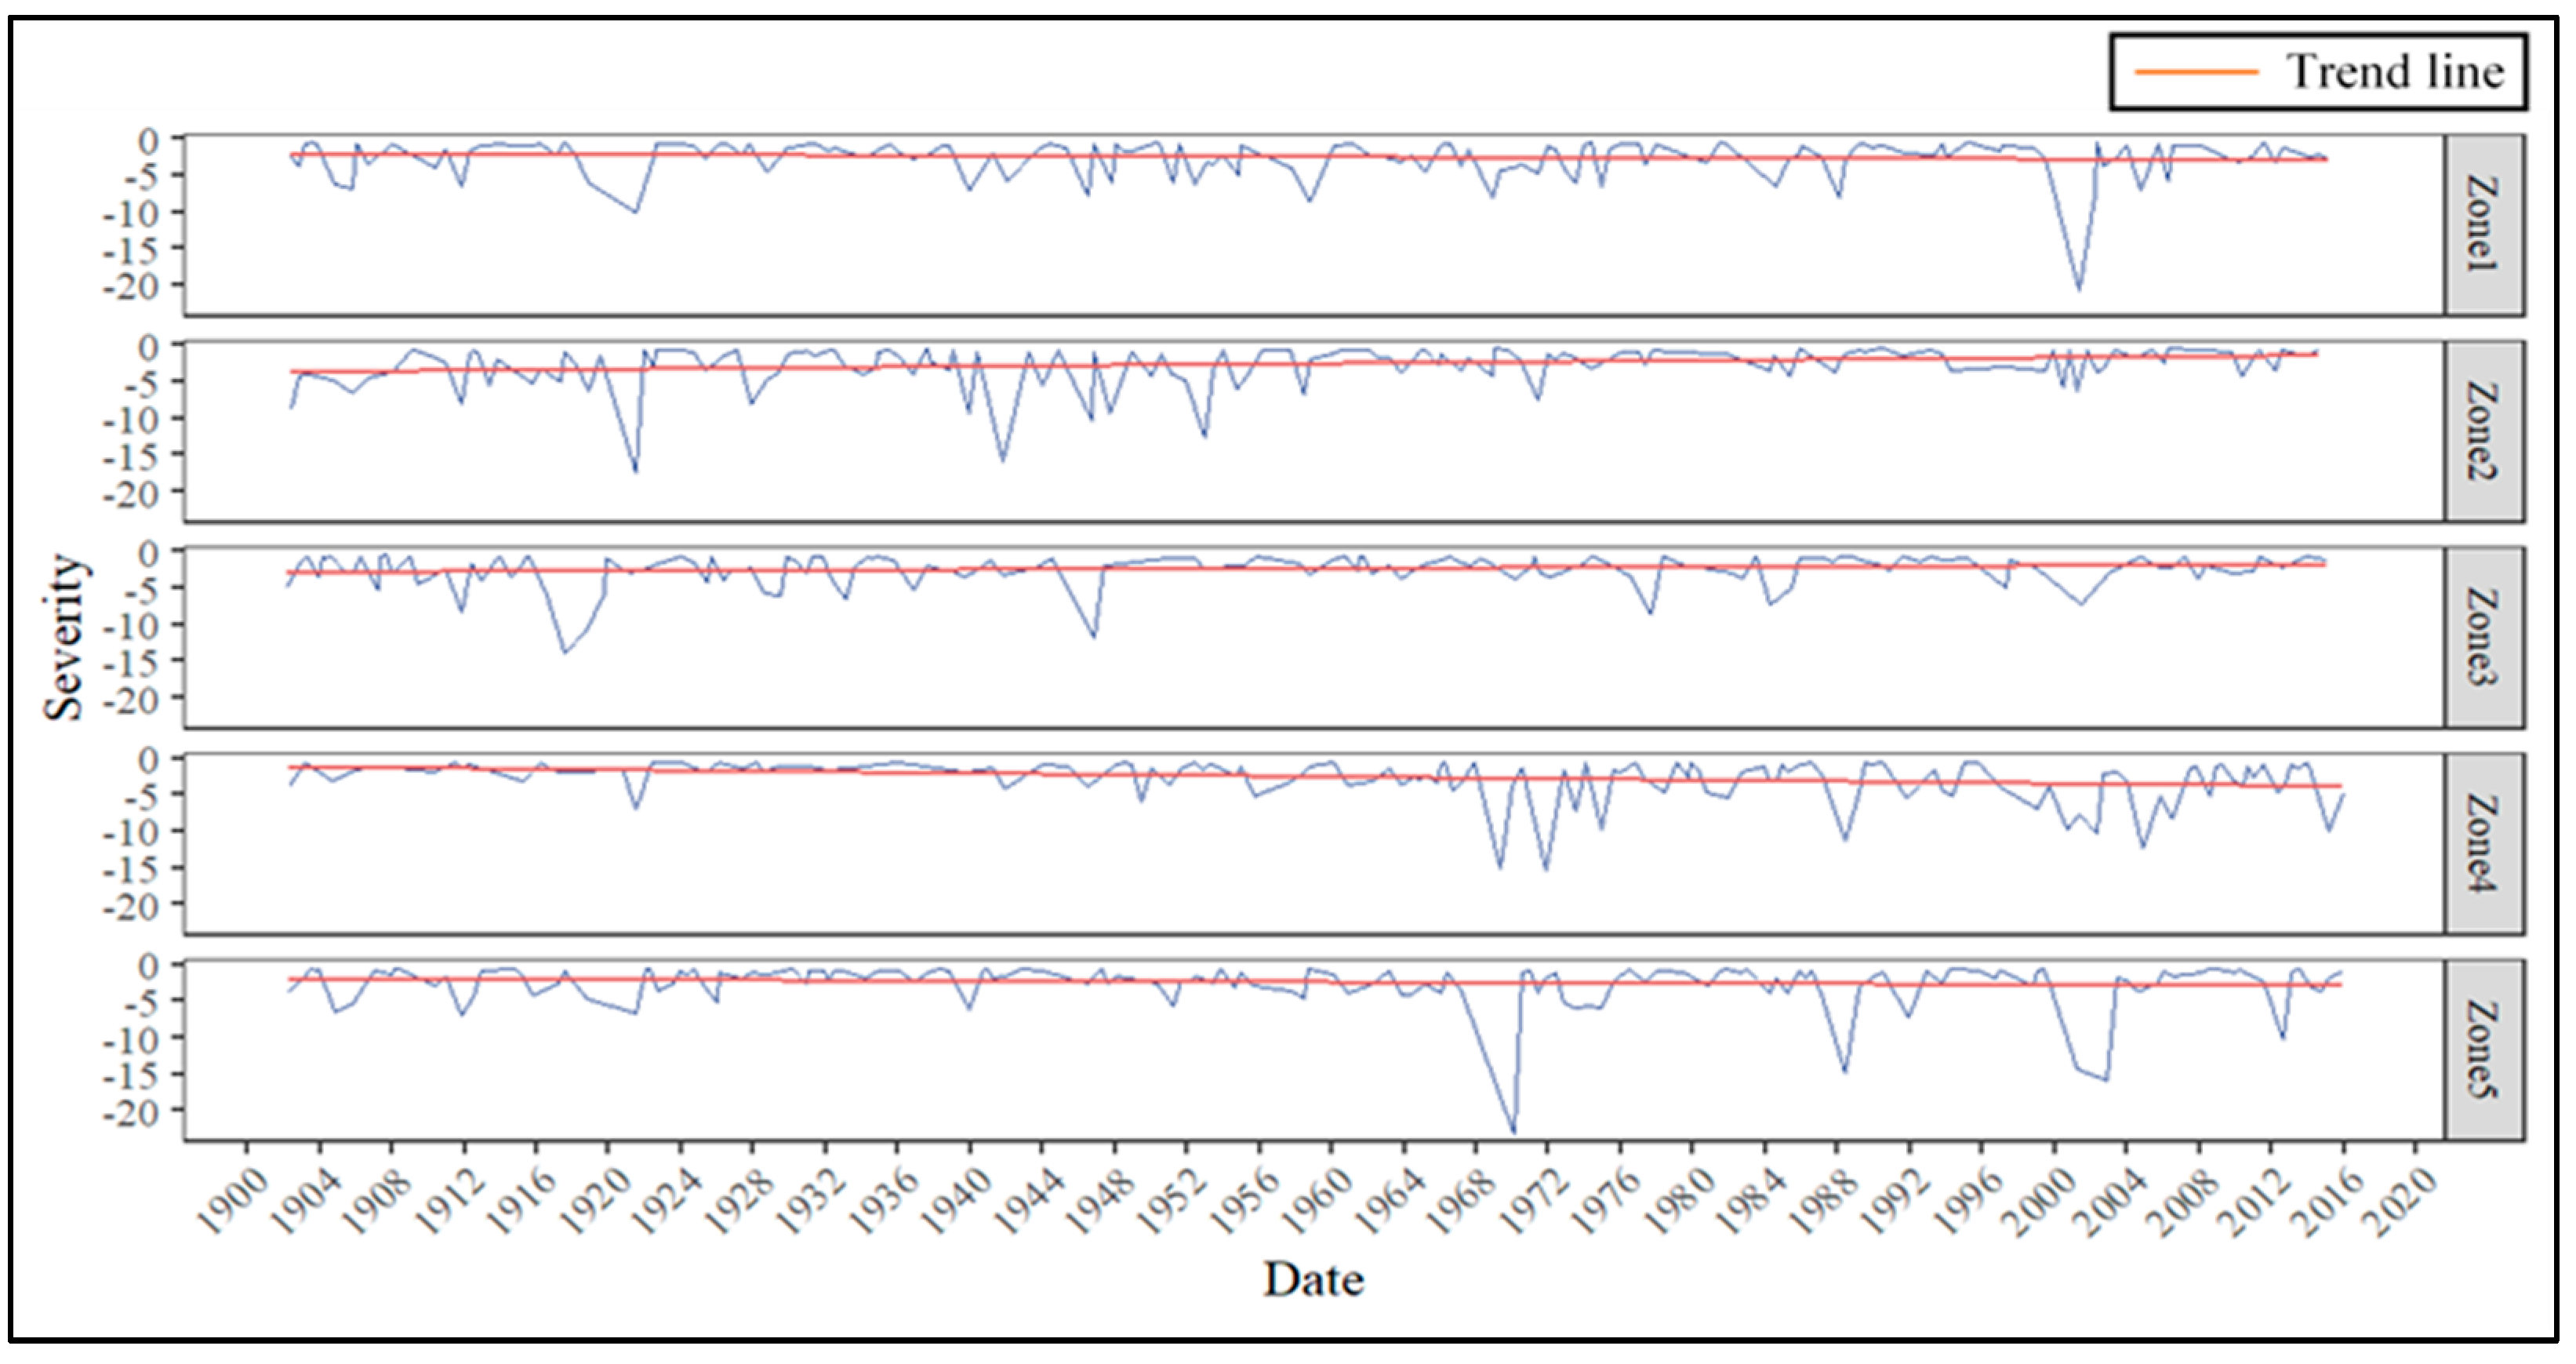
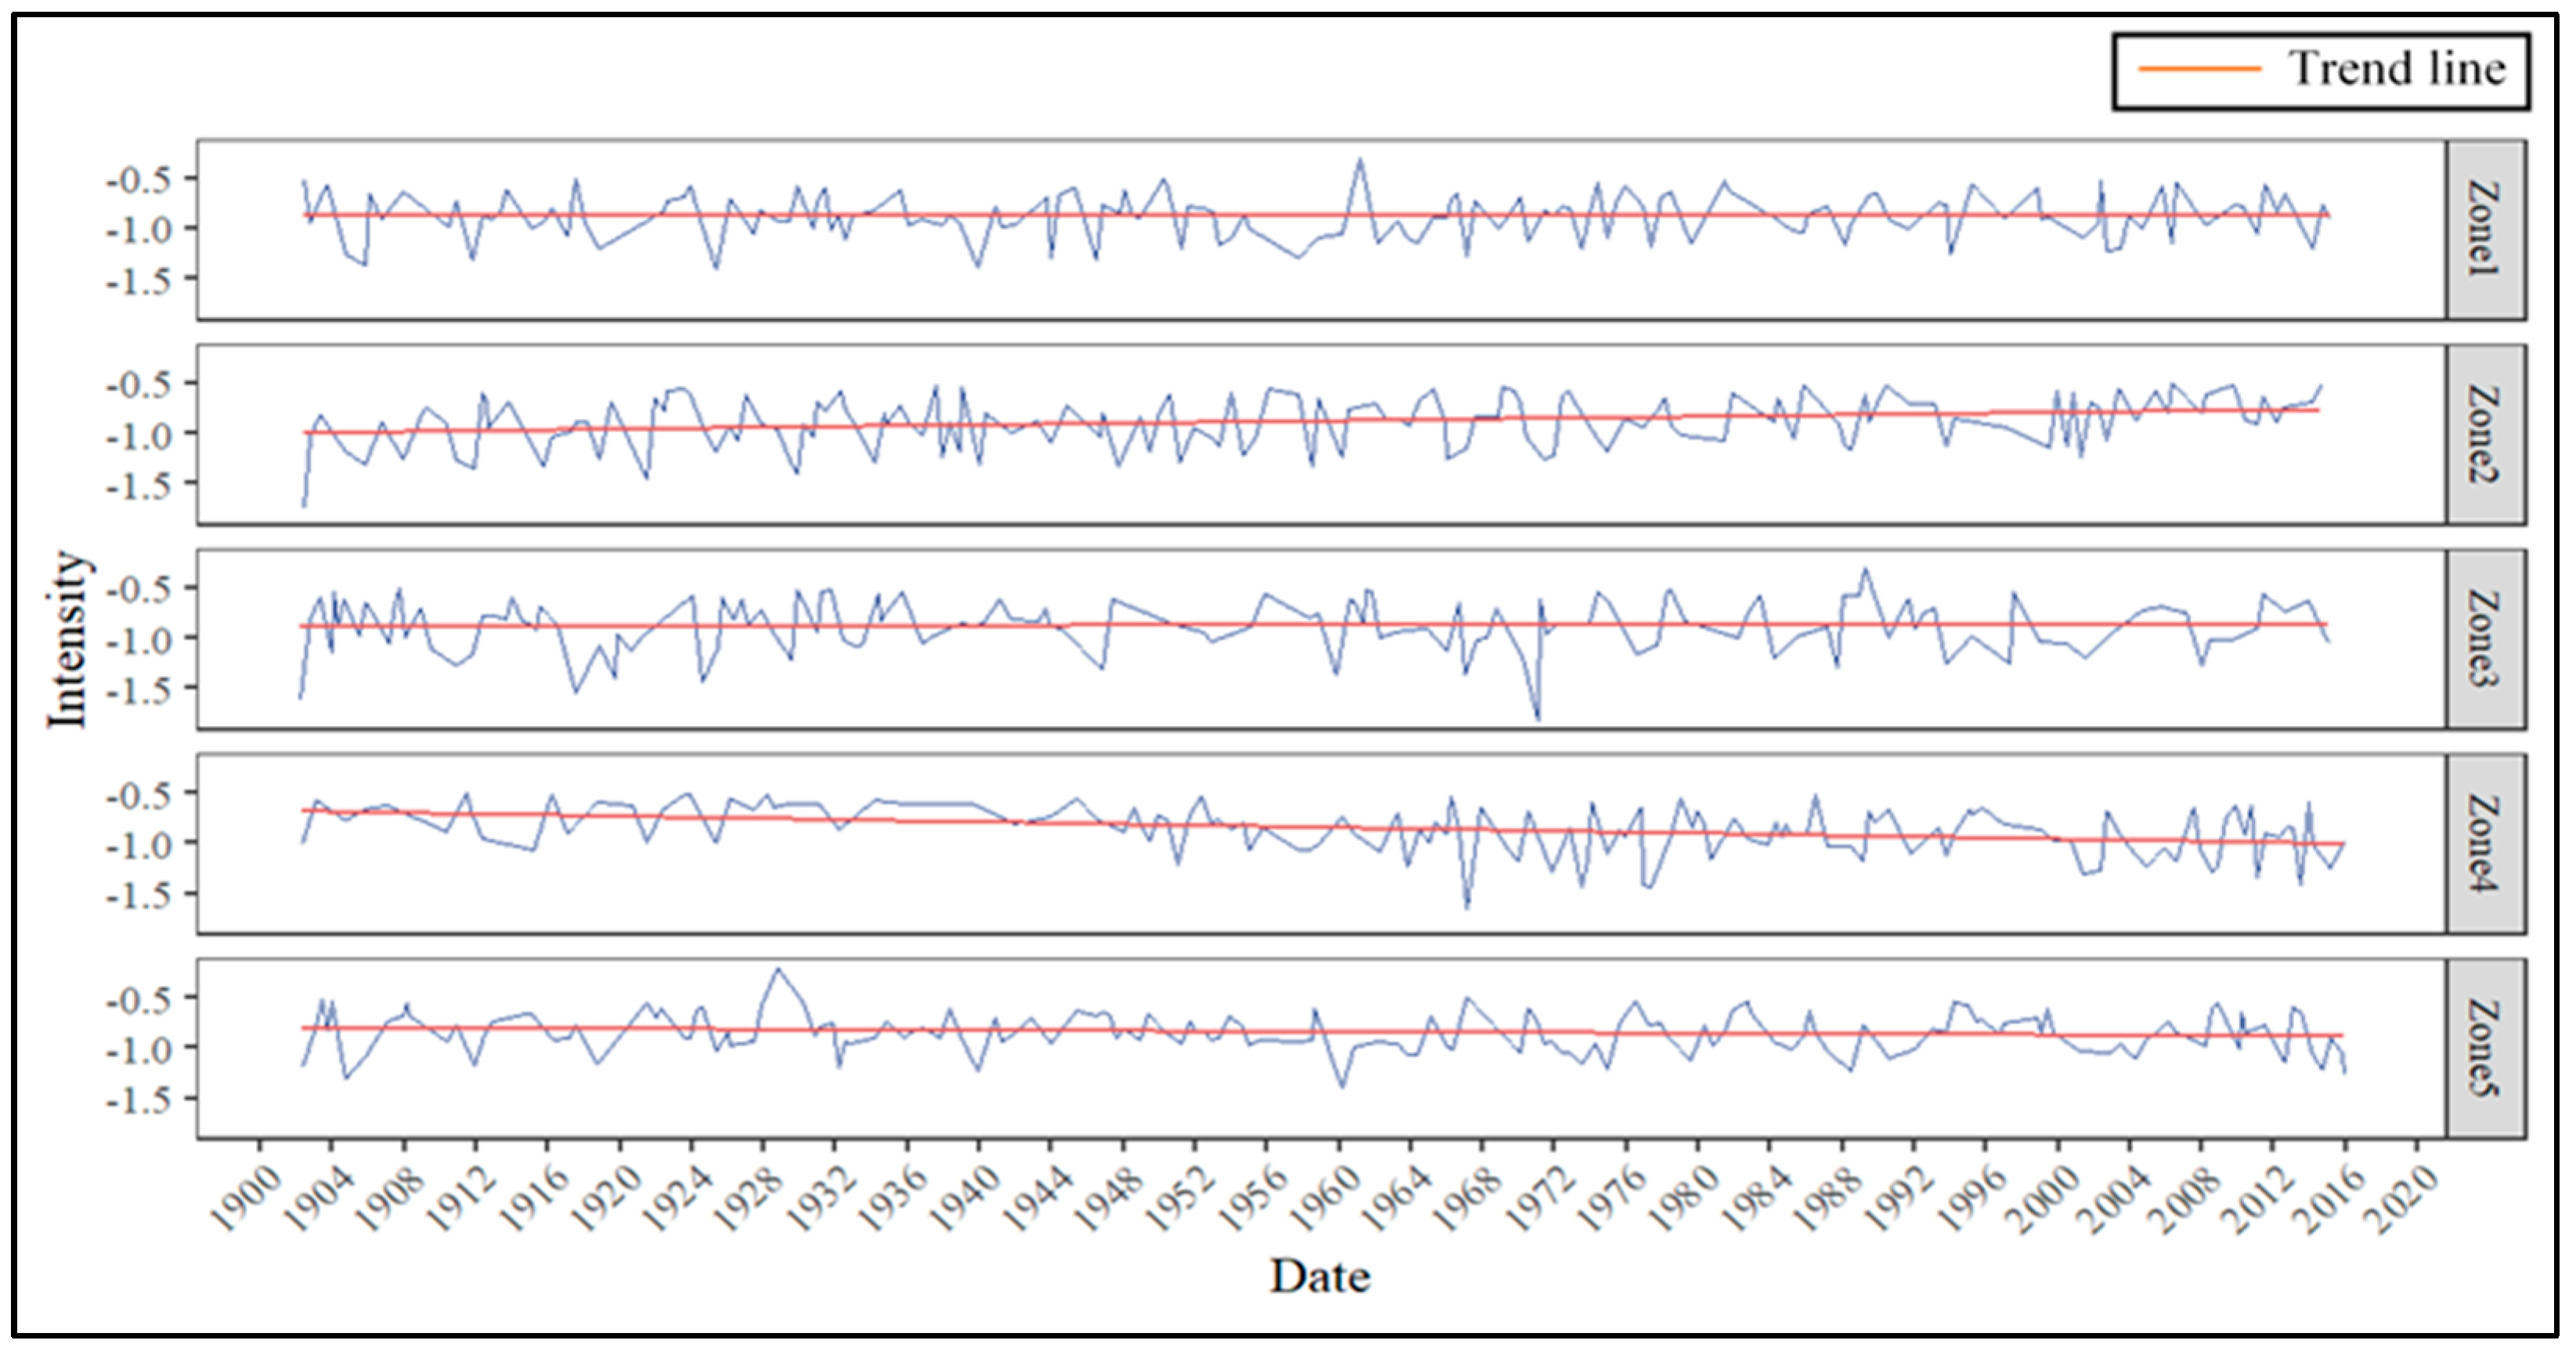
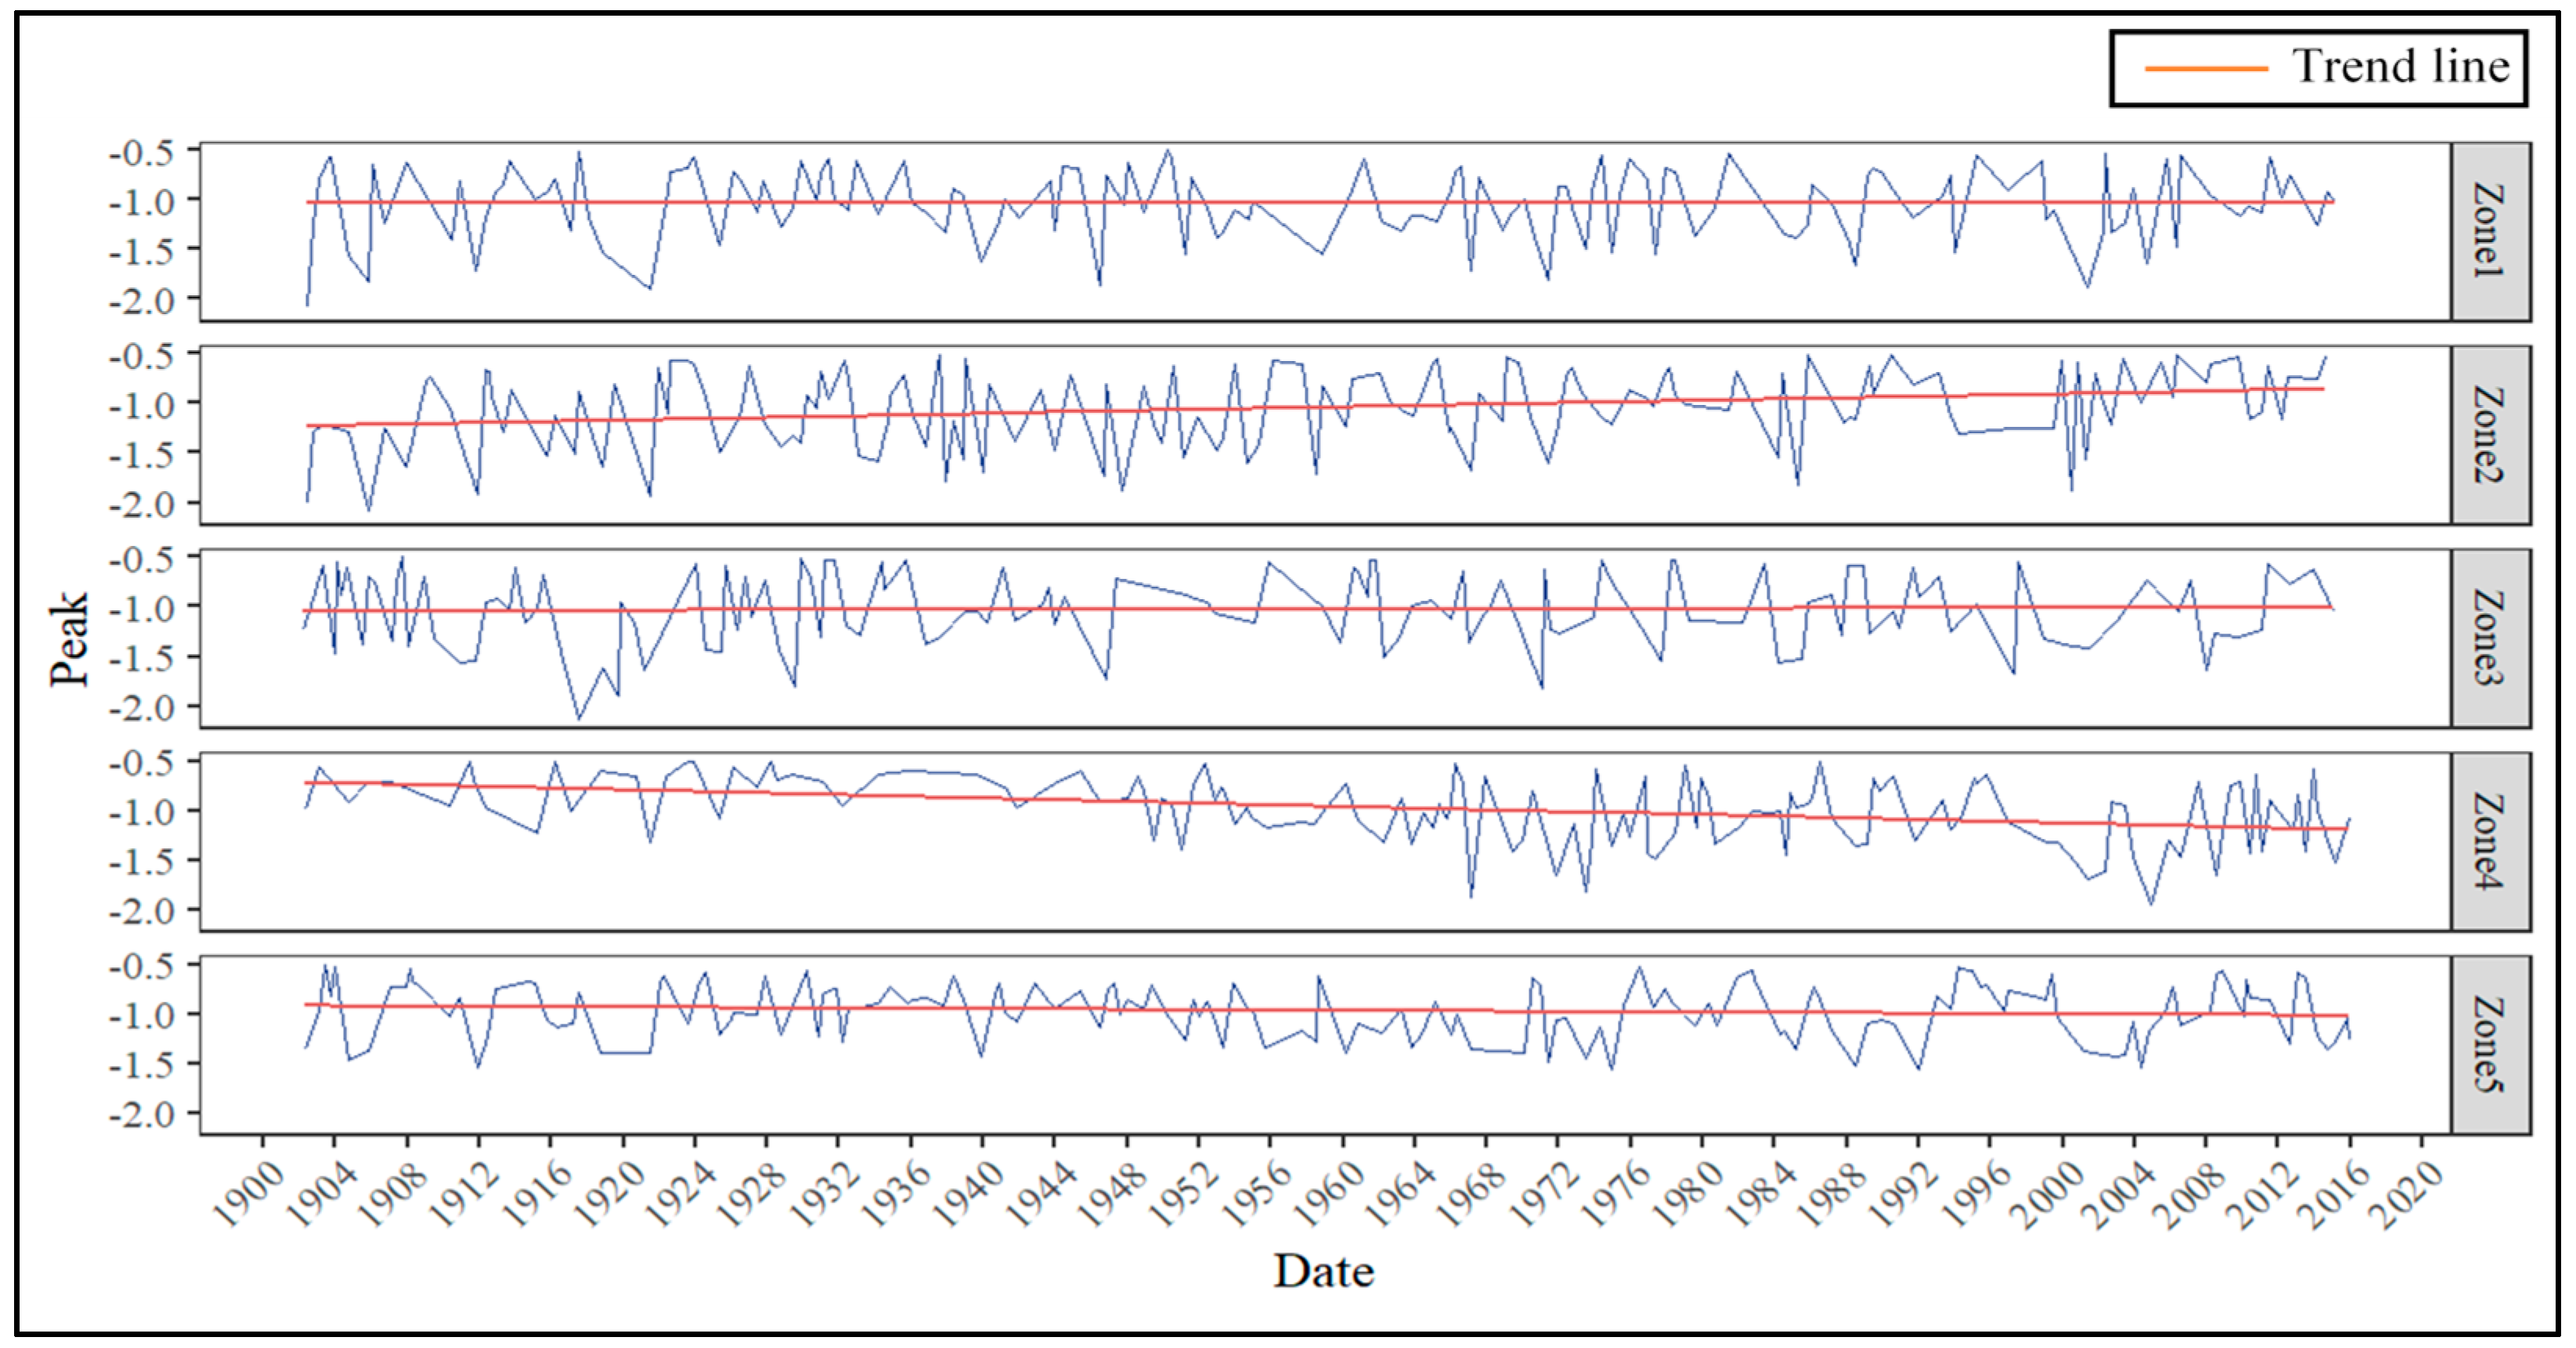
3.3. Temporal Analysis and Trend Analysis
4. Discussion
5. Conclusions
Author Contributions
Funding
Conflicts of Interest
References
- Panagoulia, D.G.; Dimou, G. Definitions and effects of droughts. Div. Water Resour. 1998, 7, 2–5. [Google Scholar]
- Anjum, S.; Saleem, M.; Cheema, M.; Bilal, M.; Khaliq, T. An assessment to vulnerability, extent, characteristics and severity of drought hazard in Pakistan. Pak. J. Sci. 2012, 64, 138–143. [Google Scholar]
- Pakistan Weather Portal History of Drought in Pakistan—In Detail. Available online: https://pakistanweatherportal.com/2011/05/08/history-of-drought-in-pakistan-in-detail/ (accessed on 19 September 2019).
- Durrani, Z.K. Lessons for Pakistan from Droughts in the Past. Available online: https://cscr.pk/explore/themes/energy-environment/lessons-pakistan-droughts-past/ (accessed on 20 July 2018).
- Sheikh, M.M. Drought management and prevention in Pakistan. Sci. Vis. 2001, 7, 117–131. [Google Scholar]
- Edossa, D.C.; Woyessa, Y.E.; Welderufael, W.A. Spatiotemporal analysis of droughts using self-calibrating Palmer’s Drought Severity Index in the central region of South Africa. Theor. Appl. Climatol. 2016, 126, 643–657. [Google Scholar] [CrossRef]
- Palmer, W.C. Meteorologic Drought; U.S. Dep. Commer. Weather. Res. Paper No. 45; Weather Bureau: Washington, DC, USA, 1965; p. 58.
- Gocic, M.; Trajkovic, S. Spatiotemporal characteristics of drought in Serbia. J. Hydrol. 2014, 510, 110–123. [Google Scholar] [CrossRef]
- Thomas, M.B.; Nolan, D.J.; John, K. The Relationship of Drought Frequency and Duration to Time Scales. In Proceedings of the 8th Conference on Applied Climatology; American Meteorological Society: Boston, MA, USA, 1993; Volume 17. [Google Scholar]
- Dabanlı, İ.; Mishra, A.K.; Şen, Z. Long-term spatio-temporal drought variability in Turkey. J. Hydrol. 2017, 552, 779–792. [Google Scholar] [CrossRef]
- Ashraf, M.; Routray, J.K. Spatio-temporal characteristics of precipitation and drought in Balochistan Province, Pakistan. Nat. Hazards 2015, 77, 229–254. [Google Scholar] [CrossRef]
- Haroon, M.A.; Zhang, J.; Yao, F. Drought monitoring and performance evaluation of MODIS-based drought severity index (DSI) over Pakistan. Nat. Hazards 2016, 84, 1349–1366. [Google Scholar] [CrossRef]
- Xie, H.; Ringler, C.; Zhu, T.; Waqas, A. Droughts in Pakistan: A spatiotemporal variability analysis using the Standardized Precipitation Index. Water Food Secur. Chall. Pak. 2016, 38, 116–127. [Google Scholar] [CrossRef]
- Guttman, N.B. Comparing the Palmer Drought Index and the Standardized Precipitation Index. J. Am. Water Resour. Assoc. 1998, 34, 113–121. [Google Scholar] [CrossRef]
- Zhang, X.; Zwiers, F.W.; Hegerl, G.C.; Lambert, F.H.; Gillett, N.P.; Solomon, S.; Stott, P.A.; Nozawa, T. Detection of human influence on twentieth-century precipitation trends. Nature 2007, 448, 461–465. [Google Scholar] [CrossRef] [PubMed]
- Vicente-Serrano, S.M.; Beguería, S.; López-Moreno, J.I. A multiscalar drought index sensitive to global warming: The standardized precipitation evapotranspiration index. J. Clim. 2010, 23, 1696–1718. [Google Scholar] [CrossRef]
- Adnan, S. Spatio-Temporal Distribution of Drought and its Characteristics over Pakistan. Ph.D. Dissertation, Commission on Science and Technology for Sustainable Development in the South University, Islamabad, Pakistan, 2016. [Google Scholar]
- Guo, H.; Bao, A.; Liu, T.; Jiapaer, G.; Ndayisaba, F.; Jiang, L.; Kurban, A.; De Maeyer, P. Spatial and temporal characteristics of droughts in Central Asia during 1966–2015. Sci. Total. Environ. 2018, 624, 1523–1538. [Google Scholar] [CrossRef] [PubMed]
- Krakauer, N.Y.; Lakhankar, T. Trends in Drought over the Northeast United States. Water 2019, 11, 1834. [Google Scholar] [CrossRef]
- Potop, V.; Boronean, C. Observed evolution of drought episodes assessed with the Standardized Precipitation Evapotranspiration Index (SPEI) over the Czech Republic. EGU General Assembly 2012, 14, 10010. [Google Scholar]
- Liu, X.; Wang, S.; Zhou, Y.; Wang, F.; Li, W.; Liu, W. Regionalization and Spatiotemporal Variation of Drought in China Based on Standardized Precipitation Evapotranspiration Index (1961–2013). Adv. Meteorol. 2015, 2015, 950262. [Google Scholar] [CrossRef]
- Tan, C.; Yang, J.; Li, M. Temporal-spatial variation of drought indicated by SPI and SPEI in Ningxia Hui Autonomous Region, China. Atmosphere 2015, 6, 1399–1421. [Google Scholar] [CrossRef]
- Tian, L.; Quiring, S.M. Spatial and temporal patterns of drought in Oklahoma (1901–2014). Int. J. Climatol. 2019, 39, 3365–3378. [Google Scholar] [CrossRef]
- Zaman, Q.U.; Rasul, G. Agro-Climatic Classification of Pakistan. Q. Sci. Vis. 2004, 9, 59–66. [Google Scholar]
- Qamar Uz Zaman, C. Climate Change Profile of Pakistan; Asian Development Bank: Mandaluyong, PH, USA, 2017. [Google Scholar]
- Mahessar, A.A.; Qureshi, A.L.; Dars, G.H.; Solangi, M.A. Climate change impacts on vulnerable Guddu and Sukkur Barrages in Indus River, Sindh. Sindh Univ. Res. J. 2017, 49, 137–142. [Google Scholar]
- Krakauer, N.Y.; Lakhankar, T.; Dars, G.H. Precipitation Trends over the Indus Basin. Climate 2019, 7, 116. [Google Scholar] [CrossRef]
- Rehman, S.; Shah, M.A. Rainfall Trends in Different Climate Zones of Pakistan. Pak. J. Meteorol. 2012, 9, 37–47. [Google Scholar]
- Frenken, K. Irrigation in Southern and Eastern Asia in figures: AQUASTAT Survey—2011. In Water Reports; Food and Agriculture Organization of the United Nations (FAO): Rome, Italy, 2012; No. 37. [Google Scholar]
- Beguería, S.; Latorre, B.; Reig, F.; Vicente-Serrano, S.M. sbegueria/SPEIbase: Version 2.5.1. Glob. SPEI Database 2017. [Google Scholar]
- Schneider, U.; Becker, A.; Finger, P.; Meyer-Christoffer, A.; Ziese, M.; Rudolf, B. GPCC’s new land surface precipitation climatology based on quality-controlled in situ data and its role in quantifying the global water cycle. Theor. Appl. Climatol. 2014, 115, 15–40. [Google Scholar] [CrossRef]
- Harris, I.; Jones, P.D.; Osborn, T.J.; Lister, D.H. Updated high-resolution grids of monthly climatic observations—The CRU TS3.10 Dataset. Int. J. Climatol. 2014, 34, 623–642. [Google Scholar] [CrossRef]
- Briffa, K.R.; Jones, P.D. Global surface air temperature variations during the twentieth century: Part 2, implications for large-scale high-frequency palaeoclimatic studies. Holocene 1993, 3, 77–88. [Google Scholar] [CrossRef]
- Thornthwaite, C.W. An Approach toward a Rational Classification of Climate C. Geogr. Rev. 1948, 38, 55–94. [Google Scholar] [CrossRef]
- Yuan, S.; Quiring, S.M. Drought in the U.S. Great Plains (1980–2012): A sensitivity study using different methods for estimating potential evapotranspiration in the Palmer Drought Severity Index. J. Geophys. Res. Atmos. 2014, 119, 3825–3856. [Google Scholar] [CrossRef]
- Mamassis, N.; Panagoulia, D.; Novkovic, A. Sensitivity analysis of penman evaporation method. Glob. Nest J. 2014, 16, 628–639. [Google Scholar]
- Westerhoff, R.S. Using uncertainty of Penman and Penman-Monteith methods in combined satellite and ground-based evapotranspiration estimates. Remote Sens. Environ. 2015, 169, 102–112. [Google Scholar] [CrossRef]
- Assunção, R.M.; Neves, M.C.; Câmara, G.; Da Costa Freitas, C. Efficient regionalization techniques for socio-economic geographical units using minimum spanning trees. Int. J. Geogr. Inf. Sci. 2006, 20, 797–811. [Google Scholar] [CrossRef]
- Jungnickel, D. Graphs, Networks and Algorithms; Springer: Berlin, Germany, 1999. [Google Scholar]
- Yevjevich, V. An objective approach to definitions and investigations of continental hydrologic droughts. J. Hydrol. 1969, 7, 353. [Google Scholar]
- Mohammed, S.; Alsafadi, K.; Mohammad, S.; Mousavi, N. Drought Trends in Syria from 1900 to 2015. In Proceedings of the 4th International Congress of Developing Agriculture, Natural Resources, Environment and Tourism of Iran, Tabriz Islamic Art University In cooperation with Shiraz University and Yasouj University, Tabriz, Iran, 14 August 2019. [Google Scholar]
- Hamed, K.H.; Rao, A.R. A modified Mann-Kendall trend test for autocorrelated data. J. Clin. Oncol. 2018, 36, 522. [Google Scholar] [CrossRef]
- Kendall, M.G. Rank Correlation Methods; Griffin: Oxford, UK, 1948. [Google Scholar]
- Sen, P.K. Estimates of the Regression Coefficient Based on Kendall’s Tau. J. Am. Stat. Assoc. 1968, 63, 1379–1389. [Google Scholar] [CrossRef]
- Ullah, H.; Akbar, M.; Khan, F. Construction of homogeneous climatic regions by combining cluster analysis and L-moment approach on the basis of Reconnaissance Drought Index for Pakistan. Int. J. Climatol. 2019, 1–18. [Google Scholar] [CrossRef]


| Modified Mann–Kendall Trend Test | ||||
|---|---|---|---|---|
| P-Value | Tau | Sen’s Slope | ||
| Zone 1 | SPEI | 5.05 × 10⁻² | −2.84 × 10⁻³ | −9.91 × 10⁻⁵ |
| Duration | 1.52 × 10⁻² | 9.09 × 10⁻² | 0.00 × 100 | |
| Severity | 5.86 × 10⁻⁴ | −7.63 × 10⁻² | −2.47 × 10⁻³ | |
| Intensity | 9.41 × 10⁻¹ | −1.27 × 10⁻³ | −1.23 × 10⁻⁵ | |
| Peak | 1.92 × 10⁻¹ | −2.15 × 10⁻² | −2.73 × 10⁻⁴ | |
| Zone 2 | SPEI | 2.08 × 10⁻¹² | 1.12 × 10⁻¹ | 3.87 × 10⁻⁴ |
| Duration | 4.72 × 10⁻² | −1.16 × 10⁻¹ | 0.00 × 100 | |
| Severity | 1.24 × 10⁻³ | 1.57 × 10⁻¹ | 5.15 × 10⁻³ | |
| Intensity | 8.18 × 10⁻²³ | 1.63 × 10⁻¹ | 1.30 × 10⁻³ | |
| Peak | 1.15 × 10⁻³⁰ | 1.81 × 10⁻¹ | 2.23 × 10⁻³ | |
| Zone 3 | SPEI | 1.15 × 10⁻¹⁸ | 1.54 × 10⁻¹ | 4.72 × 10⁻⁴ |
| Duration | 1.86 × 10⁻¹ | −5.77 × 10⁻² | 0.00 × 100 | |
| Severity | 1.70 × 10⁻¹ | 5.04 × 10⁻² | 1.90 × 10⁻³ | |
| Intensity | 5.71 × 10⁻¹ | −1.09 × 10⁻² | −8.95 × 10⁻⁵ | |
| Peak | 9.24 × 10⁻¹ | 2.10 × 10⁻³ | 2.49 × 10⁻⁵ | |
| Zone 4 | SPEI | 7.32 × 10⁻¹⁸ | −1.49 × 10⁻¹ | −4.96 × 10⁻⁴ |
| Duration | 1.44 × 10⁻¹ | 9.55 × 10⁻² | 0.00 × 100 | |
| Severity | 1.34 × 10⁻³ | −1.64 × 10⁻¹ | −7.73 × 10⁻³ | |
| Intensity | 8.20 × 10⁻¹⁴ | −2.63 × 10⁻¹ | −2.26 × 10⁻³ | |
| Peak | 9.08 × 10⁻¹⁶ | −2.68 × 10⁻¹ | −3.26 × 10⁻³ | |
| Zone 5 | SPEI | 8.72 × 10⁻⁵ | −3.83 × 10⁻² | −1.34 × 10⁻⁴ |
| Duration | 8.84 × 10⁻¹ | 4.04 × 10⁻³ | 0.00 × 100 | |
| Severity | 3.91 × 10⁻¹ | −2.25 × 10⁻² | −5.12 × 100 | |
| Intensity | 2.11 × 10⁻¹ | −3.32 × 10⁻² | −2.25 × 10⁻⁴ | |
| Peak | 9.63 × 10⁻⁴ | −7.86 × 10⁻² | −7.26 × 10⁻⁴ | |
| Statistically significant at 95% confidence internal | ||||
| Not statistically significant | ||||
| Zone | Start | End | Duration (Months) | Severity | Intensity | Peak |
|---|---|---|---|---|---|---|
| Zone 1 | 16 November 1999 | 16 May 2001 | 19 | −20.92 | −1.10 | −1.88 |
| 16 August 1920 | 16 May 1921 | 11 | −14.98 | −1.36 | −1.89 | |
| Zone 2 | 16 July 1940 | 16 October 1941 | 16 | −15.91 | −0.99 | −1.38 |
| 16 July 1920 | 16 June 1921 | 12 | −17.55 | −1.46 | −1.94 | |
| 16 January 1952 | 16 December 1952 | 12 | −12.67 | −1.06 | −1.47 | |
| 16 December 1945 | 16 September 1946 | 10 | −10.37 | −1.04 | −1.73 | |
| Zone 3 | 16 January 1918 | 16 October 1918 | 10 | −10.71 | −1.07 | −1.62 |
| Zone 4 | 16 April 1968 | 16 May 1969 | 14 | −15.07 | −1.08 | −1.42 |
| 16 December 1970 | 16 November 1971 | 12 | −15.47 | −1.29 | −1.65 | |
| 16 August 1987 | 16 June 1988 | 11 | −11.27 | −1.02 | −1.36 | |
| 16 December 1999 | 16 September 2000 | 10 | −9.75 | −0.97 | −1.53 | |
| 15 February 2004 | 16 November 2004 | 10 | −12.27 | −1.23 | −1.94 | |
| Zone 5 | 16 April 1968 | 16 January 1970 | 22 | −23.12 | −1.05 | −1.39 |
| 16 September 2001 | 16 November 2002 | 15 | −15.80 | −1.05 | −1.44 | |
| 15 February 2000 | 16 March 2001 | 14 | −14.38 | −1.03 | −1.38 | |
| 16 July 1920 | 16 June 1921 | 12 | −13.62 | −1.13 | −1.39 | |
| 16 July 1987 | 16 June 1988 | 12 | −14.84 | −1.24 | −1.53 |
© 2019 by the authors. Licensee MDPI, Basel, Switzerland. This article is an open access article distributed under the terms and conditions of the Creative Commons Attribution (CC BY) license (http://creativecommons.org/licenses/by/4.0/).
Share and Cite
Jamro, S.; Dars, G.H.; Ansari, K.; Krakauer, N.Y. Spatio-Temporal Variability of Drought in Pakistan Using Standardized Precipitation Evapotranspiration Index. Appl. Sci. 2019, 9, 4588. https://doi.org/10.3390/app9214588
Jamro S, Dars GH, Ansari K, Krakauer NY. Spatio-Temporal Variability of Drought in Pakistan Using Standardized Precipitation Evapotranspiration Index. Applied Sciences. 2019; 9(21):4588. https://doi.org/10.3390/app9214588
Chicago/Turabian StyleJamro, Shoaib, Ghulam Hussain Dars, Kamran Ansari, and Nir Y. Krakauer. 2019. "Spatio-Temporal Variability of Drought in Pakistan Using Standardized Precipitation Evapotranspiration Index" Applied Sciences 9, no. 21: 4588. https://doi.org/10.3390/app9214588