Article

A New Method of Angle Measurement Error Analysis of Rotary Encoders

School of Instrument Science and Opto-electronics Engineering, Hefei University of Technology, Hefei 230009, China
*
Author to whom correspondence should be addressed.
Appl. Sci. 2019, 9(16), 3415; https://doi.org/10.3390/app9163415
Submission received: 15 July 2019 / Revised: 9 August 2019 / Accepted: 14 August 2019 / Published: 19 August 2019
(This article belongs to the Section Mechanical Engineering)

Abstract

:
In this article, a method of error source analysis and detection to improve the angle measurement accuracy of rotary encoders in precision measuring instruments is proposed. The angle measurement error caused by the installation eccentricity of the grating disk and the radial error motion of the rotating shaft is analyzed, and the error model is built. The method of measuring the radial error motion is introduced, and the visual system and image processing technology is proposed to detect the eccentricity. The verification experiment by the use of an autocollimator and a polygon is carried out. The residual error after comparison within ±6″ accounts for 9% of the angle measurement error. The proposed error model is verified, and the angle measurement error can be predicted if the installation eccentricity and radial error motion are known.

1. Introduction

The precision measuring instruments that contain rotation joints and high-accuracy angle sensors, such as laser trackers, articulated arm coordinate measuring machines, total stations, and theodolites, have been widely used in the industrial fields of large-scale metrology [1,2]. The measurement accuracy of these instruments is influenced significantly by the measurement accuracy of angle sensors. Rotary encoders are widely used as high-accuracy angle sensors. Much research has been carried out to improve angle measurement accuracy. Zheng et al. proposed an eccentricity error model, and they used a polygon and an autocollimator to detect the angle measurement error. The grating disk eccentricity error model parameters were estimated using the nonlinear least square method. The angle measurement error was decreased by correcting the eccentricity error [3]. Gao et al. analyzed the angle measurement error data with the fast Fourier transform (FFT), and the constant was calculated based on particle swarm optimization (PSO) to overcome the non-convergence of the least square method [4]. Hong et al. proposed a model based on the radial basis function (RBF) to avoid the work on complex analysis on source of error, but researchers have to get enough evenly distributed calibration data [5]. Deng et al. proposed a method based on the adaptive differential evolution-Fourier neural network (ADE-FNN), based on the calibration device they devised [6]. However the calibration device cannot be used for calibrating a high-precision grating disk. Geckeler et al. proposed a method based on the Fourier approach that includes transfer functions for the calibration of angle encoders. Different weighting schemes combining the measurement results to reduce the uncertainty of calibration was presented [7]. The cross-calibration methods mentioned above utilize external reference standards to acquire discrete calibration data to fit the correction function.
Mancini et al. presented the error frequency of the eccentricity and runout of the rotating shaft; the reading heads in regularly distributed to compensate the installation eccentricity of the grating disk and runout error was proposed [8]. Geckeler et al. developed a kind of self-calibration method based on a Fourier-based algorithm through a suitable geometric arrangement of multiple reading heads. The angle measurement error due to lateral shifts, graduation error, reading heads’ positions, and non-uniform were analyzed [9]. Jiao et al. proposed an optimization-based arrangement of reading heads for self-calibration. The transfer function was used to obtain the relations between detectable Fourier components of angle measurement error and the angle interval of the reading heads. The optimal arrangements for two and three reading heads were analyzed, and the experiments were carried out to demonstrate this method. Then a four-heads separation technique was proposed to separate the encoder’s graduation error from the influence of the radial error motion of the rotating shaft [10,11]. The self-calibration methods mentioned above can improve the angle measurement accuracy by processing the difference values of multi reading heads without using a second auxiliary measuring device.
The main error sources are not measured, and the angle measurement error model is not built in the black-box approaches mentioned above. Fan et al. analyzed the error motion of the rotary stage and proposed that the angular positioning error of a spindle or a rotary stage is related to the instantaneous tilt and radial error motions of the rotating shaft based on the Abbe principle. Then the method was experimentally verified by the use of an optical polygon and an autocollimator [12]. Lou et al. proposed a model of predicting the angular positioning error of a rotational mandrel caused by the coaxiality error of the mandrel and the radial error motion of the spindle. The coaxiality error and radial error motion were measured, and the verification experiment was carried out by the use of an optical polygon and an autocollimator to verify the theory. Then Lou proposed an embedded sensor system for real-time measurement of two radial and three angular error motions of a rotary stage. The geometrical relationship between the four scanning heads and radial error motions was proposed and verified. The rotational angle and radial error motions of the shaft were measured by using an encoder with multiple scanning heads [13,14].
In this article, an in-depth study of the angle measurement error due to the installation eccentricity of the grating disk and the radial error motion of the rotating shaft is presented, a novel error model is built. The radial error motion of the rotating shaft is measured by the inductive probes with precision test sphere. A charge-coupled device (CCD) camera is used to get the images of radial grating, and both the eccentricity value and direction are detected by using image processing technology. Then the angle measurement error is obtained by putting the data of the radial error motion and eccentricity into the analytical model. At last, the verification experiment is carried out to verify the error model. The angle measurement error can be predicted if the installation eccentricity and radial error motion are known.

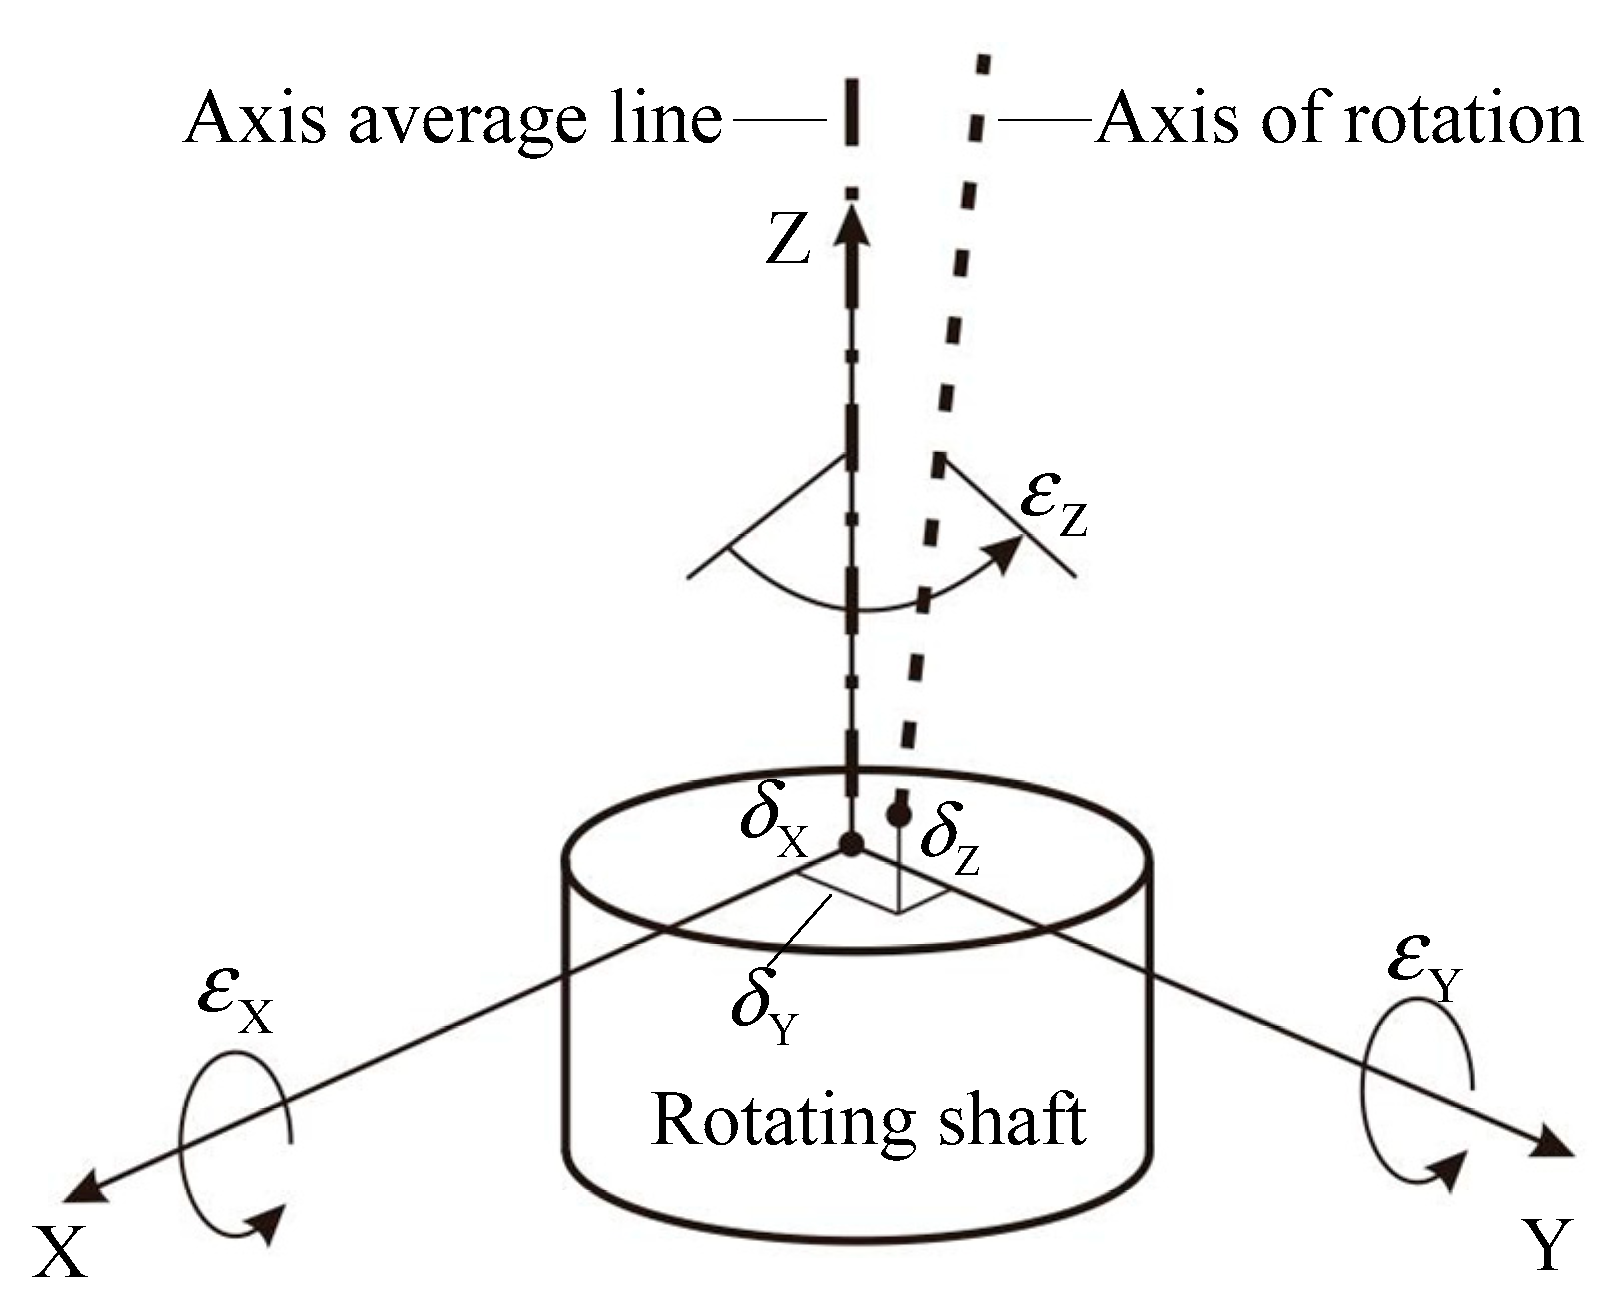
2. Geometric Errors of Spindle

According to ISO 230-7:2015 [15] and ASME B89.3.4-2010 [16], the rotating shaft has six error motion terms because of imperfect design, manufacturing, and assembly of machine parts, including three translational errors and three rotational errors, as shown in Figure 1. The translational errors are two radial error motions ( δ X and δ Y ) and an axial error motion ( δ Z ). The rotational errors are two tilt motions ( ε X and ε Y ) and an angular positioning error motion ( ε Z ). Axis average line represents the mean location of the axis of rotation, and it is determined by connecting the calculated least-squares centers of two data sets of radial error motion taken at axially separated locations.

3. Analysis of Angle Measurement Error

The parallel dual-joint coordinate measuring machine is a kind of articulated arm coordinate measuring machine that consists of two rotation joints and one linear rolling guide. Figure 2 shows the structure of the rotation joint. The mounting plate is fixed on the structural support, the reading head is fixed on the mounting plate, the grating disk and rotating shaft are connected with screws, and the grating disk is rotated with a rotating shaft relative to the reading head. The rotary encoder we use is the Mercury 3000 (Celera MOTION Company, Bedford, MA, USA, with resolution of 0.39″ for the measuring range of 360°). The angle measurement accuracy is influenced significantly by the installation eccentricity of the grating disk and the radial error motion of the rotating shaft.
Section 3.1 provides the ideal working condition of a rotary encoder; Section 3.2 and Section 3.3 provide the details of two types of error sources, installation eccentricity, and radial error motions; and Section 3.4 provides the comprehensive model based on the analysis discussed in Section 3.2 and Section 3.3.

3.1. Description of Ideal Condition

Figure 3 shows the rotary encoder working in ideal condition. O 1 ( O 2 ) represents the geometric center of the grating disk, O represents the axis of rotation in the XY plane, and O O represents the axis average line in the XY plane. The grating disk geometric center and axis of rotation are the same point because of no installation eccentricity. The axis of rotation and axis average line are in the same line because of no error motions of the rotating shaft. The shadow rectangle represents the reading head, the circle in dashed lines represents the radial grating, Z O 1 ( Z O 2 ) represents the index line of the grating disk, O M is the line between axis of rotation and center of the reading head, and O C represents the optical radius. When the grating disk works in ideal condition, the optical radius is a constant r . The index line rotates from position Z O 1 to position Z O 2 when the rotating shaft rotates θ .

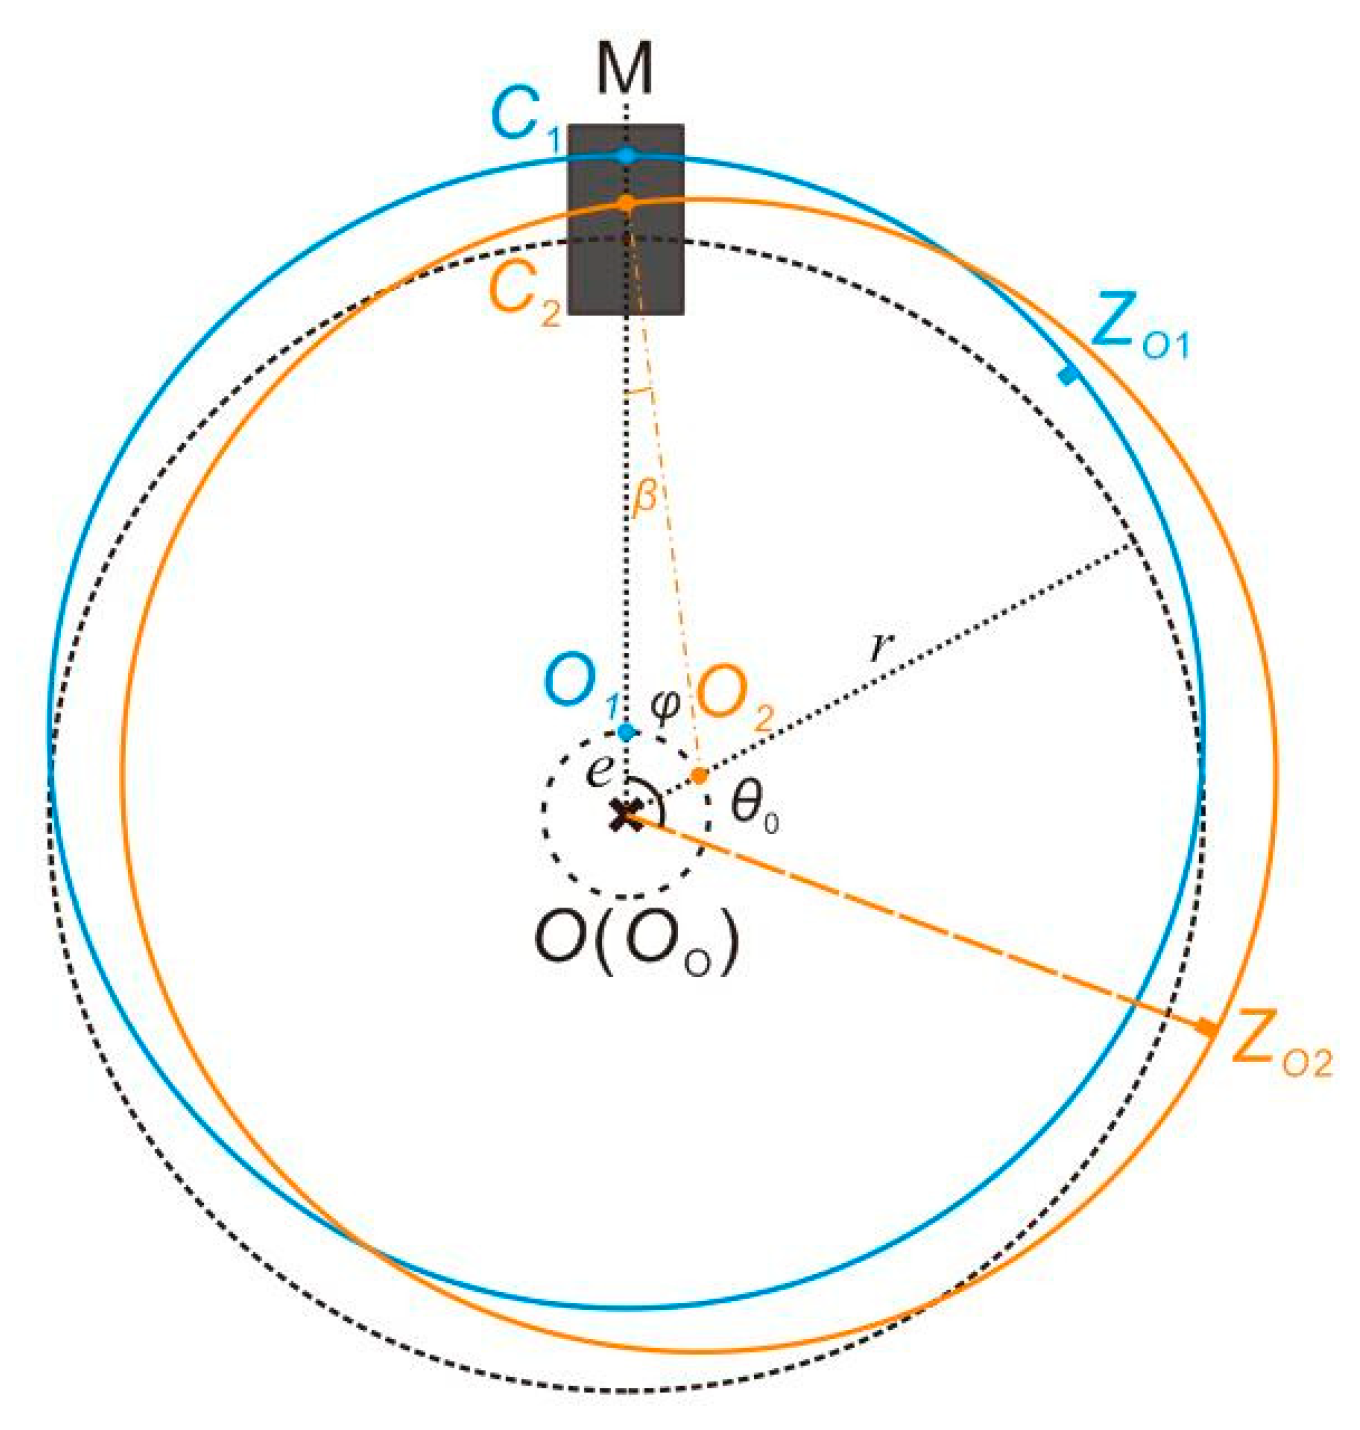
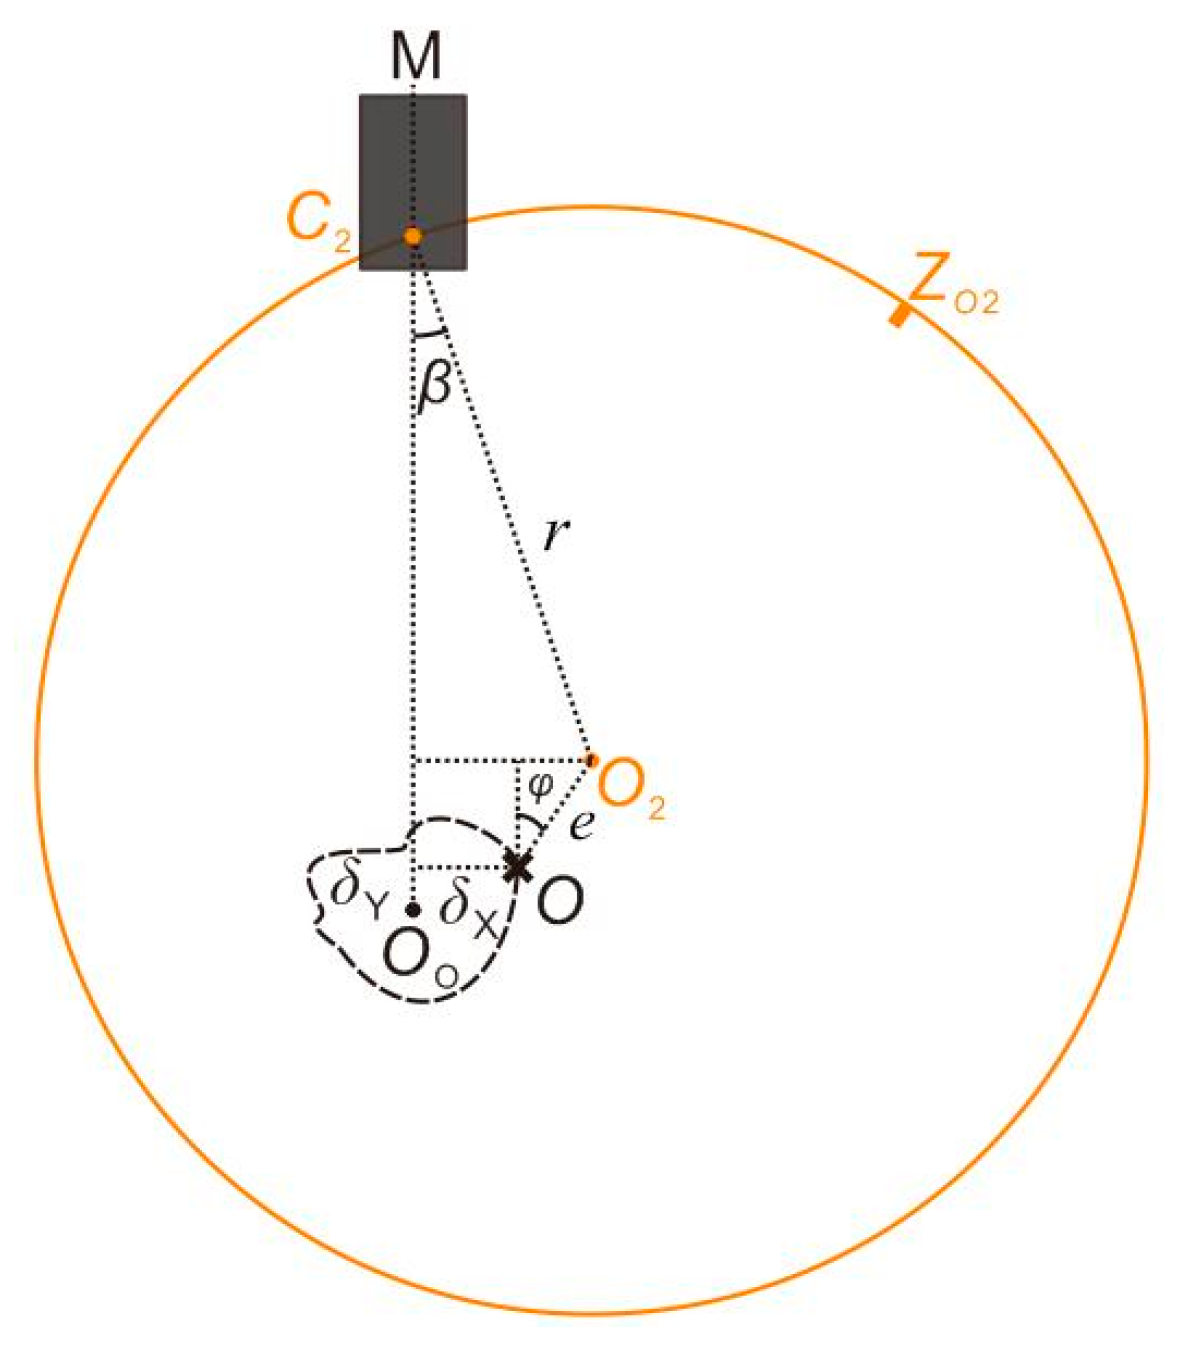
3.2. Angle Measurement Error Caused by Installation Eccentricity

As shown in Figure 4, the grating disk works in condition when there is installation eccentricity e but no error motions of the rotating shaft. It means that the axis of rotation O and the axis average line O O are at the same position.
O represents the axis of rotation, O 1 ( O 2 ) is the grating geometric center, and the trajectory of the grating geometric center is a circle. O is the center of the circle, and e is the radius of the circle. Circle O 1 and circle O 2 represent the grating disk at different positions separately. O M is the line between the shaft rotation center and the center of the reading head. O O 1 ( O O 2 ) is the line between the shaft rotation center and the grating geometric center. O C 1 ( O C 2 ) is the optical radius when the grating disk works in actual condition (optical radius is a variable in actual condition). Z O 1 ( Z O 2 ) is the grating index line, φ is the angle between O O 2 and O M , and θ is the angle scanned by the photoelectric sensor. After installing the grating disk on the rotating shaft, there is a fixed angle θ 0 between the grating index line and the eccentric direction, and the relationship between them is described as φ = θ θ 0 .
The circle O 2 is set as an example to describe the model. According to the geometrical relationship, the optical radius can be expressed by Equation (1):
O C = e cos φ + r cos β
where β = arcsin e sin φ r , so the arc length which the grating disk passes through the reading head can be expressed by Equation (2):
l = 0 φ O C d φ = 0 φ [ e cos φ + r cos ( arcsin e sin φ r ) ] d φ ,
where r is normally larger than 20 mm, e can be controlled within 0.01 mm, e / r is no more than 0.001, so arcsin e sin φ r 0 , from Equation (2), l = 0 φ ( e cos φ + r ) d φ . Δ l = l r φ , so the angle measurement error caused by eccentricity is calculated by Equation (3):
Δ θ = Δ l r = l r φ r = 0 φ ( e cos φ + r ) d φ r φ r = e r sin φ = e r sin ( θ θ 0 ) .

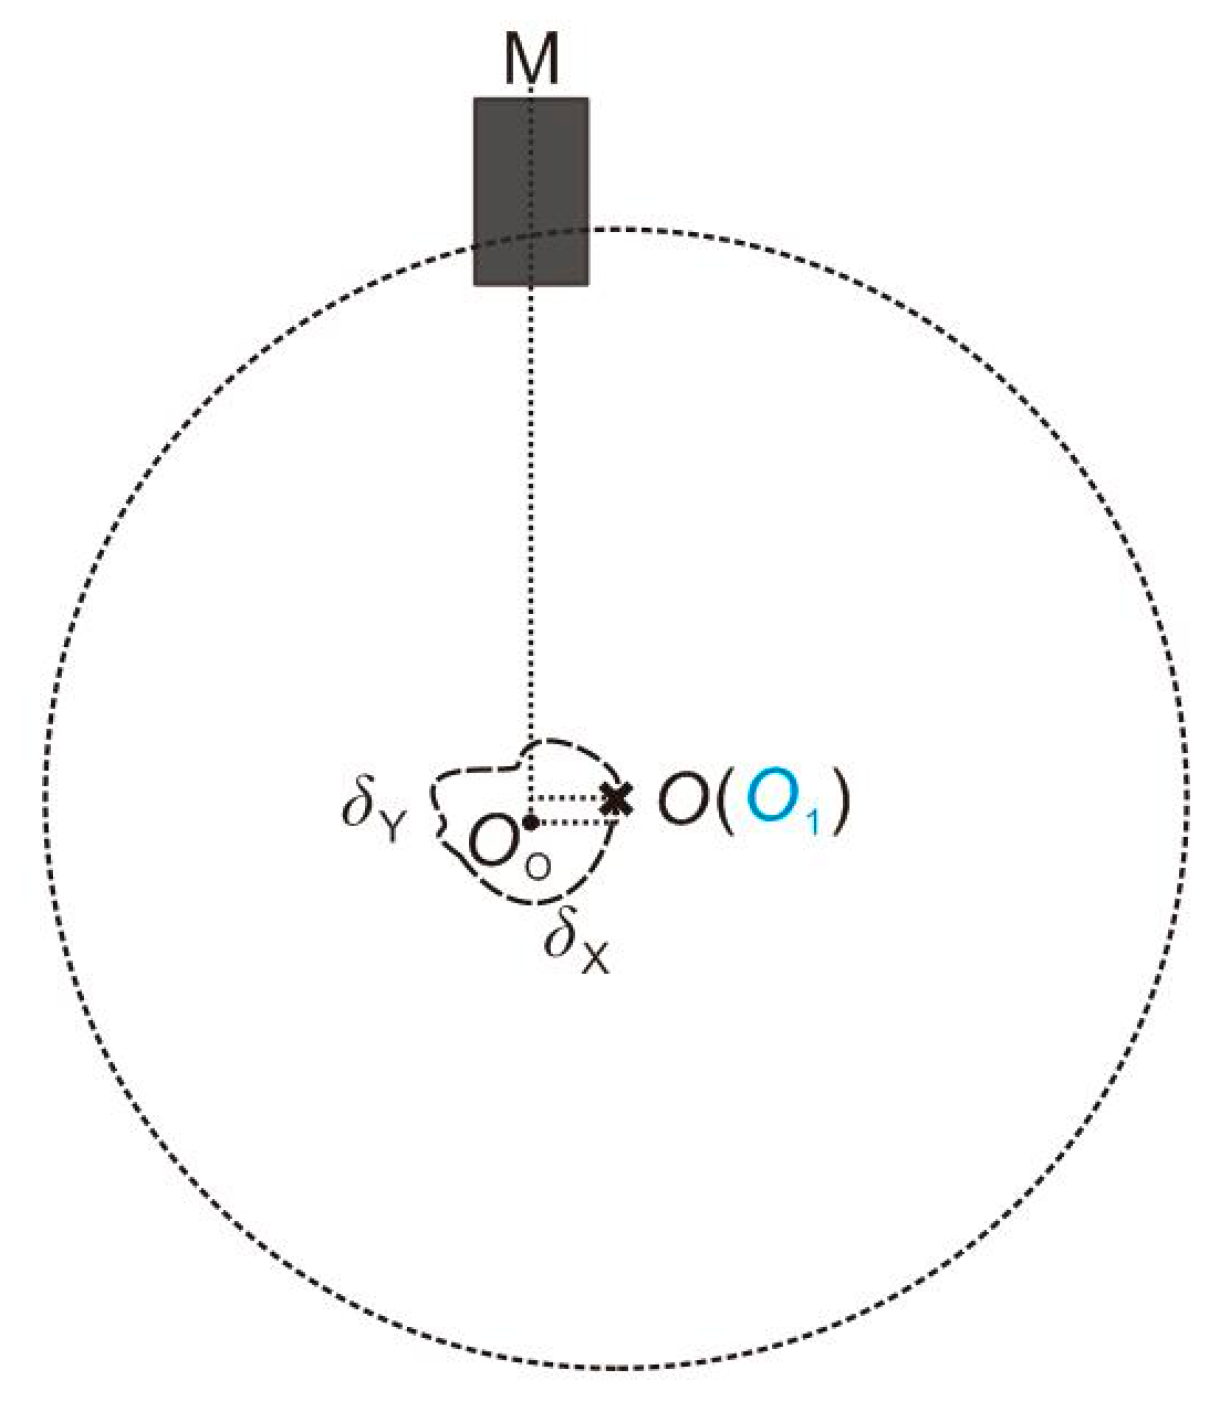
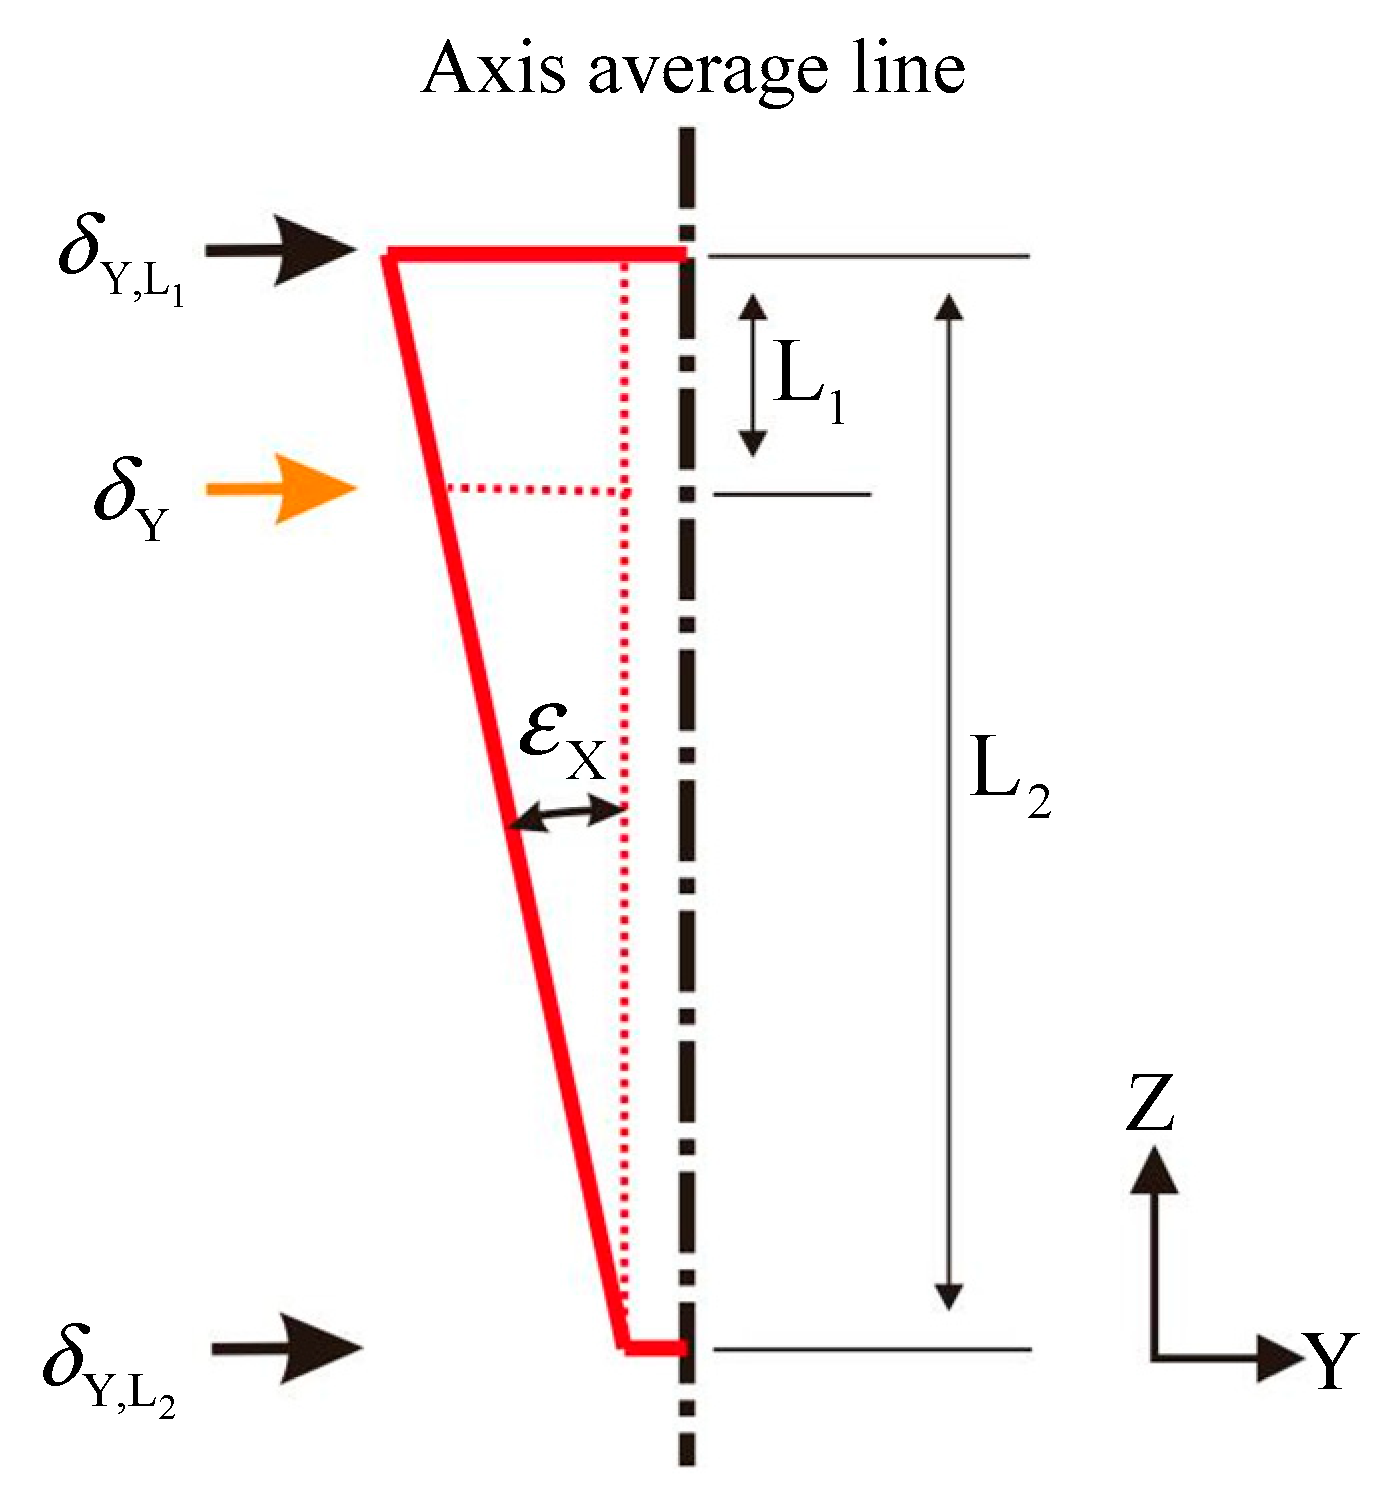
3.3. Angle Measurement Error Caused by Radial Error Motions

The axis of rotation and axis average line are not at the same position when there are error motions of the rotating shaft. As shown in Figure 5, O and O O are not the same point in the XY plane. The geometric center of the grating disk O 1 and axis of rotation O are the same point when there is no installation eccentricity. The trajectory of the axis of rotation O is an irregular figure. The radial error motions in the X and Y direction related to the angle θ are δ X ( θ ) , δ Y ( θ ) .

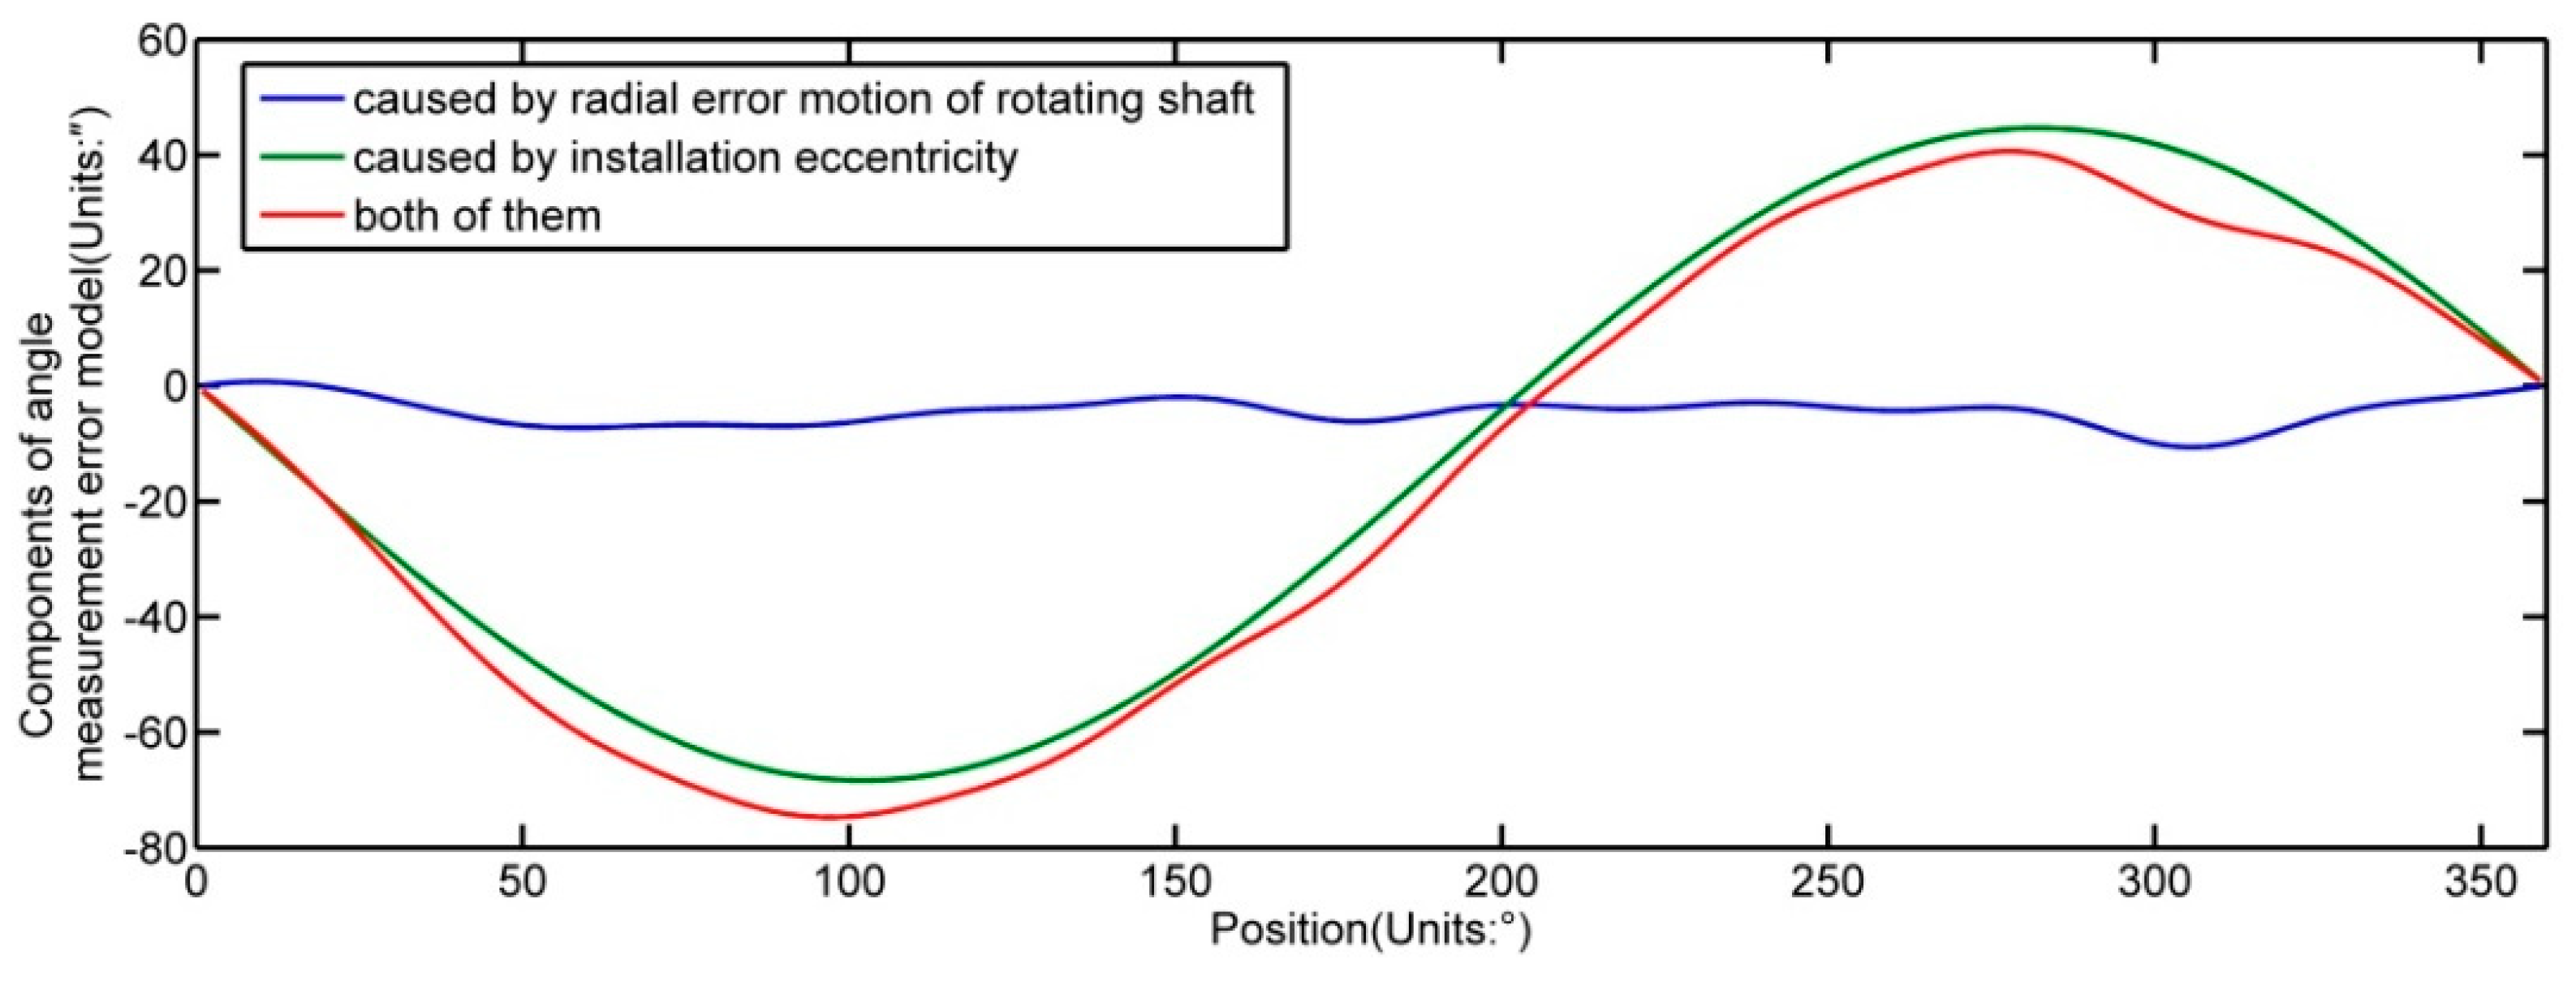
3.4. Angle Measurement Error Model Caused by Installation Eccentricity and Radial Error Motions

When the grating disk works in actual condition, the installation eccentricity of the grating disk and the error motions of the rotating shaft exist. As shown in Figure 6, δ Y is the radial error motion along the direction of the reading head, and δ X is the radial error motion that is perpendicular to δ Y . O 2 represents the geometric center of the grating disk, and O O C 2 is the actual radial optical radius when the grating disk rotates to position O 2 . According to geometrical relationship, O O C = δ Y ( θ ) + e cos φ + r cos β , and β = arcsin δ X ( θ ) + e sin φ r , so O O C = δ Y ( θ ) + e cos φ + r cos ( arcsin δ X ( θ ) + e sin φ r ) , r is normally larger than 20 mm, e can be controlled within 0.01 mm, and δ X can be controlled within 0.005 mm, so δ X ( θ ) + e sin φ r is no more than 0.001, so arcsin δ X ( θ ) + e sin φ r 0 . Then O O C = δ Y ( θ ) + e cos φ + r , the arc length which the grating disk passes through the reading head is expressed as Equation (4):
l = 0 θ O O C d θ = 0 θ [ δ Y ( θ ) + e cos ( θ θ 0 ) + r ] d θ ,
so the angle measurement error caused by the installation eccentricity and the radial error motion is calculated by Equation (5):
Δ θ = Δ l r = l r θ r = 0 θ [ δ Y ( θ ) + e cos ( θ θ 0 ) + r ] d θ r θ r = e sin ( θ θ 0 ) + 0 θ δ Y ( θ ) d θ r .

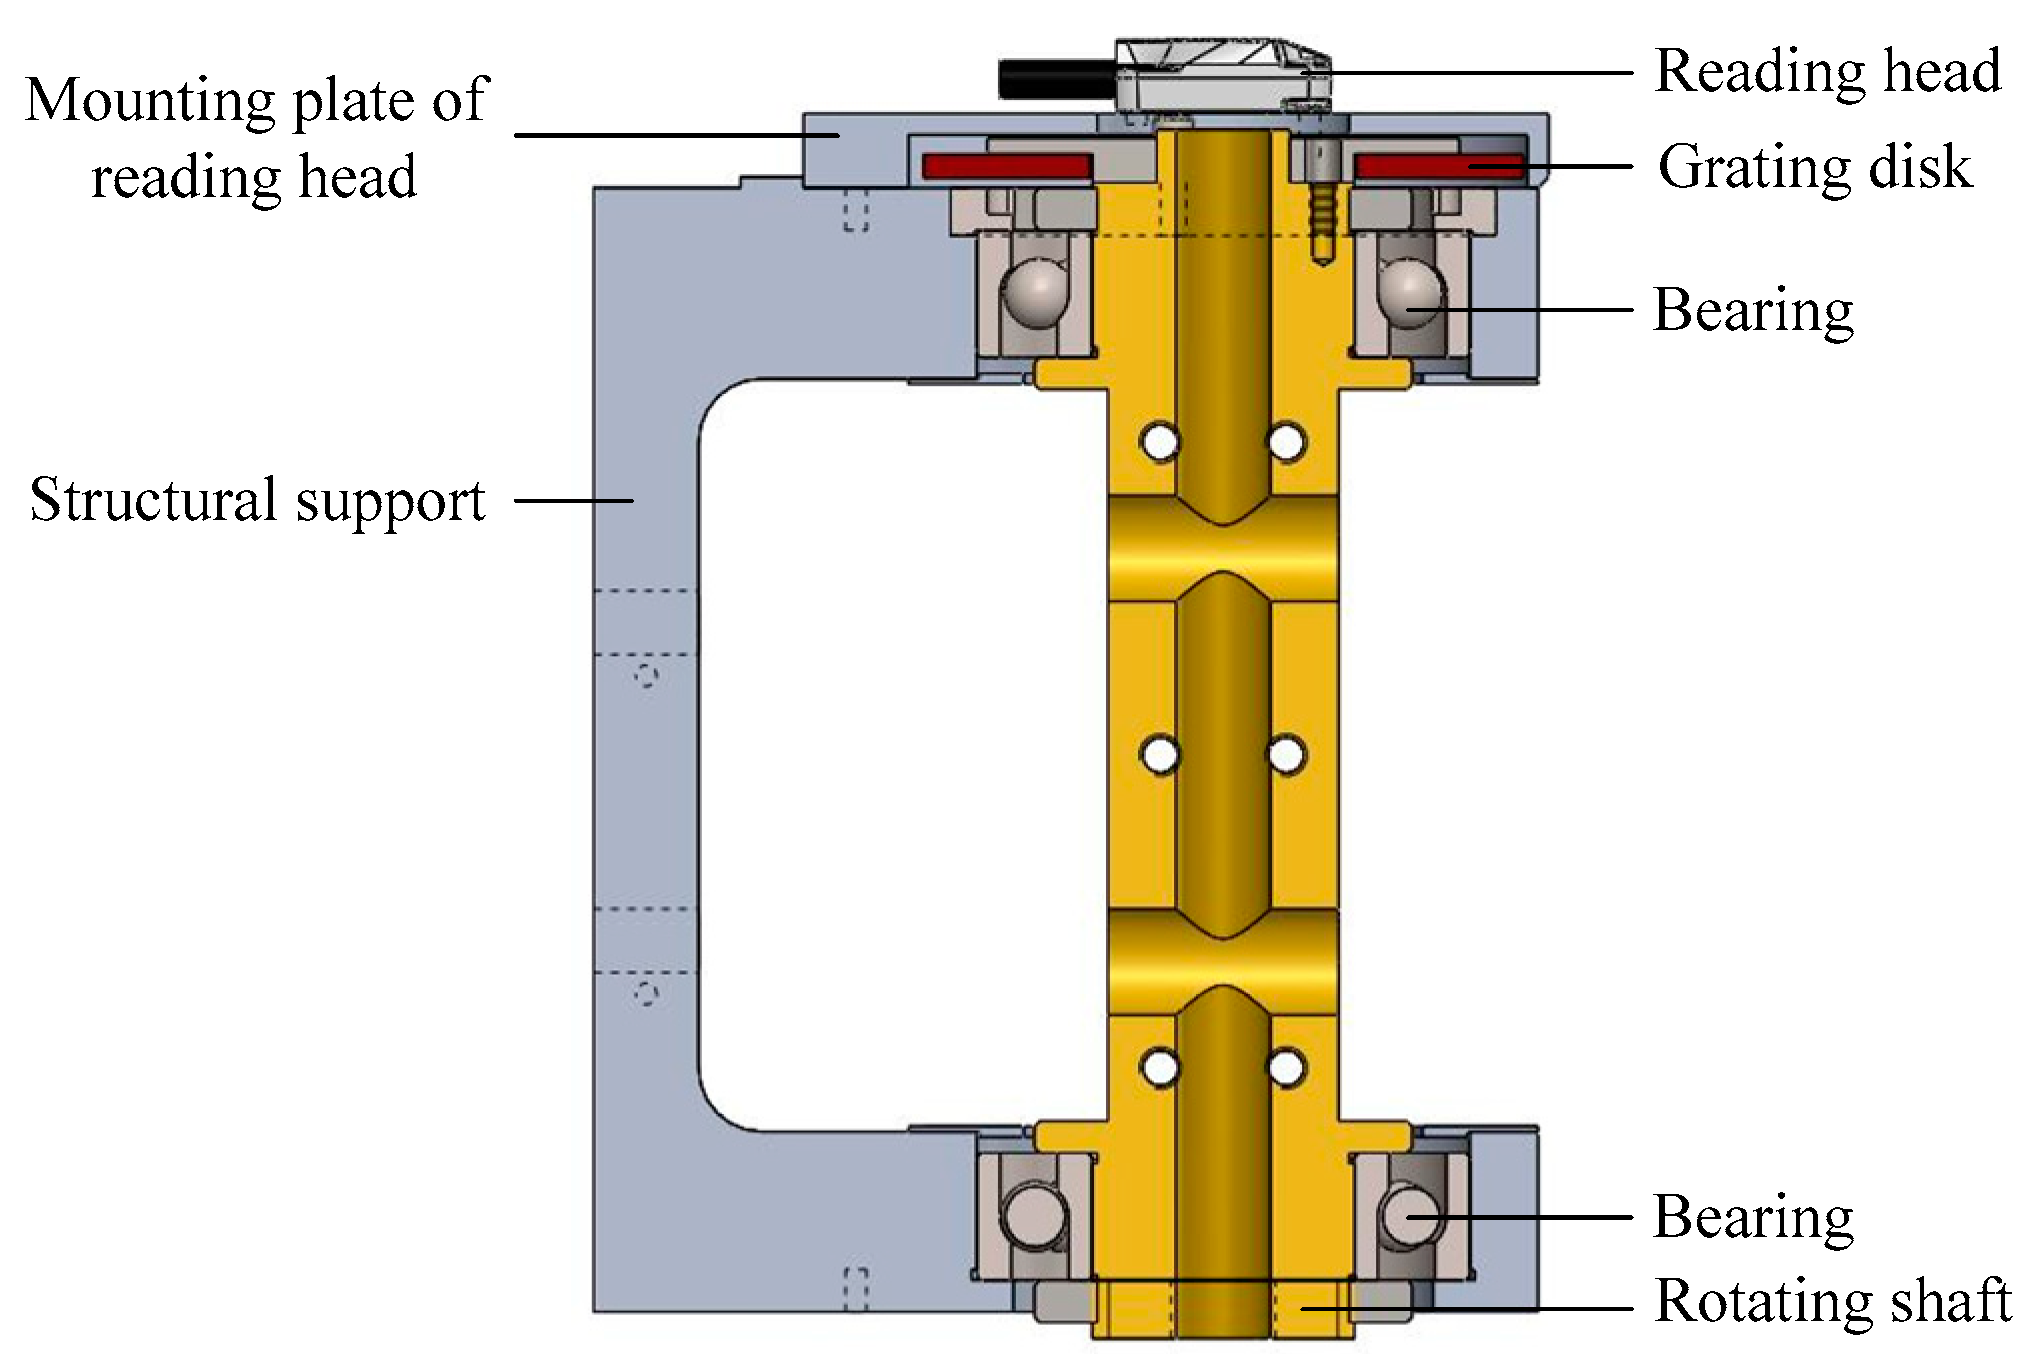
4. Detection and Verification Method

Section 4.1 and Section 4.2 provide the respective measurement strategies to quantify the radial error motion and installation eccentricity.

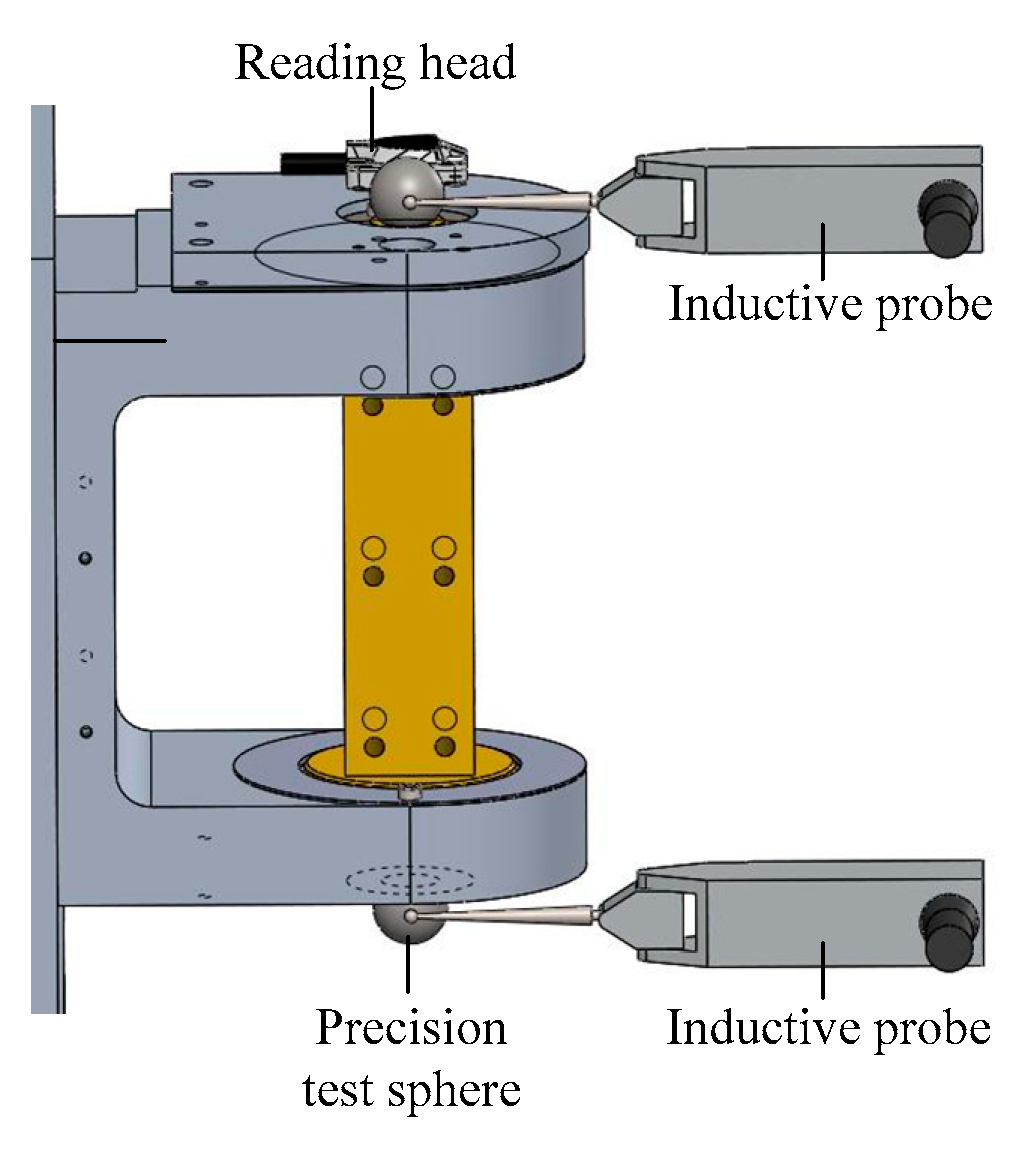
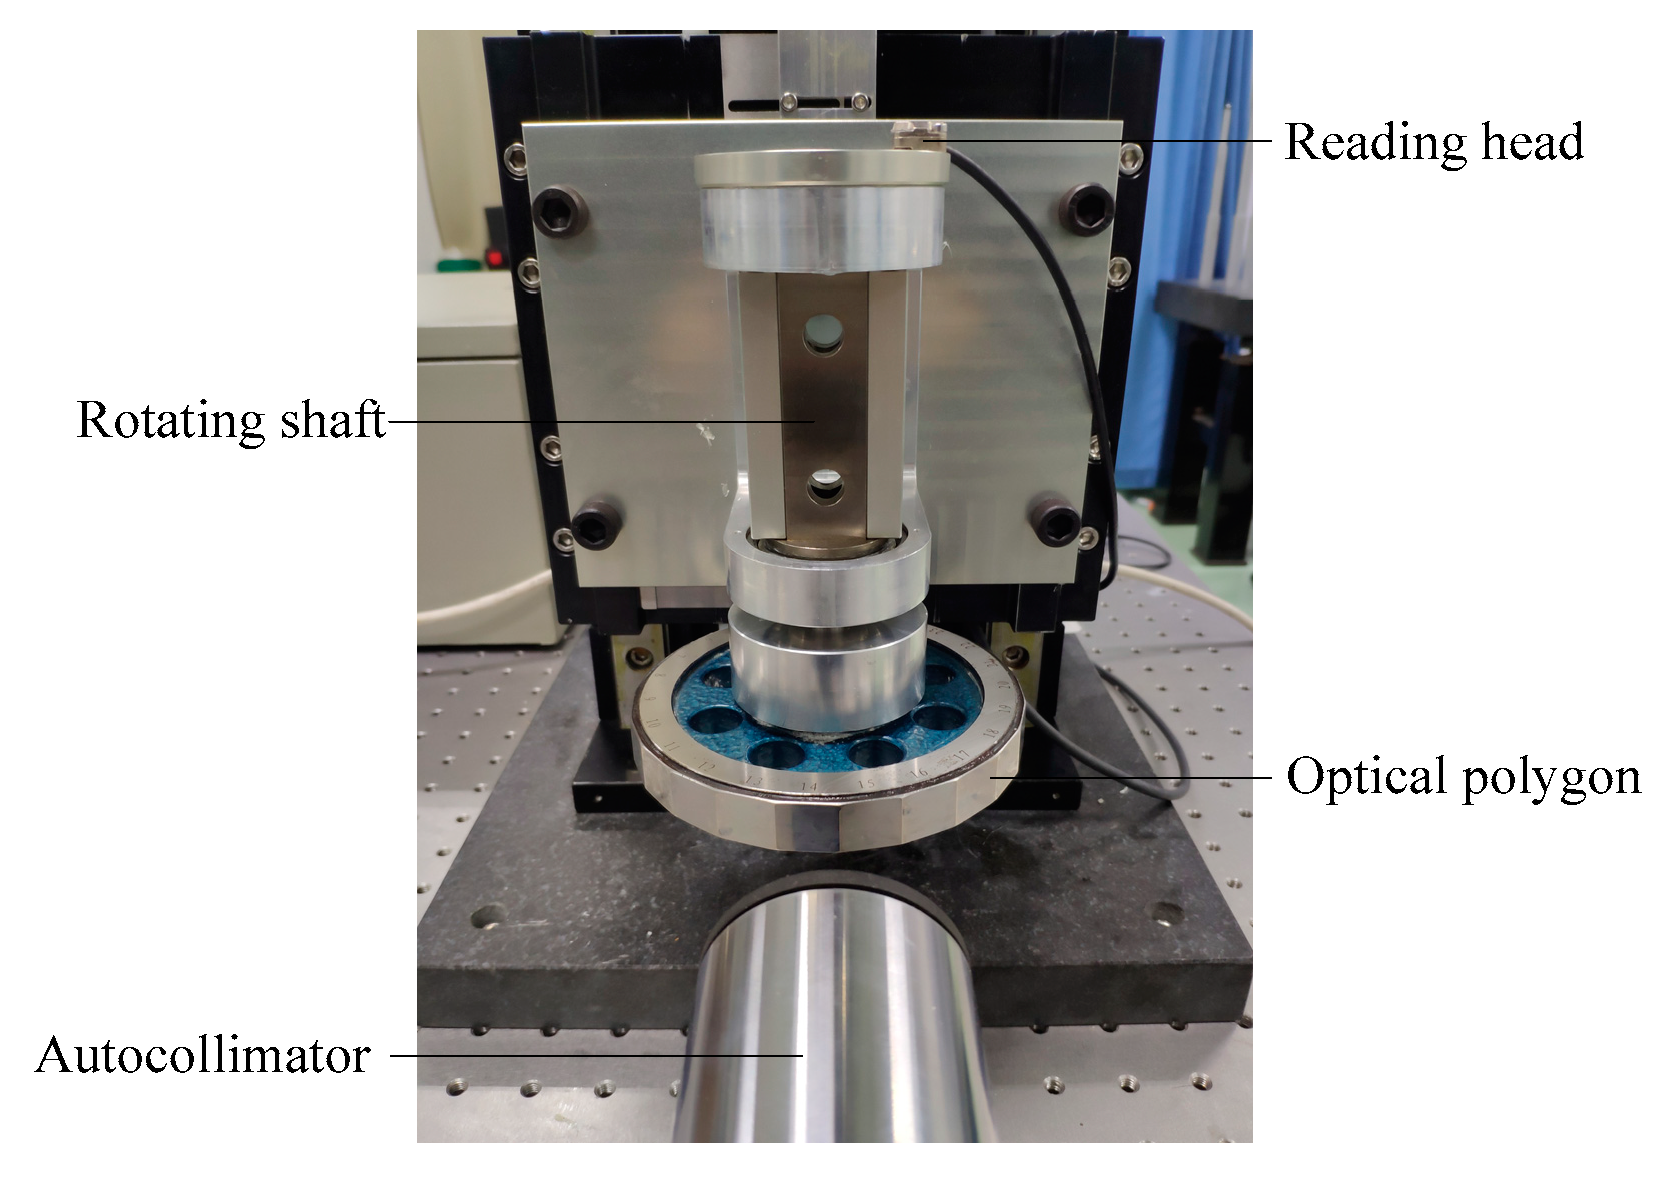
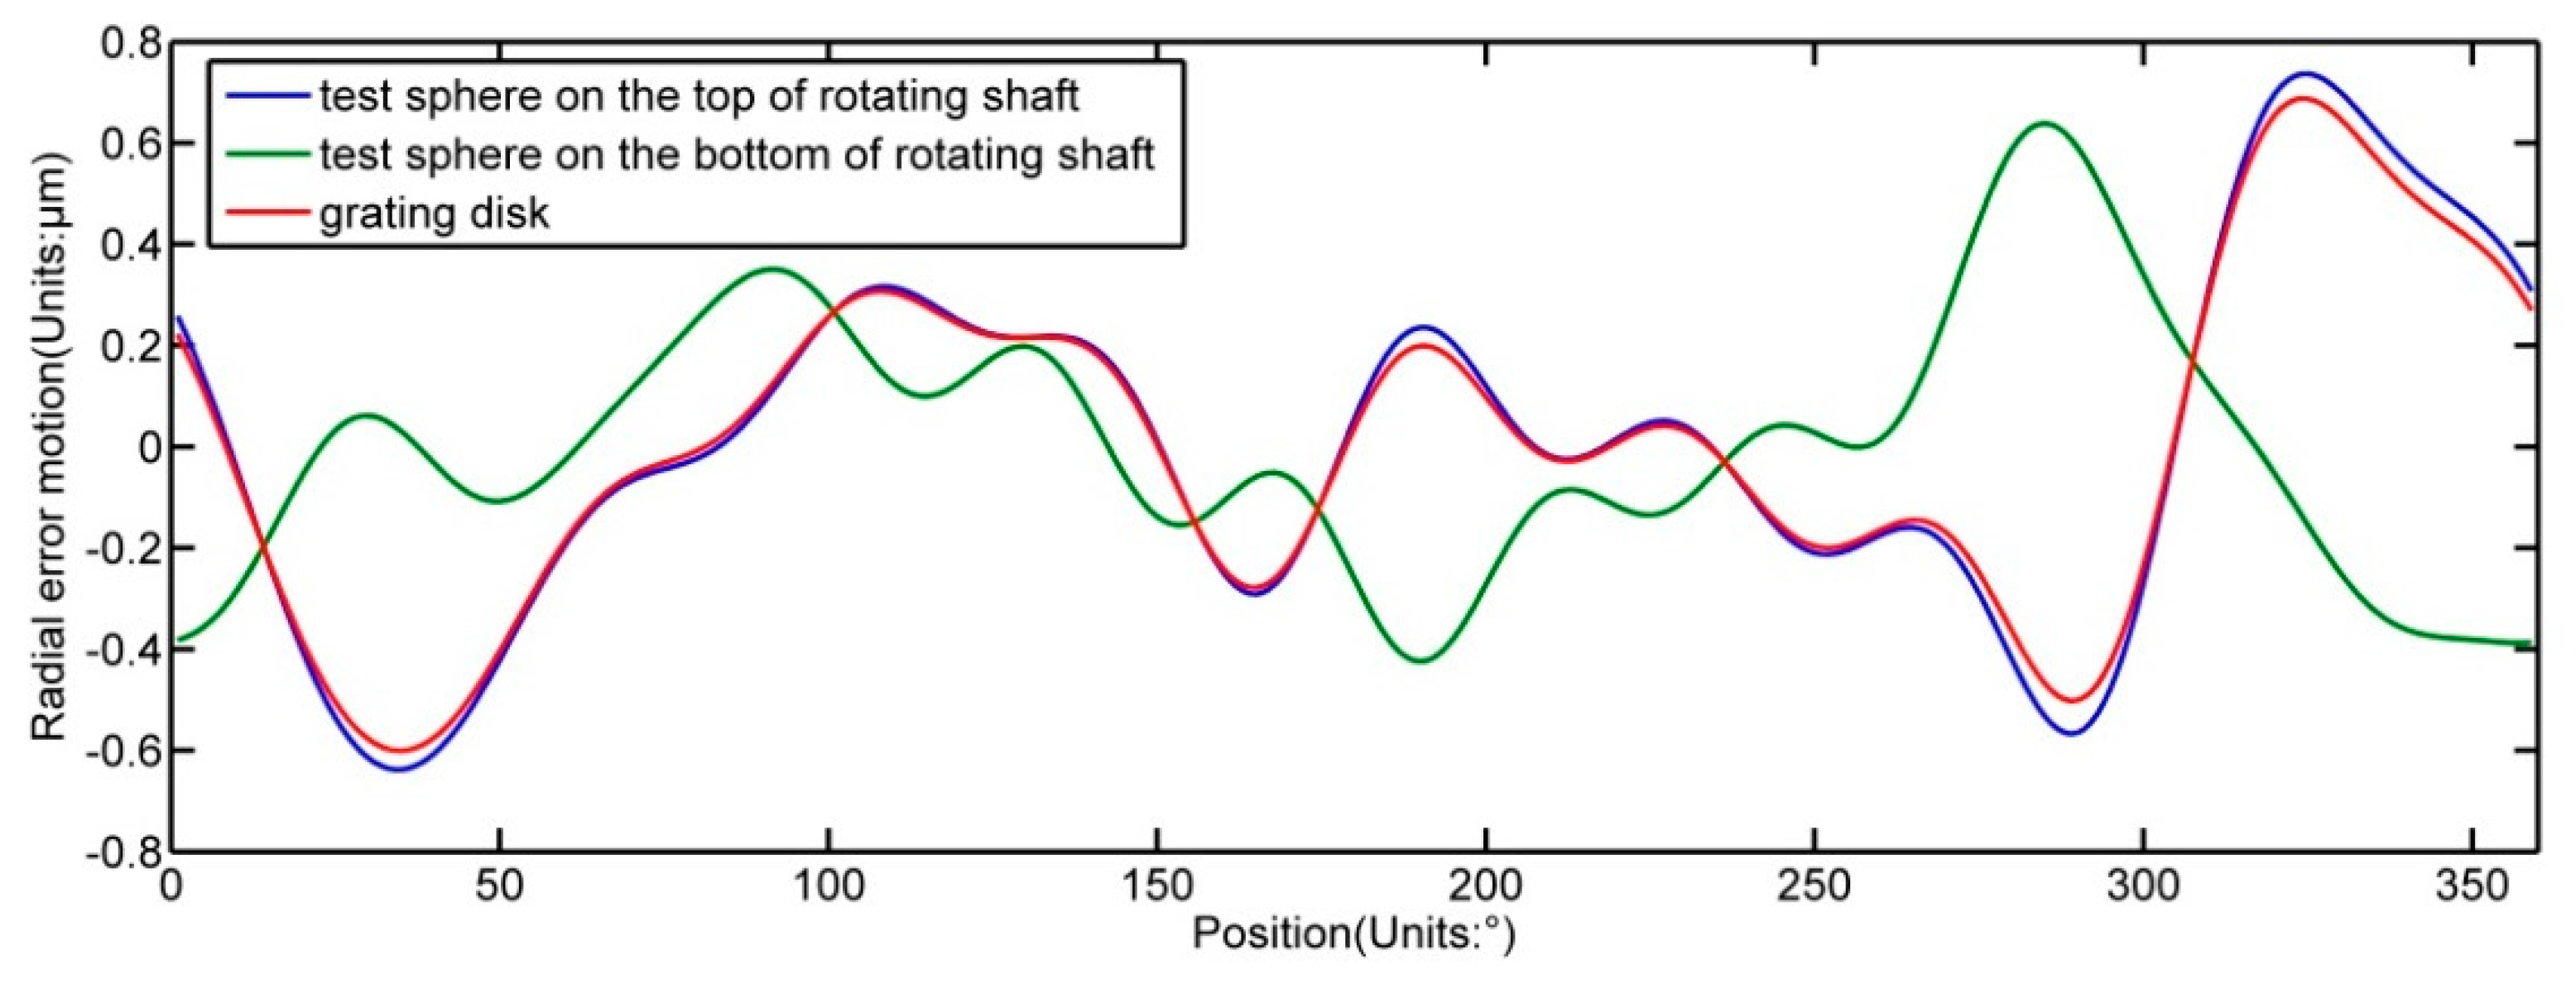
4.1. Radial Error Motion Measurement

The experiment to measure the radial error motion of the rotating shaft is presented in this section. ISO 230-7: 2015 [15] specifies the mounting of a precision test sphere or other suitable artefact in the machine spindle, using a displacement sensor to measure the error motions of the spindle. The influence of installation eccentricity is introduced. Many previous studies have proposed other methods to measure the error motions of the spindle [17,18,19,20]. We used the contact measurement method based on the features of the rotation joint.
Two precision test spheres are fixed on the top and bottom of the rotating shaft. The max surface roughness is 0.014 μ m , which is negligible compared with radial error motions. As shown in Figure 7, the inductive probes (lever type, TESA Company, model 32.10802, with max repeatability 0.1 μ m , permissible error for deviations in linearity is 0.2 + 50 × L 2   μ m for the measuring range of ±0.3 mm ) are adjusted to make contact with the precision test spheres. One 2 π period sinusoidal signal generated by the installation eccentricity of the precision test sphere superimposes on the inductive probe outputs.
The data of inductive probes d ( θ ) are expanded to 10 order Fourier series, shown as Equation (6):
d ( θ ) = a 0 + i = 1 10 ( a i sin ( i θ ) + b i c o s ( i θ ) ) ,
the Fourier coefficients a 0 , a 1 , b 1 , , a 10 , b 10 are calculated by using the least-square fitting method. Then the radial error motion of the precision test sphere δ ( θ ) is acquired by subtracting the zero order term caused by the position of inductive probes and the first order term caused by installation eccentricity of precision test sphere, as expressed by Equation (7):
δ ( θ ) = i = 2 10 ( a i sin ( i θ ) + b i cos ( i θ ) ) .
As shown in Figure 8, the tilt error motion of the shaft can be calculated by Equation (8):
ε X ( θ ) = δ Y , L 1 ( θ ) δ Y , L 2 ( θ ) L 2 .
The radial error motion of the grating disk is calculated by the following equation:
δ Y ( θ ) = δ Y , L 1 ( θ ) ε X ( θ ) × L 1 = L 2 L 1 L 2 δ Y , L 1 ( θ ) + L 1 L 2 δ Y , L 2 ( θ ) ,
where L 1 is the distance between the center of the sphere on the top of the rotating shaft and the grating disk, and L 2 is the distance between the center of two spheres.

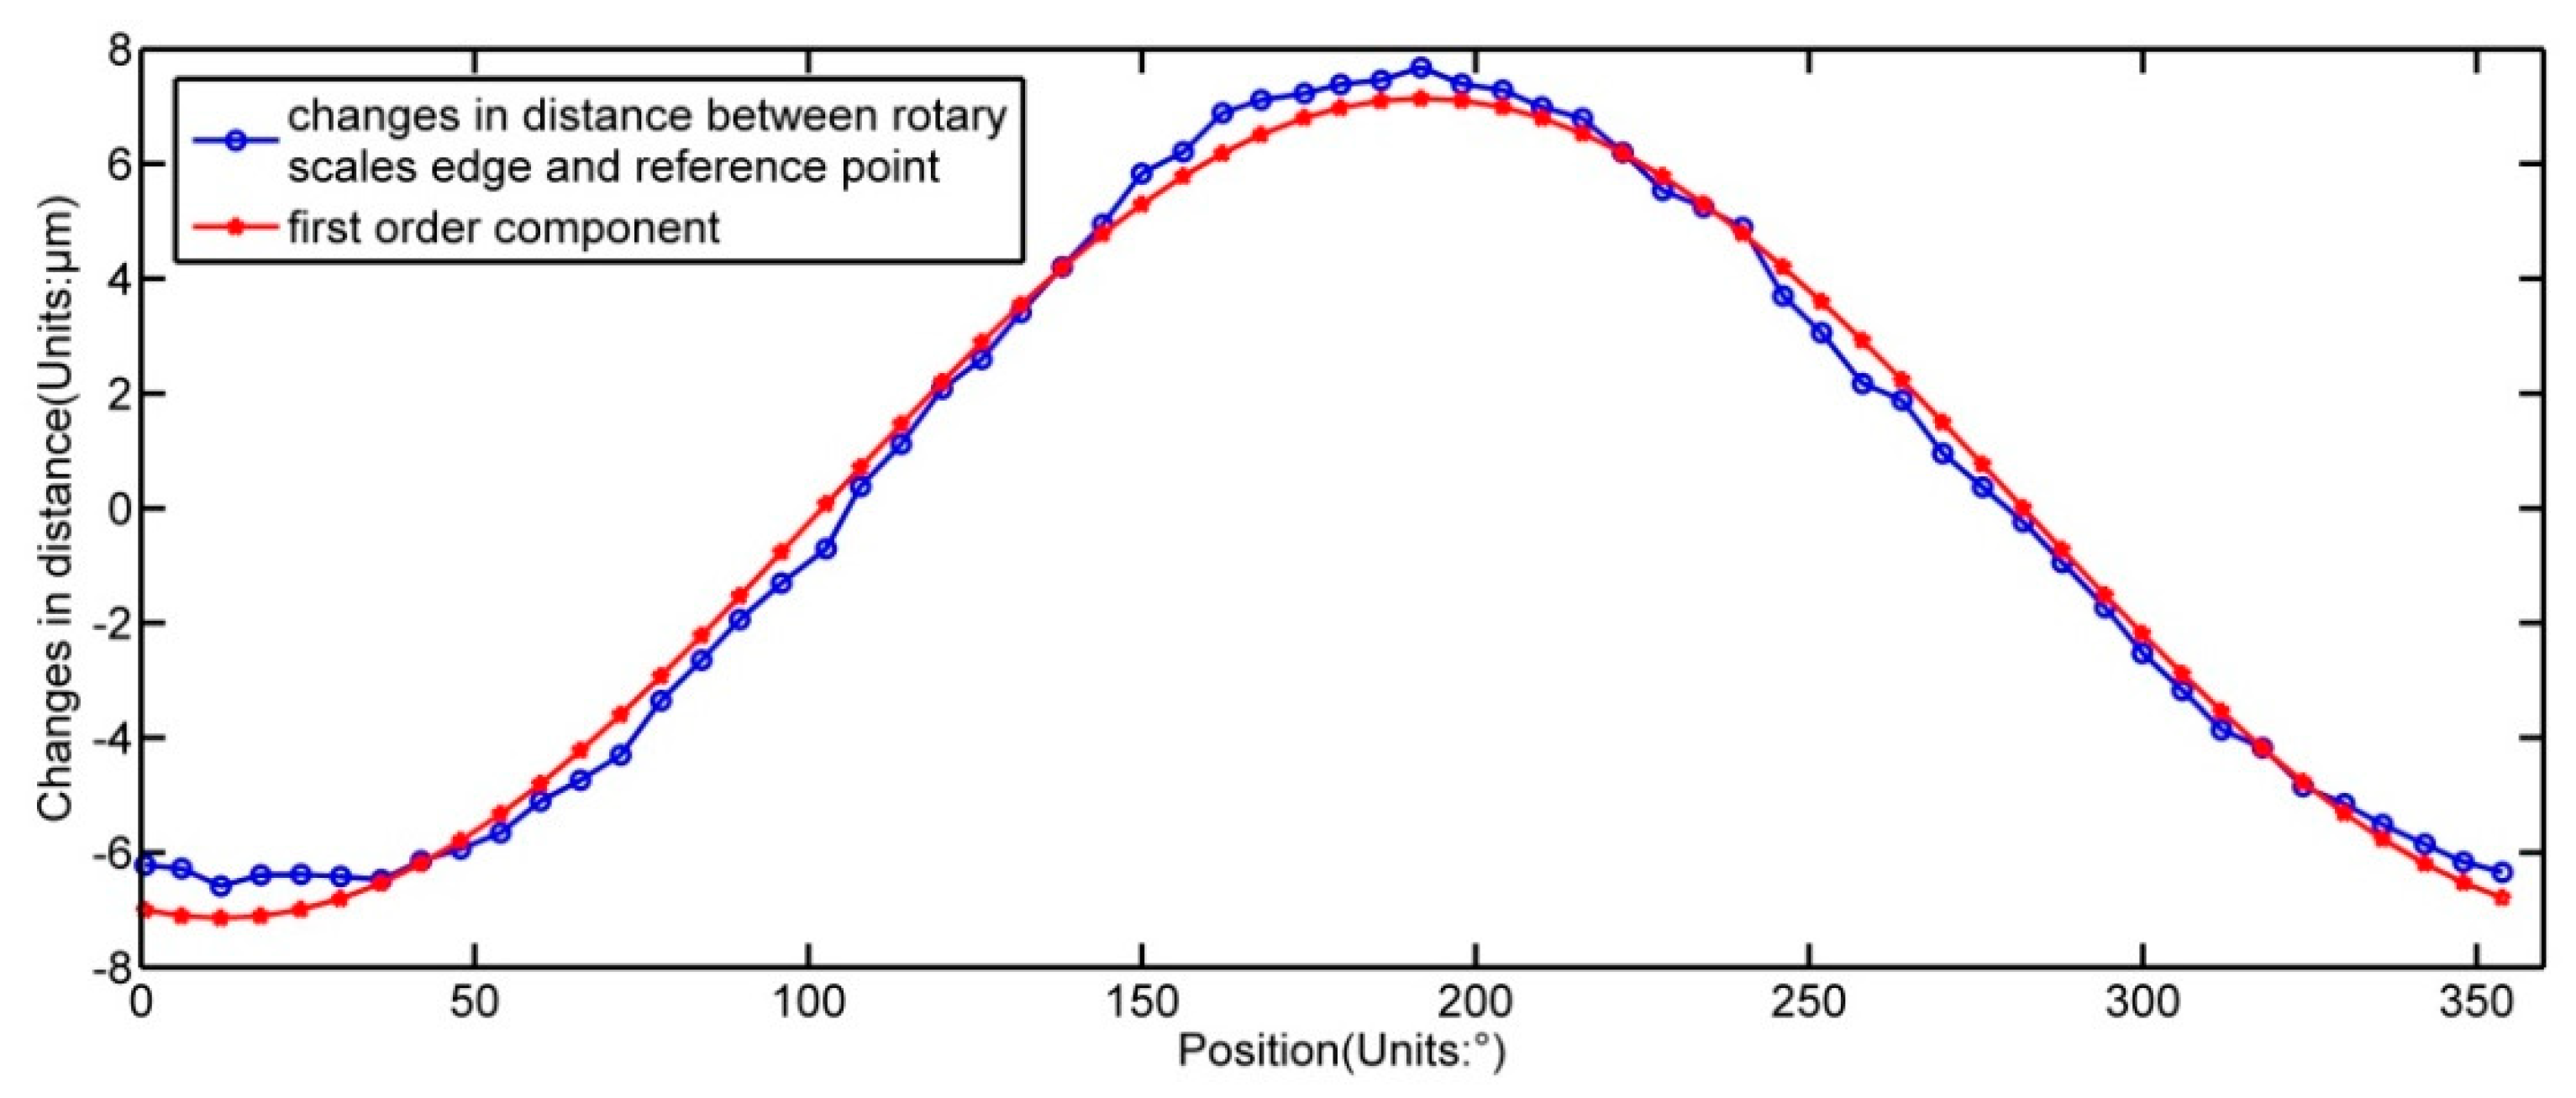
4.2. Installation Eccentricity Detection

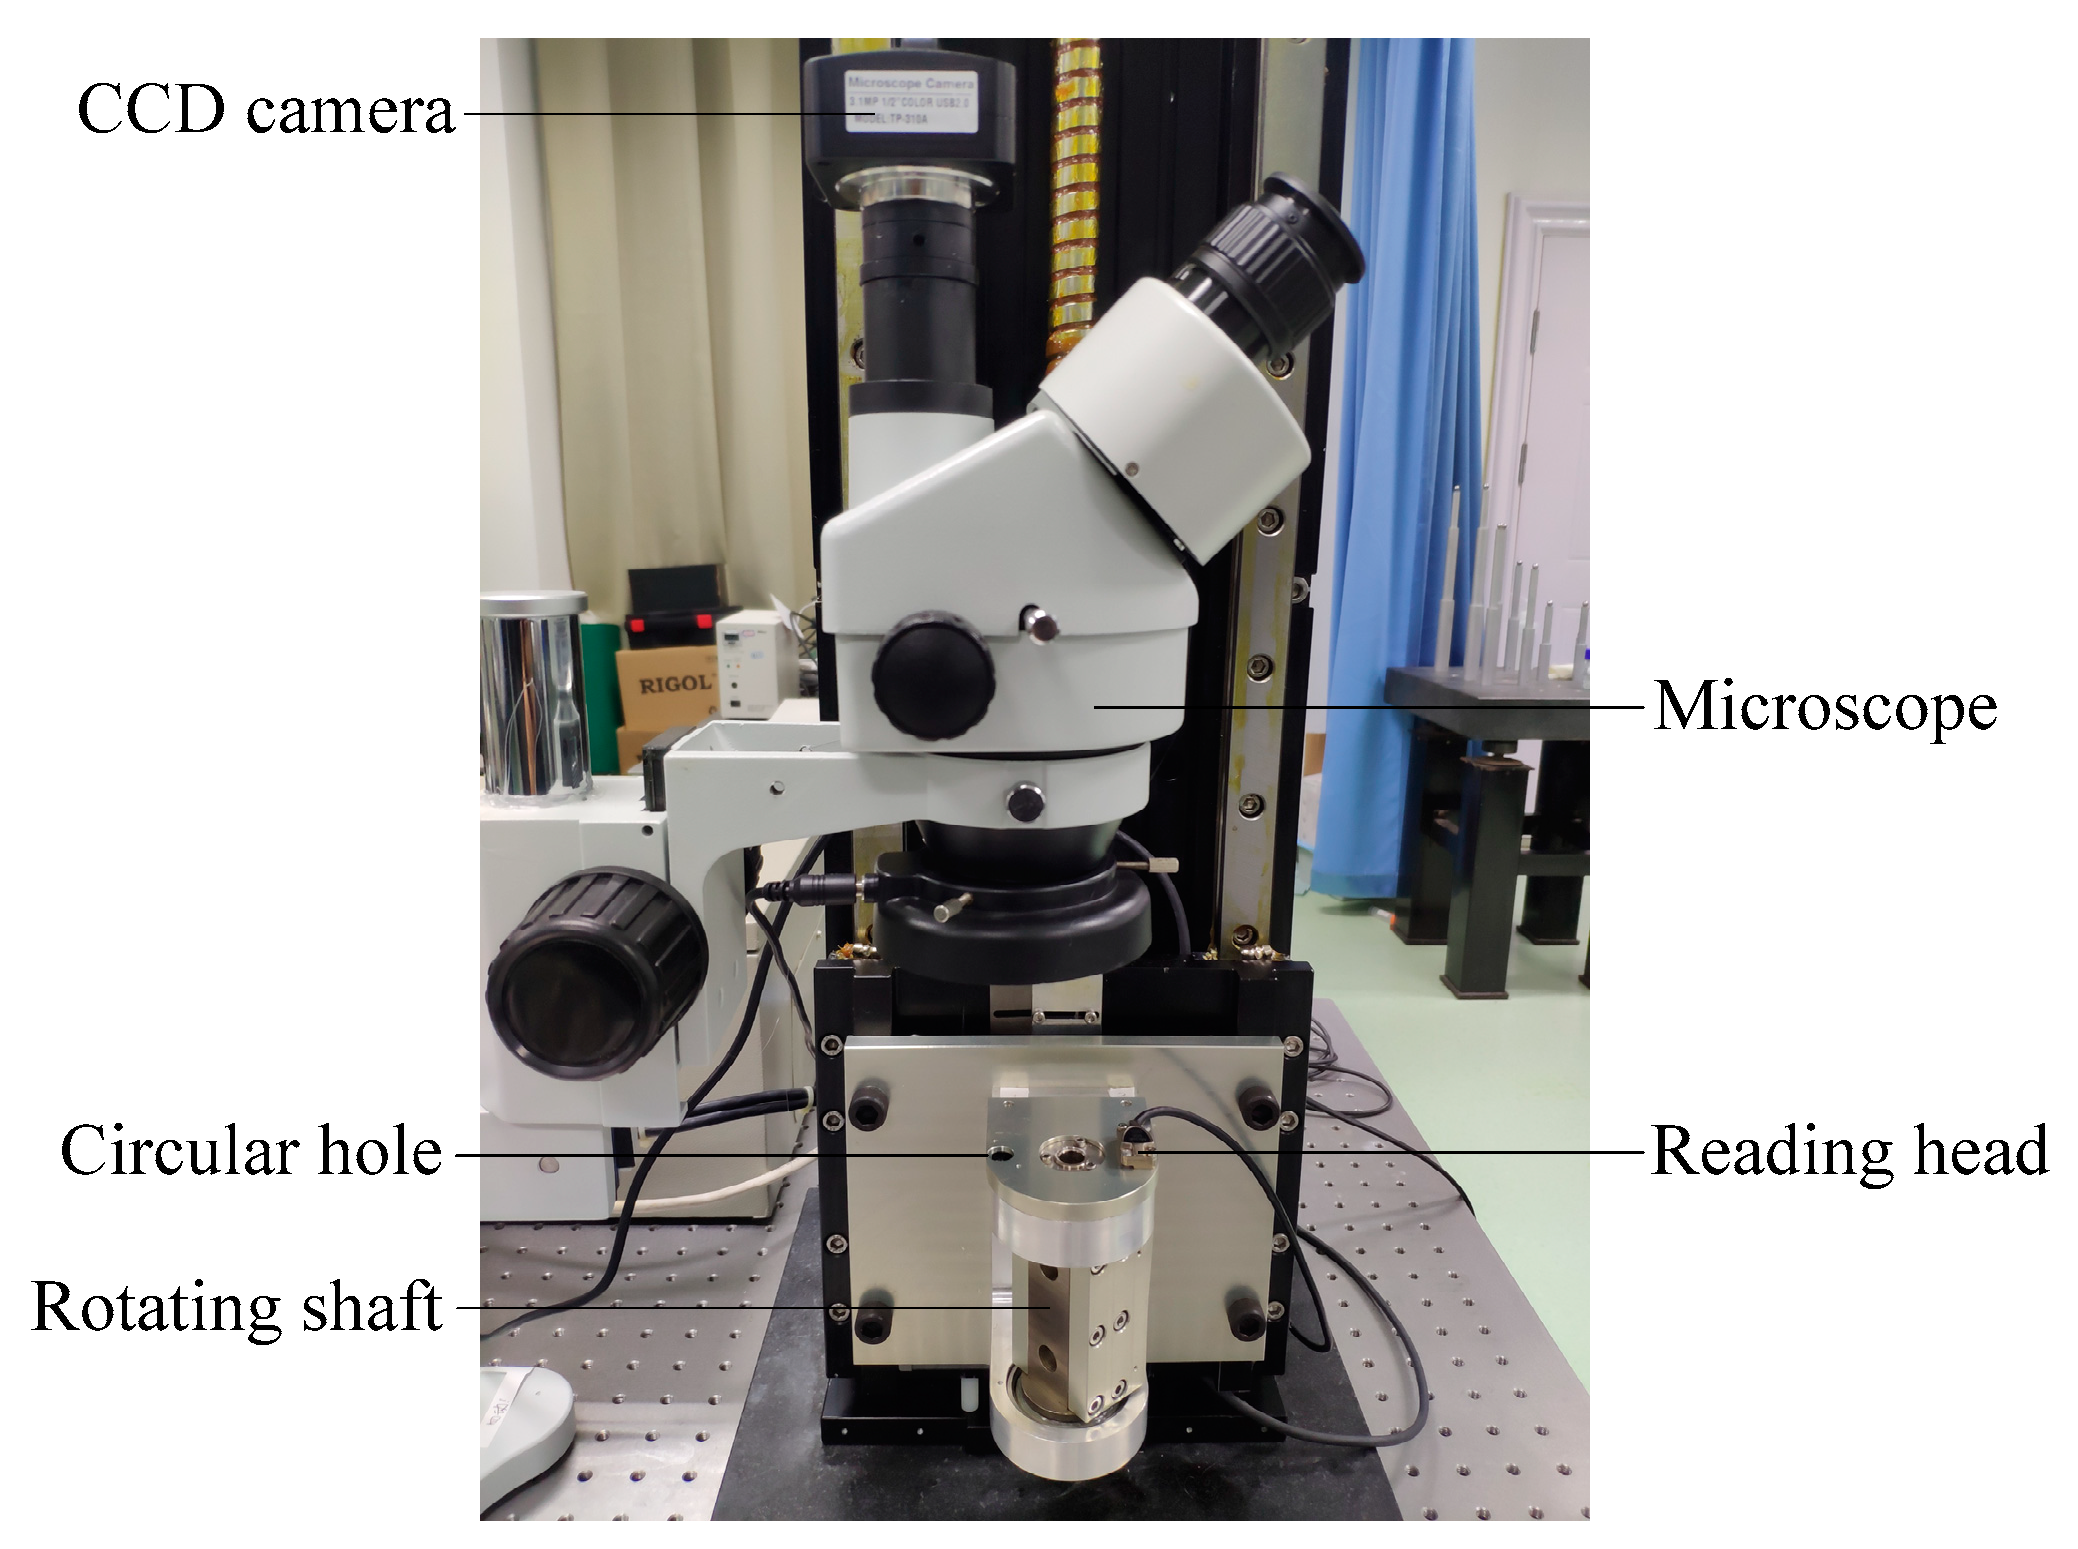
4.2.1. The Principle of Detecting Installation Eccentricity

The experimental device and the method to detect the eccentricity amplitude and direction are introduced in this section. As shown in Figure 9, a CCD camera is mounted on the microscope. A circular hole is symmetrical to the reading head with the rotating shaft. The microscope is adjusted to make sure that the hole is just in the middle of the field of view.
At every 6 degrees, the CCD camera gets the images of the radial grating, and, meanwhile, the rotation angles are measured by the rotary encoder. The coordinate of the geometric center of the grating disk and the radius of the fitting circle of the rotary scales edge at each position can be calculated by using the image processing technology. Figure 10 shows the geometric relationships of the parameters calculated by the image processing technology. The middle point in pictures is set as reference point R ( x r , y r ) , and then the distance between the grating geometric center and the reference point is calculated, which is named l . The radius of fitting circle of rotary scales edge, which we named r f i t t i n g , is already known. The distance between rotary scales edge and reference point called d r e f can be calculated by the equation d r e f = l r f i t t i n g , and for every position, we get data d r e f k , k = 1 , 2 , , 60 .
The function d r e f ( θ ) can be developed as a 10 order Fourier series, represented by Equation (10):
d r e f ( θ ) = c 0 + i = 1 10 ( c i sin ( i θ ) + d i cos ( i θ ) ) .
The parameters c 0 , c 1 , d 1 , , c 10 , d 10 can be calculated by using the least-square fitting method from data d r e f k , k = 1 , 2 , , 60 . The first harmonic is caused by the installation eccentricity of the grating disk, so the magnitude of eccentricity e can be calculated by Equation (11):
e = c 1 2 + d 1 2 .
The phase of eccentricity θ 0 can be expressed as Equation (12):
θ 0 = { arctan ( c 1 d 1 ) , d 1 > 0 arctan ( c 1 d 1 ) + π , d 1 < 0 0 , c 1 = 0    d 1 = 1 π , c 1 = 0    d 1 = 1 .

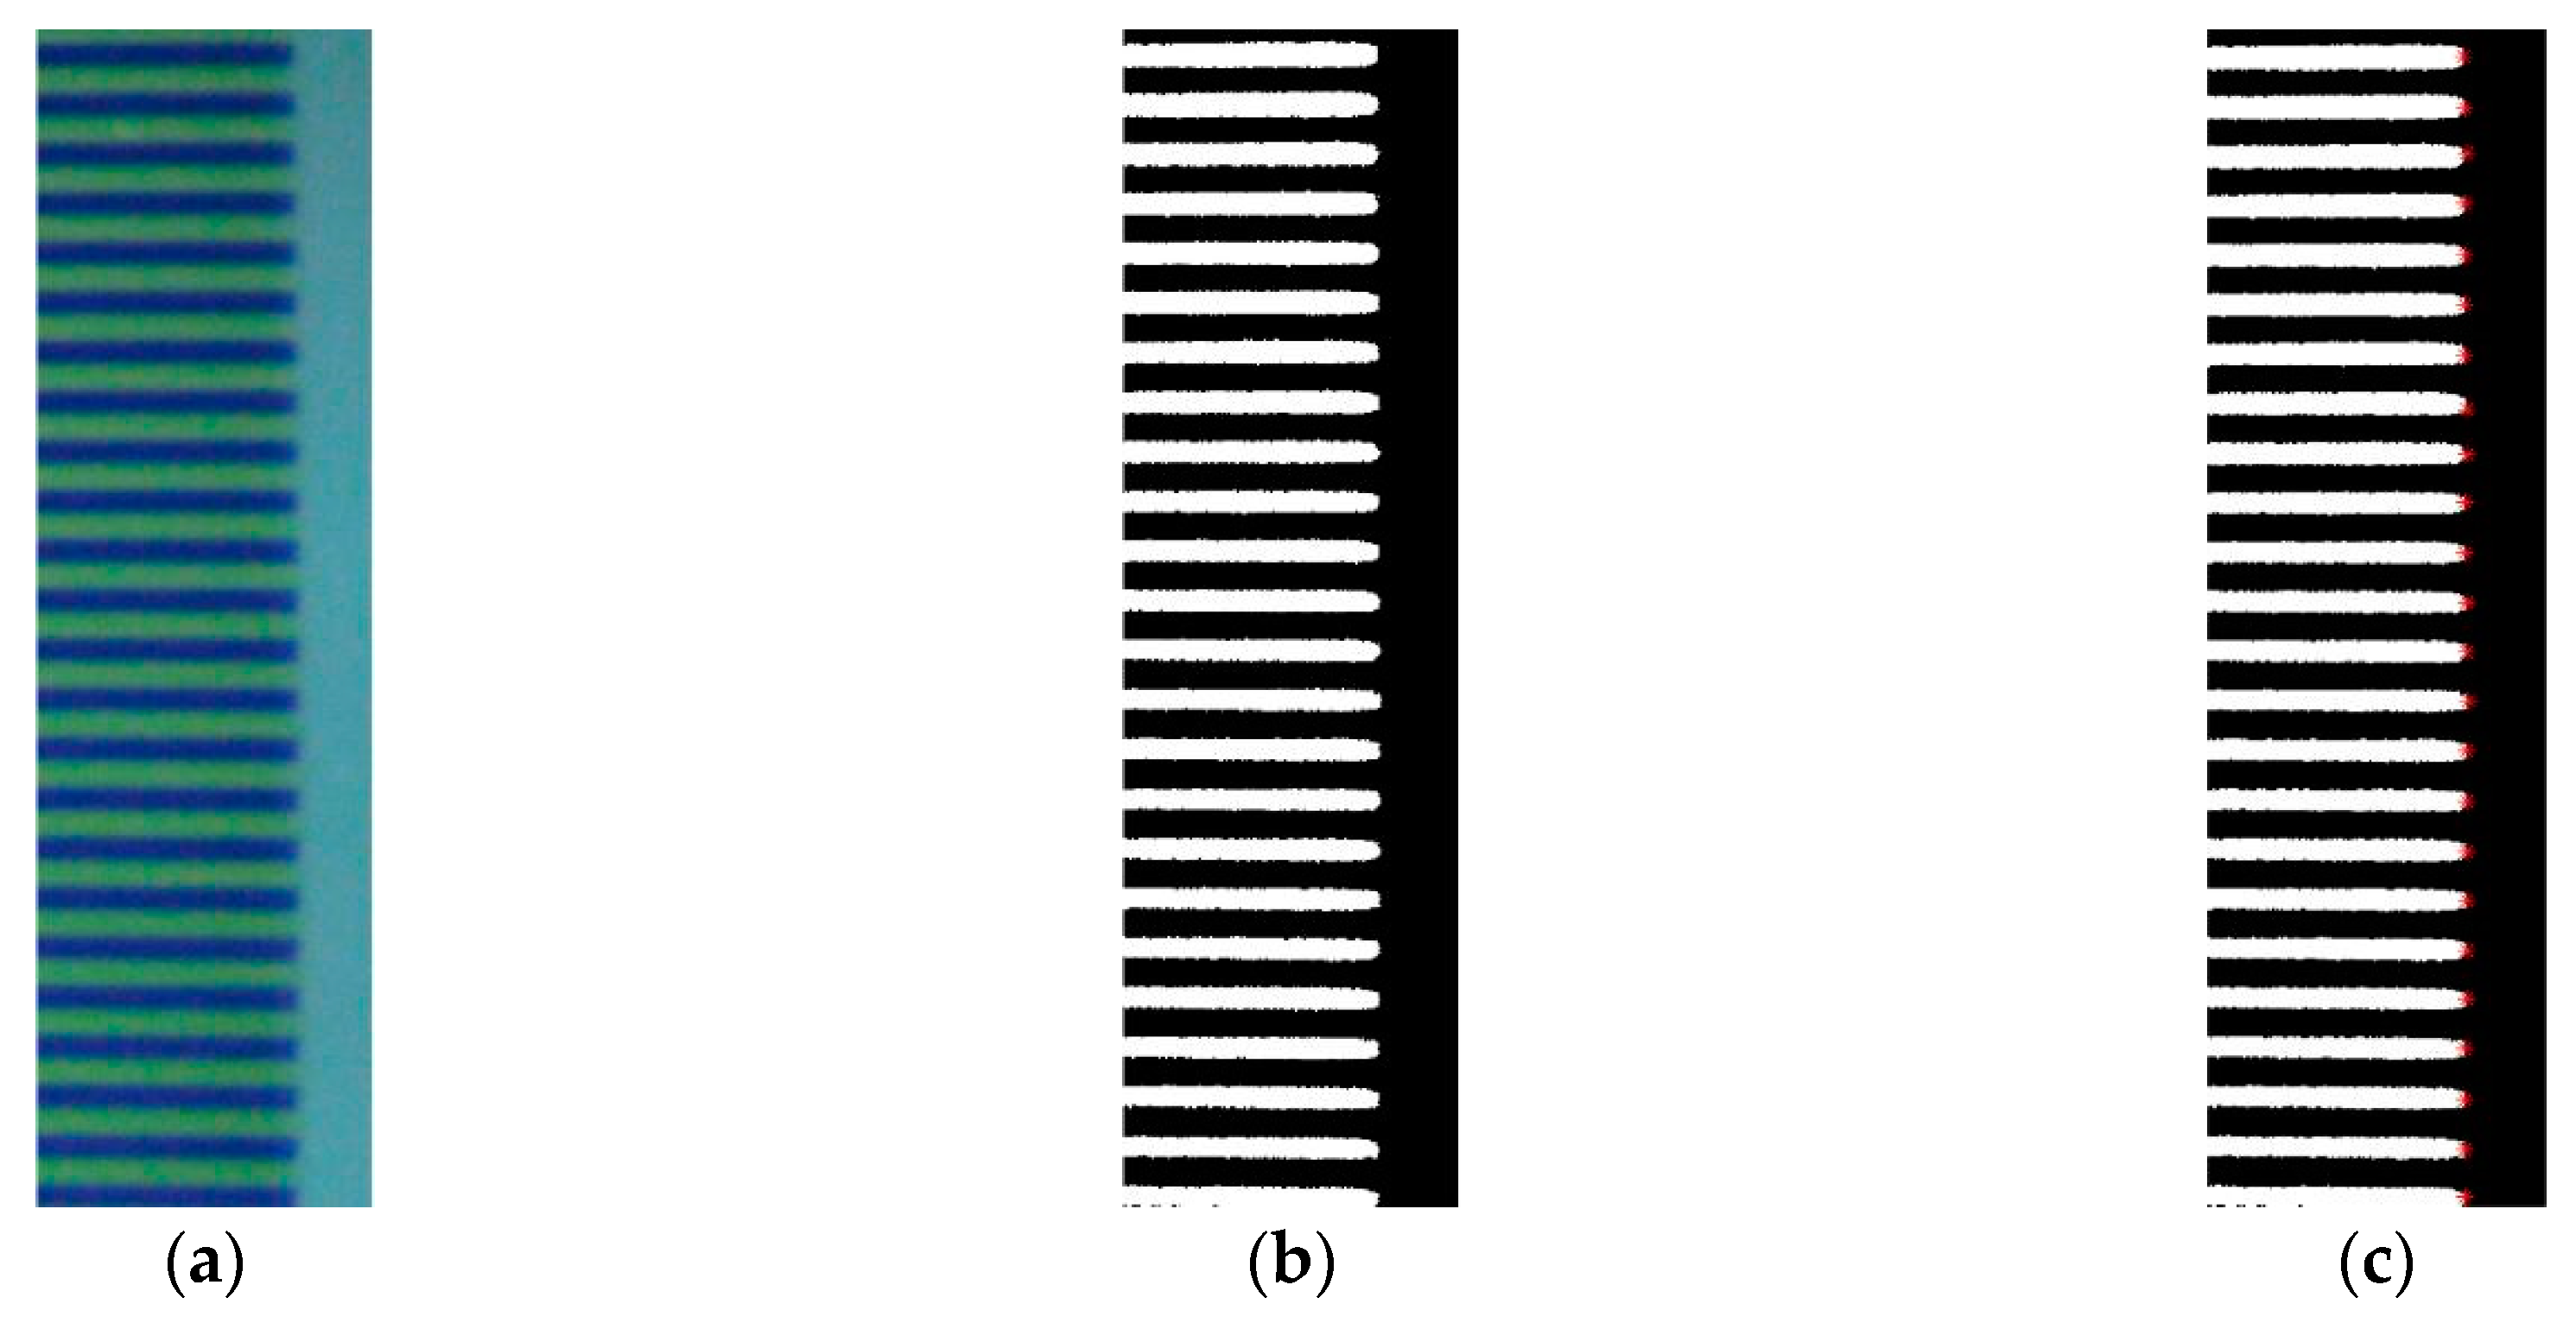
4.2.2. Image Processing Technology

Detailed information about the image processing technology used to get the coordinate of the grating geometric center and the radius of the fitting circle of the rotary scales edge is introduced in this section.
For each image, the true-color image is converted to a greyscale image, the grayscale histogram of grayscale image is extracted, and then the greyscale image is converted to a binary image, because the binary image can be more convenient for edge extraction and morphological operation. The value of the binary image is reversed for convenience of subsequent calculations. The binary image is separated into several parts, and each part is composed of pixels whose value are “1”. The threshold value is set to remove the small parts that are caused by noise and dust. The remaining parts are composed of rotary scales. Then the middle point coordinate of the right edge of each part is calculated. The images of rotary scales are shown in Figure 11.
The circle is fitted by using the least square method. The coordinate of the center of the fitting circle of the rotary scales edge, which is also the center of the grating disk O p k ( x k , y k ) and radius of the fitting circle of the rotary scales edge r p _ f i t t i n g k are calculated. The original picture size is 2048*1536, and the coordinate of the reference point is R ( 1024 , 768 ) , so then l p _ k and d p _ r e f k can be calculated, k = 1 , 2 60 .
Because the pixel value is small, it is hard to calibrate with a conventional checkerboard. Grating period is 20 μm is known from the datasheet, the number of pixels of three grating periods near the edge along the Y direction is counted, which named m p , m p = 90 , the distance of each pixel is 0.667 μm, so the distance between the rotary scales edge and reference point d r e f k is represented by Equation (13):
d r e f k = 0.667 × d p _ r e f k .

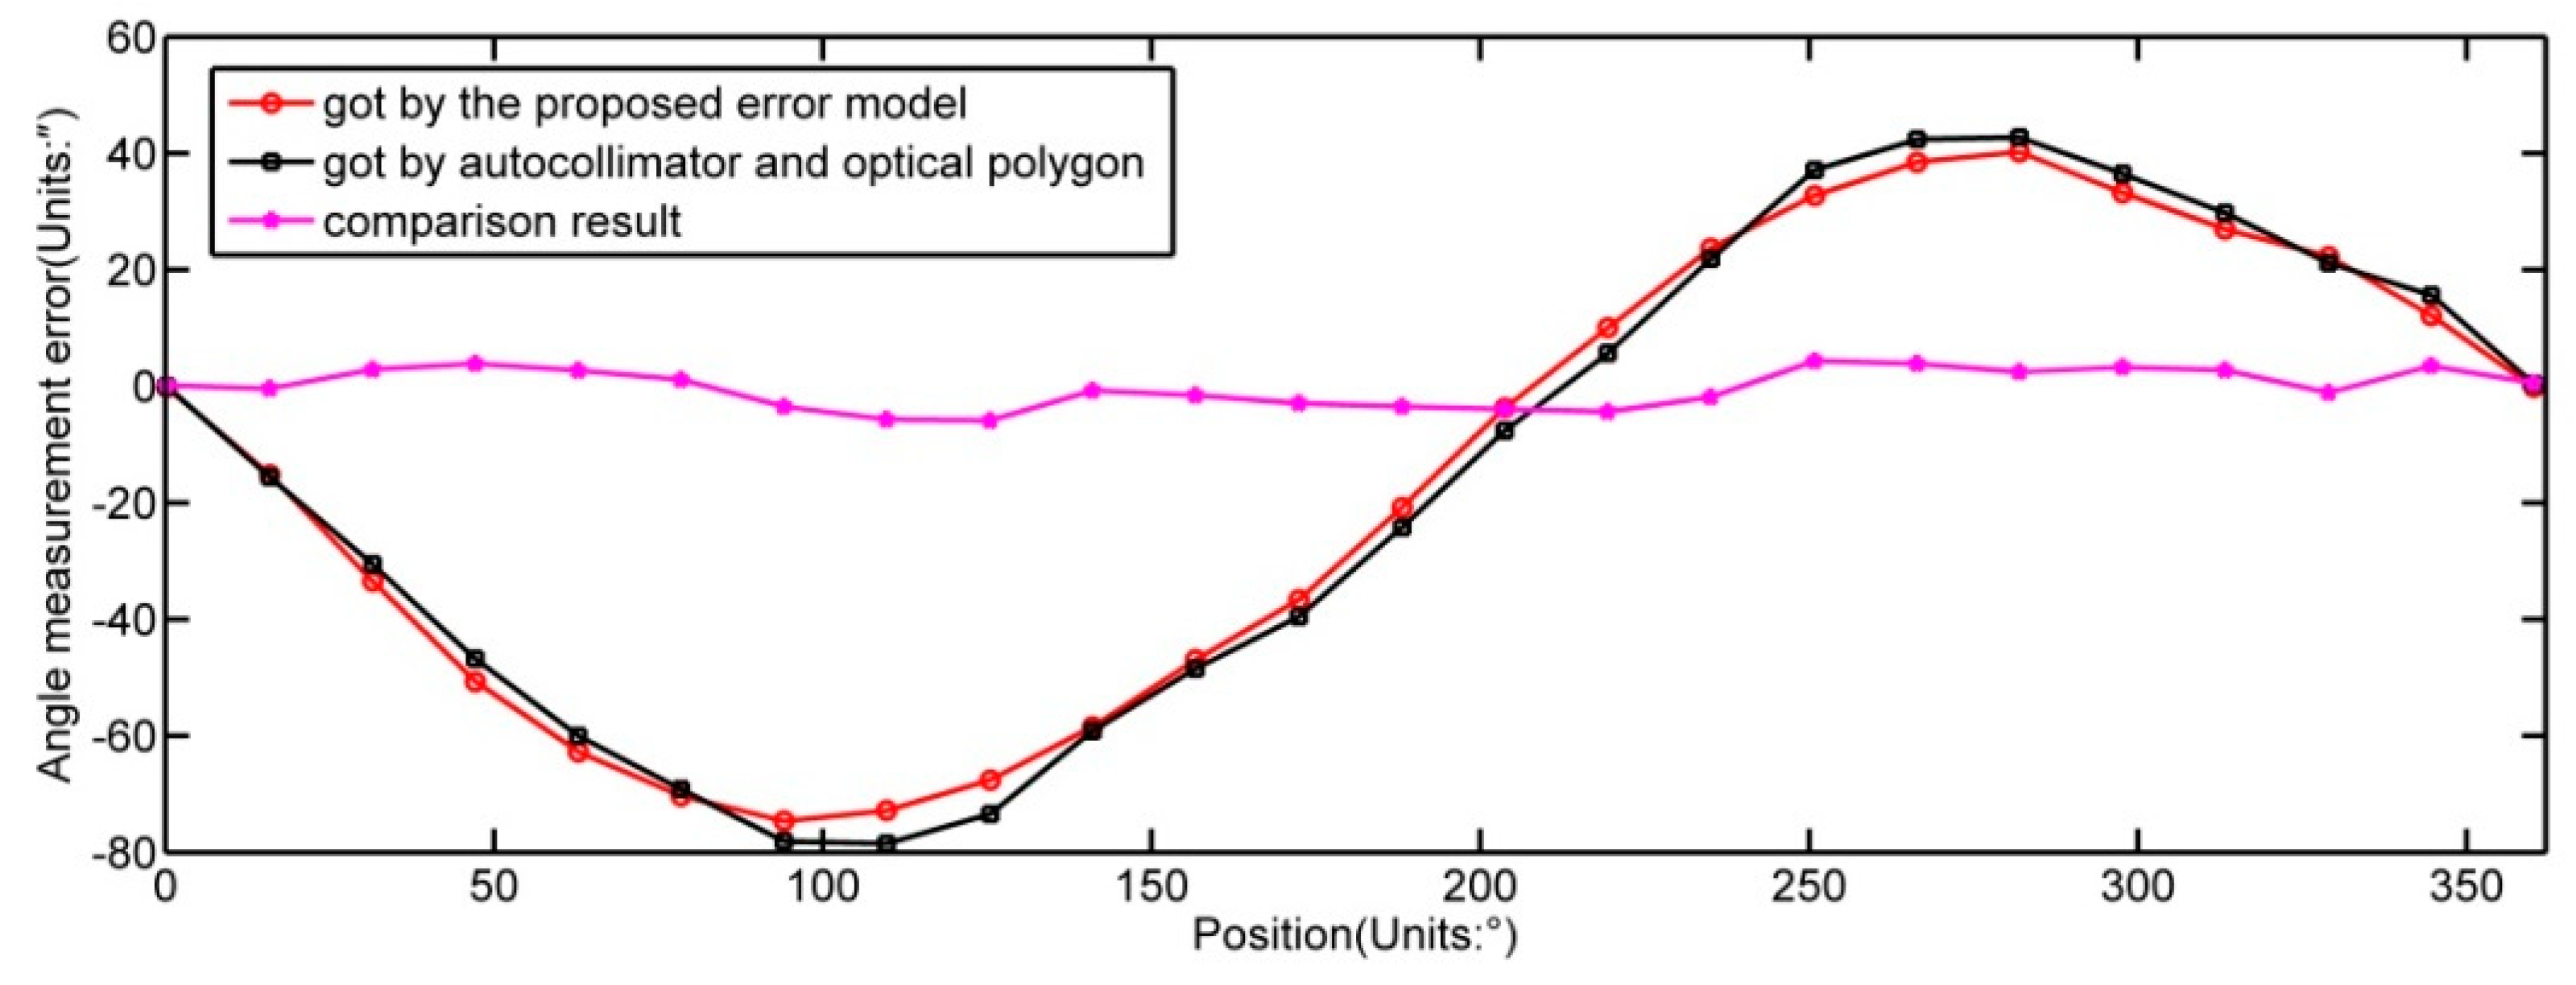
4.3. Verification Method

As shown in Figure 12, the optical polygon with 23 faces is used as the reference angle artefact. The rotating shaft and regular optical polygon are connected with a clamp. The small eccentric installation of the optical polygon will not cause the measurement error of the autocollimator (TRIOPTICS Company, Wedel, Germany, model TriAngle US 300-57; resolution: 0.005″; accuracy: 0.25″). The mating surface of the optical polygon and rotating component are parallel to each other and orthogonal to the axis average line of the rotating component. The autocollimator is adjusted to aim at the optical polygon. The actual angle can be obtained by the use of the autocollimator and optical polygon. The actual angle subtracted from the angle obtained by the rotary encoder is the angle measurement error. Put the angles obtained by rotary encoder θ into the angle measurement error model Δ θ , and we get the residual error after comparison.

5. Results

According to the design sizes of the rotation joint, L 1 = 6.81 mm ,   L 2 = 122.96 mm . Both the radial error motion of the precision test spheres fixed on the rotating shaft and the radial error motion of the grating disk along the direction of the reading head δ Y ( θ ) are shown in Figure 13. The experiments are repeated three times. The repeated experiment results show that the range of radial error δ Y ( θ ) n at the same position is 0.3   μ m , the standard deviation of δ Y ( θ ) is calculated by range-method, σ δ Y ( θ ) = δ Y ( θ ) n / d n , where n = 3 , d n = 1.69 . So σ δ Y ( θ ) = 0.18   μ m . The uncertainty is equal to standard deviation, so the uncertainty of radial error motion u δ Y ( θ ) is equal to 0.18   μ m .
The harmonics of d r e f k , which removed constant term, and the first harmonic of d r e f k are shown in Figure 14. From Equation (11), e = 7.1   μ m , and from Equation (12), θ 0 = 192.08 ° . The results show that the range of e is 0.4   μ m , so the uncertainty of amplitude of eccentricity u e = σ e = e n / d n = 0.24   μ m . The range of θ 0 is 1.91 ° , and the uncertainty of phase of eccentricity u θ 0 = 1.13 ° .
The parameter r is known from the datasheet, and the parameters e , θ 0 , and variable δ Y ( θ ) are known. The angle measurement error caused by the installation eccentricity and radial error motion Δ θ is calculated by Equation (5), as shown in Figure 15.
In Figure 16, the comparison of angle measurement errors obtained through the use of an autocollimator with an optical polygon and the method proposed in this article is shown. Both curves are close to each other, with residual errors within ±6″. The residual errors account for 9% in angle measurement error.

6. Discussion

The error sources are detected, and the error model is built to improve the angle measurement accuracy. The method of using visual system and image processing technology is proposed to detect the installation eccentricity. It is found that the installation eccentricity of the grating disk and the radial error motion of the rotating shaft along the direction of the reading head are the main causes to the angle measurement error of the rotation joint from Equation (5). The angle measurement error caused by the installation eccentricity is the main part because the radial error motions are very small, as shown in Figure 15. Meanwhile, imperfect manufacturing of the grating disk and other minor errors also cause angle measurement error. The random errors affect the angle measurement accuracy of rotary encoders. The random error of radial error motion is a main part of the whole. The angle measurement accuracy of rotary encoders can be improved obviously by reducing the random error of radial error motion after compensating the systematic errors. This study focuses on the influence of the installation eccentricity of the grating disk and the radial error motion of the rotating shaft, which exist due to the imperfect installation of the grating disk and imperfect manufacturing and assembly of the machine parts.
An angle measurement error can be predicted if the installation eccentricity and radial error motions are known. The theory can be applied to the design and assembly processes of precision rotating shafts. Regarding the design aspect, one can reduce the distance between the grating disk and the bearing, which is close to grating disk, so as to reduce the radial error motion of the grating disk. Regarding the assembly aspect, the visual system and image processing technology is especially suited for detecting the installation eccentricity during the assembly process. Detecting the eccentricity of the grating disk and adjusting the grating disk can reduce the angle measurement error effectively.
In future work, correction of the angle measurement error of the rotation joint induced by temperature change will be regarded as the research key to improve the angle measurement accuracy when precision coordinate measuring instruments that contain a rotation joint are working in different ambient temperature.

7. Conclusions

In this paper, a novel model of angle measurement error derived from the installation eccentricity of the grating disk and the radial error motion of the rotating shaft is built by integrating the differences of optical radius when the grating disk rotates in actual condition and ideal condition. The accuracy of this theoretical analysis is experimentally verified, the residual error which within ±6″ accounts for 9% of angle measurement error. The angle measurement error can be predicted if the installation eccentricity and radial error motion are known.

Author Contributions

H.-K.J. built the error model; H.-K.J. and L.-D.Y. conceived of and designed the experiment; Y.-Z.J. designed the computer programs; H.-N.Z. analyzed the data; H.-K.J. and L.-D.Y. wrote the paper.

Funding

This research is supported by National Natural Science Foundation of China (Grant No: 51805139 and 51875165) and Project 111 (Grant No: B12019). The authors would like to thank all other members of the research team for their contributions to this research.

Conflicts of Interest

The authors declare no conflict of interest.

References

  1. Schmitt, R.; Peterek, M.; Morse, E.; Knapp, W.; Galetto, M.; Härtig, F.; Goch, G.; Hughes, B.; Forbes, A.; Estler, W. Advances in large-scale metrology–review and future trends. CIRP Ann. 2016, 65, 643–665. [Google Scholar] [CrossRef]
  2. Yu, L.D.; Zhao, H.N.; Zhang, W.; Li, W.S.; Deng, H.X.; Song, Y.T.; Gu, Y.Q. Development of precision measurement network of experimental advanced superconducting tokamak. Opt. Eng. 2014, 53, 122406. [Google Scholar] [CrossRef] [Green Version]
  3. Zheng, D.T.; Yin, S.F.; Luo, Z.Y.; Zhang, J.; Zhou, T.P. Measurement accuracy of articulated arm cmms with circular grating eccentricity errors. Meas. Sci. Technol. 2016, 27, 115011. [Google Scholar] [CrossRef]
  4. Gao, G.B.; Wang, W.; Lin, K.; Chen, Z.C. Error compensation and parameter identification of circular grating angle sensors. Opt. Precis. Eng. 2010, 18, 1766–1772. [Google Scholar]
  5. Hong, X.; Xu, Z.J.; Yang, N. Error compensation of optical encoder based on rbf network. Opt. Precis. Eng. 2008, 16, 598–604. [Google Scholar]
  6. Deng, F.; Chen, J.; Wang, Y.Y.; Gong, K. Measurement and calibration method for an optical encoder based on adaptive differential evolution-fourier neural networks. Meas. Sci. Technol. 2013, 24, 055007. [Google Scholar] [CrossRef]
  7. Geckeler, R.D.; Fricke, A.; Elster, C. Calibration of angle encoders using transfer functions. Meas. Sci. Technol. 2006, 17, 2811. [Google Scholar] [CrossRef]
  8. Mancini, D.; Auricchio, A.; Brescia, M.; Cascone, E.; Cortecchia, F.; Schipani, P.; Spirito, G. Encoder System Design: Strategies for Error Compensation; Telescope Control Systems III, 1998; International Society for Optics and Photonics: Bellingham, WA, USA, 1998; pp. 380–387. [Google Scholar]
  9. Geckeler, R.D.; Link, A.; Krause, M.; Elster, C. Capabilities and limitations of the self-calibration of angle encoders. Meas. Sci. Technol. 2014, 25, 055003. [Google Scholar] [CrossRef] [Green Version]
  10. Jiao, Y.; Dong, Z.G.; Ding, Y.; Liu, P.K. Optimal arrangements of scanning heads for self-calibration of angle encoders. Meas. Sci. Technol. 2017, 28, 105013. [Google Scholar] [CrossRef] [Green Version]
  11. Jiao, Y.; Ding, Y.; Dong, Z.G.; Huang, M.; Liu, P.K. Optimal-arrangement-based four-scanning-heads error separation technique for self-calibration of angle encoders. Meas. Sci. Technol. 2018, 29. [Google Scholar] [CrossRef]
  12. Li, Y.T.; Fan, K.C. A novel method of angular positioning error analysis of rotary stages based on the abbe principle. Proc. Inst. Mech. Eng. Part B J. Eng. Manuf. 2017, 232. [Google Scholar] [CrossRef]
  13. Lou, Z.F.; Xue, P.F.; Zheng, Y.S.; Fan, K.C. An analysis of angular indexing error of a gear measuring machine. Appl. Sci. 2018, 8, 169. [Google Scholar] [CrossRef]
  14. Lou, Z.F.; Hao, X.P.; Cai, Y.D.; Lu, T.F.; Wang, X.D.; Fan, K.C. An embedded sensor system for real-time detecting 5-DOF error motions of rotary stages. Sensors 2019, 19, 2855. [Google Scholar] [CrossRef] [PubMed]
  15. ISO 230-7:2015 I. Test Code for Machine Tools—Part 7: Geometric Accuracy of Axes of Rotation; ISO: Geneva, Switzerland, 2015. [Google Scholar]
  16. ANIS/ASME B89.3.4-2010. Axes of Rotation: Methods for Specifying and Testing; ASME: New York, NY, USA, 2010. [Google Scholar]
  17. Liu, C.H.; Jywe, W.Y.; Shyu, L.H.; Chen, C.J. Application of a diffraction grating and position sensitive detectors to the measurement of error motion and angular indexing of an indexing table. Precis. Eng. 2005, 29, 440–448. [Google Scholar] [CrossRef]
  18. Fujimaki, K.; Mitsui, K. Radial error measuring device based on auto-collimation for miniature ultra-high-speed spindles. Int. J. Mach. Tools Manuf. 2007, 47, 1677–1685. [Google Scholar] [CrossRef]
  19. Castro, H.F.F.d. A method for evaluating spindle rotation errors of machine tools using a laser interferometer. Measurement 2008, 41, 526–537. [Google Scholar] [CrossRef]
  20. Anandan, K.P.; Ozdoganlar, O.B. A multi-orientation error separation technique for spindle metrology of miniature ultra-high-speed spindles. Precis. Eng 2016, 43, 119–131. [Google Scholar] [CrossRef] [Green Version]
Figure 1. Error motions of axis of rotation.
Applsci 09 03415 g001
Figure 2. Rotation joint of parallel dual-joint coordinate measuring machine.
Applsci 09 03415 g002
Figure 3. Rotary encoder works in ideal condition.
Applsci 09 03415 g003
Figure 4. Rotary encoder works in condition with installation eccentricity.
Applsci 09 03415 g004
Figure 5. Rotary encoder works in condition with radial error motion.
Applsci 09 03415 g005
Figure 6. Rotary encoder works in actual condition.
Applsci 09 03415 g006
Figure 7. Experimental setup for radial error motion measurement.
Applsci 09 03415 g007
Figure 8. Relationships between the radial error motions of the grating disk and test spheres.
Applsci 09 03415 g008
Figure 9. Experimental setup for installation eccentricity detection.
Applsci 09 03415 g009
Figure 10. Geometrical relationships of the parameters calculated by image processing method.
Applsci 09 03415 g010
Figure 11. The cropped images of rotary scales: (a) true-color image; (b) binary image; and (c) middle point of right edge.
Applsci 09 03415 g011
Figure 12. Experimental setup for angle measurement error measurement.
Applsci 09 03415 g012
Figure 13. Results of radial error motion of spheres and grating disk along the direction of reading head.
Applsci 09 03415 g013
Figure 14. Results of d r e f k calculated by image processing technology.
Applsci 09 03415 g014
Figure 15. Results of angle measurement error caused by installation eccentricity and radial error motion.
Applsci 09 03415 g015
Figure 16. Comparison of angle measurement errors by different ways.
Applsci 09 03415 g016

