Article

Deformation Analysis of Large-Scale Rock Slopes Considering the Effect of Microseismic Events

1
State Key Laboratory of Hydraulics and Mountain River Engineering, College of Water Resource and Hydropower, Sichuan University, Chengdu 610065, China
2
China Three Gorges Projects Developments Co., Ltd., Beijing 100038, China
*
Author to whom correspondence should be addressed.
Appl. Sci. 2019, 9(16), 3409; https://doi.org/10.3390/app9163409
Submission received: 24 July 2019 / Revised: 15 August 2019 / Accepted: 16 August 2019 / Published: 19 August 2019
(This article belongs to the Section Civil Engineering)

Abstract

:
To research the macroscopic deformation of rock microseismic damage, a high-precision microseismic monitoring system was established on the left bank slope of the Baihetan hydropower station in Southwestern China. Based on the microseismic monitoring and field deformation data, the seismic source radius was applied to characterize the rock fracture scale. Numerical simulations introduced the rock micro-fracture information into the three-dimensional numerical model of the left bank slope and established the damage constitutive model. The unloading deformation process of the left bank abutment rock mass is described by numerical calculations. The feedback analysis method considering the effect of microseismic damage is preliminary exploratory research, which provides a new idea for the stability analysis of similar high rock slopes.

1. Introduction

Slope stability analysis is an old and complex subject. Slope stability analysis methods mainly include the engineering geological analysis, model testing, limit equilibrium, limit analysis and numerical simulation methods. A single evaluation cannot accurately assess the rock state of a slope. Many scholars combined different methods and considered different factors to analyze the surrounding rock stability. Conforti and Ietto [1] conducted an integrated method to research slope stability. Slope stability is affected by many factors. The slope security and stability show varying degrees of attenuation under external disturbances, such as rainfall, earthquakes, weathering and excavation. In particular, Ietto et al. [2] studied the effect of weathering characteristics on the stability of rock slopes. Li et al. [3] combined numerical simulation and on-site monitoring methods to evaluate the stability of a rock mass. Based on the gravity increasing method (GIM), Li et al. [4] established a micromechanical model for studying slope the stability and failure processes. Liu et al. [5] applied a combination of monitoring technology and construction dynamics to study the stability of surrounding rock deformation. Xu et al. [6] introduced microseismic monitoring technology to the stability analysis of the surrounding rock mass. Zhang et al. [7] conducted numerical simulations of the damaged area. The physical and mechanical properties of the internal weak structural plane tend to deteriorate due to these disturbances, which are the fundamental causes of slope instability. Therefore, the subsequent behavior of the slope is analyzed using parameters corresponding to the degree of rock failure; reasonable predictions are rendered via this analysis. However, the mechanical parameters of rock slopes are affected by factors such as various cracks in the internal rock mass structure, joints, weak interlayers and rock mass size effects. Based on laboratory measurements and field measurements alone, it is difficult to properly derive rock mass mechanical parameters under excavation disturbances. The keys to studying the stability of a slope are as follows: Correctly determine the mechanical parameters of the disturbed rock mass, and quantitatively analyze the rock mass damage. The feedback analysis method has thus emerged as a main trend in studies of the slope security and stability [8,9].
The quantitative evaluation of rock mass damage has a significant influence on the excavation process of the slope. Many scholars have conducted a series of studies. Feng et al. [10] established a new efficient method of intelligent feedback analysis of rock mass mechanical parameters by the intersection of multiple-technologies and multi-disciplinarity. The method can be used to track and analyze the stability of surrounding rock during excavation, and provides a new idea for the safe construction, monitoring and early warning of large slope engineering. Sheng et al. [11] used the high slope project of the Three Gorges ship lock as the background, established a numerical model considering the excavation influence, simulated excavation unloading of the high slope, optimized the results by using a neural network and genetic algorithm, and obtained the rock mass mechanical parameters and stress field. Wang et al. [12] studied the deterioration trend of the mechanical parameters of the surrounding rock mass after rock slope excavation, and analyzed the stress-strain status of the slope by using the parameters after deduction. Zhou et al. [13] studied the deterioration degree of the rock mass’s mechanical properties of the slope, disturbed by the excavation of the Three Gorges ship lock, using rock mass acoustic wave testing technology. Some scholars have discussed the uncertainty of geomechnial parameters. Bossi et al. [14] proposed a Boolean random generation method to quantify the error associated with simplifying the stratigraphic section of the geotechnical model, which is especially valuable for landslide stability evaluation. Monte Carlo type approaches have already been introduced to using the FLAC computer code. It is of great significance to accurately grasp the uncertain random distribution of rock parameters and to establish a reasonable model for the numerical simulation of slope stability evaluation. Pasculli et al. [15,16,17] had an in-depth discussion on the problem of considering parameter uncertainty in modeling. Based on Monte Carlo technique, Pasculli et al. [15,16,17] studied the uncertainty of rock’s mechanical parameters, established a numerical model and simulated slope stability by combining the finite difference method.
Although the current quantitative analysis of the surrounding rock mass in rock slopes has obtained some achievements, some problems, such as the prediction and quantitative evaluation of rock slope stability in complex geological conditions, have yet to be resolved thoroughly. For instance, the rock mass damage parameters chosen in the traditional analysis method rely on experiments, monitoring data and preliminary analysis; however, it is difficult to correctly establish the relationship among the experiment, the monitoring data and the parameters to be inverted. On the other hand, the data obtained using the conventional monitoring method indicates that there is a lag in the feedback analysis for the rock mass. Specifically, the rupture surface was formed inside the surrounding rock mass before applying the traditional monitoring method. Microseismic (MS) monitoring is a real-time dynamic monitoring method dedicated to micro-crack areas in surrounding rock mass. This method can be used to monitor the entire process from microcrack initiation, and aggregation to development. In recent years, MS monitoring technology has been widely applied for rock slope stability monitoring [18,19].
In the present study, the left bank slope of the Baihetan hydropower station was taken as the engineering background. Secondary development was performed via FLAC3D software that relies on the MS monitoring data [20]. Fast lagrangian analysis of continua (FLAC) is a continuous medium mechanics analysis software program developed by Itasca, one of the company′s most well-known software systems. FLAC3D is an extension of FLAC, including all the features of FLAC. FLAC3D can simulate the forces and deformations of engineering structures in three-dimensional rock masses and other media. The C computer programming language was utilized to compile the damage constitutive model, considering the fracture scale of rock [21]. The source radius of the MS data was applied as the input indicator. The information, including MS fracture data was imported to the three-dimensional numerical model. The numerical simulation results were compared with the field monitoring data with regard to the macroscopic deformation. The FLAC3D software was integrated with the MS monitoring data. The stress-strain conditions of the rock in fracture and damage status were better simulated. The functions of the FLAC3D software were expanded, providing a new idea for the quantitative evaluation of rock mass damage during the excavation of rock slopes.

2. Damage Constitutive Model Considering the Rock Fracture Scale

MS data obtained by the monitoring systems contain abundant source fracture information. Based on extensive research on MS waveform data, scholars have obtained source damage characteristic parameters related to seismic energy accumulation and release, such as the seismic moment, seismic magnitude, seismic energy, source radius, apparent stress, stress drop and seismic deformation. Cracks, joints and faults in a rock mass are discontinuities that greatly decrease the mechanical properties of the rock mass. In the present study, the source radius is used to represent the rock fracture scale, thus establishing a direct relationship between the rock fracture scale and rock failure. By considering the size and number of fractures, it is possible to determine an efficient method to estimate the compliance matrix of fractured rock mass based on micro-mechanics.
The constitutive relationship of the fractured rock mass mainly contains the intact rock strain and the fracture induced strain [22]. To study the fractured rock mass more conveniently, it can be divided into many representative volume elements (RVEs) as study objects [22]. Horii and Nemat-Nasser [23] proposed an overall estimate method for the instantaneous modulus based on the loading conditions when studying a linear, elastic and brittle solid with possible fractional sliding.
ε ¯ i = C ¯ i j σ ¯ j ,   i ,   j   =   1 ,   2 ,   3 6
In two dimensions, the flexibility matrix of the rock mass with randomly distributed joints can be written in Equation (2) [24]:
C ¯ i j = 1 E [ 1 + a 0 ν 0 ν 1 + a 0 0 0 0 2 ( 1 + ν ) + 2 a 0 ]
where E is the elastic modulus of the intact rock mass; ν is the Poisson′s ratio; a 0   is the damage variable of the rock mass fractures and can be expressed as follows:
a 0 = ω   ( 1   +   ω )
where ω is the fracture density of the rock mass and can be expressed as follows:
ω   = N π r 0 2 / V
where N is the number of micro-fractures in the unit volume; V is the volume of the unit; r 0 is the MS source radius.
In elastic mechanics, the displacement in the length direction can be considered equal to 0 if the length of the subject is much larger than the length in the other two directions, and the size and shape of each part are largely the same. This kind of displacement represents the plane strain problem. In planar problems, the stress, strain and displacement are functions that are independent of the length direction. As the profile of the left bank slope model is selected, it can be approximately simplified to a plane strain problem.
Based on Equation (2), Equation (5) is transformed to obtain the damage constitutive elastic matrix of the fractured rock mass under three-dimensional plane strain as follows:
C ¯ i j = 1 E [ 1 + a 0 ν ν 0 0 0 ν 1 ν 0 0 0 ν ν 1 + a 0 0 0 0 0 0 0 2 ( 1 + ν ) 0 0 0 0 0 0 2 ( 1 + ν ) + 2 a 0 0 0 0 0 0 0 2 ( 1 + ν ) ]

3. Engineering Background

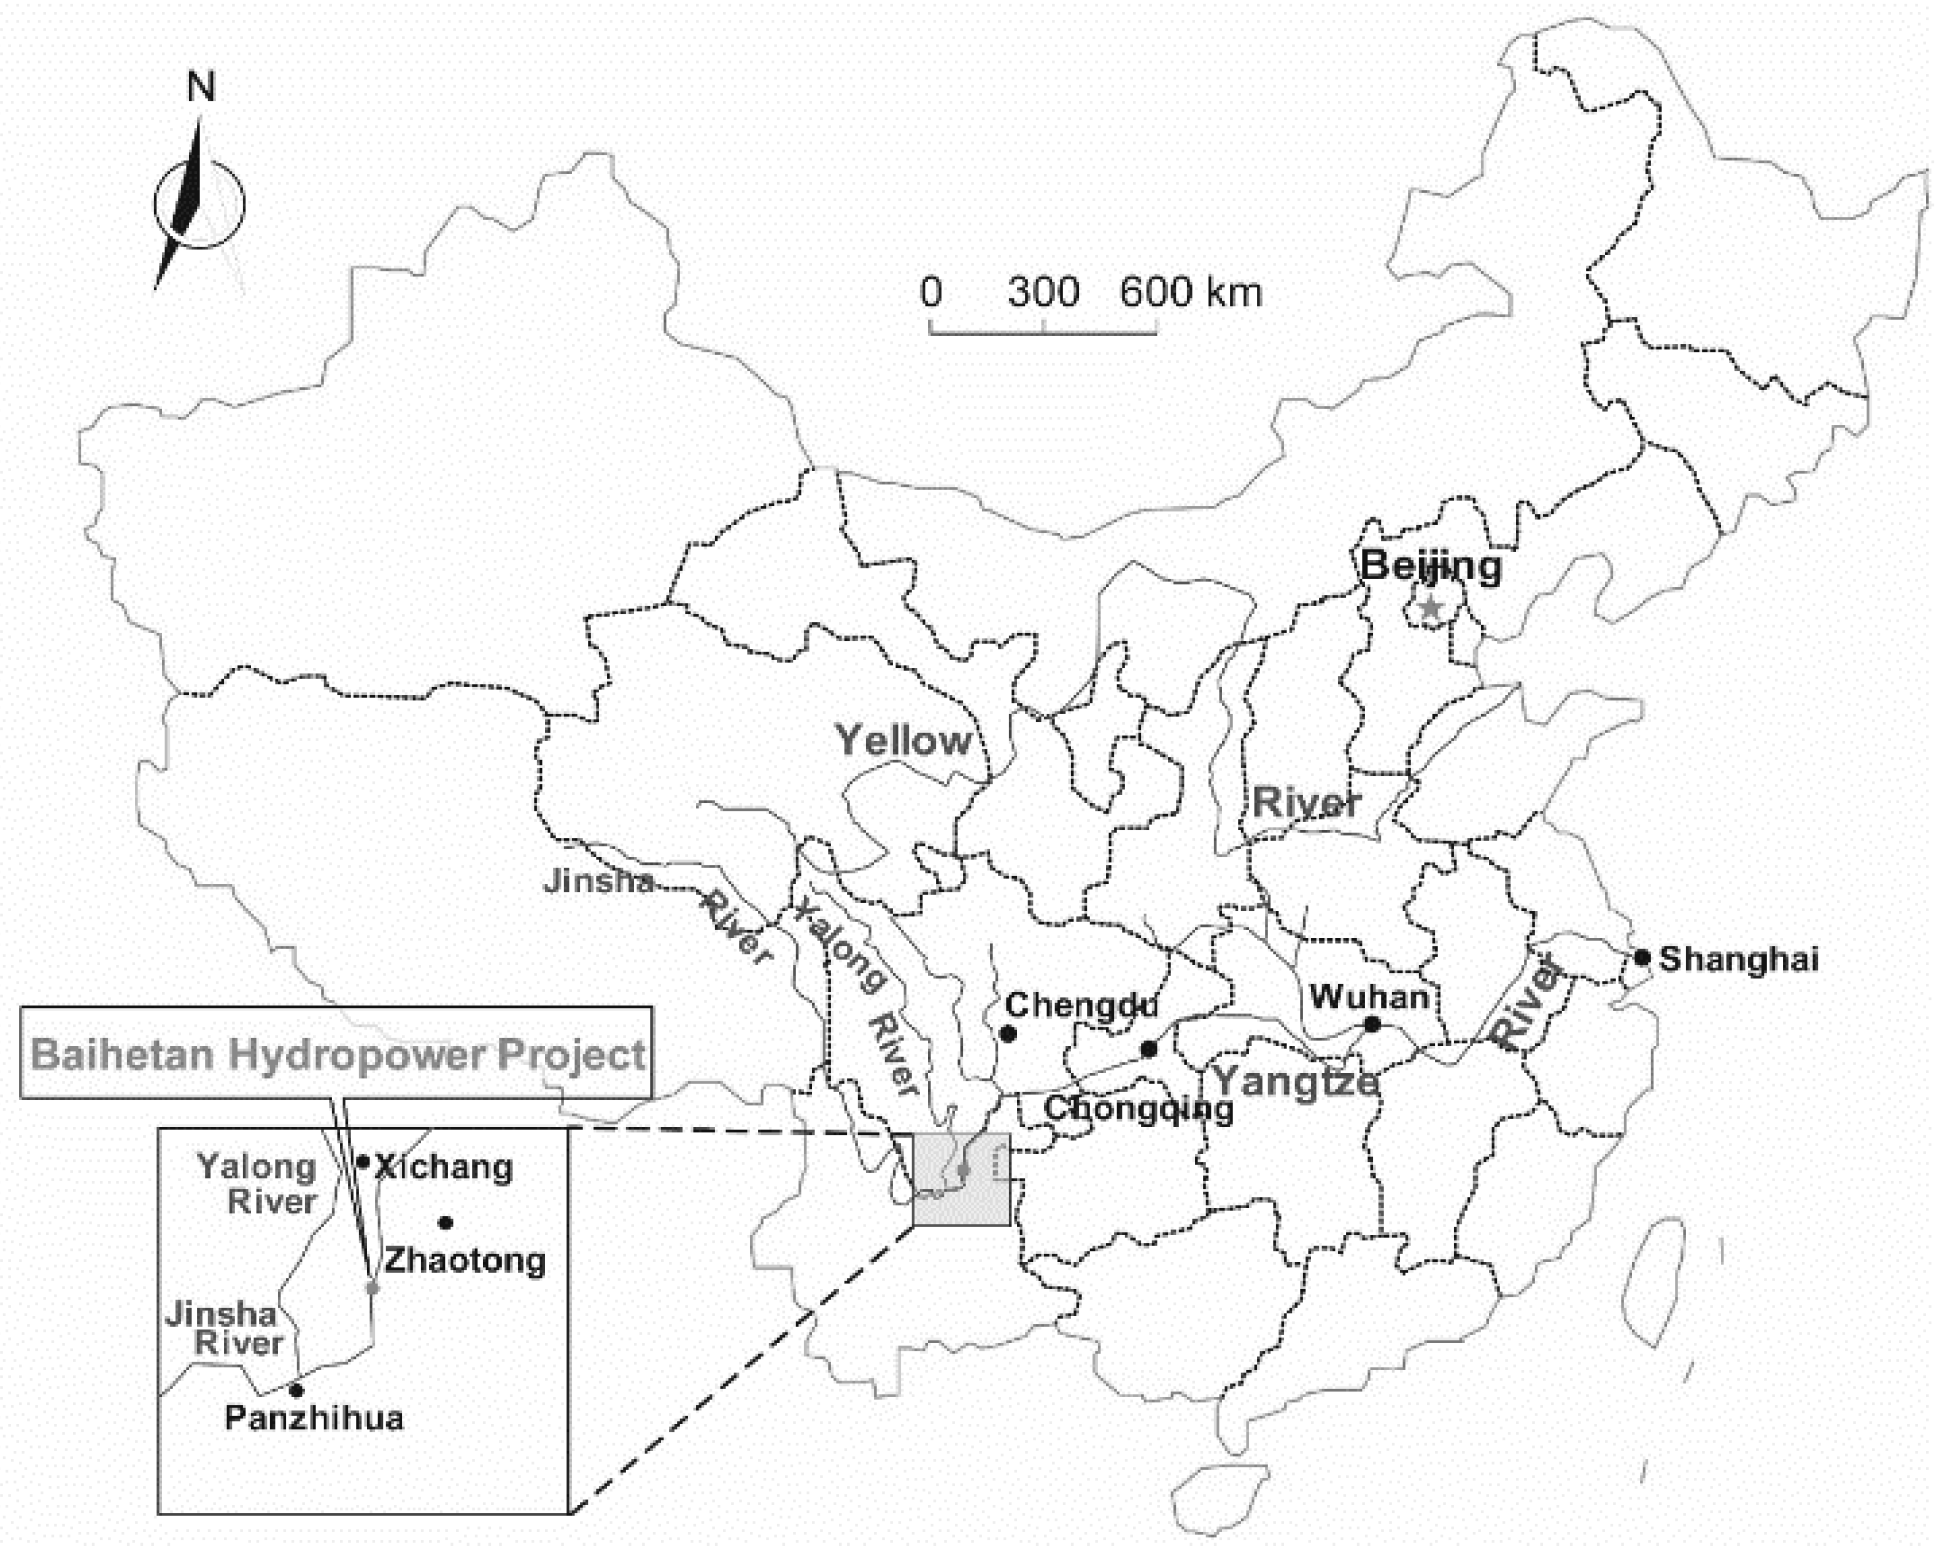
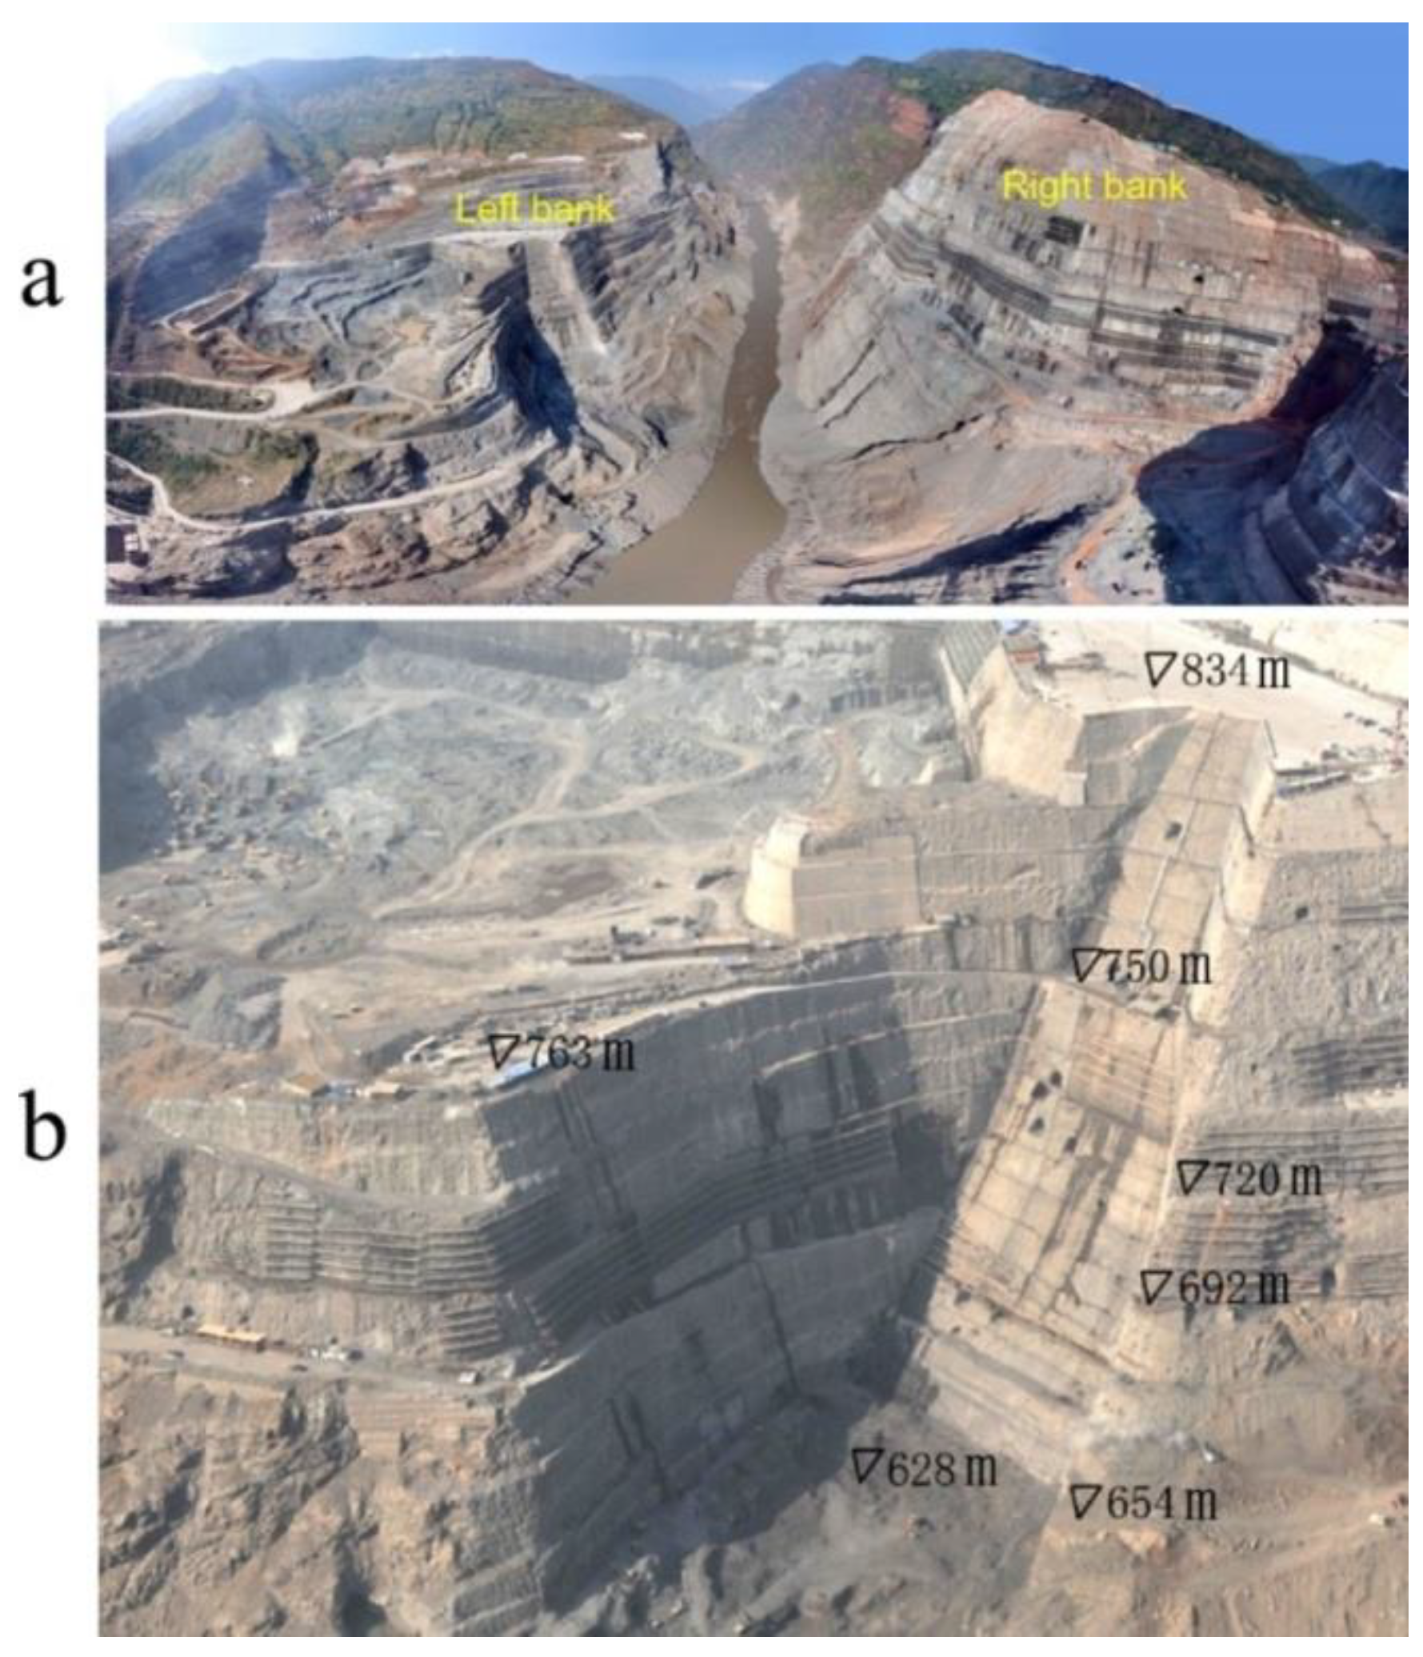
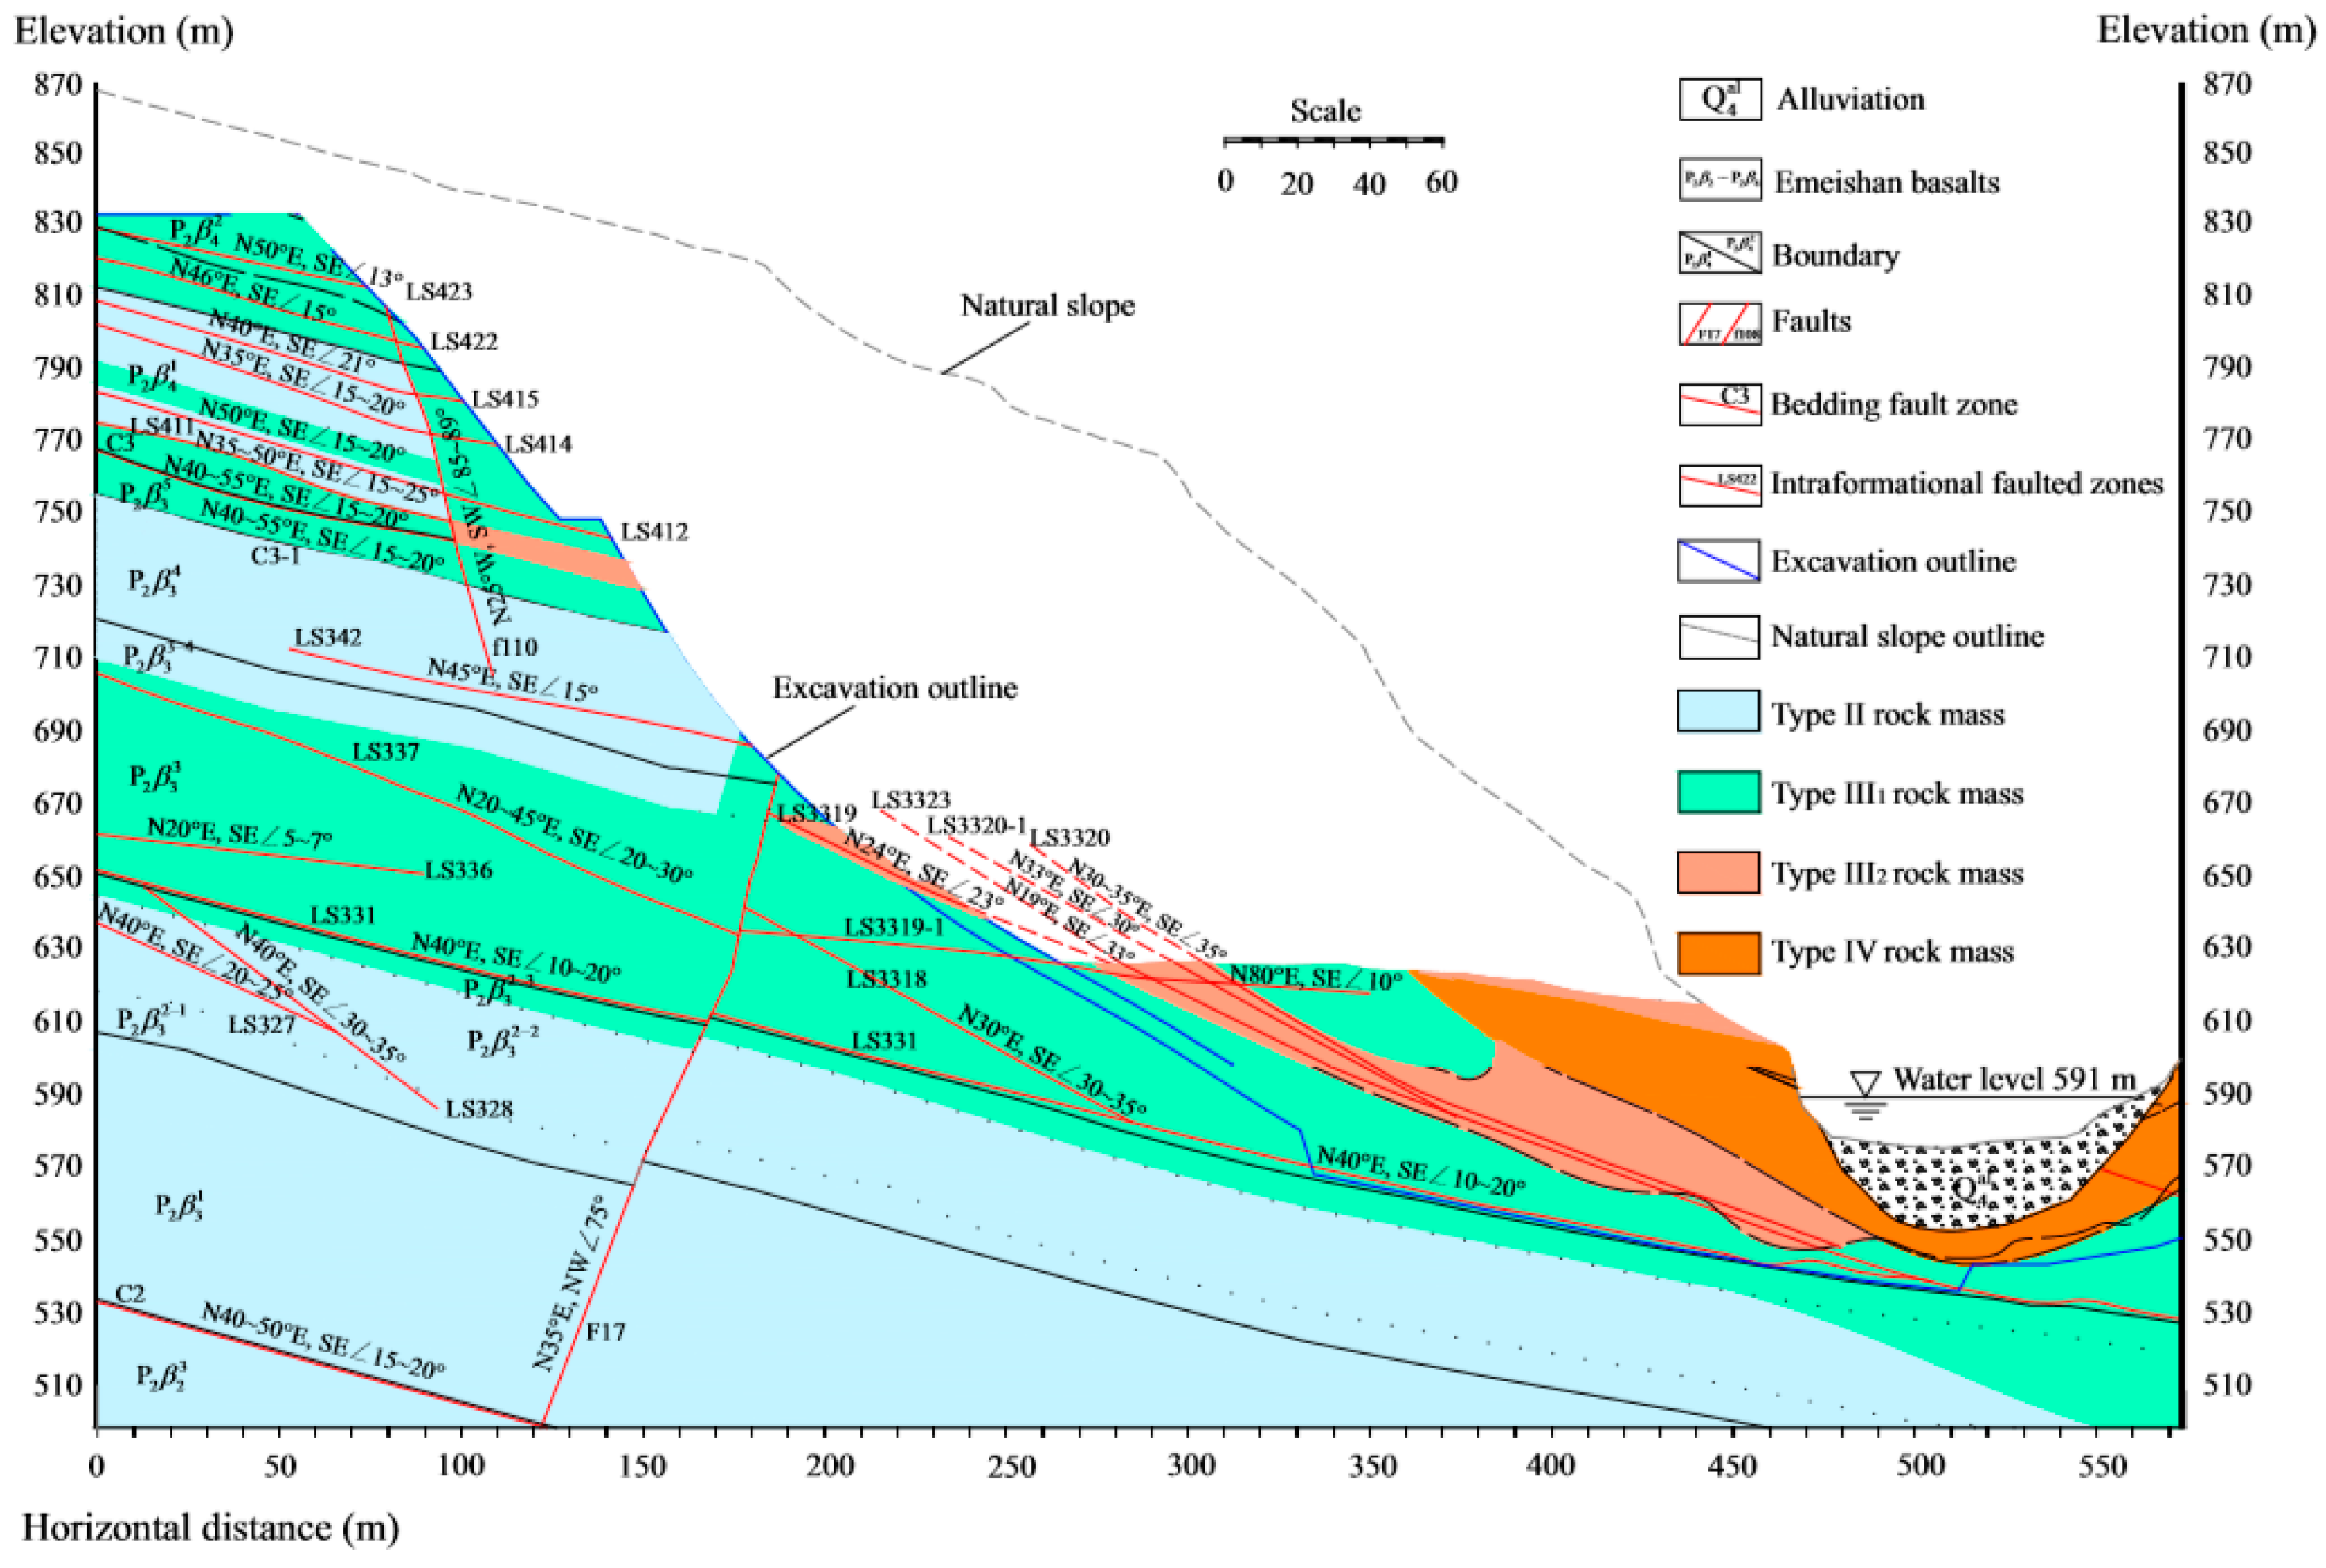
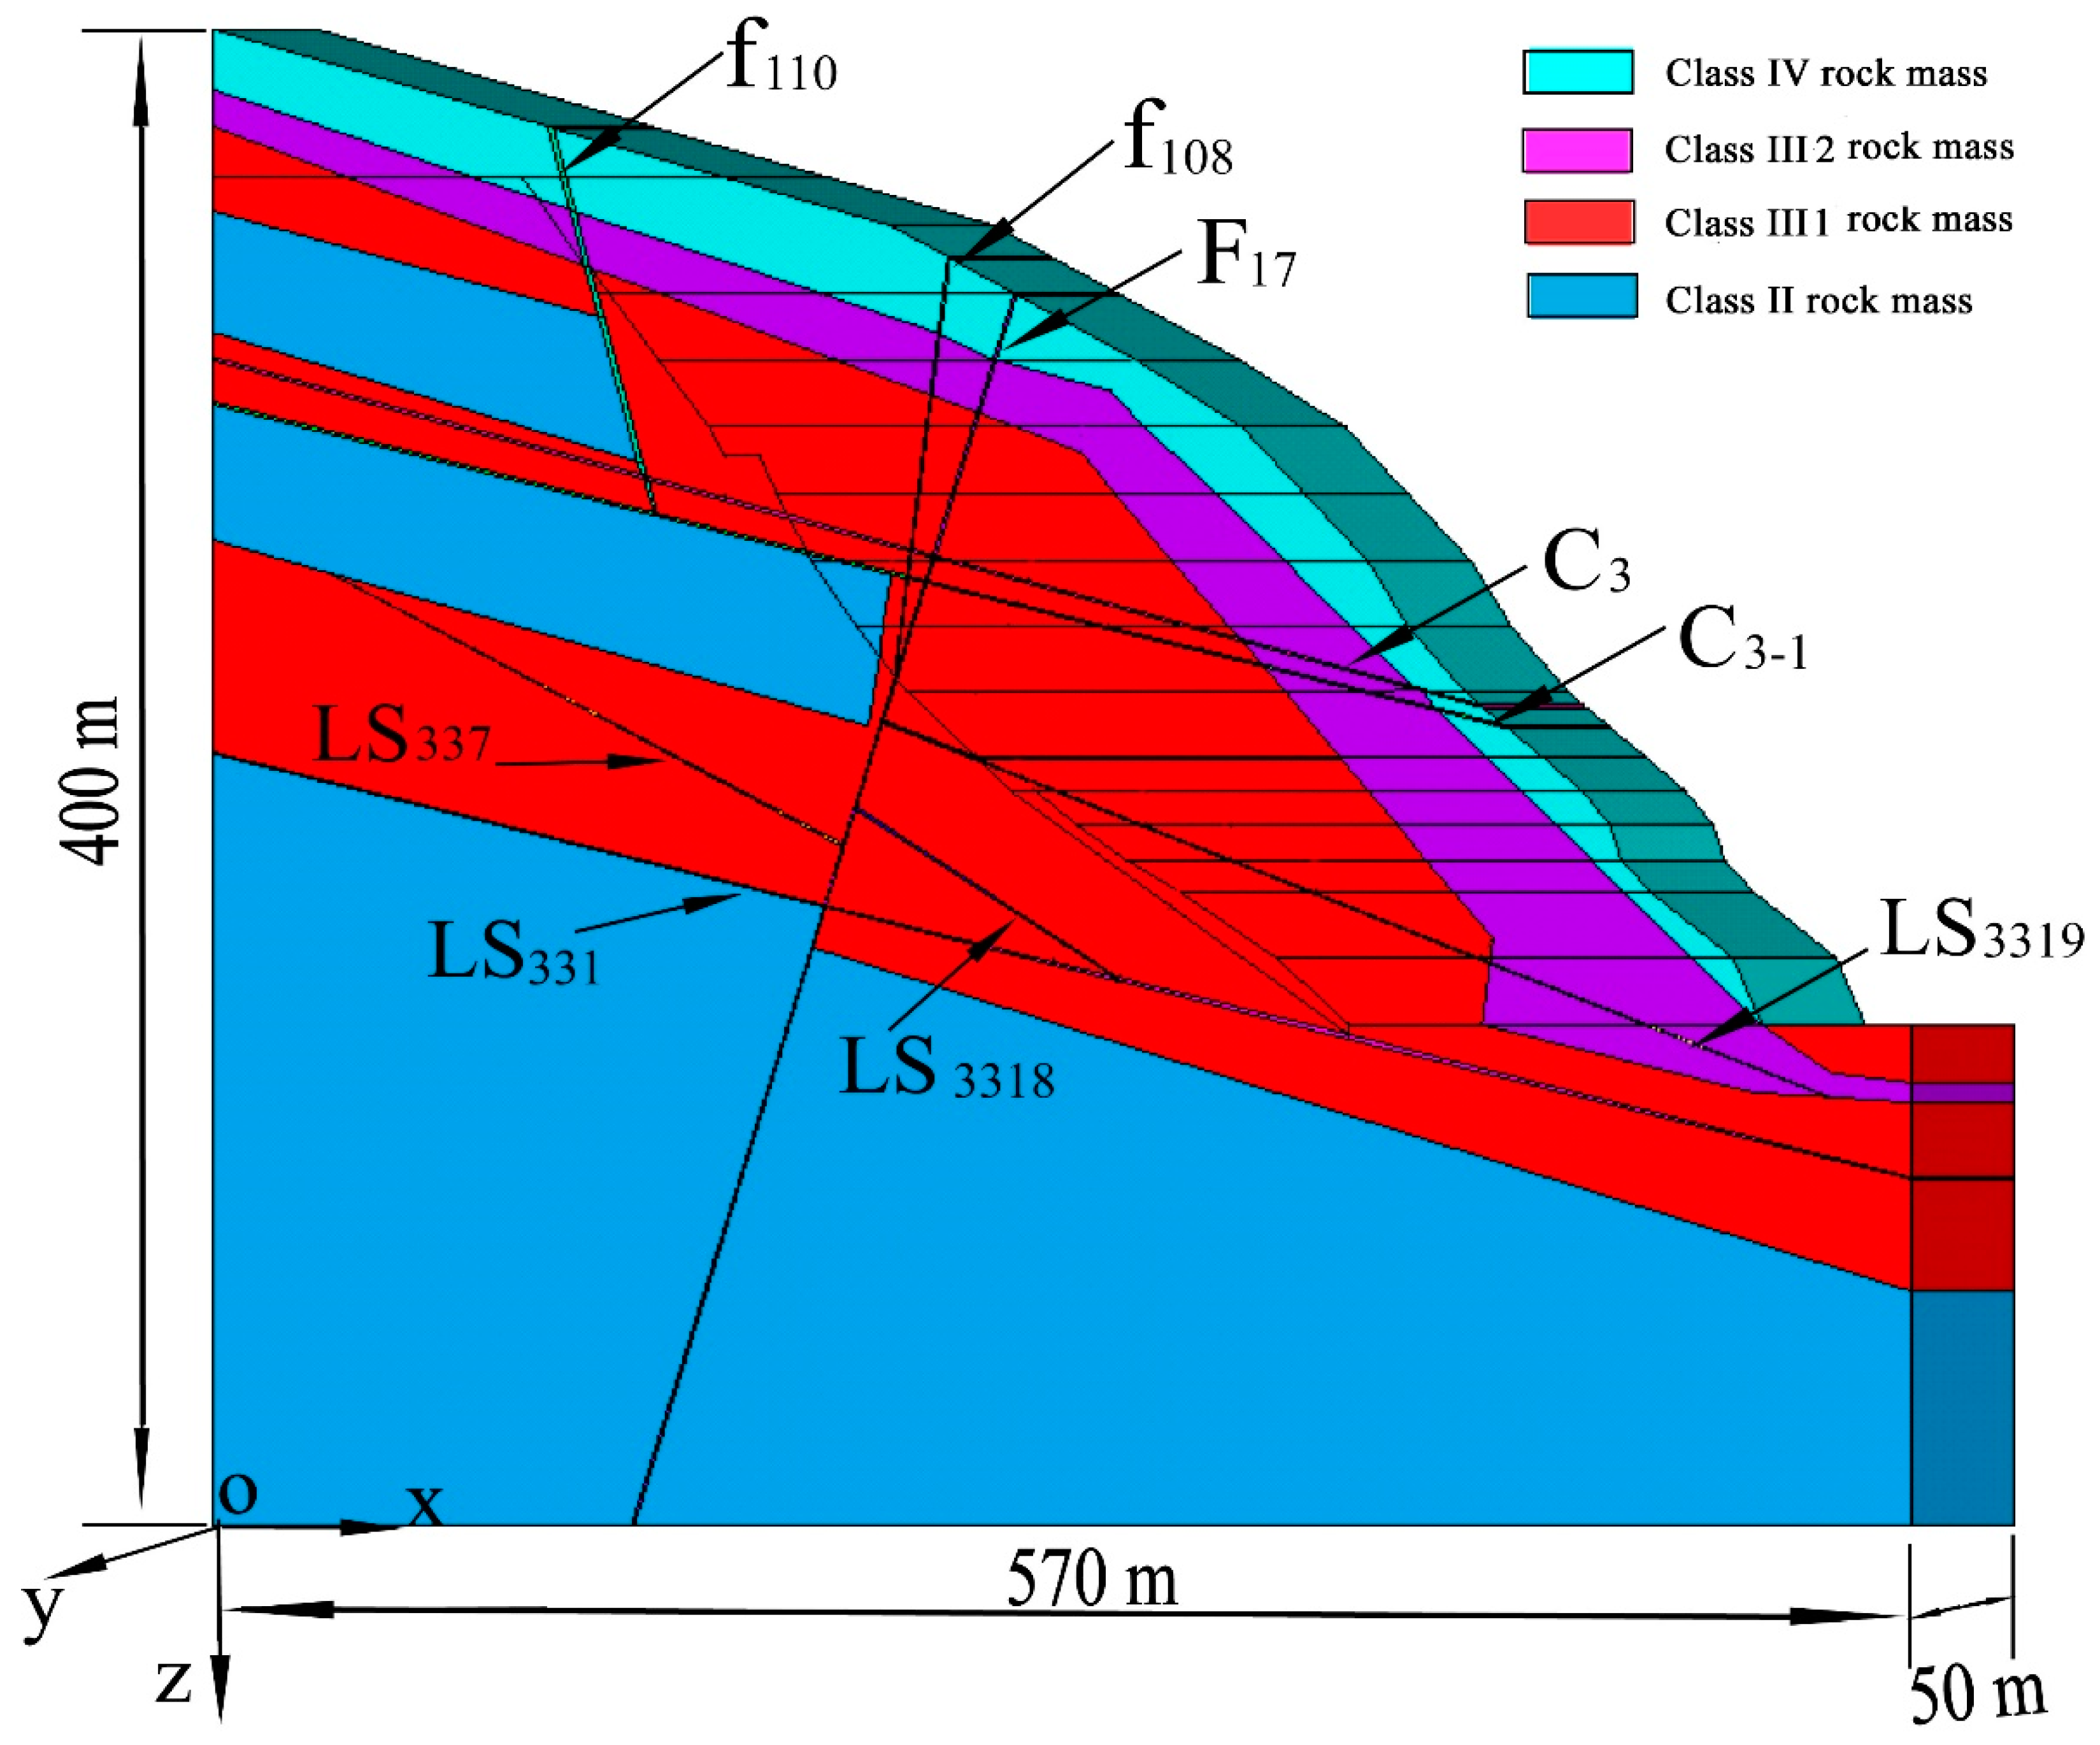
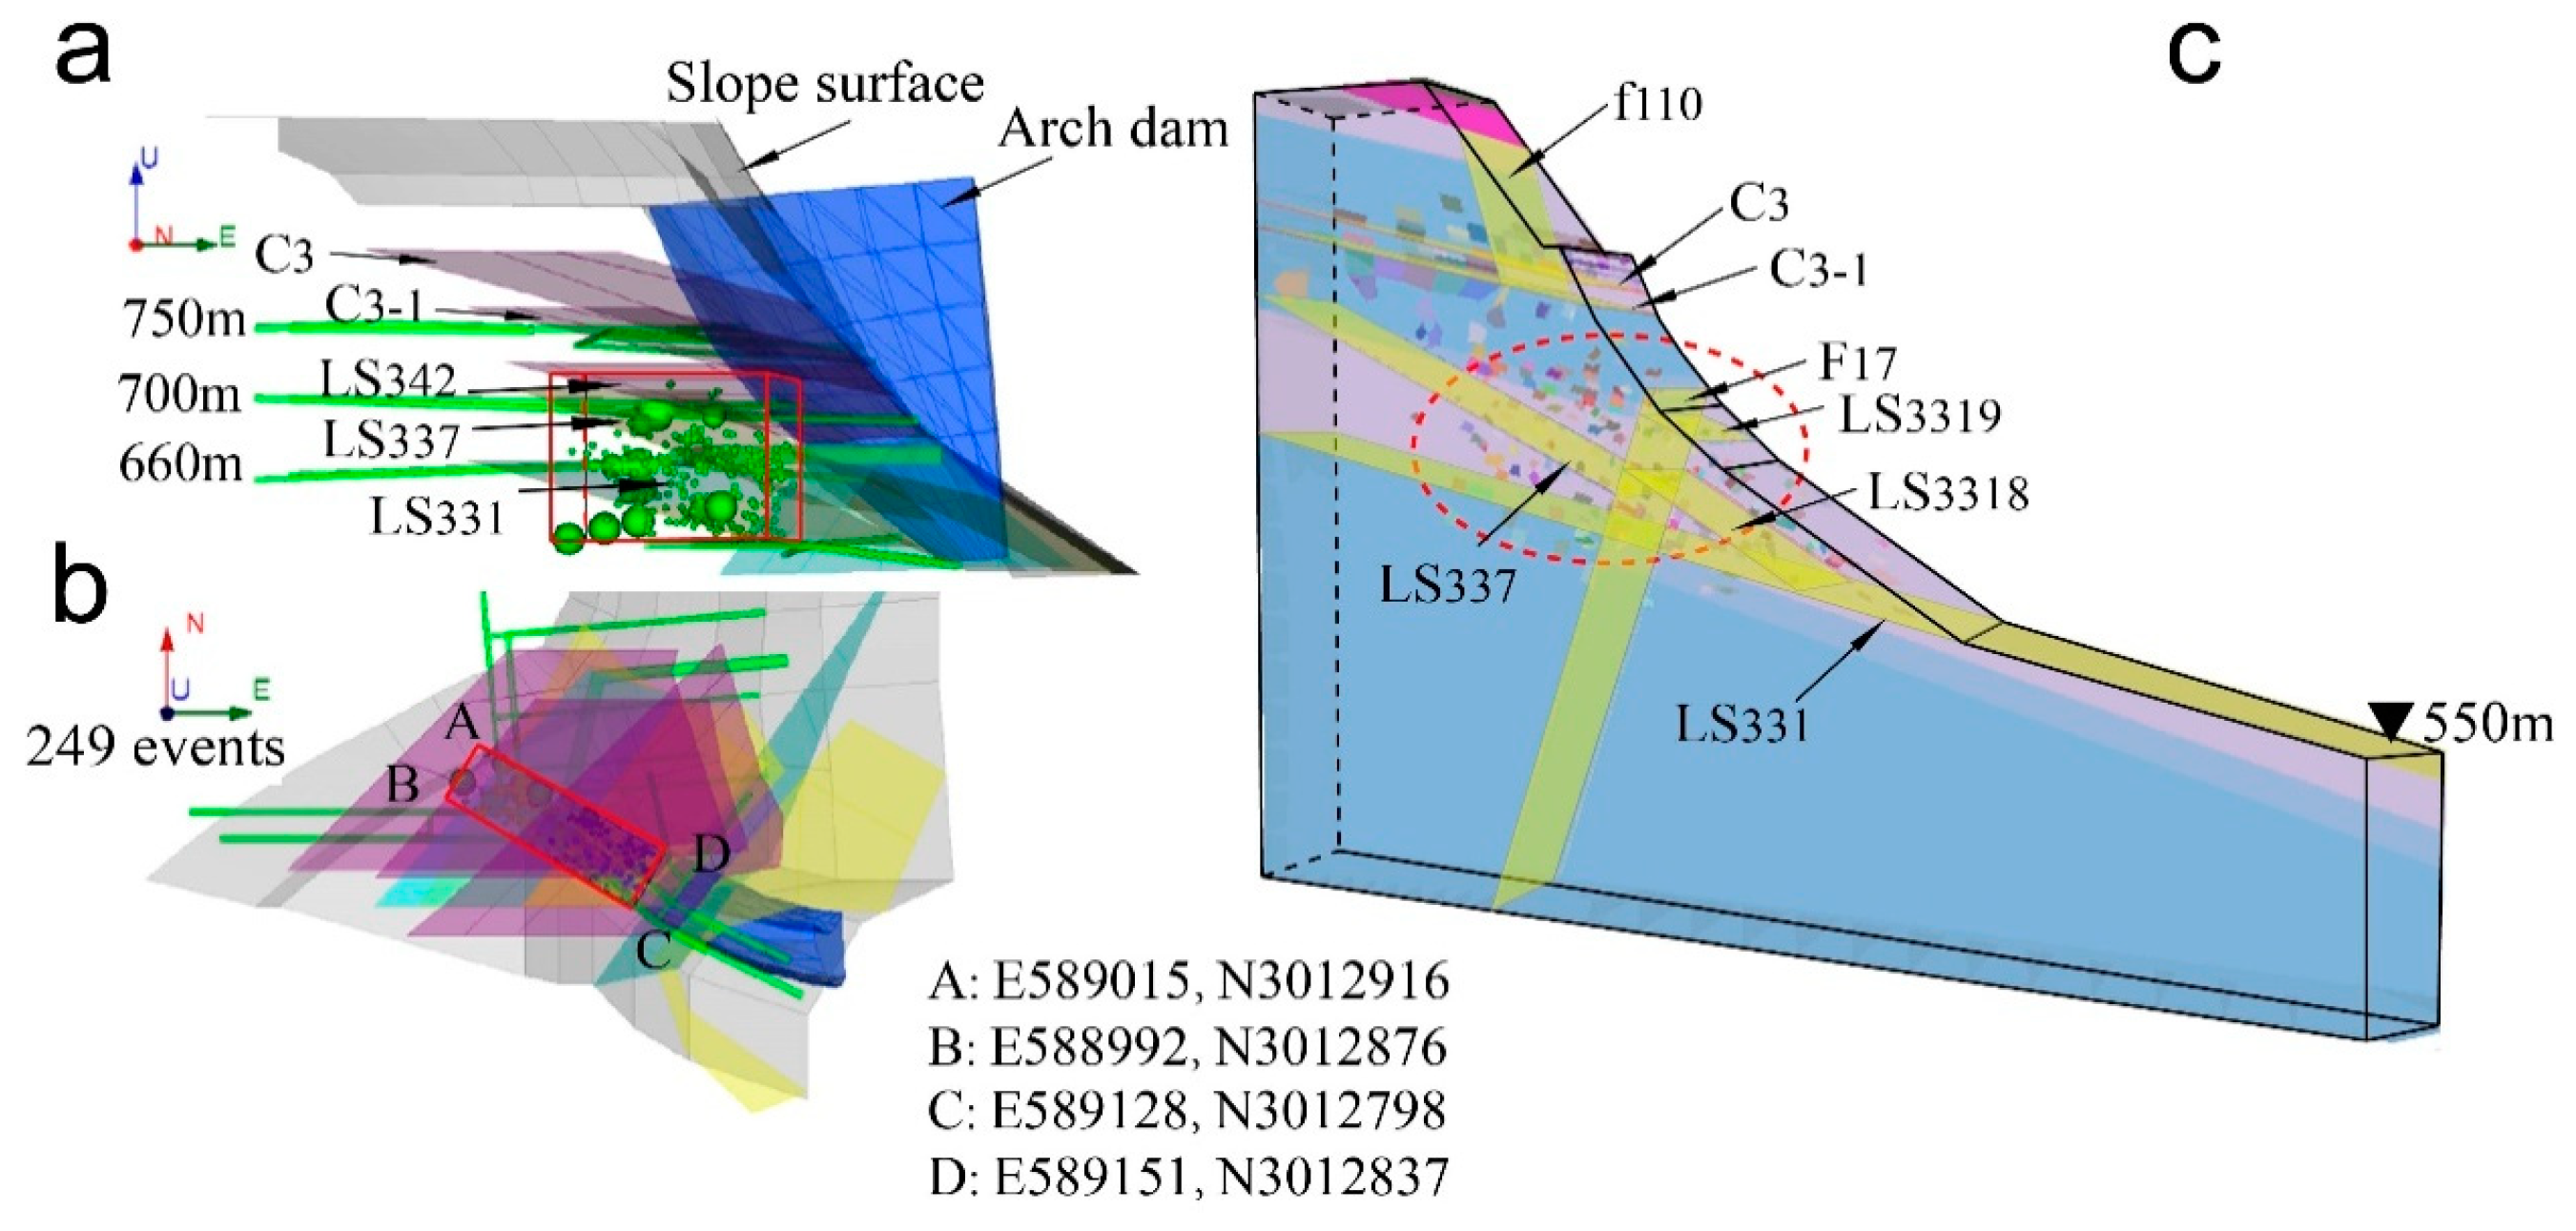
3.1. Project Overview

The Baihetan hydropower station, located on the convergence of Ningnan County in Sichuan Province and Qiaojia County in the Yunan Province of China, is a large project recently constructed on the Jinshajiang River. Figure 1 shows the location of the hydropower station. The project has a double-curvature arch dam with a height of 289 m and a total installed capacity of 16,000 MW. The underground powerhouse’s cavern systems are located in both the left and right bank mountains, 350 m downstream from the dam, with horizontal and vertical depths of 110–380 m and 160–420 m, respectively [25,26]. The left bank is the southeast slope of the Daliang Mountain region, with a peak height of 2600 m, and it has a sloped terrain inclined towards the Jinshajiang River. The right bank is the west slope of the Yao Mountain, with a peak height of 3000 m, and its landform is characterized by steep and gentle slopes. Figure 2 shows the high slopes of the spandrel groove after excavation. Hydro China Huadong Engineering Corporation is responsible for slope excavation design work. Through the experimental data of Hydro China Huadong Engineering Corporation, we produced Table 1, Table 2, Table 3 and Table 4. We have considered the main geological conditions that are conducive to the numerical simulation analysis. Figure 3 shows a typical section of the left bank slope along the dam-arch axis. The left bank abutment has an approximate north to south direction, inclining to the east with a slope of 60°. The stratum lithology of the left dam foundation is mainly composed of P2β3-P2β4 laminar basalt. The first type of basalt with columnar joints is mainly distributed at an elevation of 700–600 m—generally with a length of 3 m and a diameter of 13–25 cm. The left bank slope is a bedding slope with a shape of N30°–50° E and SE∠15–25°. There are many interlayer staggered zones (i.e., the appearance of C3 is N40°–55° E, the appearance of C3-1 is SE, 15°–20°) and the faults with high deep angles are in the NE-direction (i.e., F17, F16 and F14). The characteristics of the main interlayer rock mass and faults are listed in Table 1 and Table 2, respectively. According to in situ stress measurements, the maximum principal stress is σ1 = 8–11 MPa, the medium principal stress is σ2 = 7–9 MPa, and the minimum principal stress is σ3 = 6–8 MPa [25,26,27].

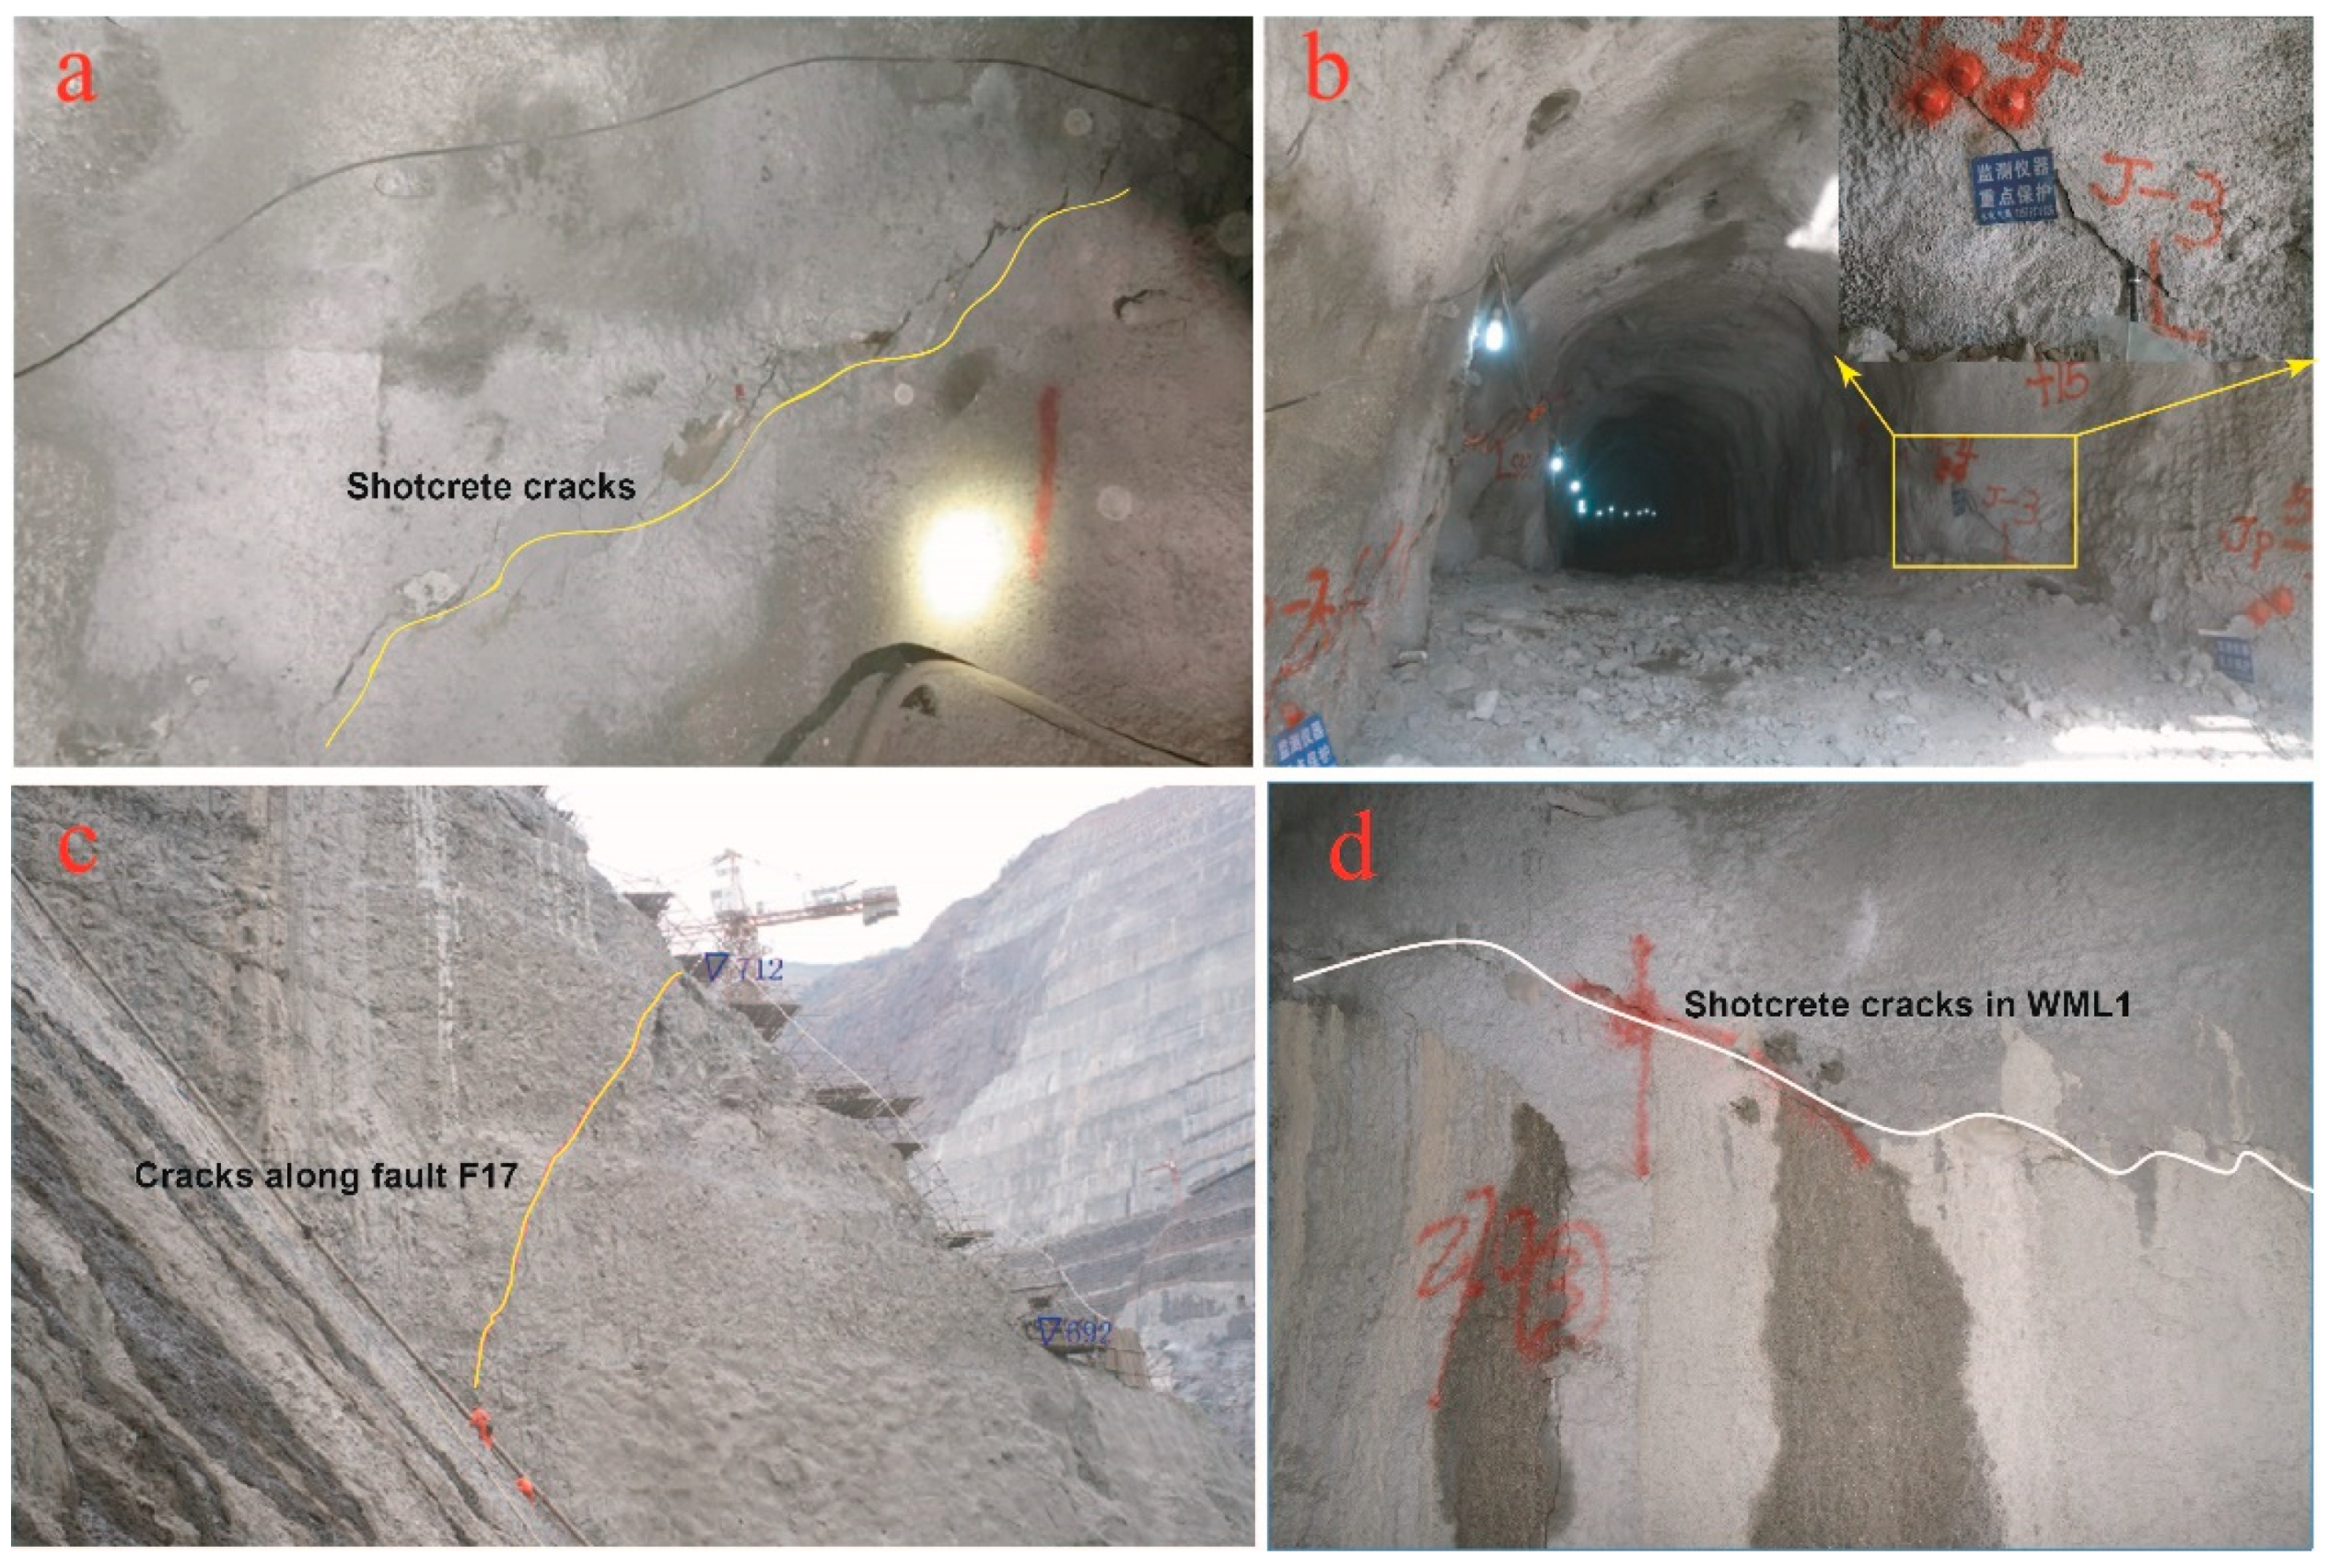
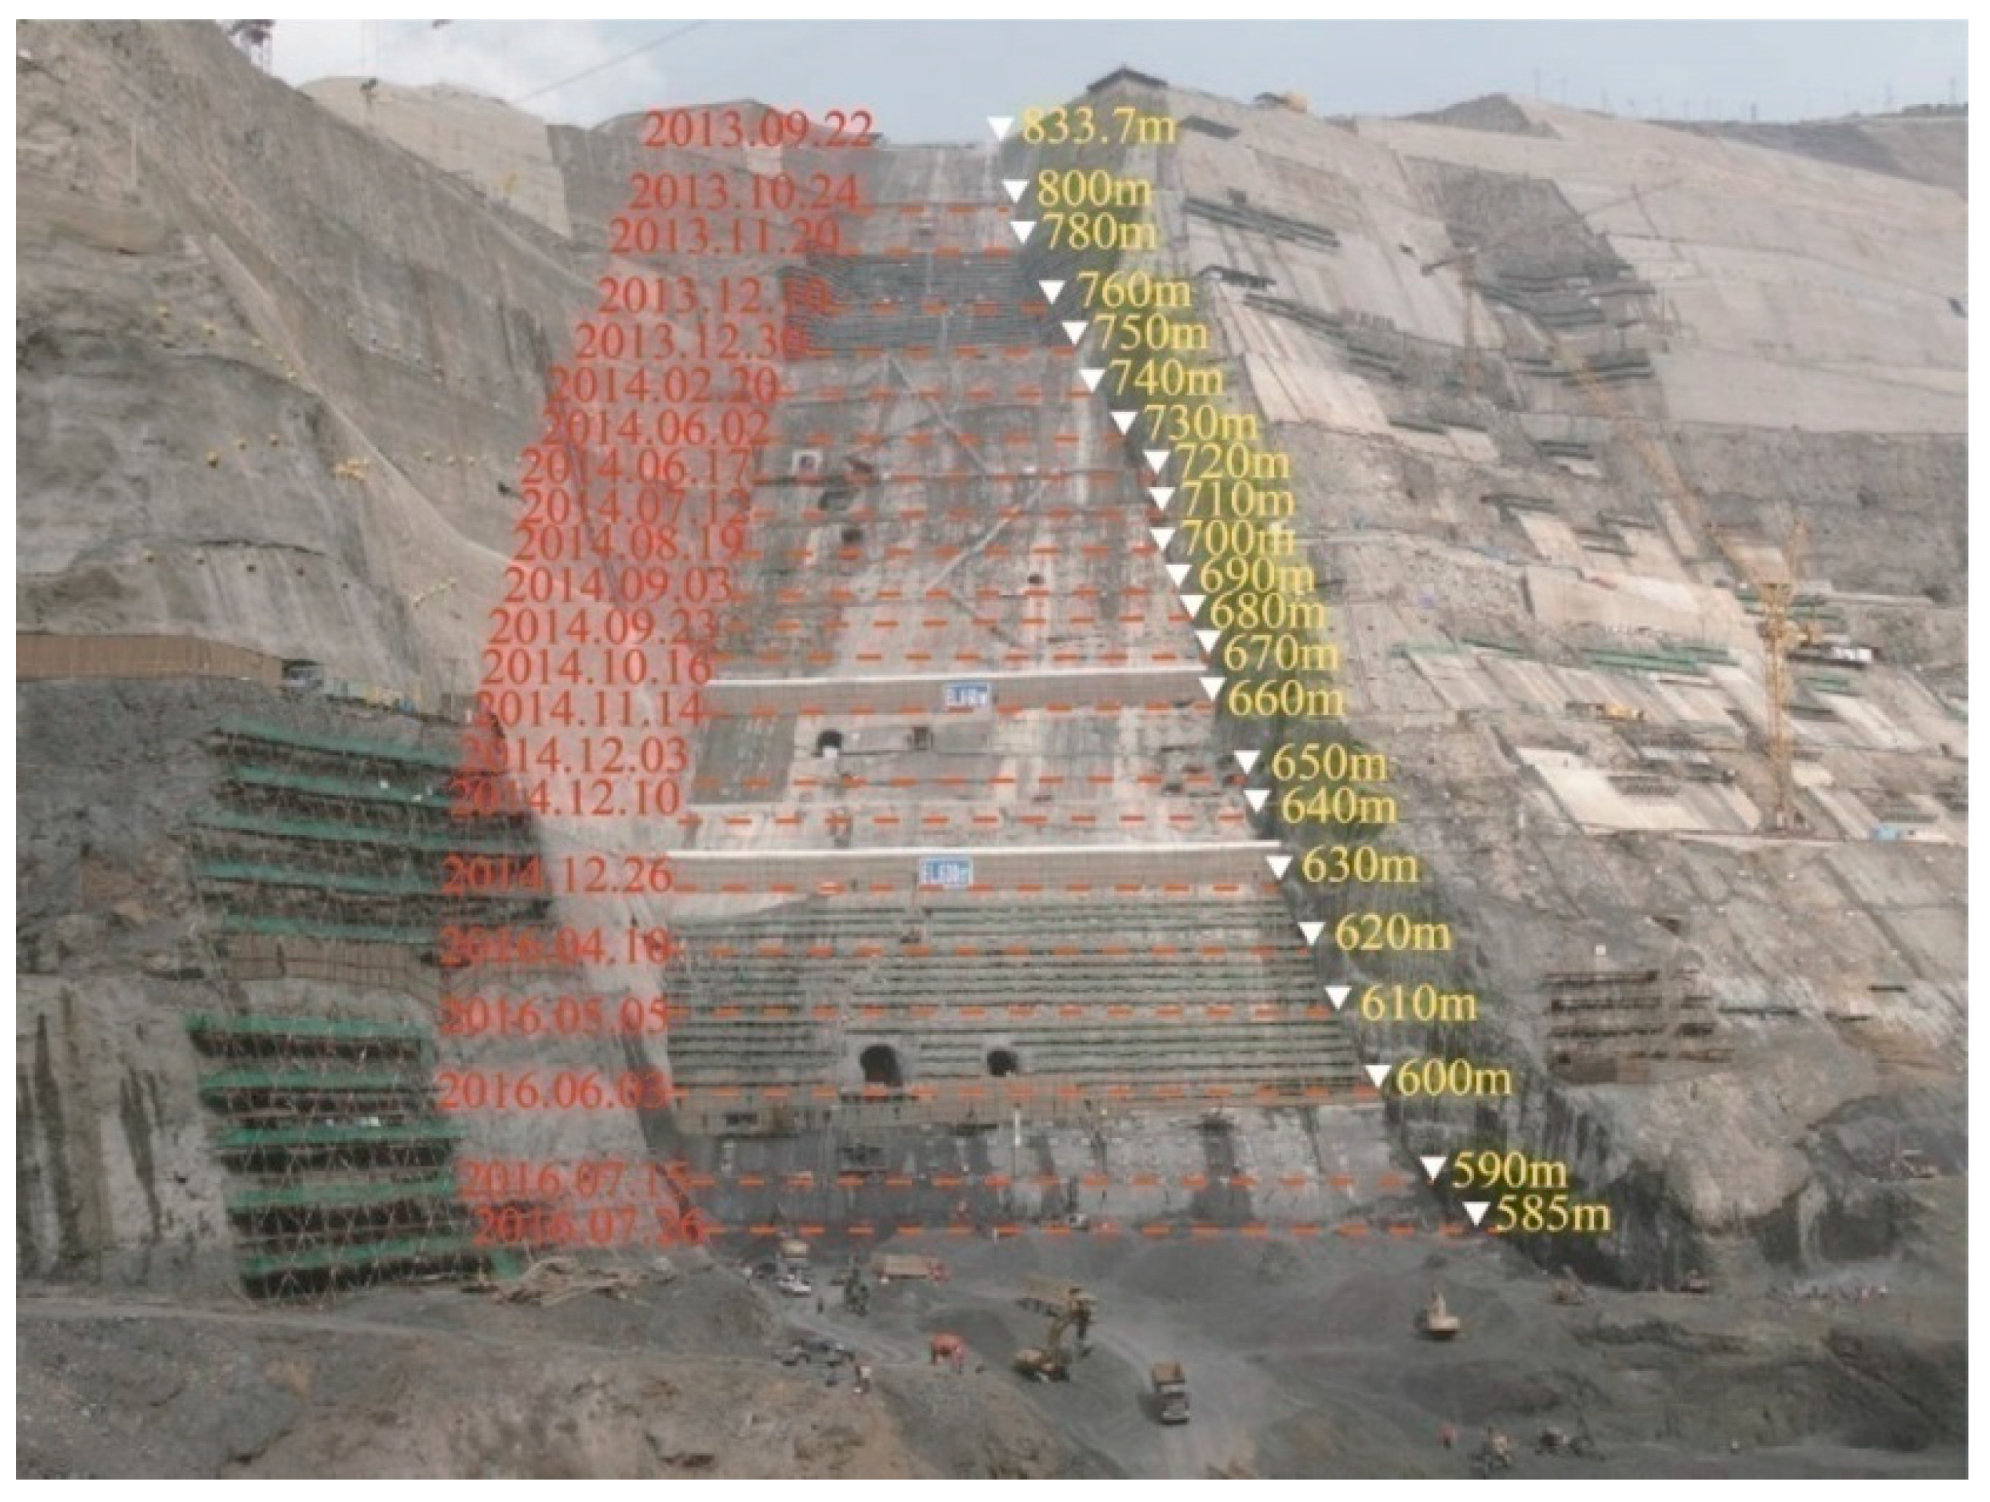
3.2. Failure Characteristics of the Left Bank Slope after Excavation

The excavation of the left bank slope began on 22 September 2013, and the excavation elevation reached 600 m on 3 June 2016. Some sprayed concrete cracked at the peripheries of the entrances to the drainage tunnel PSL2 and the curtain grouting tunnel WML2 at an elevation of 654 m on 13 December 2014, as shown in Figure 4a,b. A mortar strip was added to the cracks on 18 December 2014, and ruptures and mal-position occurred at the mortar strips on 23 December 2014. Moreover, a crack formed at the slope of the downstream spandrel groove along fault F17 on 25 December 2014. As shown in Figure 4c, the expansion width is approximately 1 cm at the top and approximately 0.3 cm at the toe. Therefore, the slope excavation was suspended immediately on 29 December 2014. Related supporting measures were completed on February 2015 [28]. After approximately one year, the excavation of the slope restarted on 11 February 2016. Some similar sprayed concrete cracked at the peripheries of the entrances to WML1 at an elevation of 605 m on 25 May 2016, as shown in Figure 4d.

4. Numerical Simulation of the Rock Slope
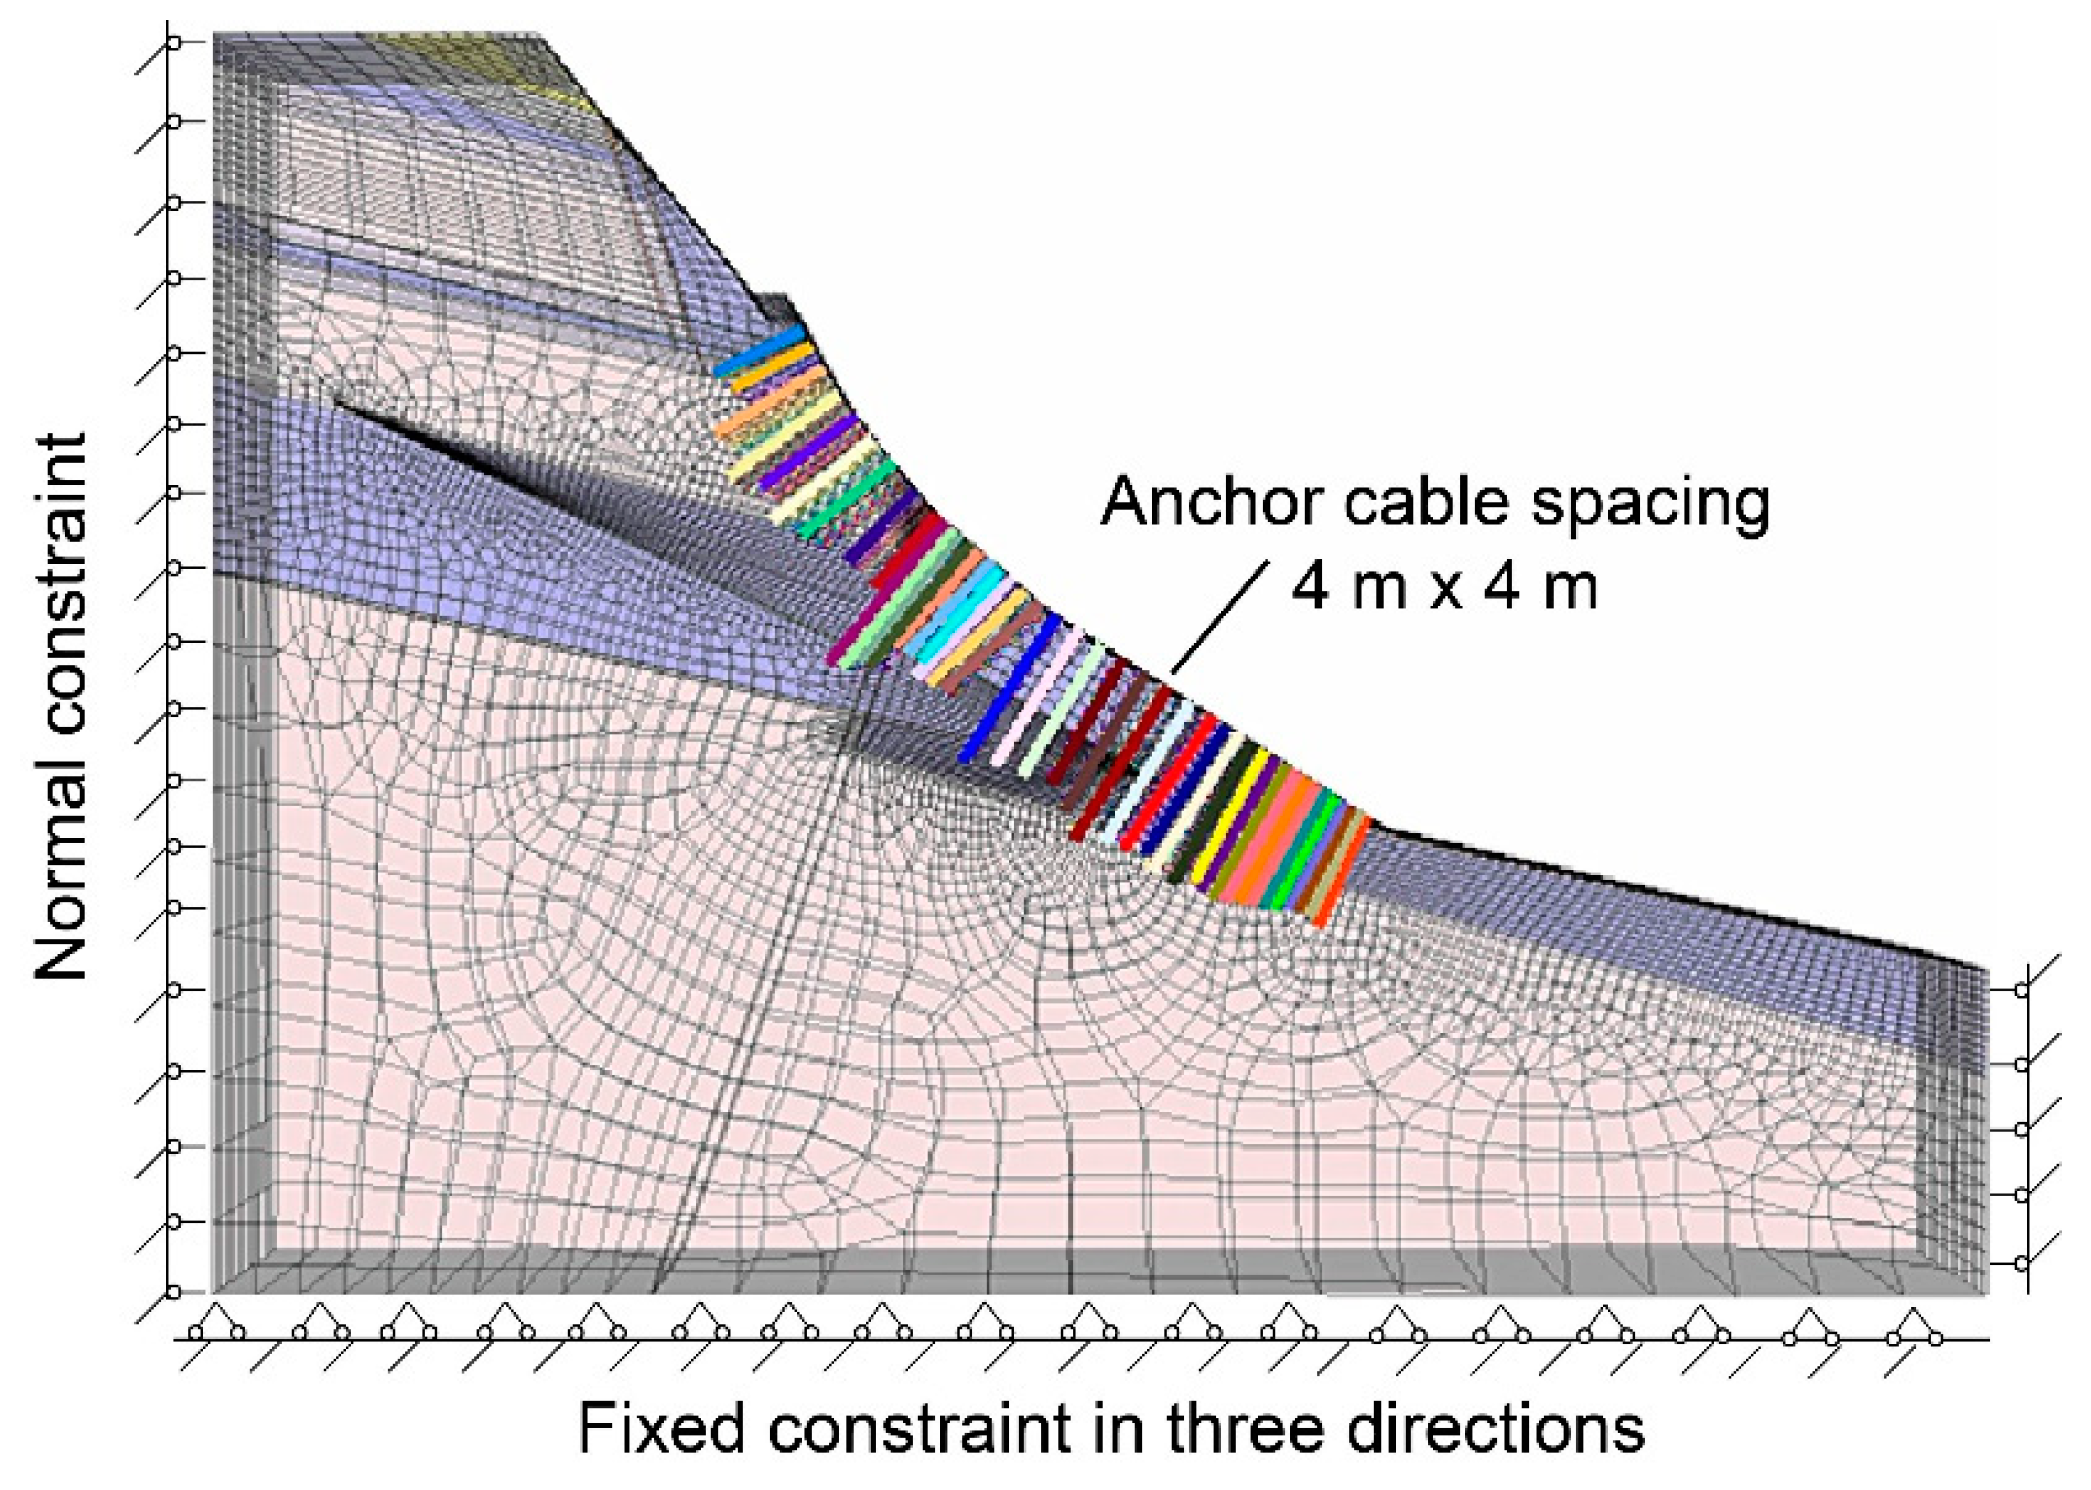
4.1. Model Setup

The geological profile of the slope along the arch axis at the elevations ranging from 550 m to 880 m was selected to build the numerical model, as shown in Figure 5. The software ANSYS was used to generate grids. The grid node data were imported to FLAC3D via a plug-in. The model consisted of 246,075 hexahedron elements. The numerical model had a bottom elevation of 480 m and a maximum elevation of 880 m. The model was 570 m long, perpendicular to the river, and 50 m along the river. The model mainly includes nine weak structural planes, as shown in Figure 3 (i.e., the intra formational disturbed belts LS337, LS331, LS3318, and LS3319, interlayer disturbed belts C3-1 and C3, and faults on the posterior border F17, f110, and f108). Table 3 shows the characteristics of the intra formational disturbed belts. The positive direction of the x-axis points to the right bank slope (SE 50°); the positive direction of the y-axis points to the river upstream (SW 40°); the positive direction of the z-axis is vertically downward. The x-direction normal constraints are imposed on both sides of the calculation area; the y-direction normal constraints are imposed on its front and back; the x-, y-, and z-direction constraints act on some of the key nodes at the bottom, and the free faces are free. The rock mass in the slope is classified into four categories according to the GB50287-2006 Code for Hydropower Engineering Geological Investigation in China: Class II, class III, class IV and class V, with the lithology of basalt. Moreover, the classes II, III, IV and V correspond to the values of 90–75%, 75–50%, 50–25% and below 25%, of the RQD criterion (rock quality designation) respectively [29].
Based on the experimental results listed in Table 4, the mechanical parameters of the rock mass and structural plane in the model were set. After applying the boundary conditions to the model, the C language was applied to compile the damage constitutive model, considering the effect of the rock fracture scale. When FLAC3D software runs, the complied information is directly loaded and attached to all rock elements in the model as a dynamic link library. The excavation of the spandrel arch of the foundation slope began on 5 September 2013. The layered and segmental blasting excavation method was adopted, with each layer approximately 10 m thick. The excavation progress is shown in Figure 6. To reflect the surrounding rock mass deformation response mechanism of the slope under layered excavation, the reinforcement and excavation were considered as truly as possible in the numerical simulation. A numerical model considering anchor cable reinforcement is shown in Figure 7. The anchor cables were adopted on-site with their prestressing force of 3000 kN. The length of the anchor cable was 30 m to 70 m (the length depends on the geological exploration conditions) and the arrangement spacing was 4 m × 4 m. The anchoring angle was perpendicular to the slope foundation surface. Figure 8 illustrates the anchoring diagram in the numerical model.

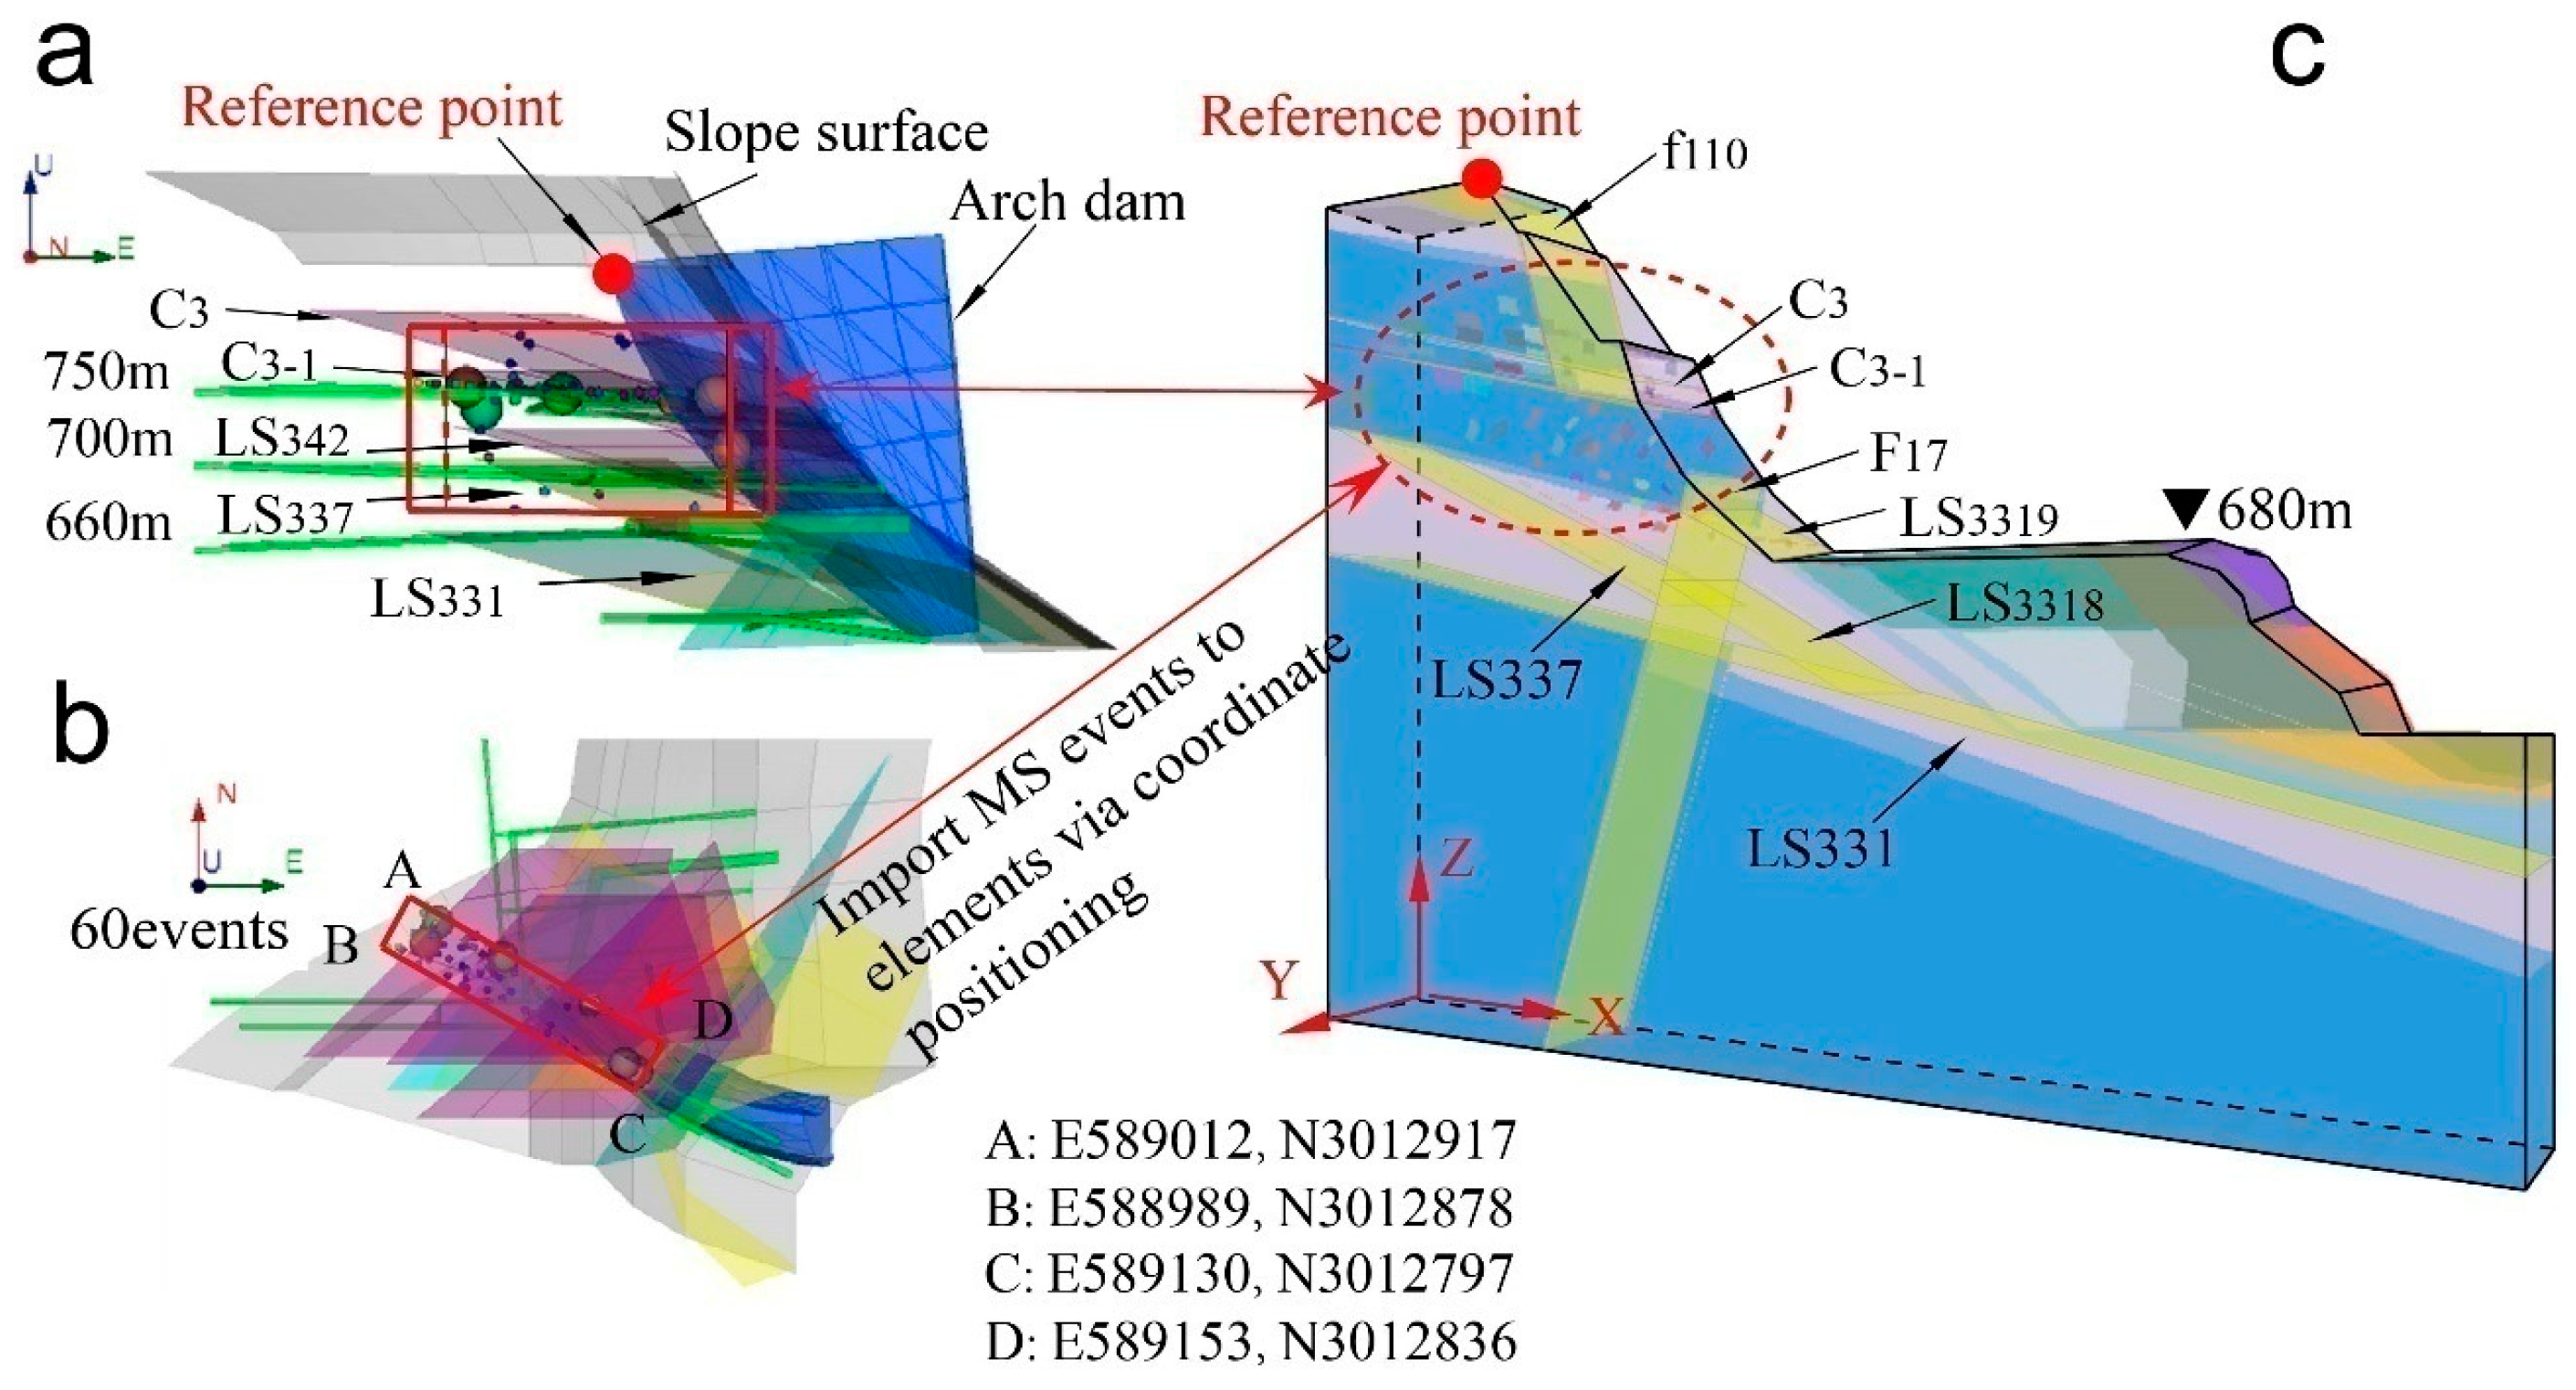
4.2. MS Parameter Embedding

The MS monitoring system produced by the Engineering Seismology Group, Canada was adopted in the project. The system was installed completely on 10 November 2014 [27,30]. The multipoint extensometers were successfully installed and commissioned on 14 December 2014. The slope was excavated near the 680 m elevation. Therefore, there is a lack of comparison between MS data above 680 m and field data, which has a certain impact on the simulation results. To build the quantitative relationship between rock mass damage and MS activities of the rock slope, the spandrel arch area of the slope was chosen as the research object to analyze the MS events during the selected period. MS events in two periods were selected. The first period was from 1 December 2014 to 31 January 2015 (excavation elevation ranging from 740 m to 680 m). The second period was from April 2016 to 31 December 2016 (excavation elevation ranging from 630 m to 550 m). MS data in corresponding regions were selected. Taking the period between 1 December 2014 and 31 January 2015 as an example, the selected region of MS data was a rectangular region encircled by four locating points with the geodetic coordinates ((E: 589012, N: 3012917), (E: 588989, N: 3012878), (E: 589130, N: 3012797), and (E: 589153, N: 3012836)) in the top view. The spatial scope is a cube at elevations from 740 m to 680 m. A reference point on the dam crest based on a numerical model with geodetic coordinates (E: 589053, N: 3012865, U: 834) and coordinates in the model (172.7, 60, 405) was selected. Based on the preceding coordinates, the coordinate transformation relationship was established to input the MS data in the selected area to the numerical model. During the excavation period, there were a total of 309 MS events. The damage constitutive model considering the rock fracture scale was adopted in all rock elements of the model. It was assumed that the MS monitoring system adopted an annular fault plane. The source fracture zone was equivalent to a disk with a radius of r, which referred to the source fracture scale according to Bruner’s model calculation [31]. The formula is as follows:
r 0 = K c V s 2 π f 0 c
where   K c refers to the angular frequency of the P-wave or S-wave; K s = 2.34 for instantaneous stress relief; K p = 2.01 and K s = 1.32 for a quasi-dynamic rounded source [32].
The MS data were read into the corresponding rock unit in the model, and the source radius was entered. The numerical calculation can obtain the fracture density and fracture damage variable of the corresponding rock unit and the strain increment in the rock unit under the fracture damage. The stress and strain values of this element in the damage status could be obtained from the FLAC3D calculation and circulation. After all the MS data during the selected period were input into the numerical model, the stress and strain field in the damage status of the rock slope could be obtained. Figure 9 and Figure 10 show the spatial distribution of MS events and the relationship between MS information and the model excavation process.

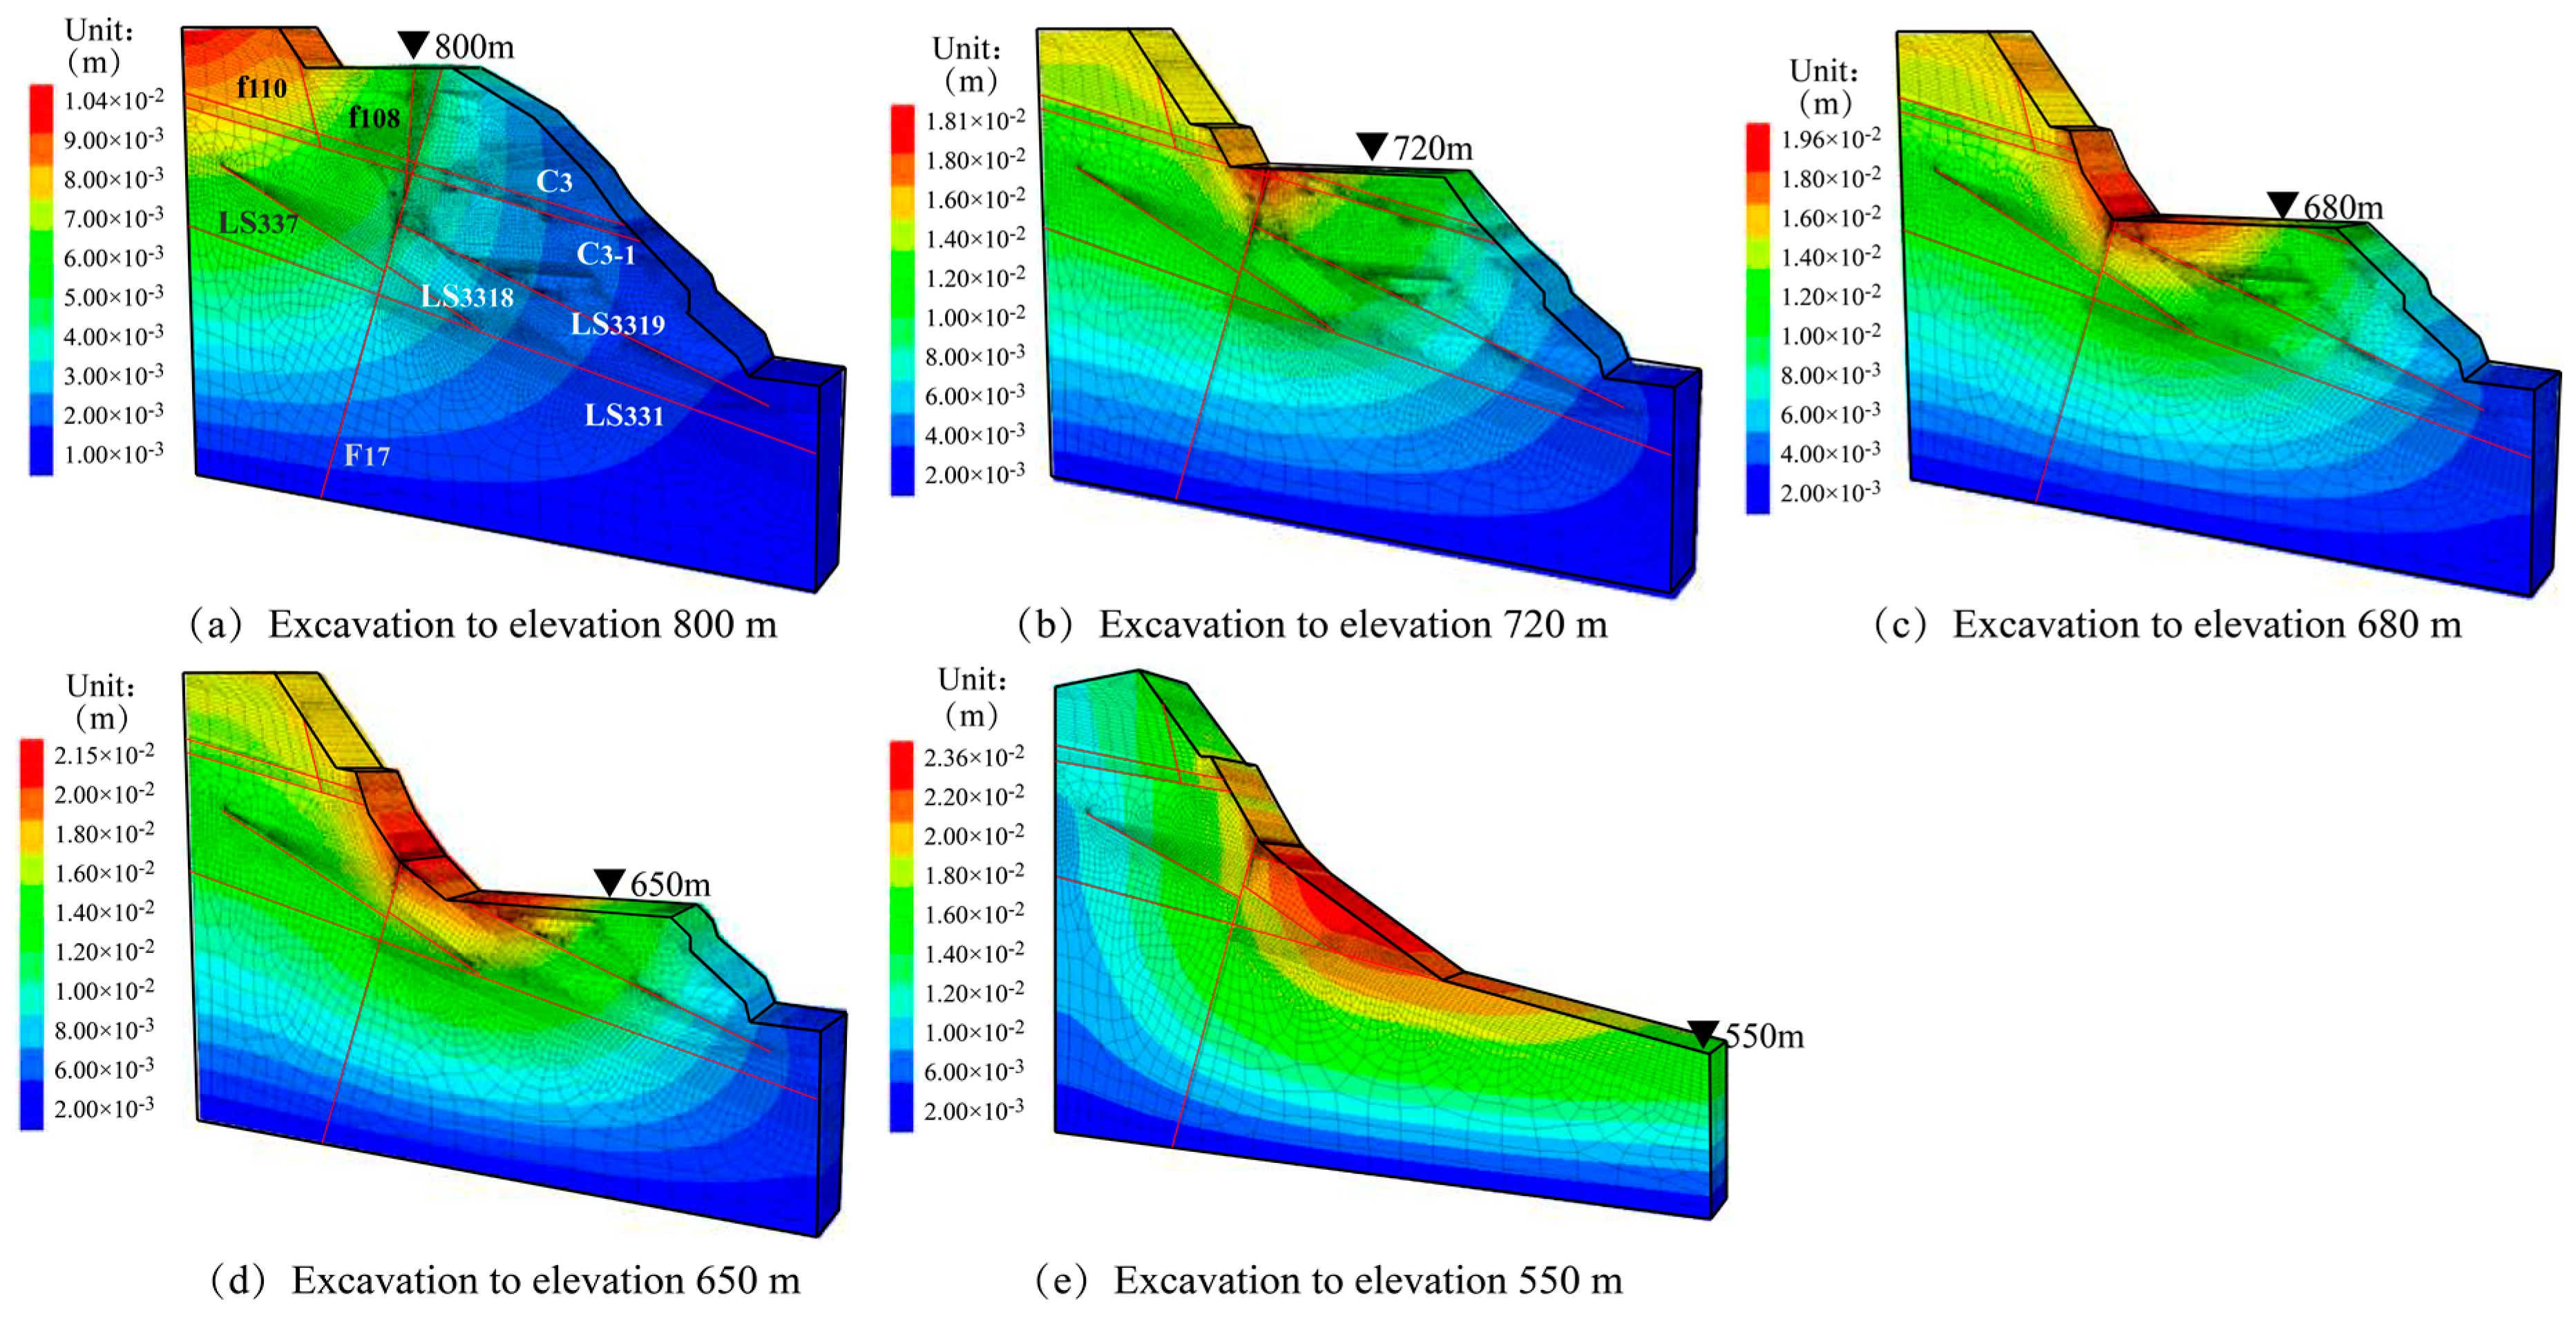
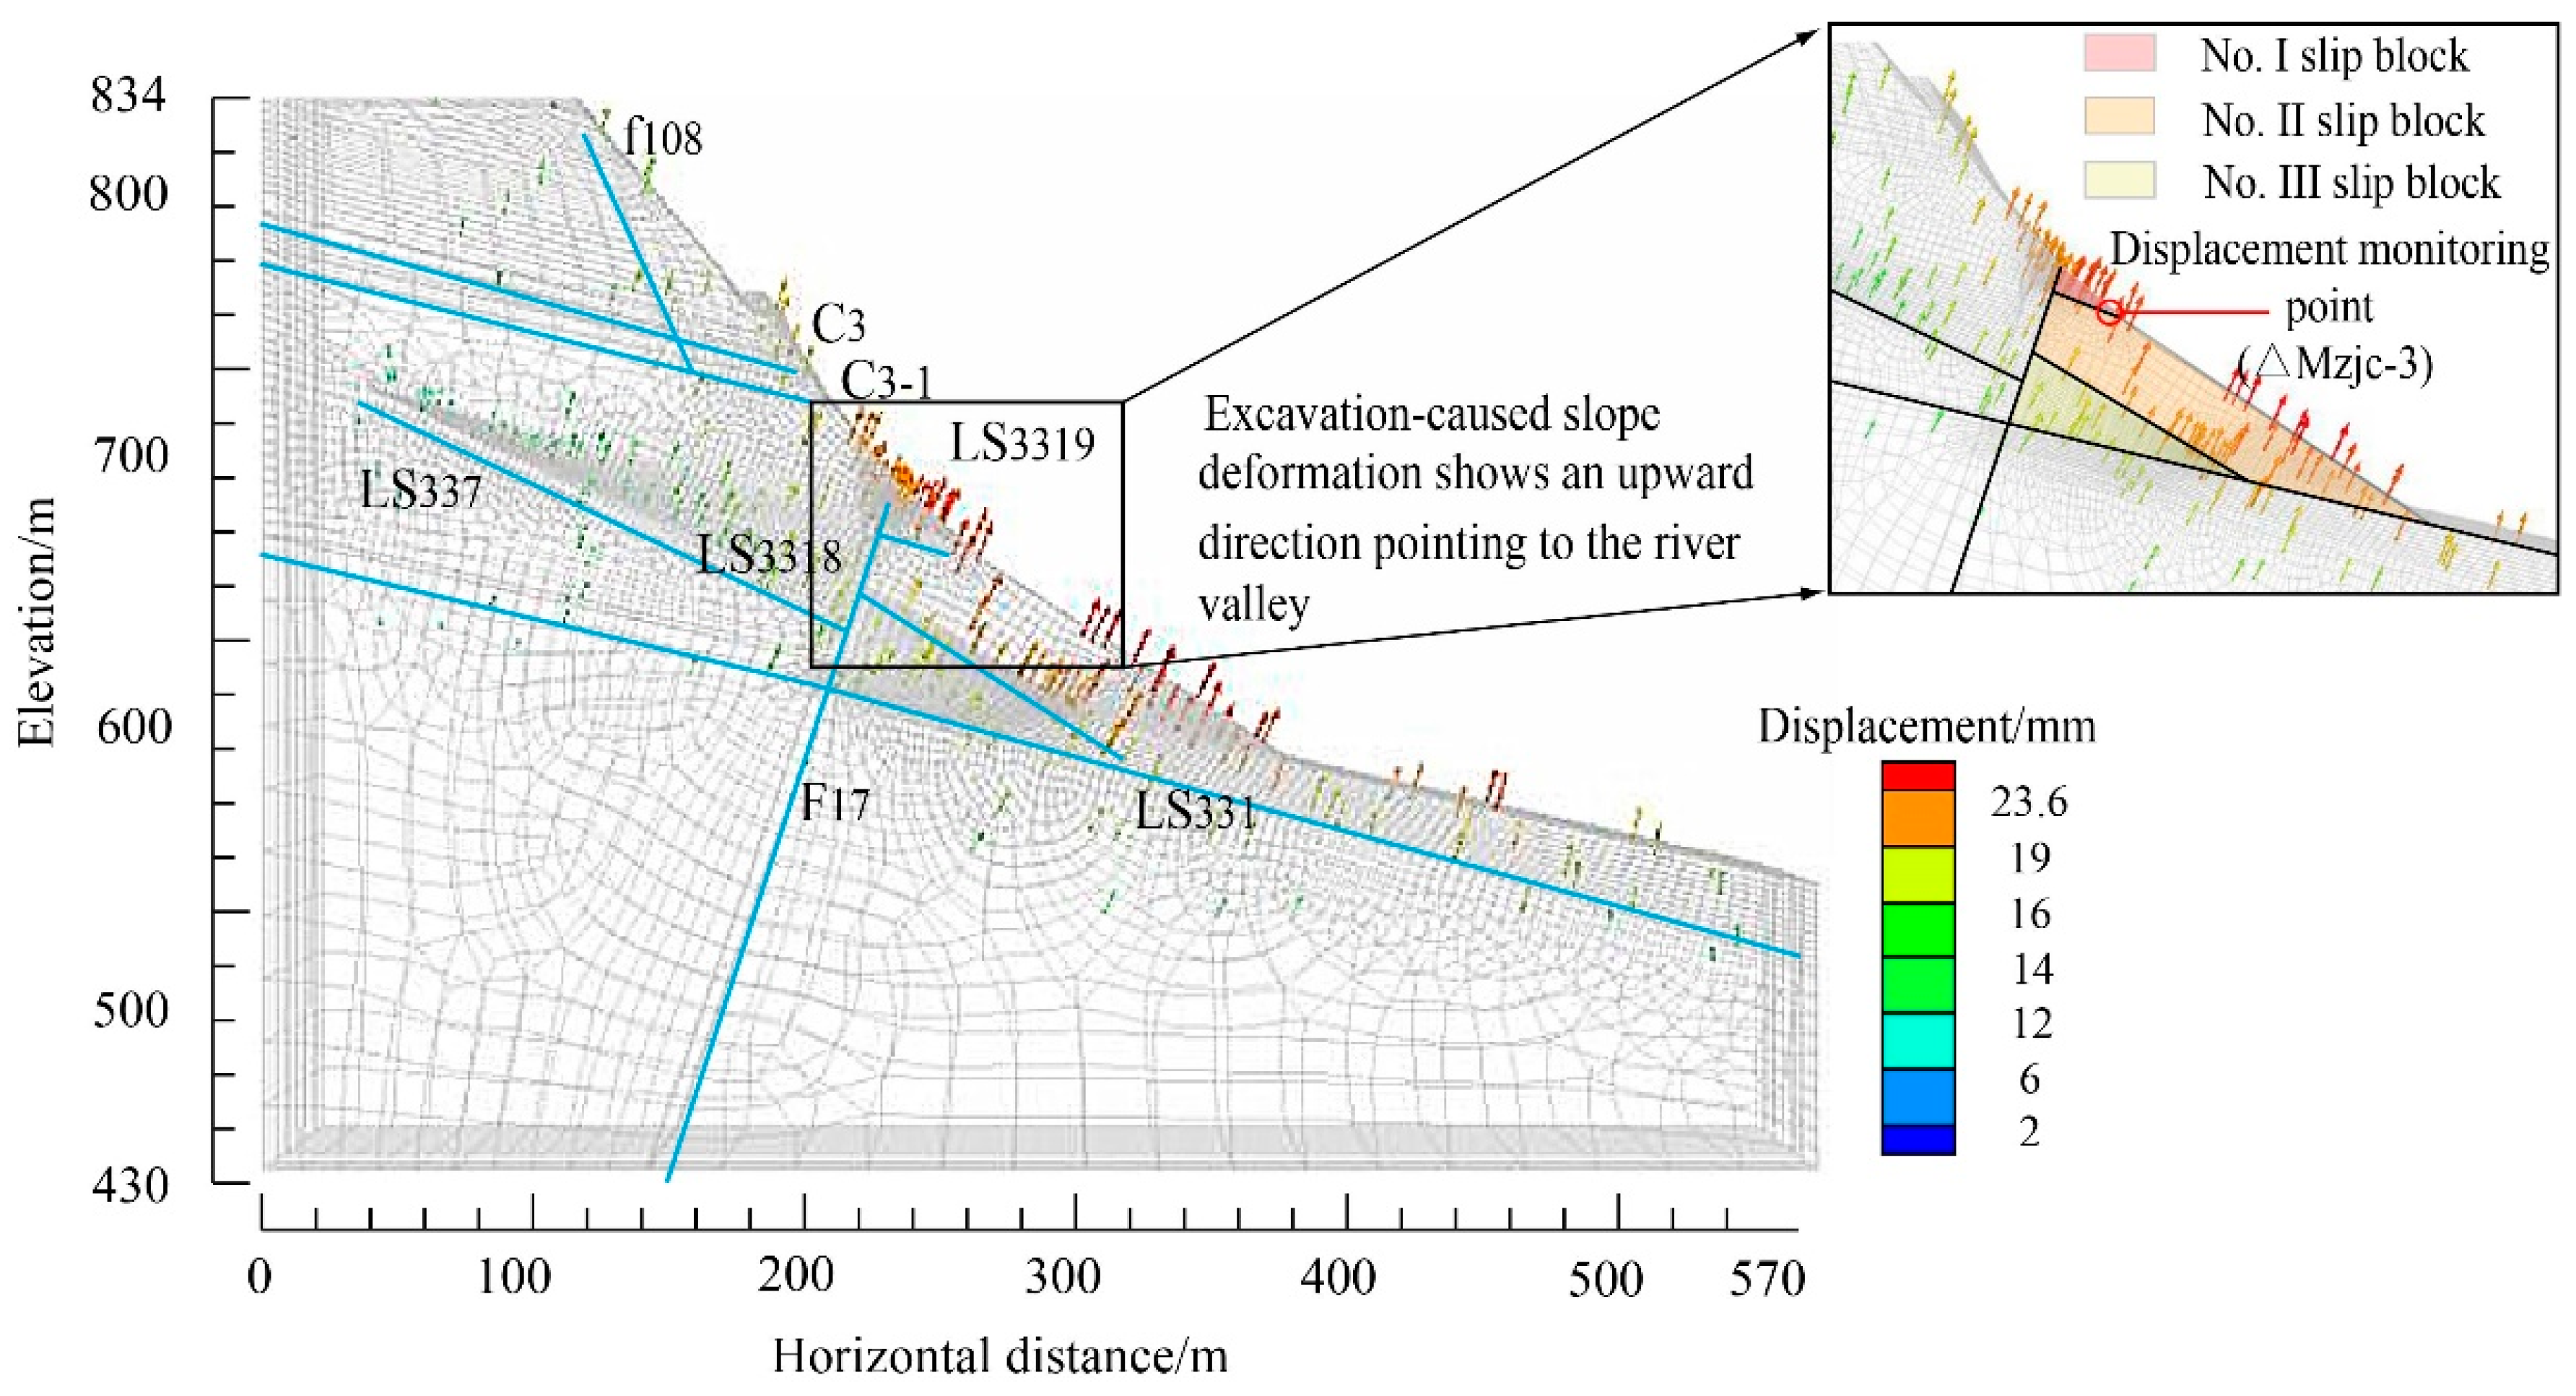
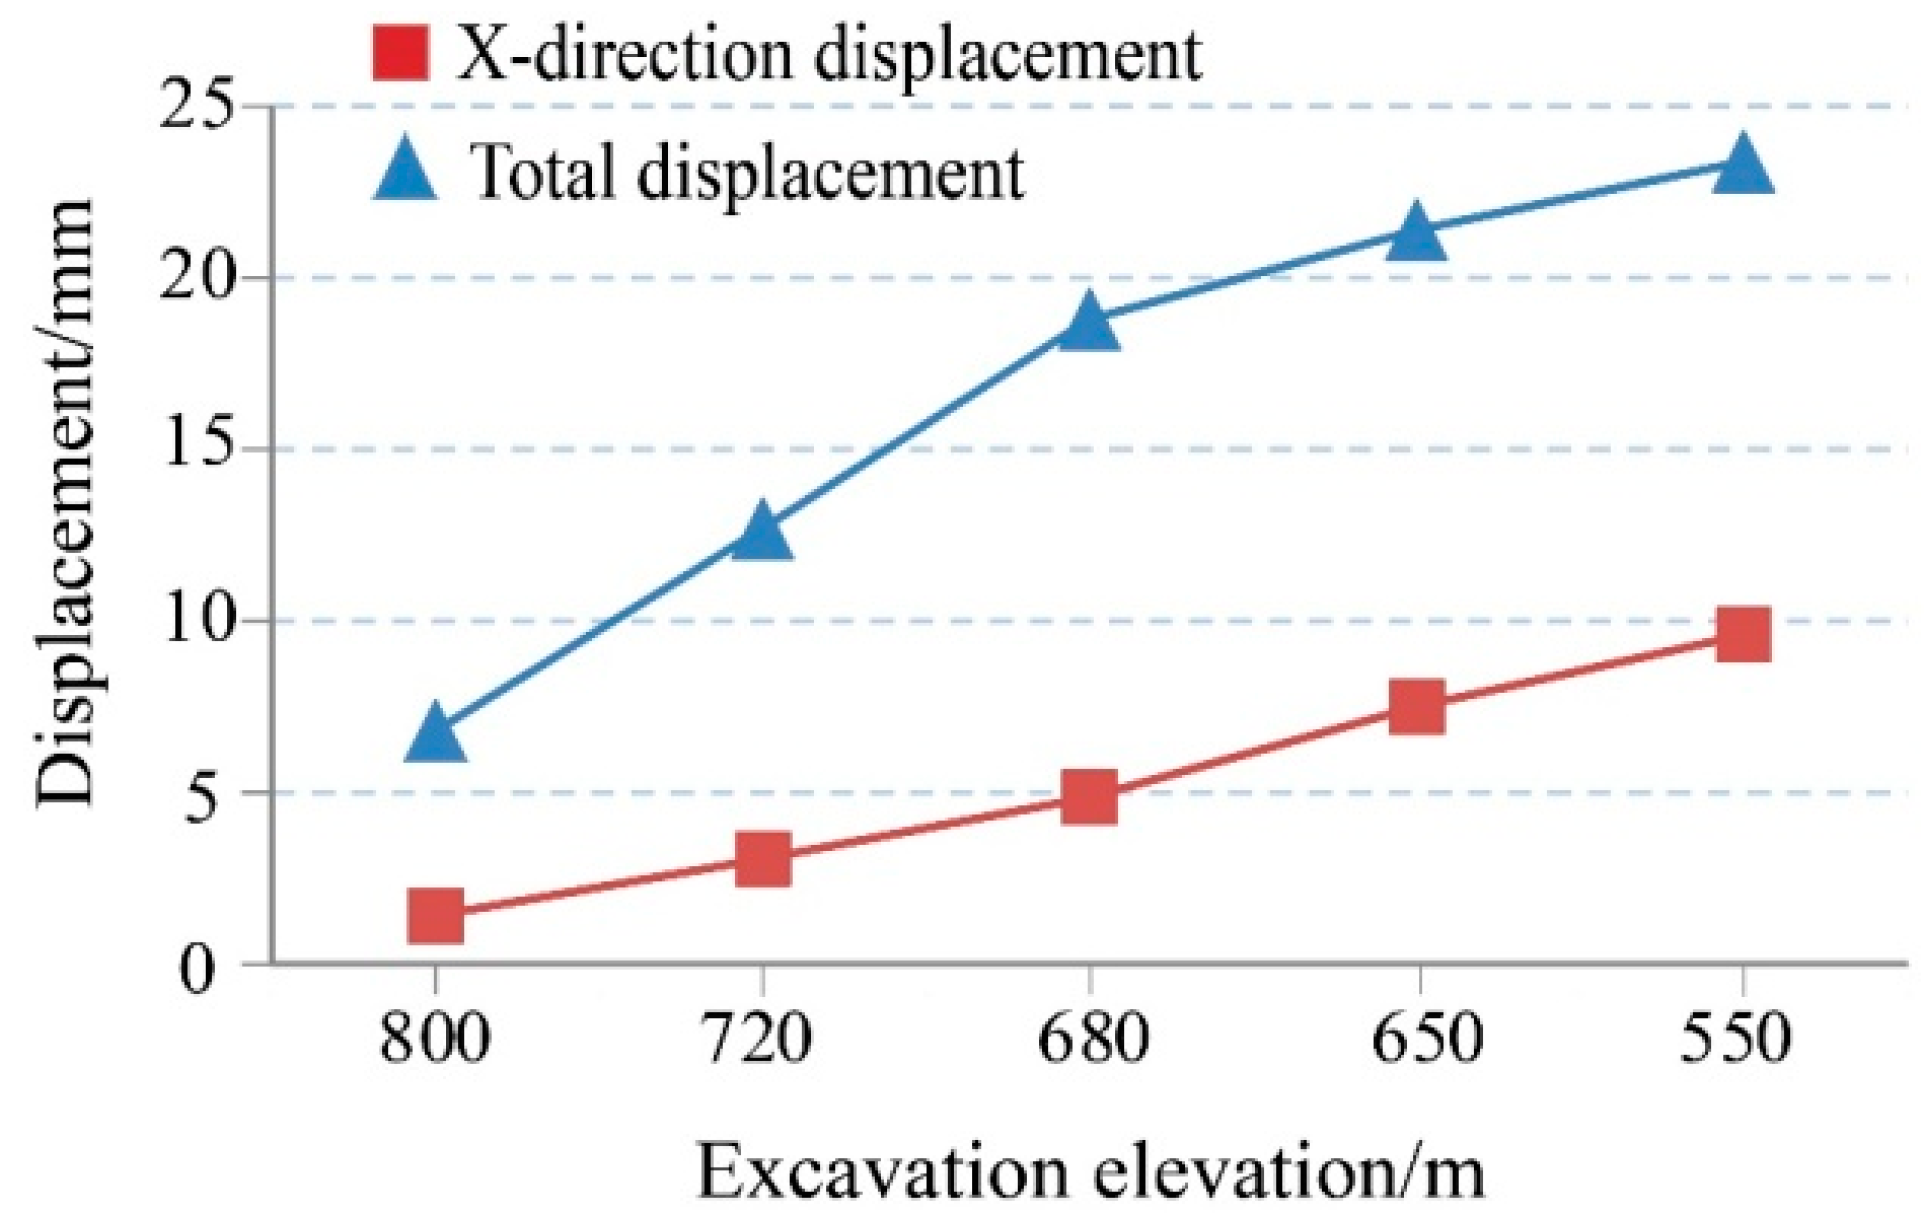
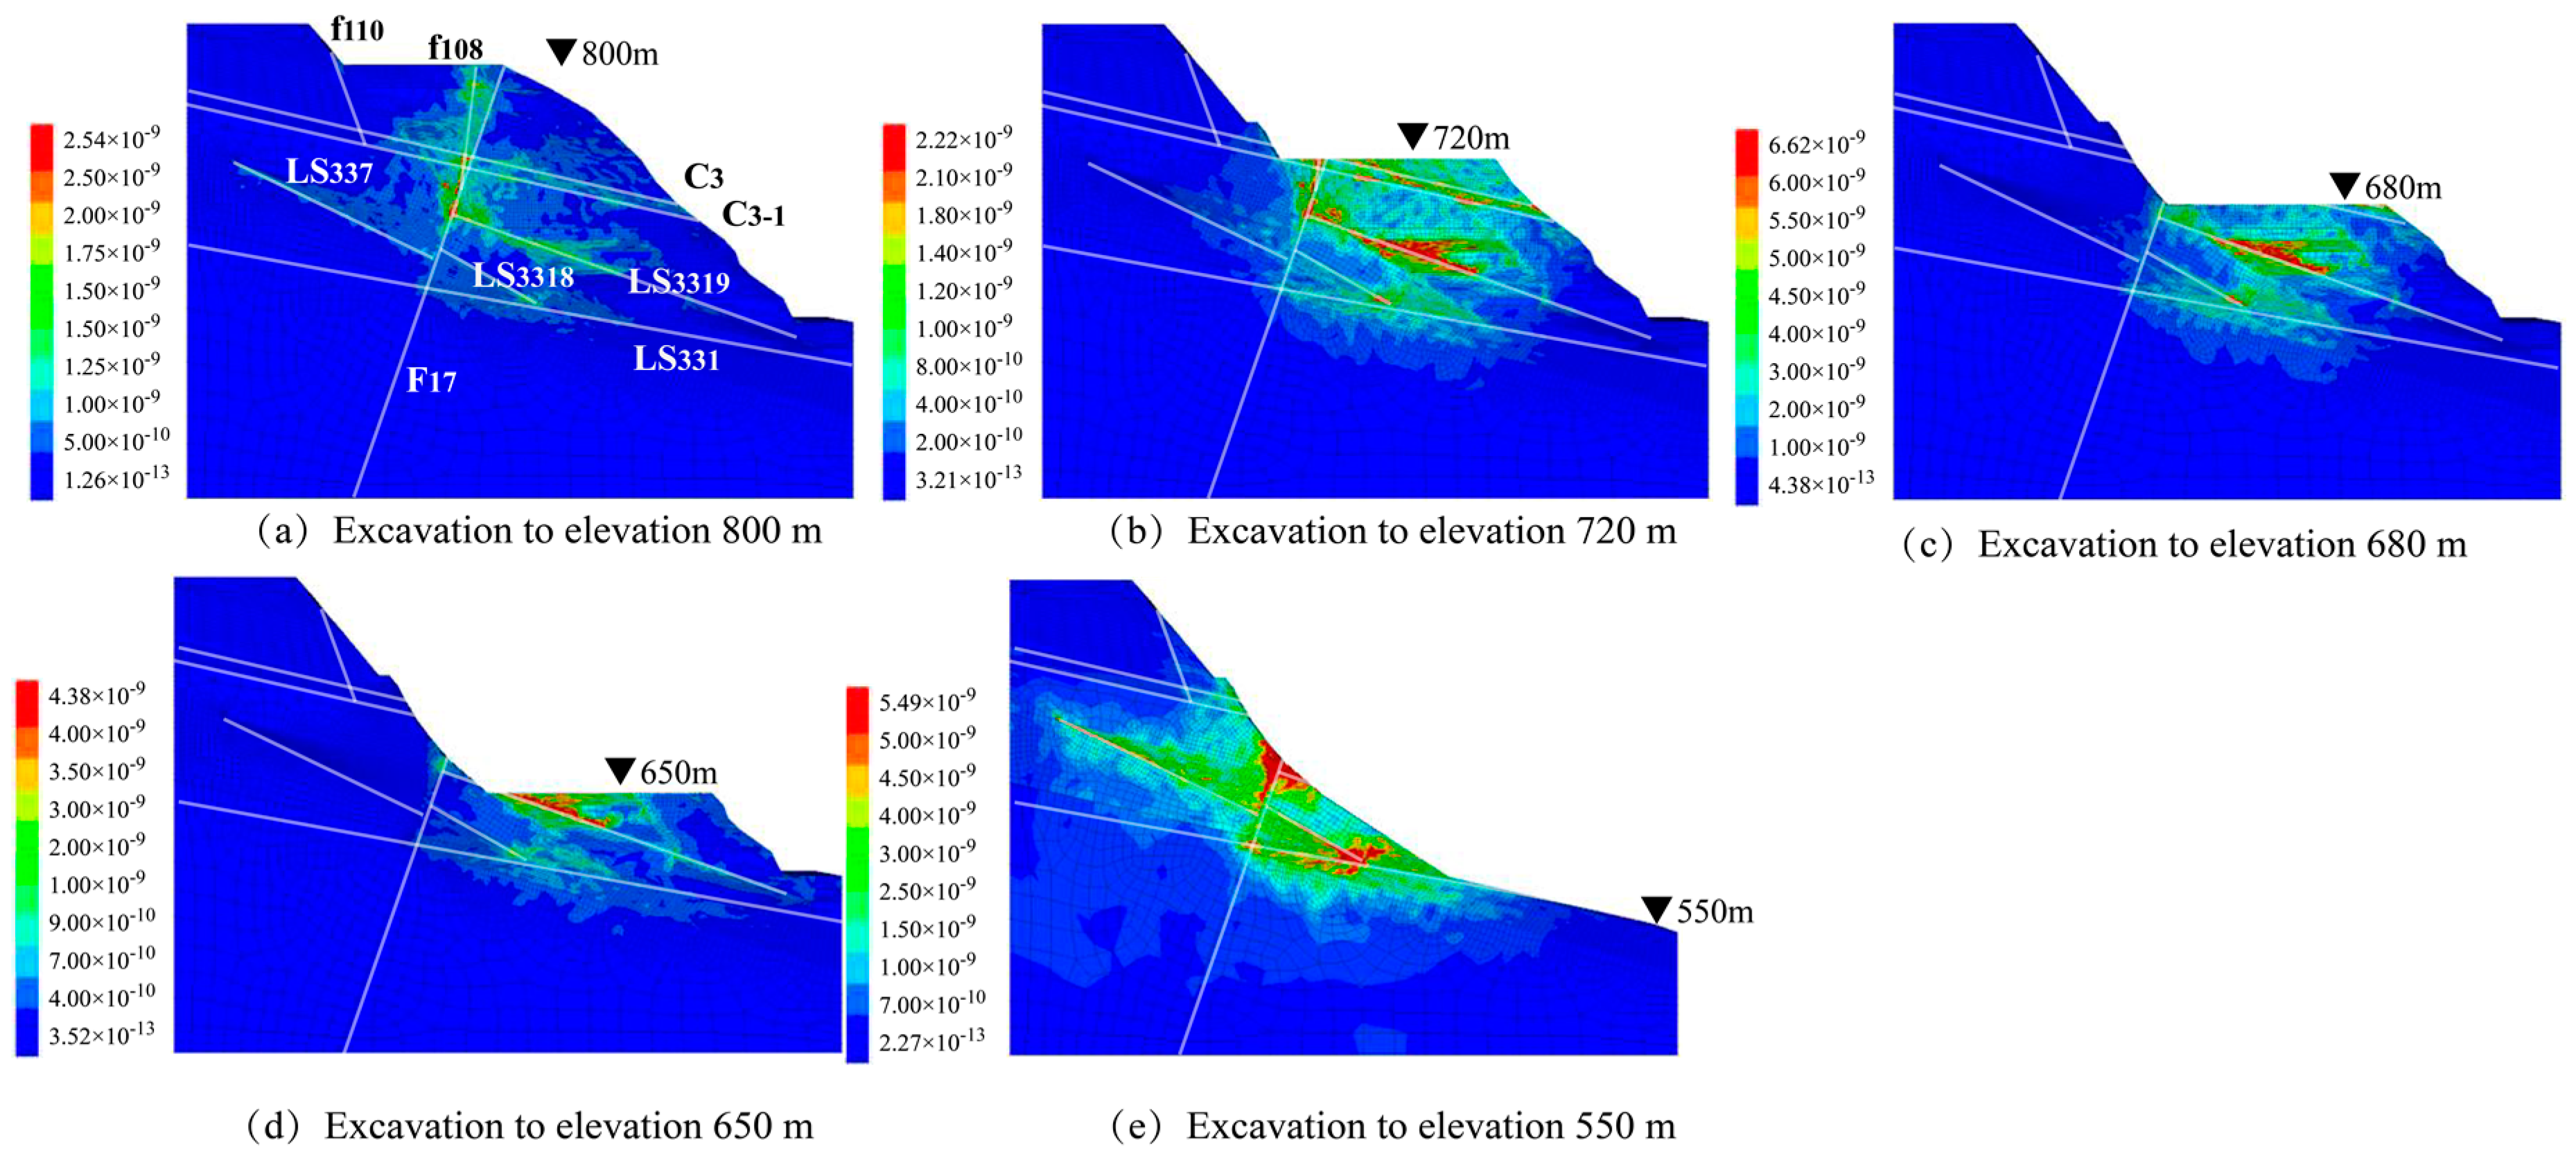
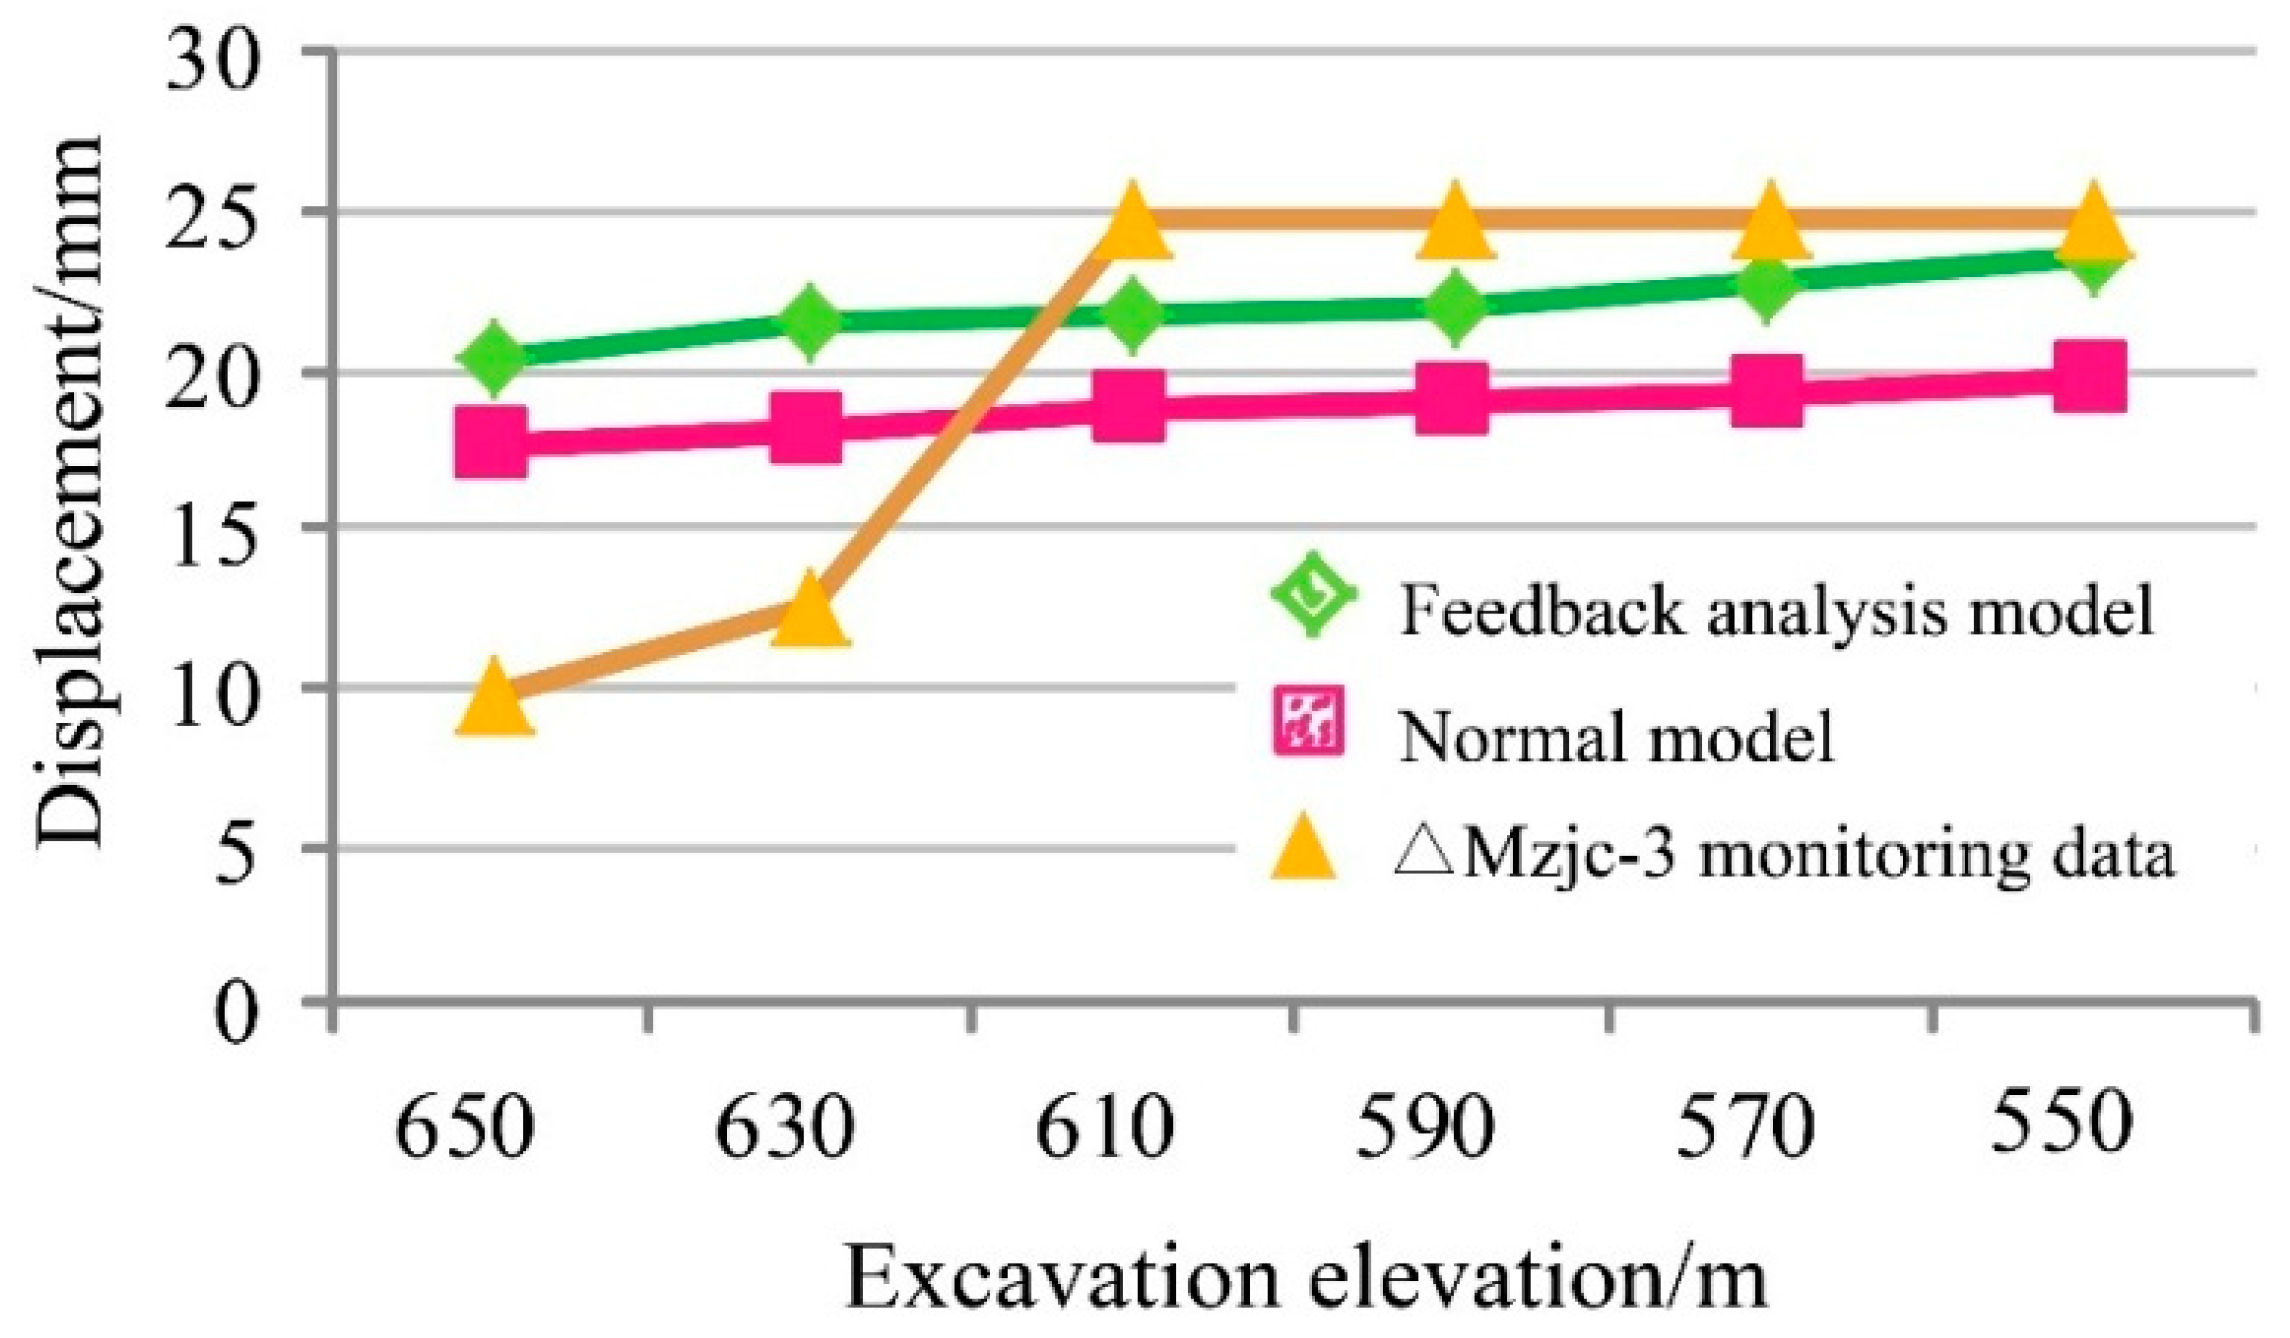
4.3. Results Analysis

Figure 11 demonstrates the displacement nephogram of the rock slope during the excavation of the spandrel arch slope considering the MS event damage effect. Figure 12 shows the displacement vector of the rock slope at excavation to 550 m. The △Mzjc-3 monitoring point of the multipoint extensometer was chosen as the displacement monitoring point of the numerical simulation. Figure 13 indicates the relationship between the horizontal and total displacement of the displacement monitoring point and the excavation process. (1) The excavation-caused slope deformation was composed of the vertical resilience displacement and horizontal displacement. The slope deformed upwards to the valley. However, the degree of deformation of the slope surface was weakened due to the additional anchoring effect. The maximum deformation of the slope was less than 30 mm. (2) The maximum displacement of each layer after excavation occurred near the excavation face, especially at the foot of the weak structural plane. When the excavation reached the 720 m elevation, the largest displacement appeared in the C3 and C3-1 exposed areas; when it reached the 680 m elevation, the largest displacement appeared in the F17 exposed area; and when it reached the 650 m elevation, the largest displacement appeared in the LS3319 exposed area. (3) The influence of the horizontal unloading effect on the slope increased constantly with the lower excavation plane, thus increasing the proportion of the horizontal displacement in the total. When excavation reached the 720 m elevation in the middle and upper part, the horizontal displacement accounted for approximately 21% of the total displacement; when excavation reached the 550 m elevation in the lower part, the horizontal displacement accounted for approximately 41% of the total displacement.
Figure 14 shows the shear strain rate of the rock slope considering the MS damage effect during the excavation process of the spandrel arch on the left bank slope. The red area indicates the largest shear strain rate. After the slope excavation began, the stress concentrated near the weak structural plane due to excavation disturbance, resulting in a large shear strain rate. Shear strain occurred and became more obvious at a lower excavation elevation. The unloading depth of the surrounding rock mass also increased. When excavation reached an elevation of 550 m, the shear strain rate increased dramatically in the wedge area formed by F17 and LS3319, indicating that excavation in the lower part of the slope will affect the deformation on the upper structural plane. The large shear deformation occurred in the interlayer disturbance zone LS3319, mainly due to the presence of large ground stress and weak layers on the upper disc wall. The increase in horizontal unloading after excavation expands the horizontal displacement, resulting in tensile shear deformation of the surrounding rock. Moreover, the shallow surrounding rock mass in this area was columnar-jointed basalt with poor resistance to excavation disturbance. Therefore, to avoid dangerous slip blocks formed by slip surface cutting, the columnar jointed basalt at altitudes of 660 m to 628 m should pay attention to the excavation process and support over time.

4.4. Discussion

Figure 15 shows the deformation comparison of rock slopes under different approaches during excavation process. The △Mzjc-3 monitoring point of the multipoint extensometer was selected to record the excavation processes data, both on the feedback analysis model and the model without importing the MS data. Excavation data at elevations from 650 m to 550 m during the MS monitoring period between 1 March 2016 and 31 December 2016, and the corresponding results of the multipoint extensometer, were selected. It was found that the displacement of the numerical simulation considering MS damage was slightly less than the displacement of the field monitoring. This finding might be attributed without considering the effect of the columnar basalt in the numerical simulation. Compared with the model without considering MS damage, the displacement of the slope considering the MS damage effect was closer to the field monitoring data. However, the increment was not obvious, being only approximately several millimeters. Some interpretations might be that the selected research period was short and that the MS events in the selected period had a small source radius and were distributed. The monitoring displacement of the field multipoint extensometer in the early stage grew faster than that of numerical simulation. This result was mainly because the multipoint extensometer was installed on 14 December 2014 and the displacement during the early stage of installation would clearly grow.

5. Conclusions

Based on the damage-constitutive relationship considering the scale of rock failure, the deformation feedback analysis of the surrounding rock of the left bank slope of Baihetan hydropower station was carried out. The following conclusions can be drawn.
Compared with the traditional constitutive relationship, the extended damage constitutive relationship, considering the rock fracture scale can directly reflect the damage-effect of the microcrack within the rock. The damage constitutive model can select the characterization parameters of the rock fracture scale according to the calculation requirements.
The proposed method integrated MS data with the FLAC3D simulation. In particular, this method applied the source radius to characterize the rock mass fracture scale and analyze the surrounding rock deformation characteristics. Compared to the traditional method, this method can better invert the mechanical properties of the rock mass under construction disturbance, and realize the simulation analysis of the slope stability, considering the effect of MS damage. This method provided a new idea for the quantitative evaluation of surrounding rock failure and the analysis of surrounding rock feedback.
The numerical results indicated that the displacement of the model, considering the impact of MS damage, is closer to the field monitoring data than the model without considering the influence of MS damage. The increment was not obvious; i.e., only a few millimeters. This finding was mainly due to various reasons and limitations. The selected research period was short; the MS event source radius was small; and the distribution was scattered. Moreover, the slope deformation in the simulation considering MS damage was slightly less than that of field monitoring. This reduction may be because the numerical simulation did not consider the influence of the columnar basalt with the obvious deformation characteristics in the area. Therefore, the feedback analysis of rock mass mechanical properties is critical for the stability evaluation of high rock slopes under complex conditions.

Author Contributions

N.X. proposed the idea of feedback analysis of rock slope considering the effect of MS events. Y.Y., B.Q. and Y.T. processed and analyzed the abundant of MS data; L.D. and H.S. wrote the paper.

Funding

The National Key R&D Program of China (No. 2018YFC1505004) and the National Natural Science Foundation of China (No. 51679158).

Acknowledgments

Thanks are given to colleagues at the Baihetan hydropower station for their valuable contributions to the project. Finally, the authors would like to thank the editors and reviewers for their valuable comments and constructive suggestions.

Conflicts of Interest

The authors declare no conflict of interest.

References

  1. Conforti, M.; Ietto, F. An integrated approach to investigate slope instability affecting infrastructures. Bull. Eng. Geol. Env. 2019, 78, 2355–2375. [Google Scholar] [CrossRef]
  2. Ietto, F.; Perri, F.; Cella, F. Weathering characterization for landslides modeling in granitoid rock masses of the Capo Vaticano promontory (Calabria, Italy). Landslides 2018, 15, 43–62. [Google Scholar] [CrossRef]
  3. Li, B.; Li, T.; Xu, N.W.; Dai, F.; Chen, W.F.; Tan, Y.S. Stability assessment of the left bank slope of the Baihetan Hydropower Station, Southwest China. Int. J. Rock Mech. Min. Sci. 2018, 104, 34–44. [Google Scholar] [CrossRef]
  4. Li, S.; Tang, C.; Zhu, W.C.; Liang, Z.Z. Numerical analysis of slope stability based on the gravity increase method. Comput. Geotech. 2009, 36, 1246–1258. [Google Scholar] [CrossRef]
  5. Liu, F.; Tang, C.A.; Ma, T.H.; Tang, L.X. Characterizing Rockbursts Along a Structural Plane in a Tunnel of the Hanjiang-to-Weihe River Diversion Project by Microseismic Monitoring. Rock Mech. Rock Eng. 2019, 52, 1835–1856. [Google Scholar] [CrossRef]
  6. Xu, N.W.; Tang, C.A.; Li, L.C.; Zhou, Z.; Sha, C.; Liang, Z.Z.; Yang, J.Y. Microseismic monitoring and stability analysis of the left bank slope in Jinping first stage hydropower station in southwestern China. Int. J. Ofrock Mech. Min. Sci. 2011, 48, 950–963. [Google Scholar] [CrossRef]
  7. Zhang, P.H.; Yang, T.H.; Yu, Q.L.; Xu, T.; Shi, W.H. Study of a Seepage Channel Formation Using the Combination of Microseismic Monitoring Technique and Numerical Method in Zhangmatun Iron Mine. Rock Mech. Rock Eng. 2016, 49, 3699–3708. [Google Scholar] [CrossRef]
  8. Yang, T.H.; Zhang, F.C.; Yu, Q.L. Research situation of open-pit mining high and steep slope stability and its developing trend. Chin. J. Geotech. Eng. 2011, 32, 1437–1451. [Google Scholar]
  9. Ma, K.; Xu, N.W.; Liang, Z.Z. Stability Assessment of the Excavated Rock Slope at the Dagangshan Hydropower Station in China Based on Microseismic Monitoring. Adv. Civ. Eng. 2018, 104, 34–44. [Google Scholar] [CrossRef]
  10. Feng, X.T.; Zhou, H.; Li, S.J. System of intelligent evaluation and prediction in space-time for safety of rock engineering under hazardous environment. Chin. J. Geotech. Eng. 2008, 27, 1741–1756. [Google Scholar]
  11. Sheng, Q.; Xiu, X.L.; Feng, X.T. Displacement back analysis for the high slope of the Three Gorges Project considering the effect of excavation effect. Chin. J. Geotech. Eng. 2000, 19, 987–993. [Google Scholar]
  12. Wang, R.H.; Li, J.L.; Liu, J. Three-dimensional stability analysis of dam abutment high slope dynamic behaviors considering rock mass unloading. Chin. J. Geotech. Eng. 2007, 26, 3515–3521. [Google Scholar]
  13. Zhou, H.M.; Sheng, Q.; Li, W.S. Excavation-disturbed zone and weaken degree of mechanical properties for rockmass of TPG shiplockslope. Chin. J. Geotech. Eng. 2004, 7, 1078–1081. [Google Scholar]
  14. Bossi, G.; Borgatti, L.; Gottardi, G.; Marcato, G. The Boolean Stochastic Generation method-BoSG: A tool for the analysis of the error associated with the simplification of the stratigraphy in geotechnical models. Eng. Geol. 2016, 203, 99–106. [Google Scholar] [CrossRef]
  15. Pasculli, A.; Calista, M.; Sciarra, N. Variability of local stress states resulting from the application of Monte Carlo and fnite difference methods to the stability study of a selected slope. Eng. Geol. 2018, 245, 370–389. [Google Scholar] [CrossRef]
  16. Calista, M.; Pasculli, A.; Sciarra, N. Reconstruction of the geotechnical model considering random parameters distributions. Eng. Geol. Soc. Territ. 2015, 2, 1347–1351. [Google Scholar]
  17. Pasculli, A.; Pugliese, A.; Romeo, R.W.; Sanò, T. The uncertainty in the Local Seismic Response Analysis. Seism. Eng. Int. Conf. Mercea AIP 2008, 1020, 321–328. [Google Scholar]
  18. Wang, J.C.; Chang, L.S.; Chen, Y.J. Study on probability damage evolutionary rule of jointed rock mass slope. Chin. J. Geotech. Eng. 2006, 25, 1396–1401. [Google Scholar]
  19. Xu, N.W.; Liang, Z.Z.; Tang, C.A. Three-dimensional feedback analysis of rock slope stability based on micro-seismic monitoring. Chin. J. Geotech. Eng. 2014, 33, 3093–3104. [Google Scholar]
  20. ITASCA Consulting Group Inc. Fast Lagrangian Analysis of Continua in Dimensions; Version 5. 0; Itasca Consulting Group Inc.: Minneapolis, MN, USA, 2012. [Google Scholar]
  21. Kang, Y.X. Computer software programming based on C language. Pract. Electron. 2018, 16, 53–54. [Google Scholar]
  22. Cai, M.; Kaiser, P.K.; Martin, C.D. Quantification of rock mass damage in underground excavations from micro-seismicevent monitoring. Int. J. Rock Mech. Min. Sci. 2001, 38, 1135–1145. [Google Scholar] [CrossRef]
  23. Horii, H.; Nemat-Nasser, S. Overall moduli of solids with microcracks: Load-induced anisotropy. J. Mech. Phys. Solids 1983, 31, 155–171. [Google Scholar] [CrossRef]
  24. Cai, M.; Horii, H. A constitutive model of highly jointed rock masses. Mech. Mater. 1992, 13, 217–246. [Google Scholar] [CrossRef]
  25. Wang, X.B.; Jin, K.; Yao, W. Report on Engineering Geology of Deformation Treatment of the Left Bank Dam Foundation and Dam Abutment Slope at the Elevation of 720-628 m of the Baihetan Hydropower Station Along Jinshajiangriver; PowerChina Huadong Engineering Corporation Limited: Hangzhou, China, 2015; p. 147. (In Chinese) [Google Scholar]
  26. Xu, N.W.; Wu, J.Y.; Dai, F. Comprehensive evaluation of the left bank slope stability at the Baihetanhy dropower station in Southwest China. Bull. Eng. Geol. Environ. 2018, 77, 1567–1588. [Google Scholar] [CrossRef]
  27. Dai, F.; Li, B.; Xu, N.W. Microseismicmonitoring of the left bank slope at the Baihetanhydropowerstation. Rock Mech. Rock Eng. 2017, 50, 225–232. [Google Scholar] [CrossRef]
  28. Hydro China Huadong Engineering Corporation. Bidding Design Report for Excavation and Supports of Left and Right Dam Spandrels above 600 m Elevation at Baihetan Hydropower Station Along Jinsha River; Hydro China Huadong Engineering Corporation: Hangzhou, China, 2013. [Google Scholar]
  29. General Institute of Water Conservancy and Hydropower Planning and Design. GB50287-2006 Code for Hydropower Engineering Geological Investigation; General Institute of Water Conservancy and Hydropower Planning and Design: Beijing, China, 2006. [Google Scholar]
  30. Xu, N.W.; Li, B.; Dai, F. Stability analysis of bedding rock slope during excavation based on micro-seismic monitoring. Chin. J. Rock Mech. Eng. 2016, 35, 2089–2097. [Google Scholar]
  31. Brune, J.N. Tectonic stress and the spectra of seismic shear waves from earthquakes. J. Geophys. Res. 1970, 75, 4997–5009. [Google Scholar] [CrossRef] [Green Version]
  32. Madariaga, R. Dynamics of an expanding circular fault. Bull. Seismol. Soc. Am. 1976, 66, 639–666. [Google Scholar]
Figure 1. Project location map [26] (Copyright © 2017, Springer Nature).
Applsci 09 03409 g001
Figure 2. Photographs of the spandrel groove high slopes after excavation. (a) The aerial view of the rock slopes and (b) a partially enlarged detail of the left bank slope [26] (Copyright © 2017, Springer Nature).
Applsci 09 03409 g002
Figure 3. Geological cross-section of the left bank slope along the longitudinal axis of the arch dam after excavation to an elevation of 628 m [26] (Copyright © 2017, Springer Nature).
Applsci 09 03409 g003
Figure 4. (a) Sprayed concrete cracks occurred at the sidewall of PSL2, (b) sprayed concrete spalling occurred at the peripheries of the entrances to WML2, (c) cracks occurred along fault F17 at the downstream slope of the spandrel groove, and (d) Sprayed shotcrete spalling occurred at the sidewall of WML1.
Applsci 09 03409 g004
Figure 5. Numerical model of the rock slope.
Applsci 09 03409 g005
Figure 6. Detailed excavation schedule of the rock slope.
Applsci 09 03409 g006
Figure 7. Dam foundation anchor support layout (a) elevations from 620 m to 600 m, and (b) profile of the arch dam downstream sideline.
Applsci 09 03409 g007
Figure 8. Reinforcement diagram in the numerical model.
Applsci 09 03409 g008
Figure 9. Import of microseismic (MS) data to the numerical model during the selected period between 1 December 2014 and 31 January 2015. (a) Front view, (b) top view, and (c) numerical model considering the MS effect.
Applsci 09 03409 g009
Figure 10. Import of MS data to the numerical model during the selected period between 1 April 2016 and 31 December 2016. (a) Front view, (b) top view, and (c) numerical model considering the MS effect.
Applsci 09 03409 g010
Figure 11. Slope displacement nephogram considering the effect of MS event destruction during excavation at an elevation of (a) 800 m, (b) 720 m, (c) 680 m, (d) 650 m, and (e) 550 m.
Applsci 09 03409 g011
Figure 12. Displacement vector graph of the rock slope with excavation to an elevation of 550 m.
Applsci 09 03409 g012
Figure 13. The variation in the horizontal displacement and total displacement at the monitoring point.
Applsci 09 03409 g013
Figure 14. Shear rate of the rock slope considering the damaging effect of the MS event during excavation processes. Excavation to elevation (a) 800 m, (b) 720 m, (c) 680 m, (d) 650 m, and (e) 550 m.
Applsci 09 03409 g014
Figure 15. Deformation comparison of the rock slope using different approaches during excavation processes.
Applsci 09 03409 g015
Table 1. Characteristics of the interlayer zones.
No.OccurrenceThickness(cm)Extension Length (m)
C3N40°–55°E, SE∠15°–20°10–40 850
C3-1N40°–50°E,.SE∠15°–20°5–30 800
Table 2. Characteristics of the faults.
No.LocationOccurrenceWidth (m)Extension Length (m)
F14Downstream of the arch damN55°–65°W, NE(SW)∠80°–90°0.5–1.4 850
F16Downstream of the arch damN60°–70°W, NE(SW)∠80°–90°0.3–1.5800
F17Arch dam foundationN35°–45°E, NW∠70°–80°0.5–3.0 1400
Table 3. Intraformational disturbed belts.
No.OccurrenceWidth (cm)Condition
LS337N20°–45°E, SE∠18°–30°20–50The thickness is 10–40 cm, and the occurrence varies greatly
LS331N47°E, SE∠16°2–30Breccia and cuttings are the main ones, and the thickness varies greatly
LS3318N34°E, SE∠30°20–30The breccia and the cuttings are mainly distributed, and the top and bottom are distributed with a small amount of mud
LS3319N20°–30°E, SE∠22°–28°20–40The breccia and the cuttings are mainly distributed, and the top and bottom are distributed with a small amount of mud
Table 4. Mechanical parameters in the numerical calculation [25].
Rock Mass TypeElasticity Modulus
(GPa)
Compressive Strength
(MPa)
Poisson′s RatioShear StrengthDensity (g/cm3)
Φ/(°)c/(MPa)
II151000.23 361.42.80
III112700.24 361.12.68
III211550.26 350.752.60
IV5350.32 330.52.50
f1100.6200.35280.152.22
f1080.3160.35270.152.20
F171230.34280.152.13
C3-10.71220.35 280.042.05
C30.4180.34 280.12.13
LS33190.25150.33260.12.11
LS3370.2180.35 250.052.03
LS33180.3100.35 260.12.14
LS3311.3230.35 270.062.15
Overburden layer2300.22 321.42.30

