Personal Control of the Indoor Environment in Offices: Relations with Building Characteristics, Influence on Occupant Perception and Reported Symptoms Related to the Building—The Officair Project

 , , , , , , and
Abstract
:1. Introduction
2. Materials and Methods
2.1. Data Collection
2.2. Characteristics of the Buildings and Access to Control
2.3. Perceived Control over the Indoor Environment
2.4. Personal Comfort, Reported Health Symptoms and Self-Assessed Productivity
2.5. Statistical Analysis
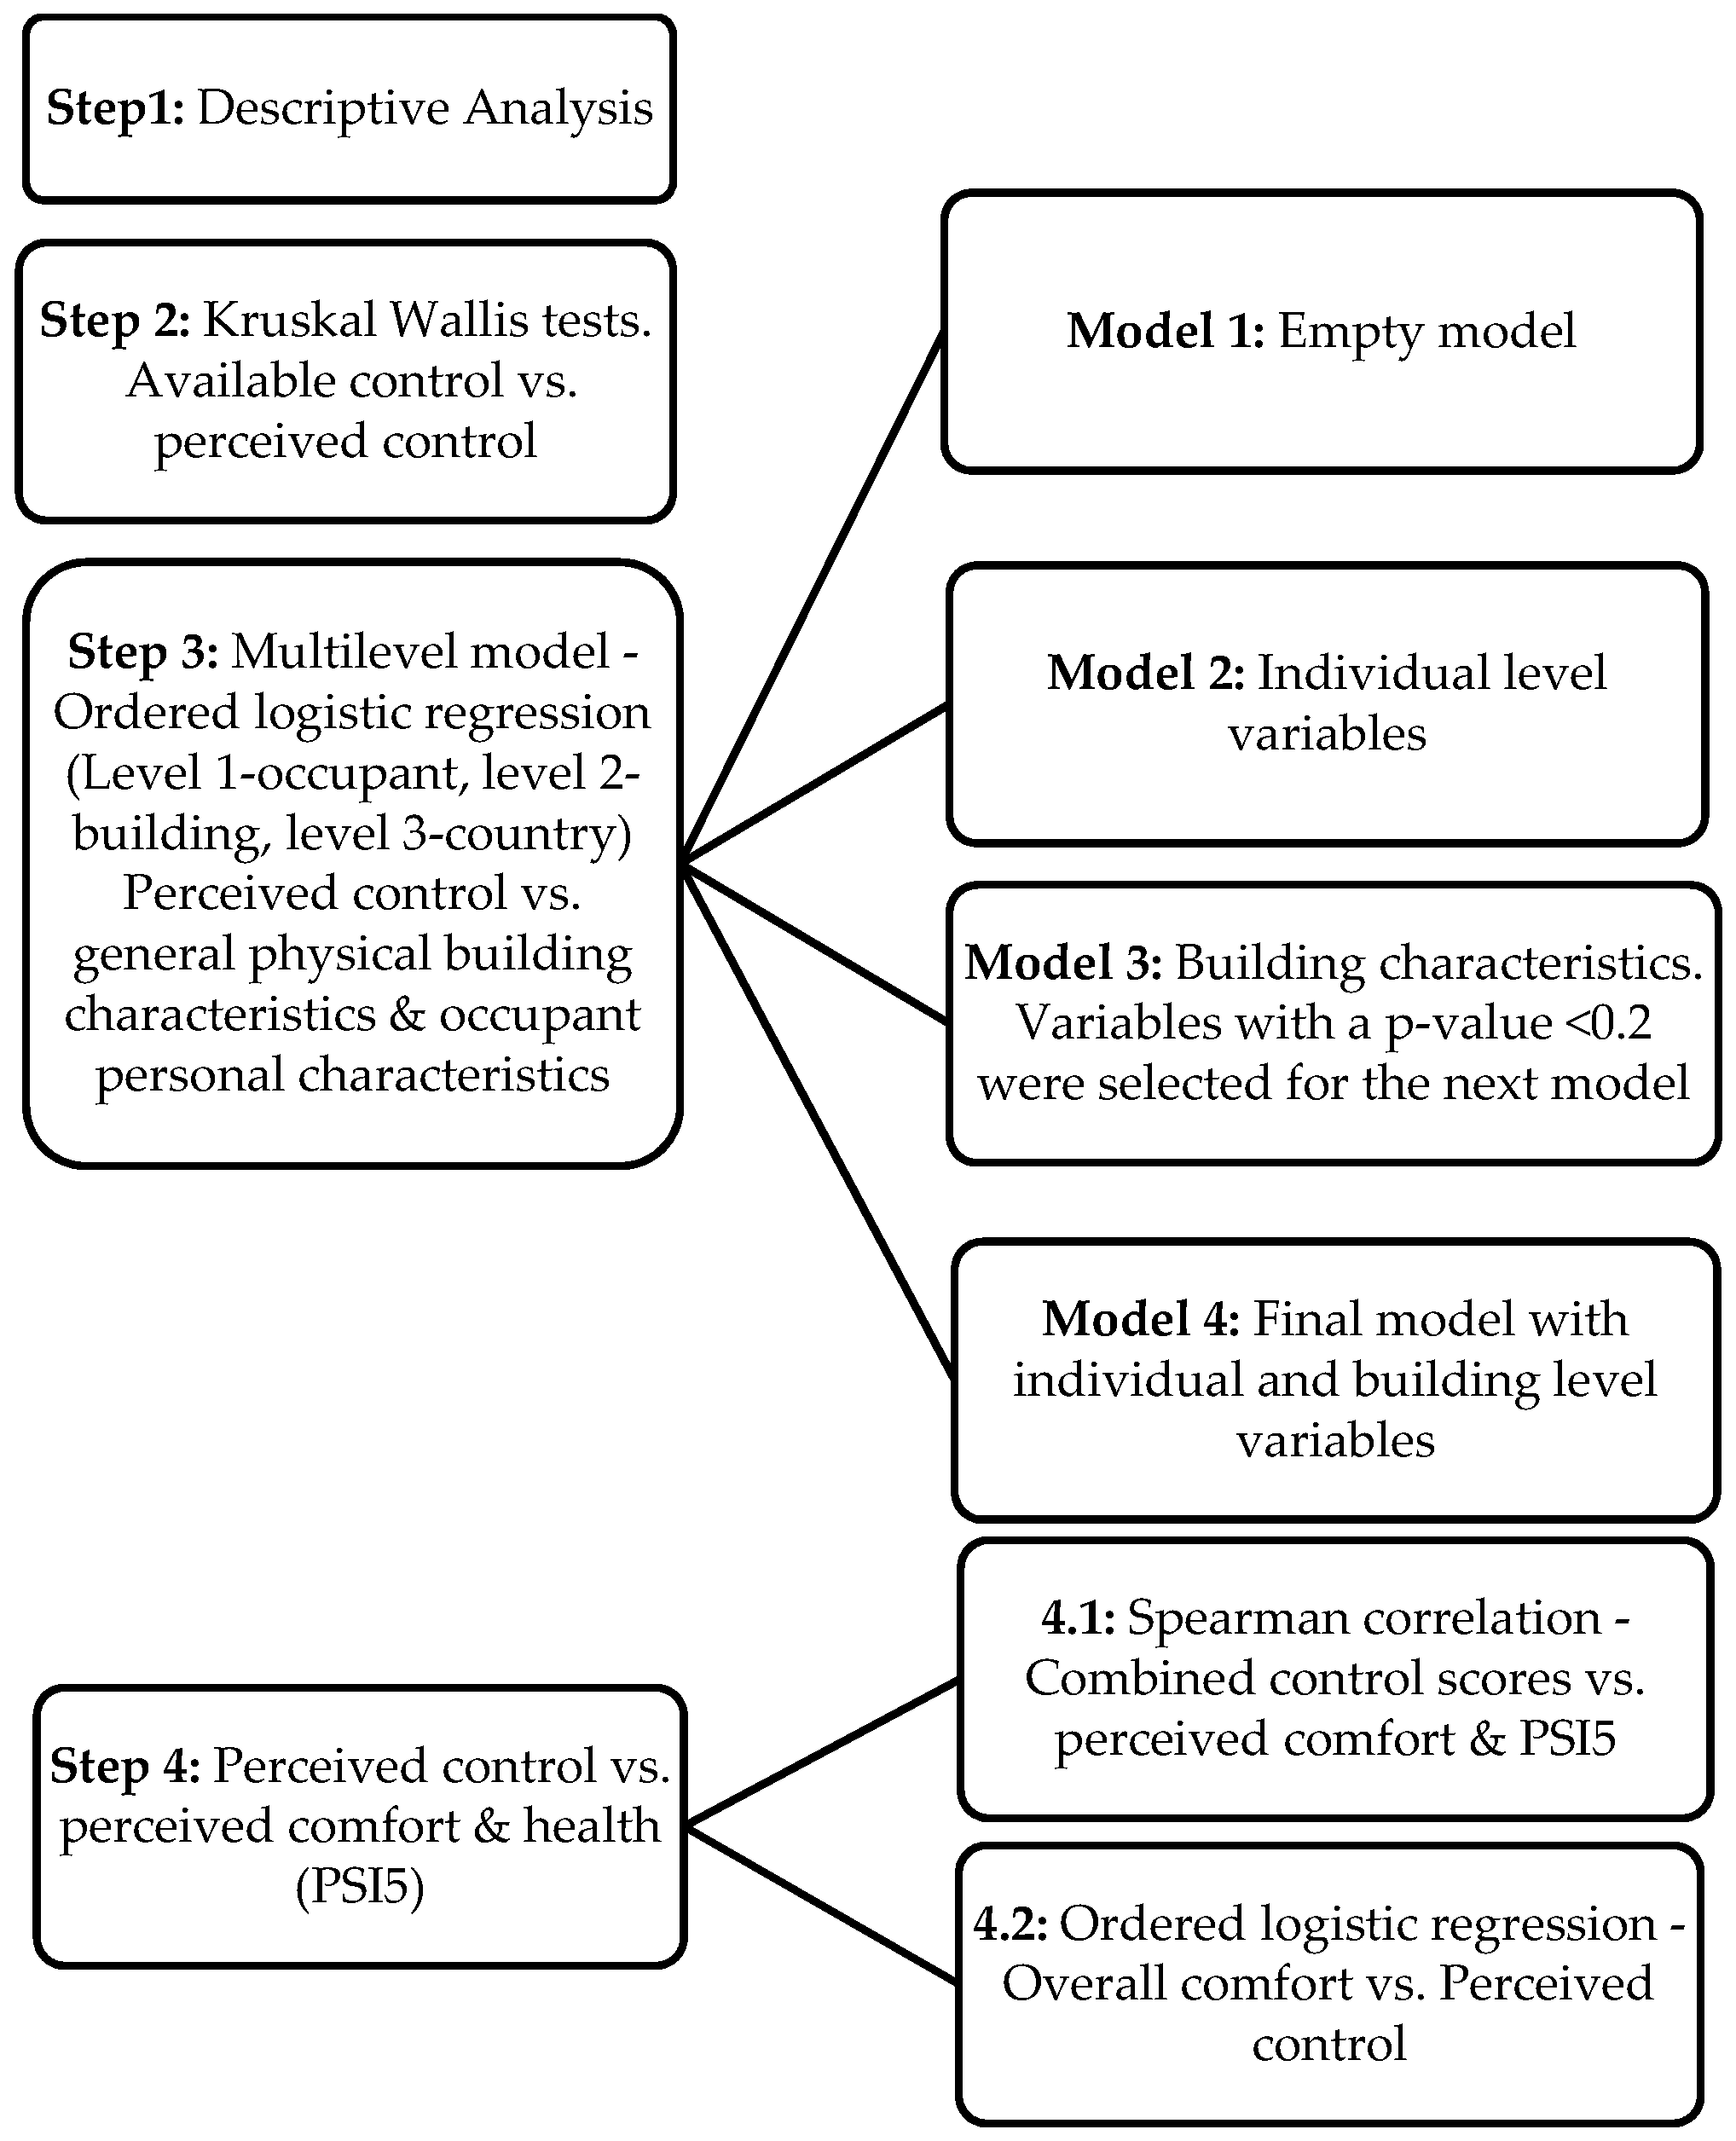
- Descriptive results were obtained.
- The relationship between the occupants’ overall combined perceived control and the general physical building characteristics as well as the occupant personal characteristics was examined by applying a multilevel model [43,44], to account for the three-level structure of our data (level 1-occupant, level 2-building, level 3-country). The ordered logistic regression analysis was applied using building and country as random effects and the covariates as fixed effects. Four step-by-step models were applied. The first was an empty model without any variable and with building and country variance only. In the second model, individual level variables were imported. The final version of the second model included variables, with p-value below 0.2, such as gender, age (in four groups, <35, 35–45, 46–55, >55), effort reward ratio, experience of negative events, use of air fresheners at home, type of job (managerial, professional, clerical/secretarial, other), type of job contract (full-time, part-time), and job contract duration (permanent, fixed-term). In the third model, building characteristics were imported iteratively on the second model to identify significant relations with the perceived control. Variables with a p-value below 0.2 were selected to be used in the next model. In the fourth model, both individual and building level variables were imported. The results of the fixed effects were reported in Odds Ratios (OR) and 95% Confidence Interval (CI). For the random effects, the explained variance is reported as well as the Proportional Change in Variance (PCV) between the null model and the final model with the variables.
- The potential relations between the occupants’ perceived control and perceived comfort and reported health symptoms (PSI5) were examined by using the spearman correlation [45]. This study focused on the correlation between the various combined control scores (e.g., perceived control over temperature and ventilation) and the perceived occupants’ comfort. Additionally, the dependent variable (overall comfort satisfaction) and the response-variables were expressed in values on an ordinal scale; hence, ordinal regression analysis was employed to determine the impact of the controlling parameters on overall comfort. In the regression model, the response-dependent variable was the overall comfort satisfaction and the predictor-independent variables were the satisfaction for each personal controlling parameter as evaluated by the occupants. The results are presented in the format of OR and its CI95%. The ORs were used to rank the effect of the personal controlling parameters on overall comfort. p-values <0.05 were considered as statistically significant. The statistical package IBM SPSS Statistics [46] was used for the analysis.
3. Results
3.1. Characteristics of Perceived Personal Control
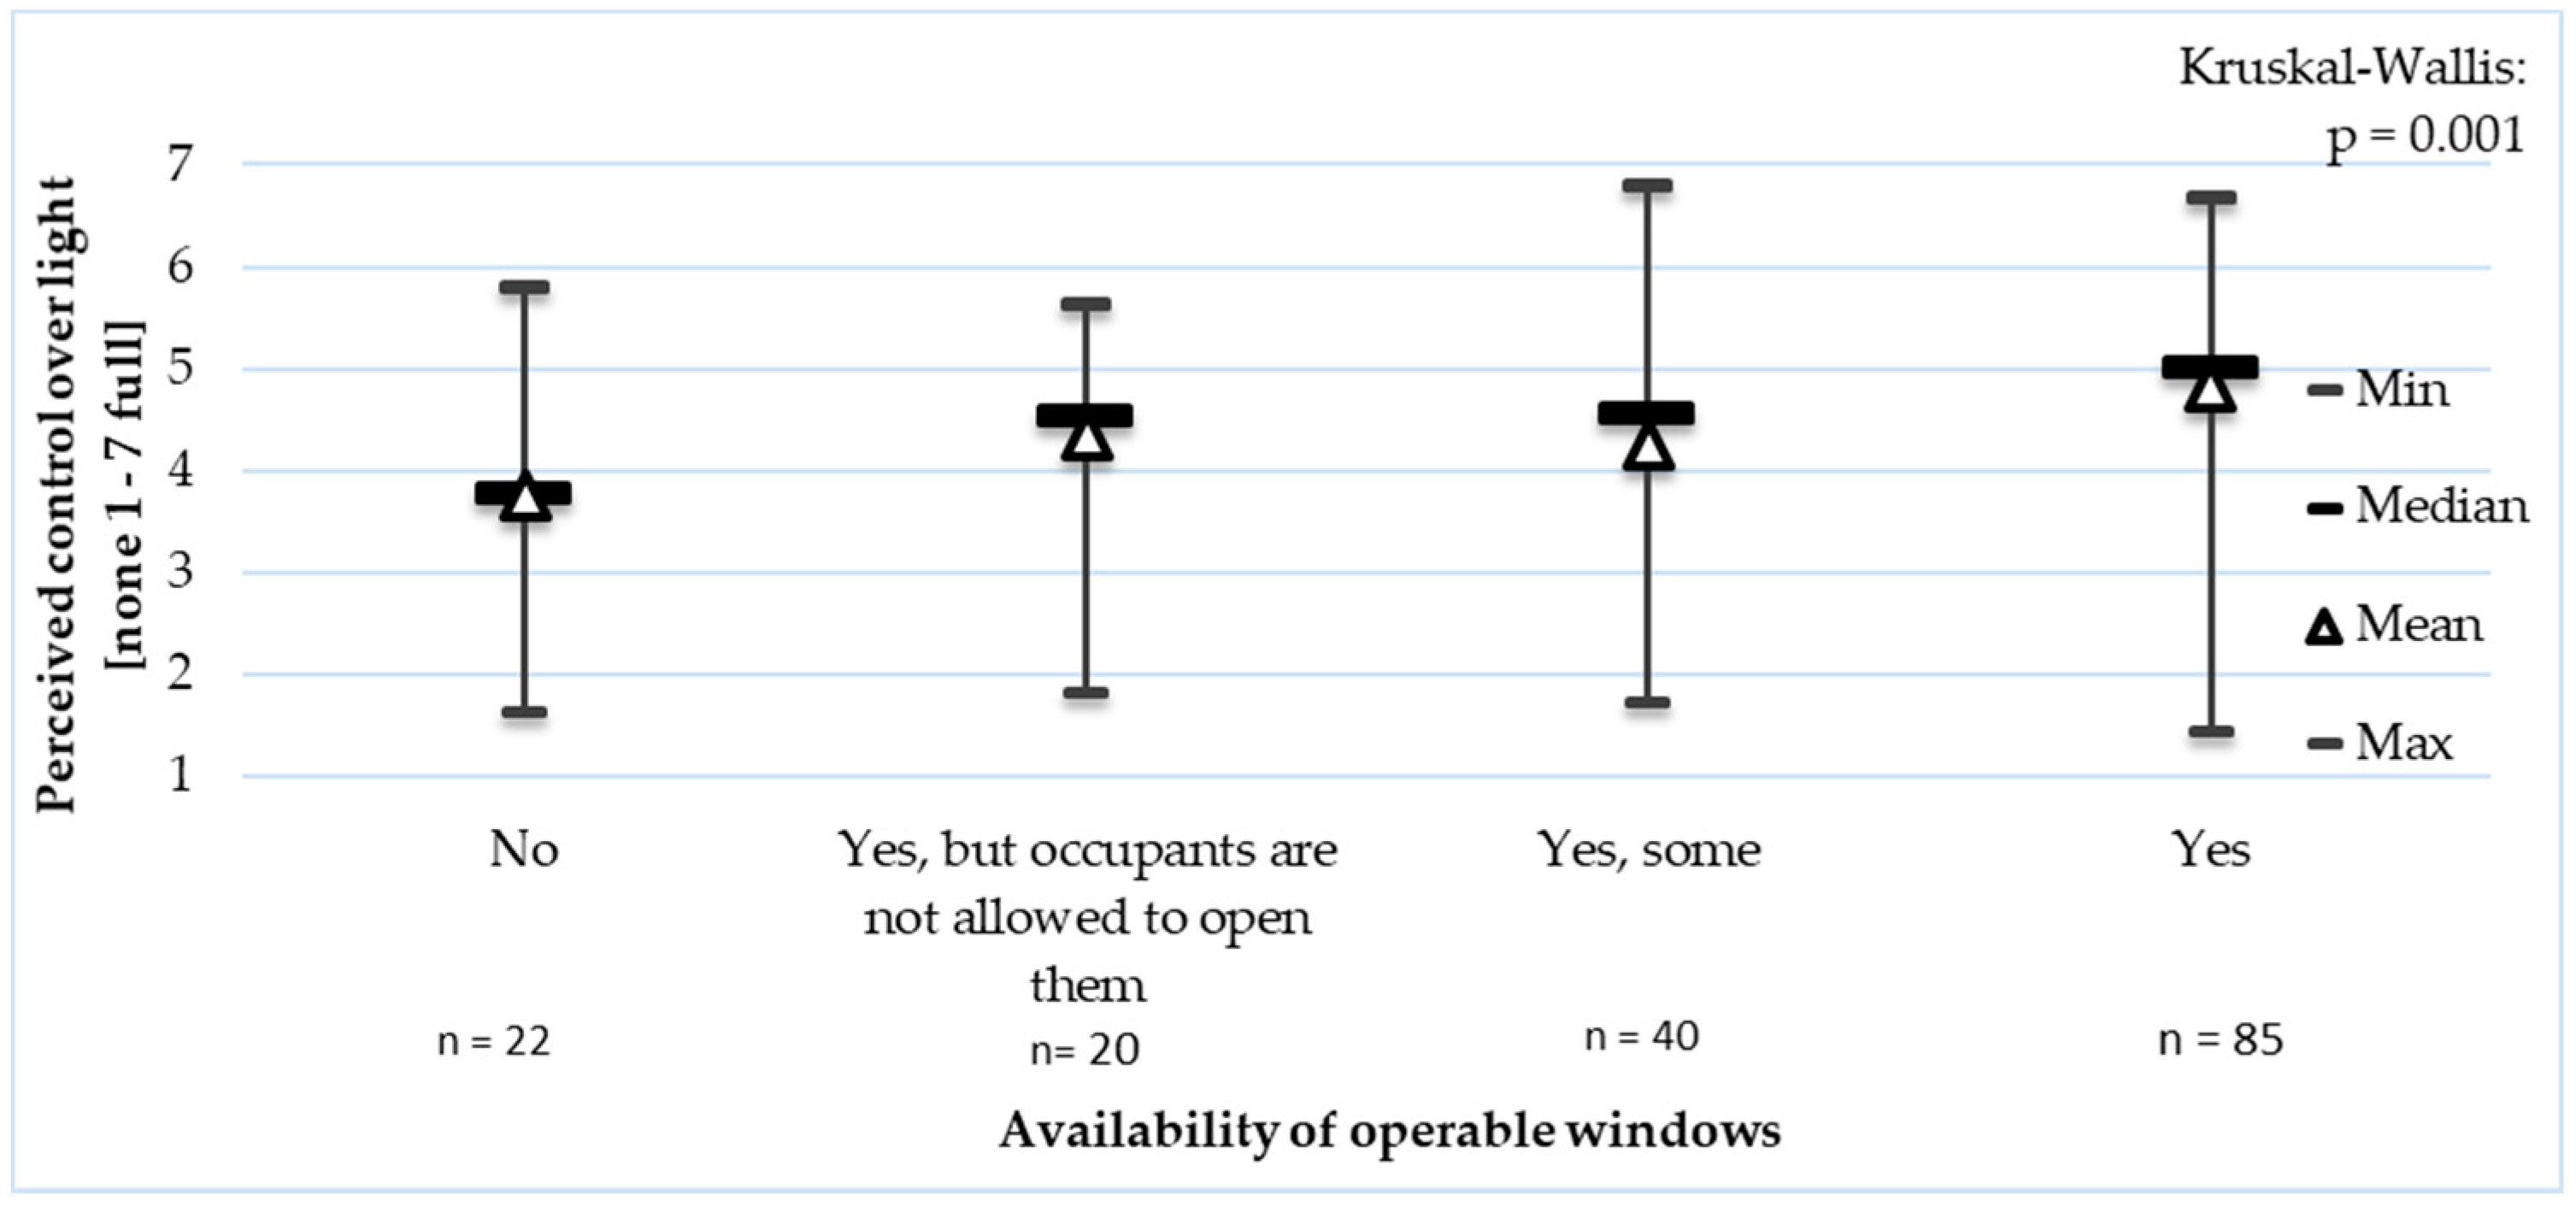
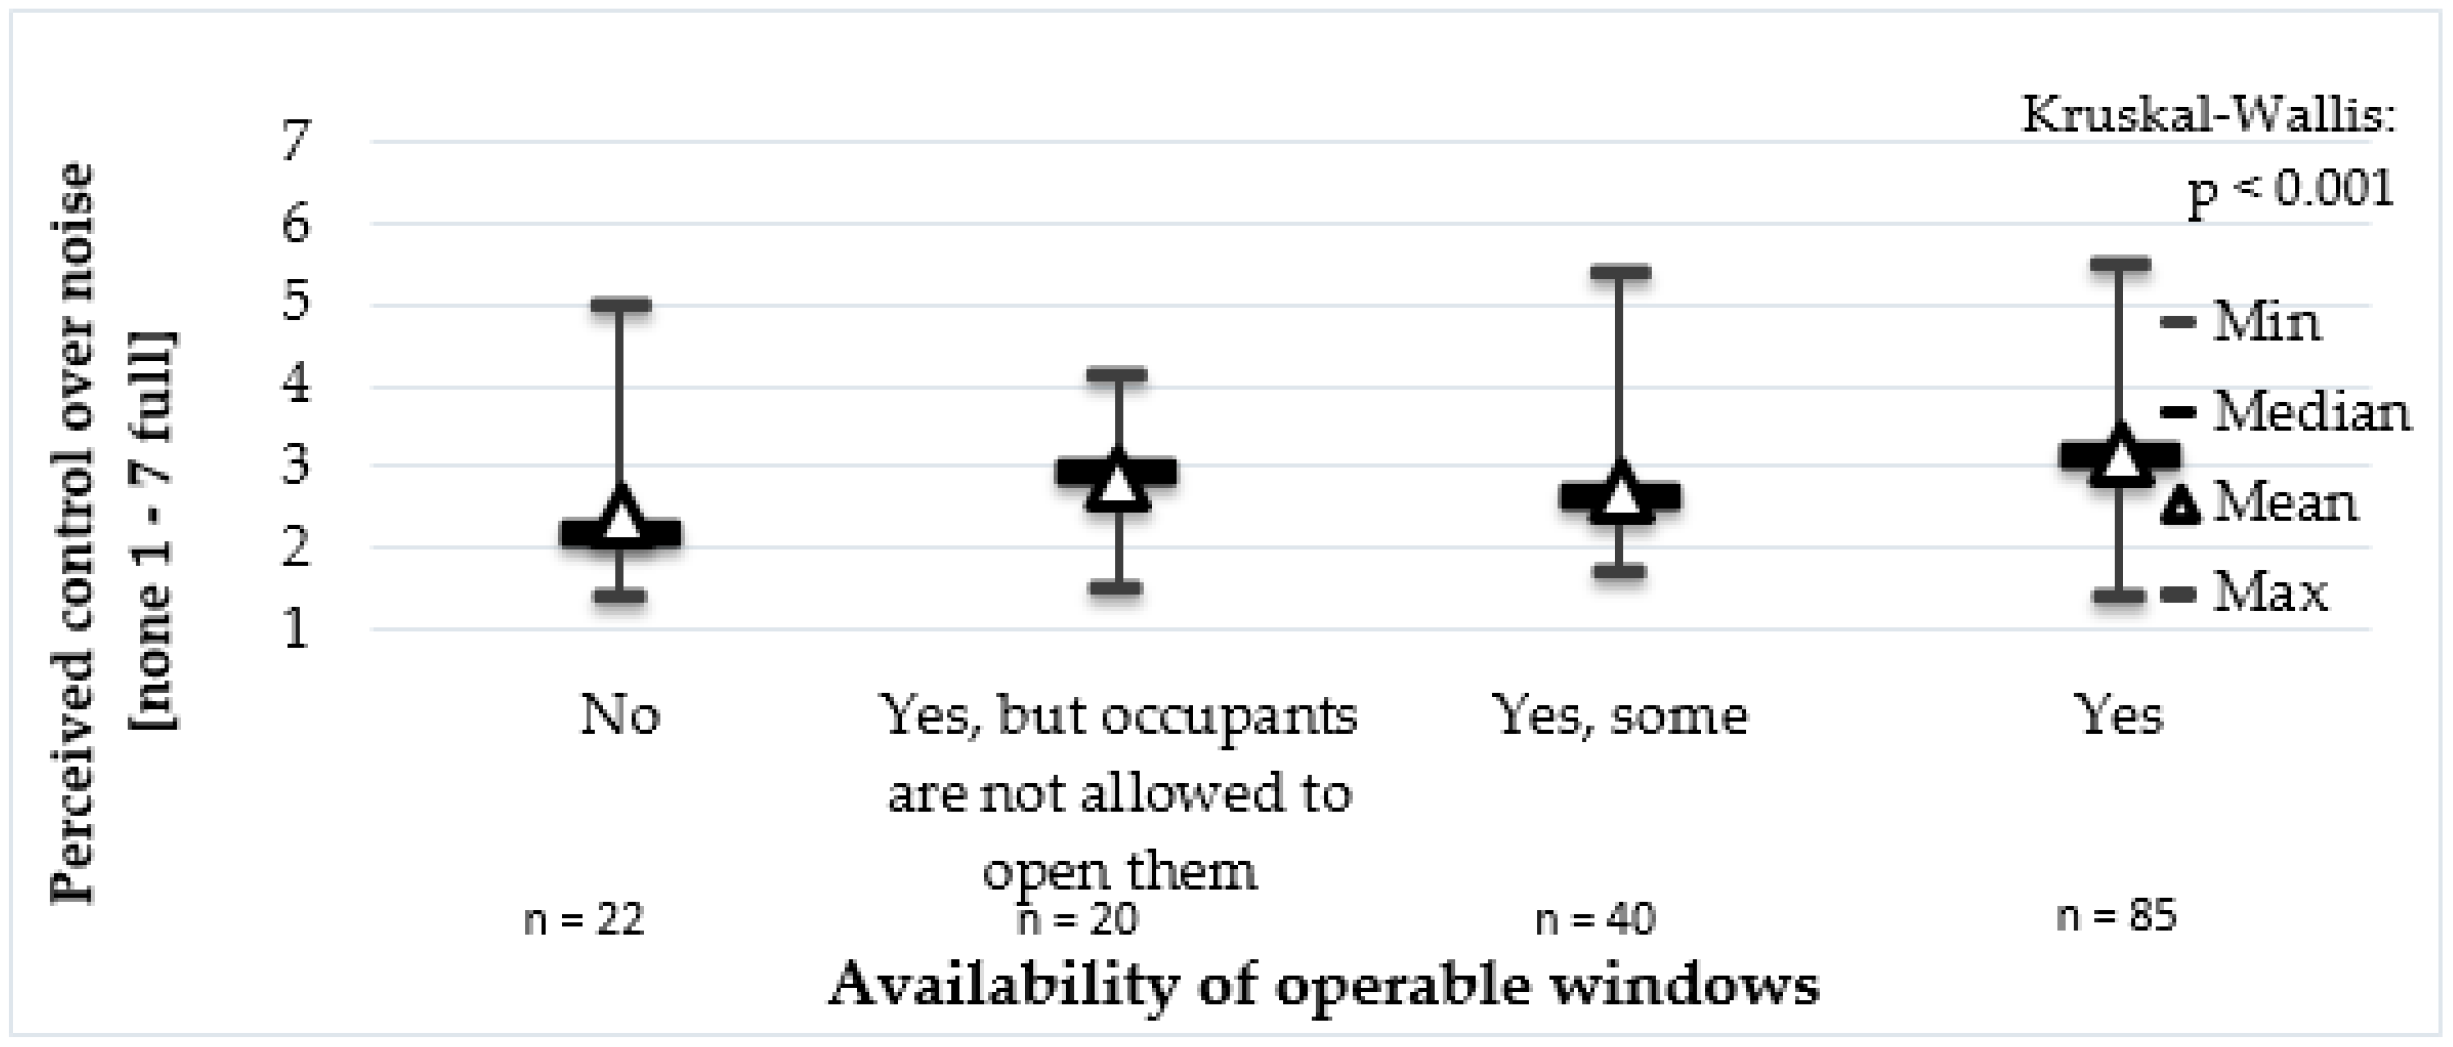
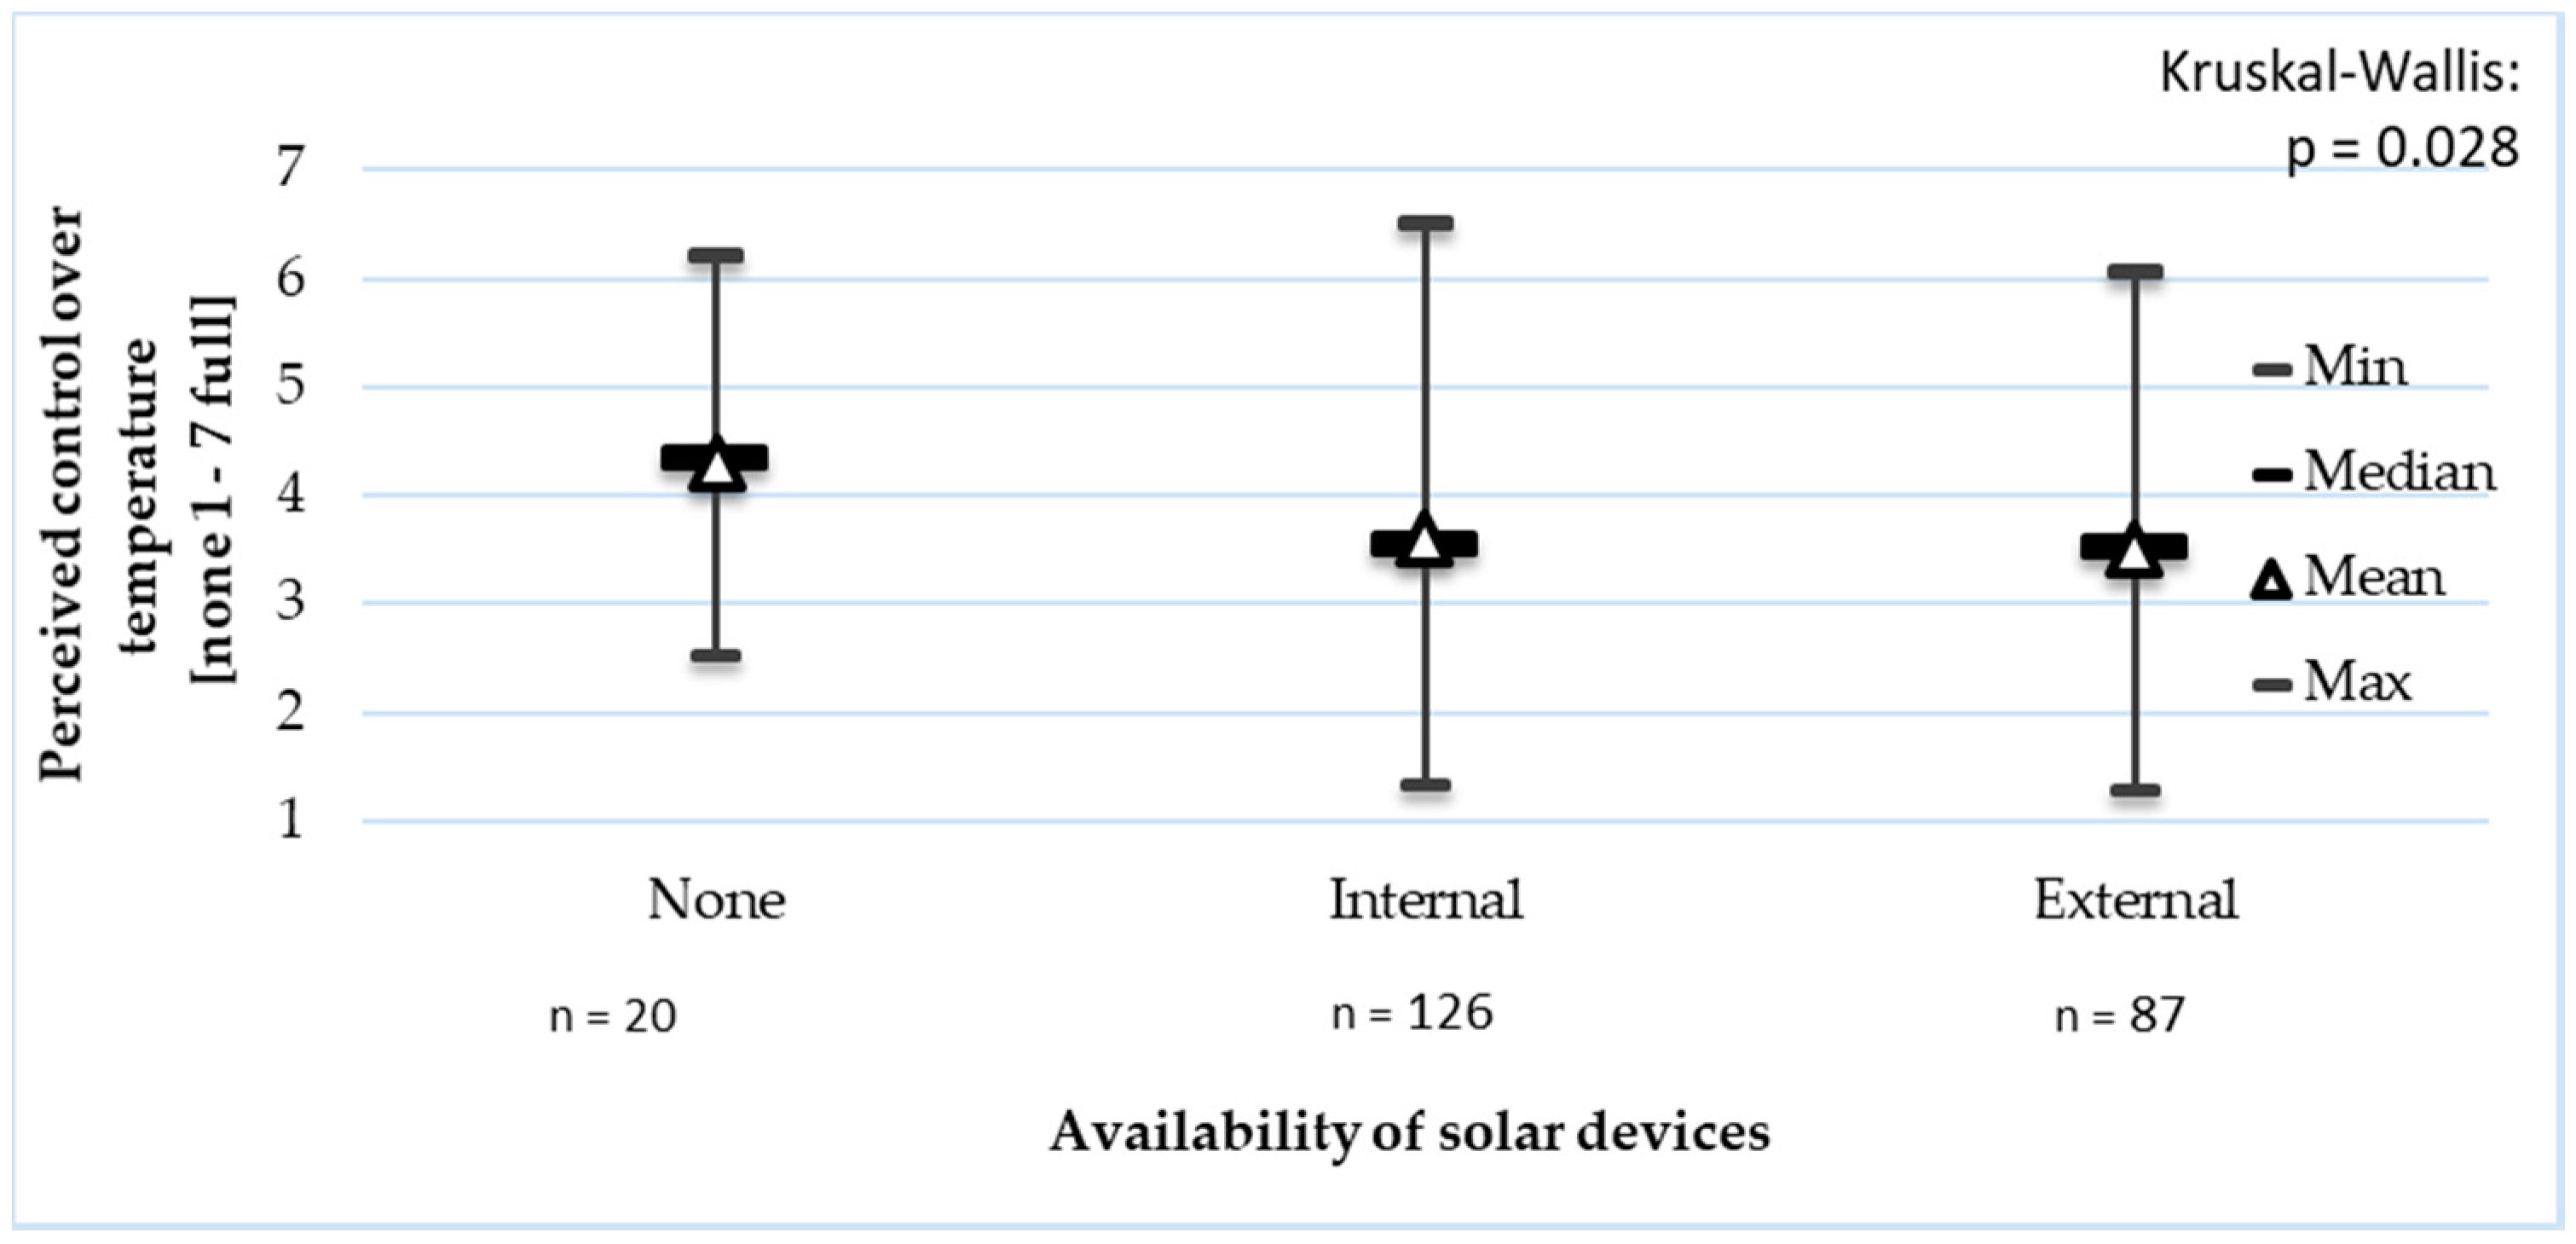
3.2. Relationship between Perceived Control and Available Control
3.3. Combined Perceived Control Versus Building Characteristics
3.4. Impact of Perceived Control on Perceived Comfort and Health
3.4.1. Combined Perceived Control vs. Perceived Comfort and Health—Bivariate Analysis
3.4.2. Perceived Control vs. Perceived Overall Comfort—Regression Analysis
4. Discussion
4.1. Occupants’ Personal Control
4.2. Strengths and Limitations
5. Conclusions
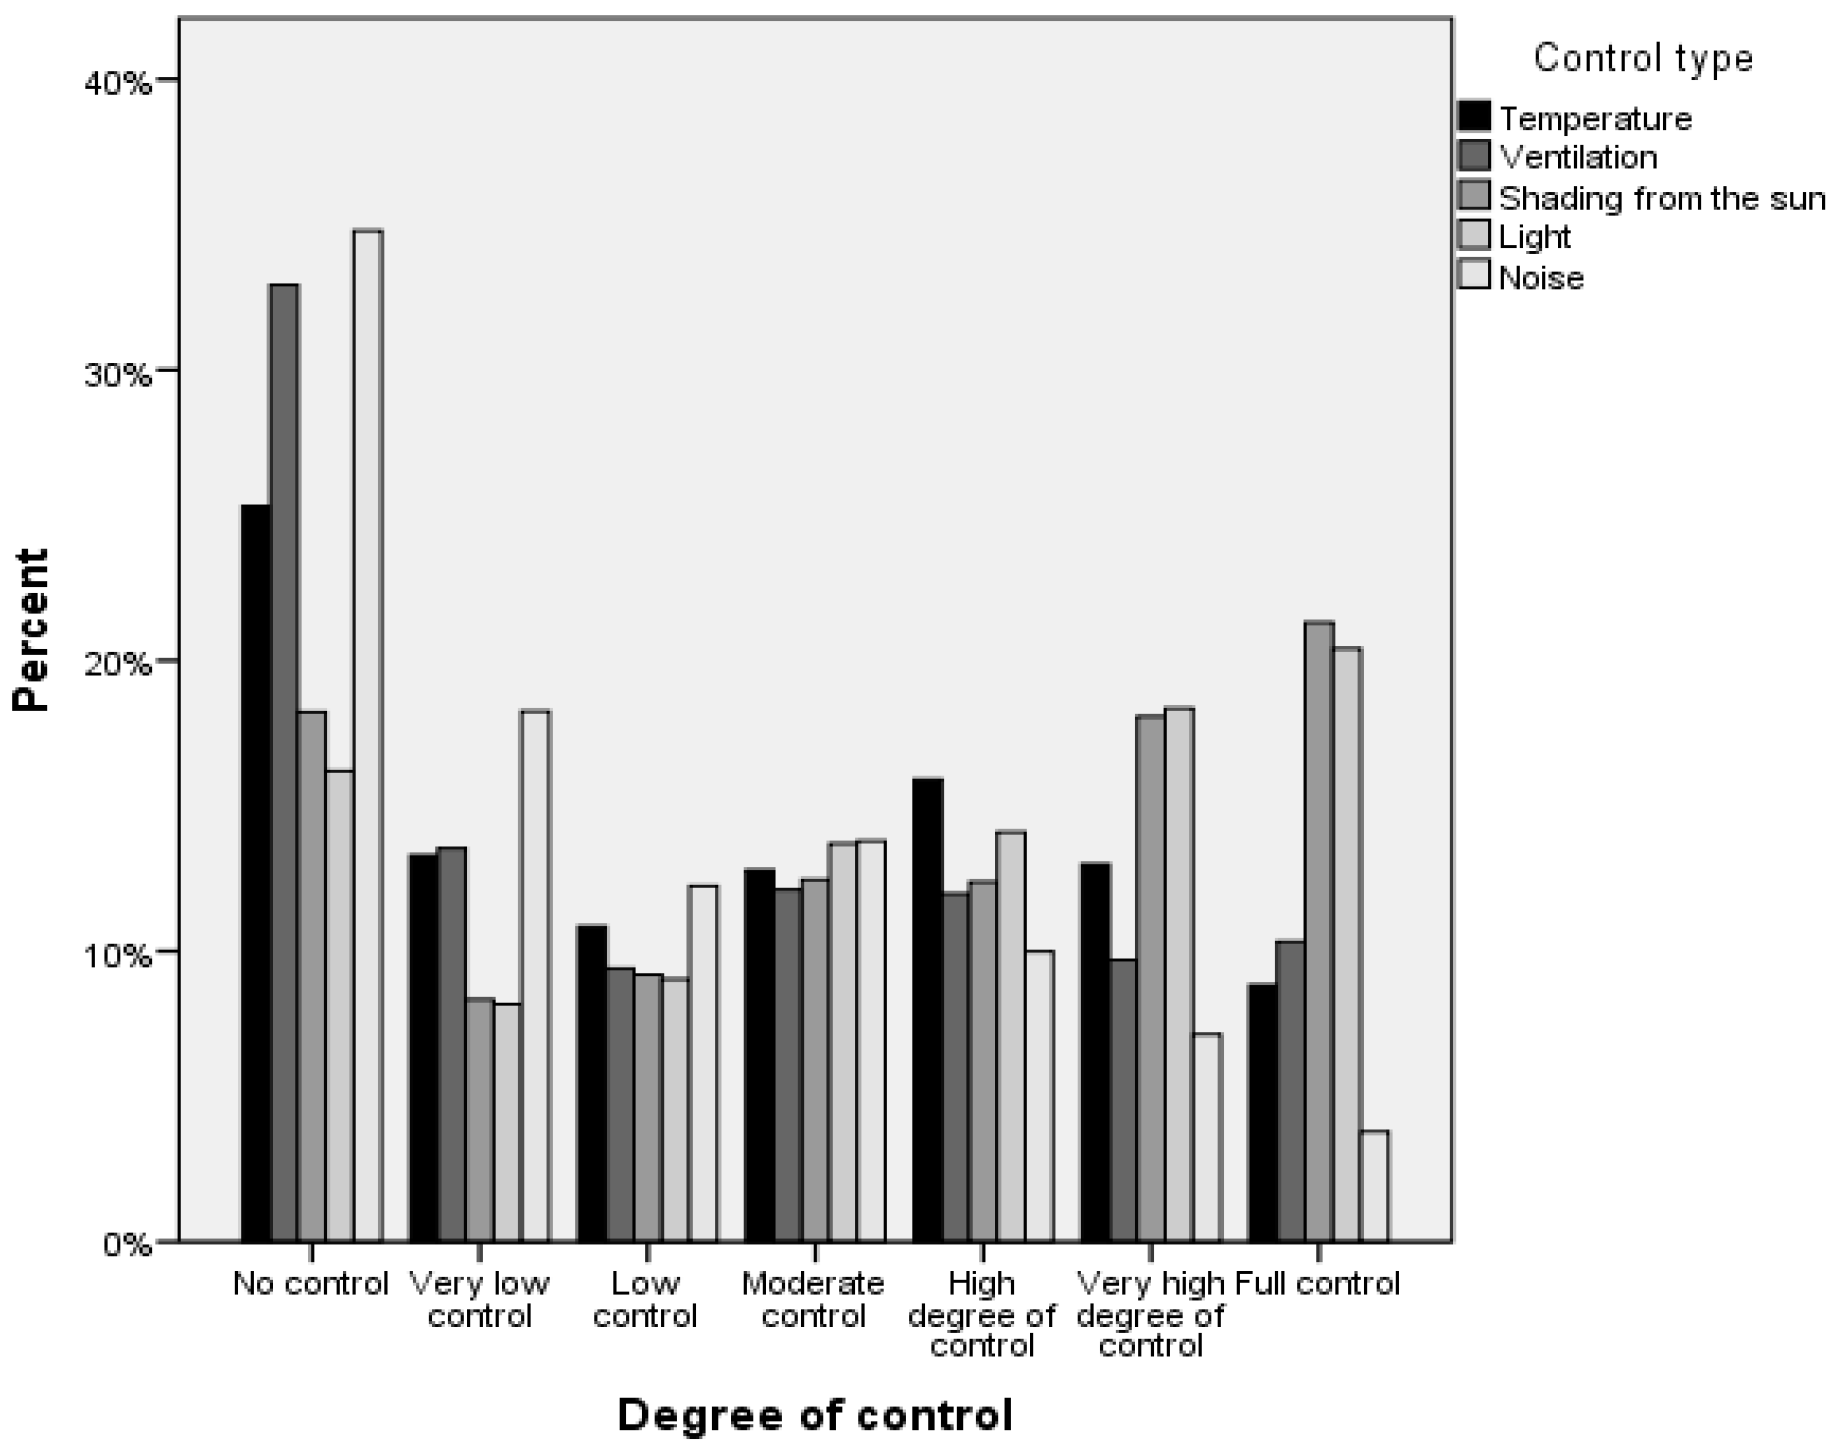
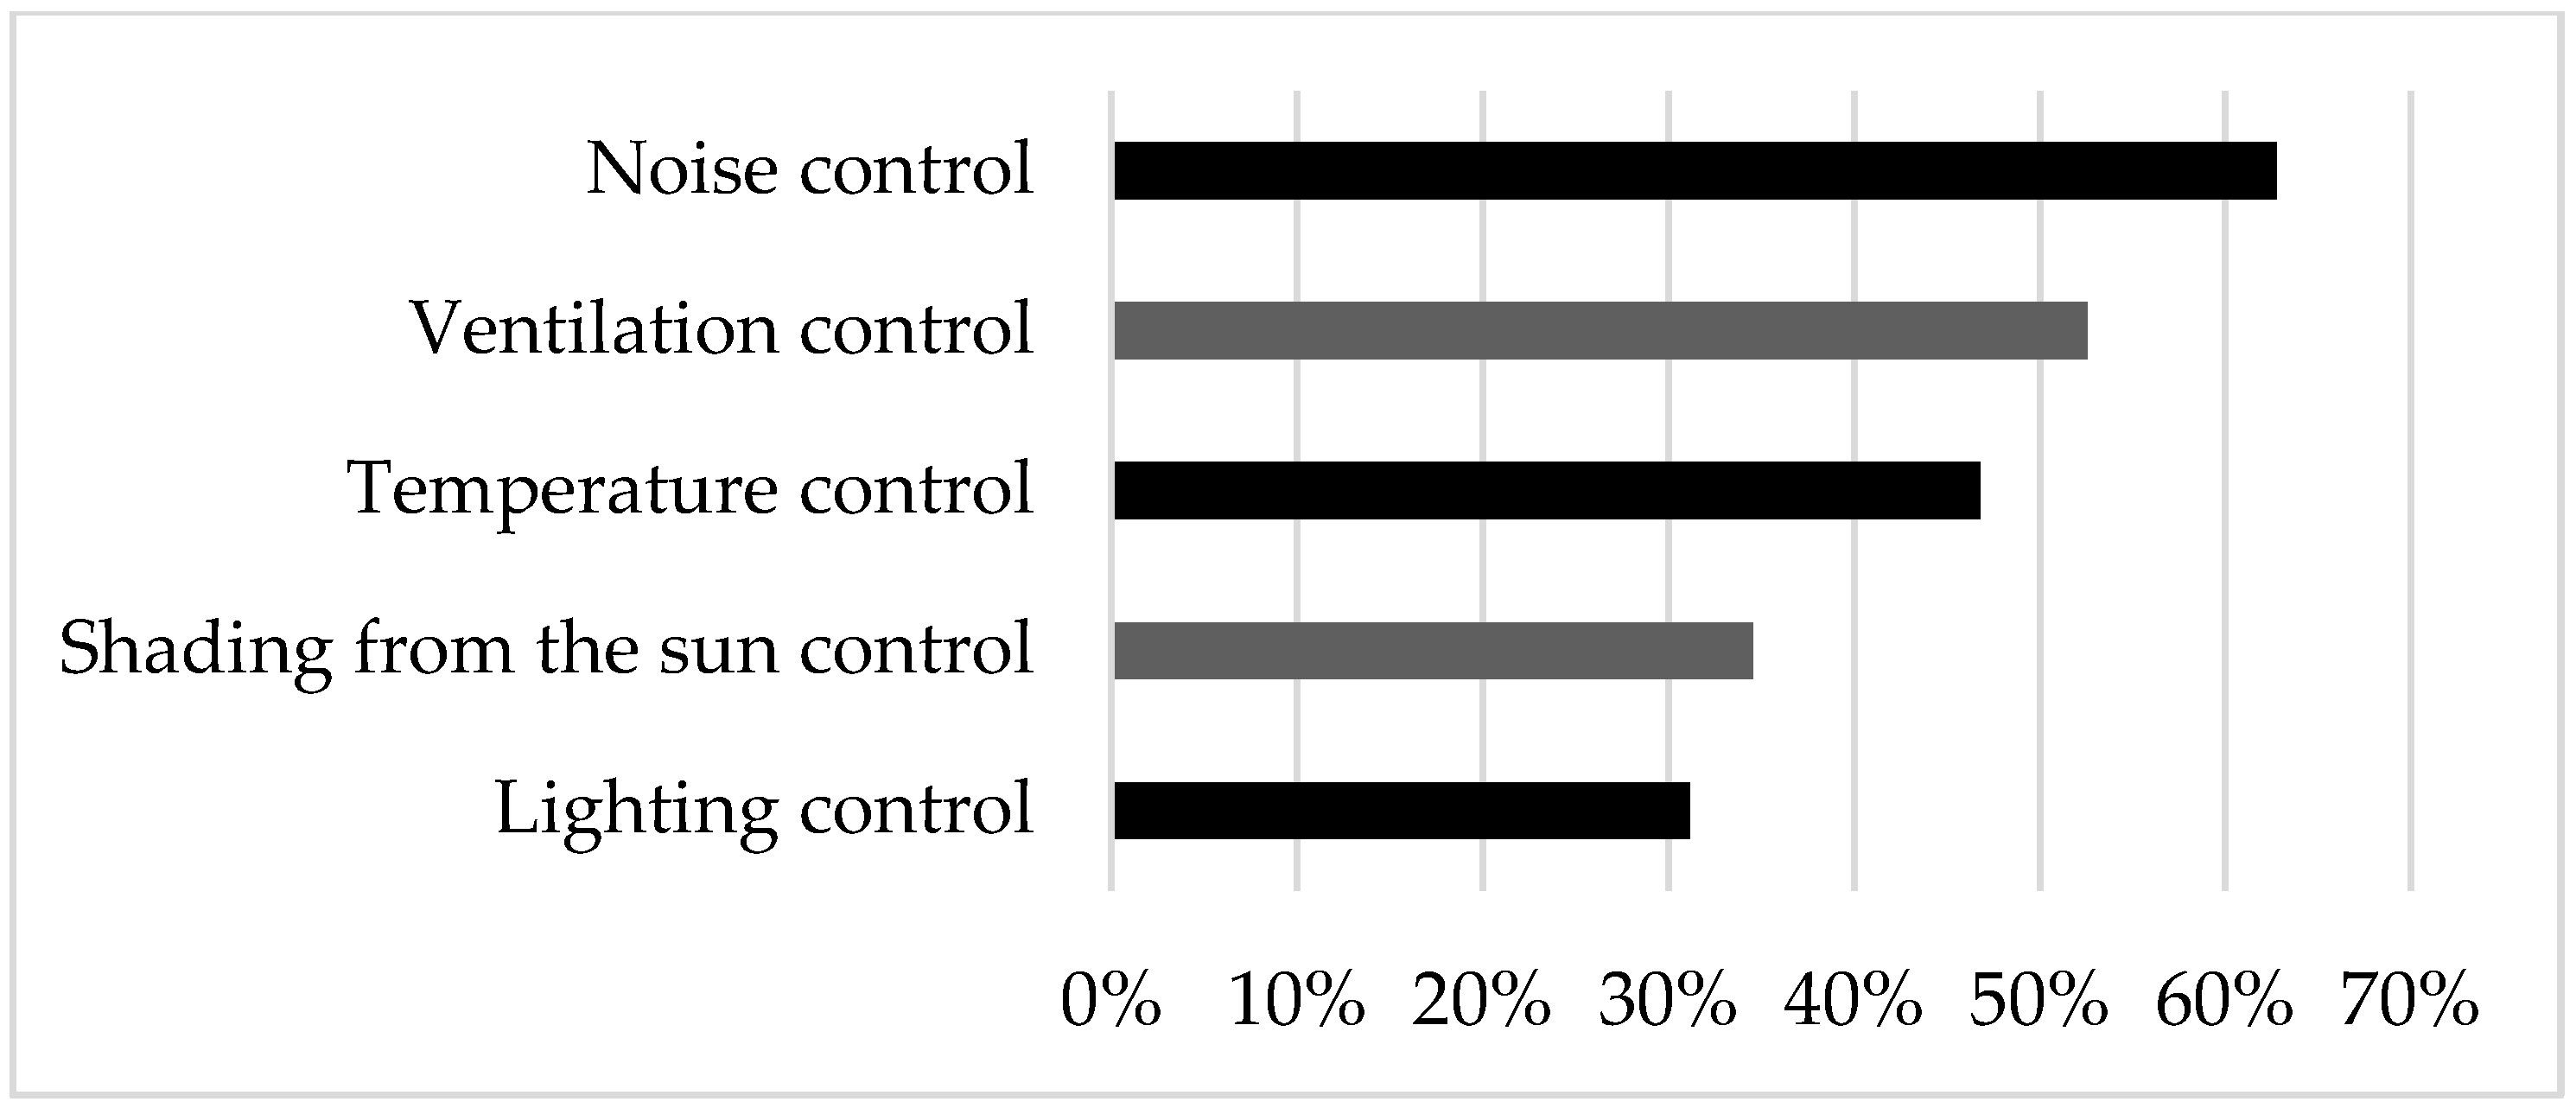
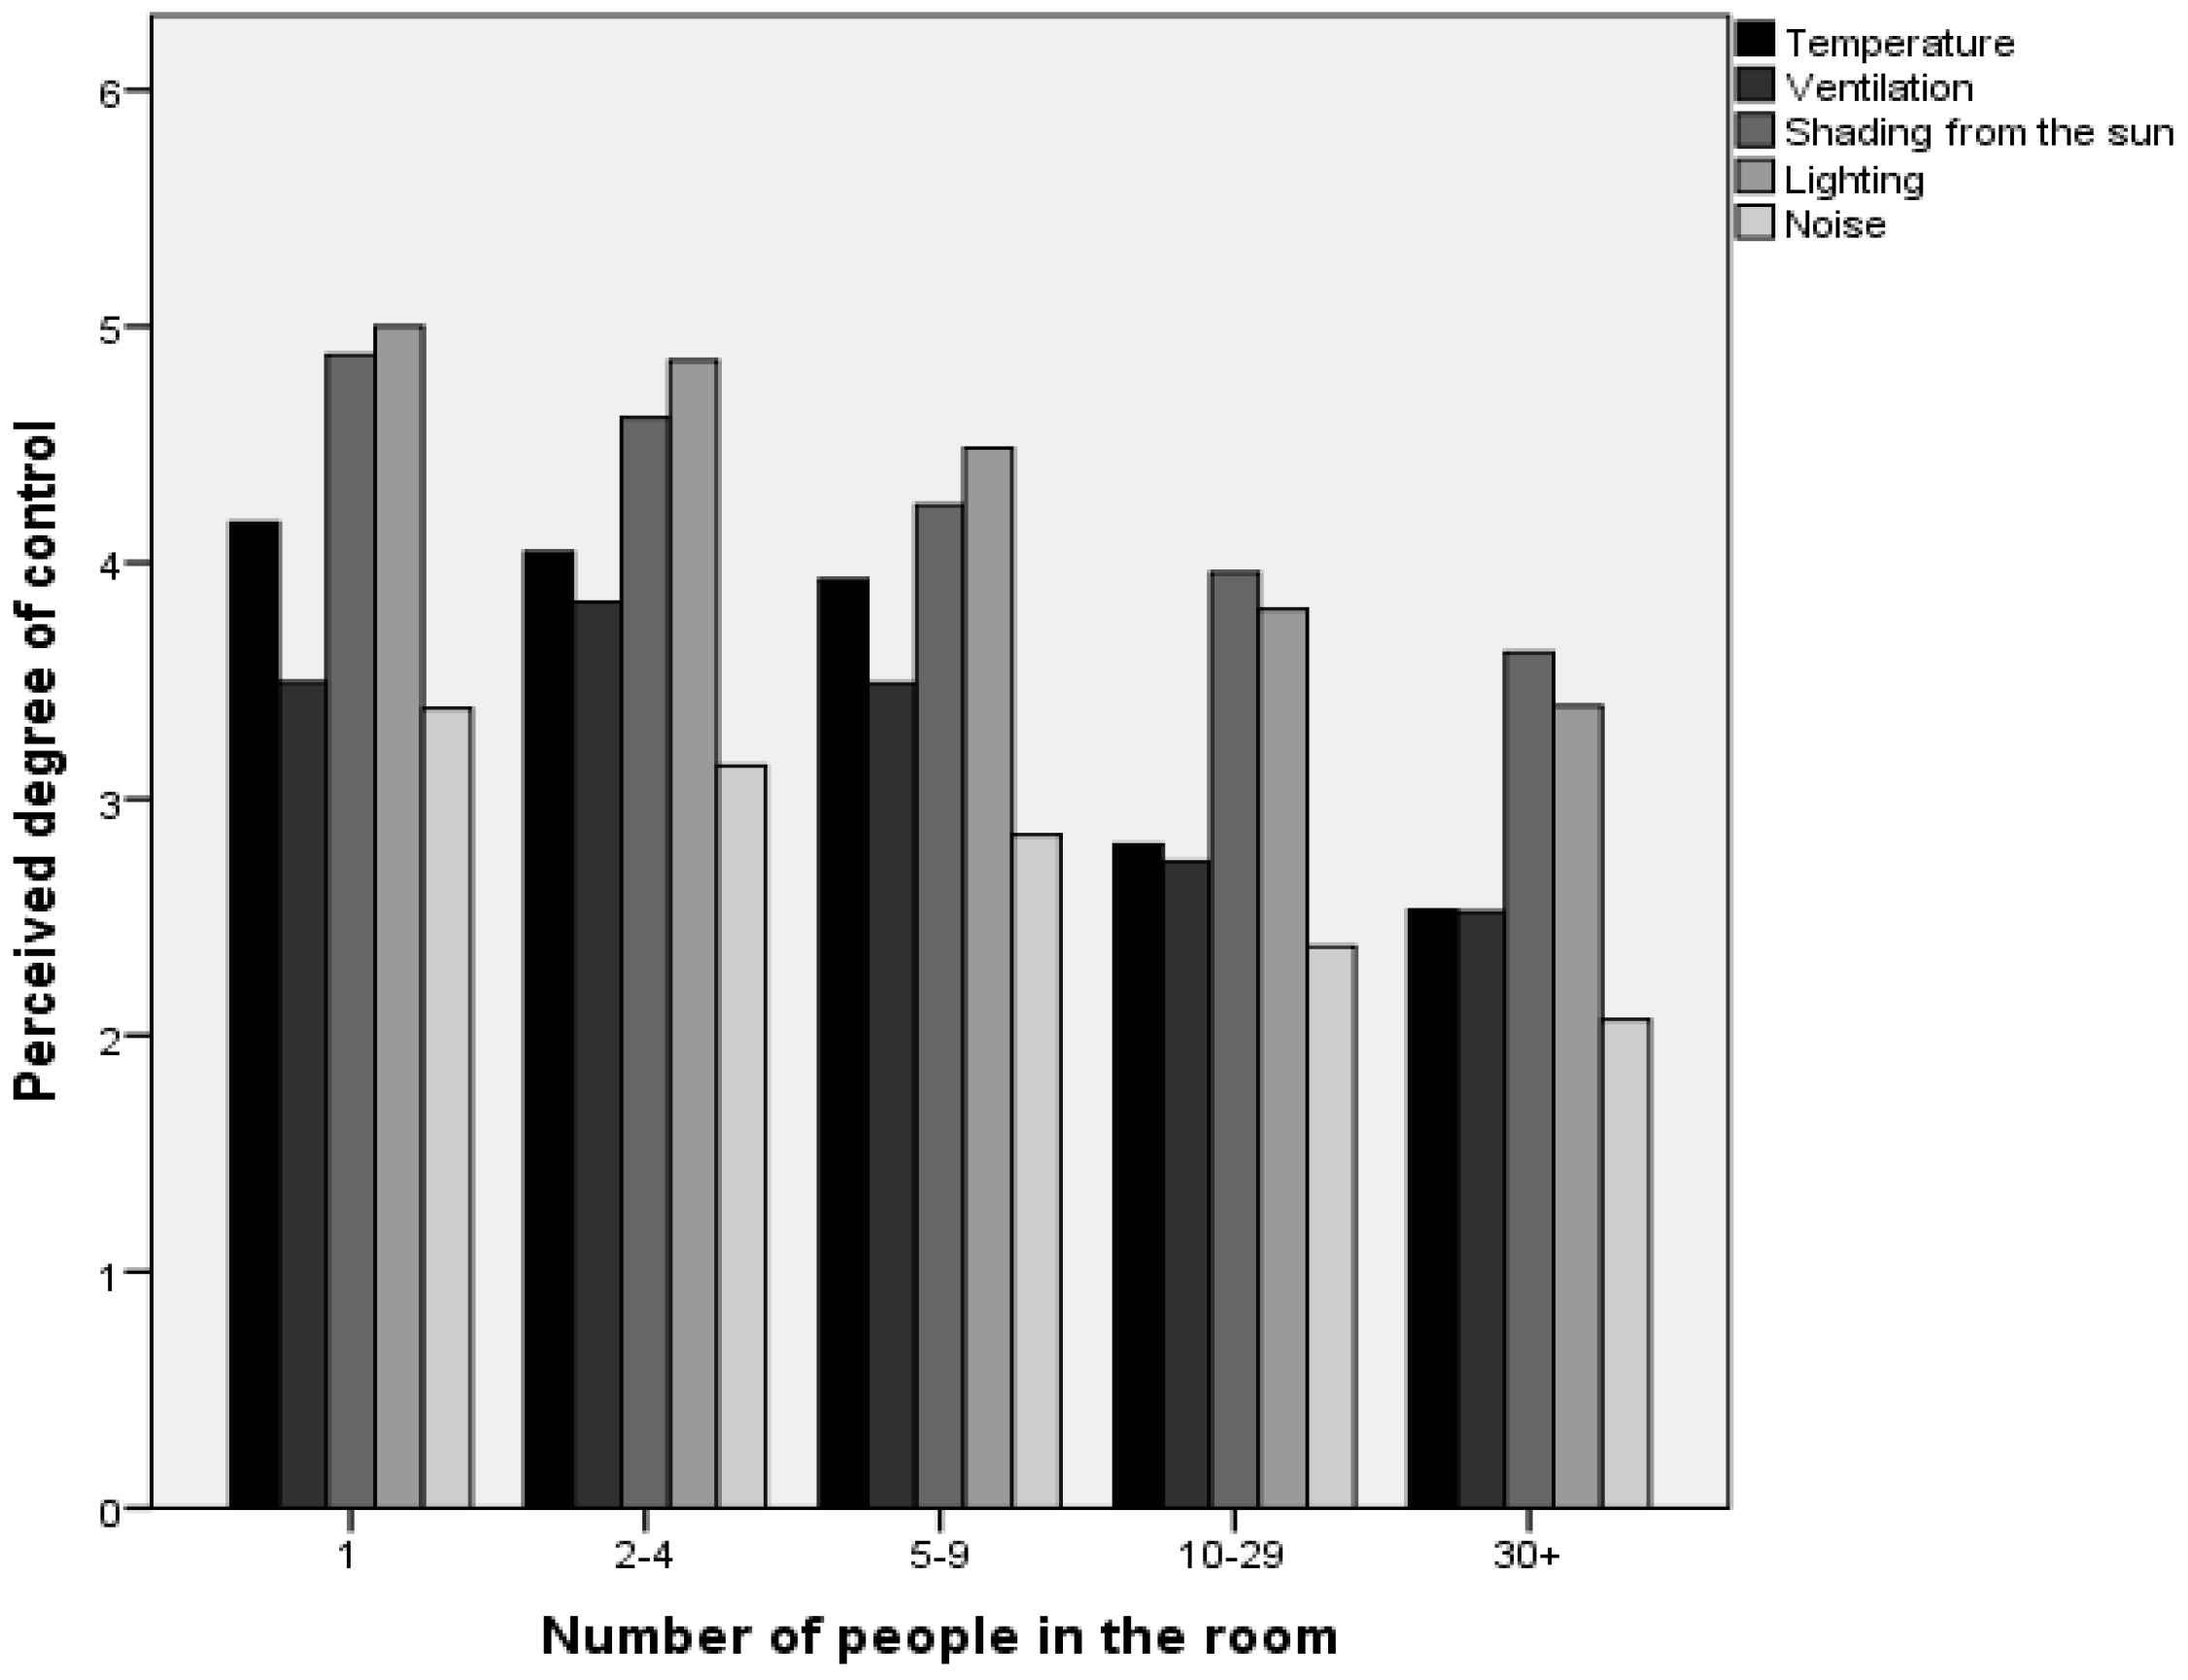
- In general, occupants have a moderate or low access in the control of their indoor working environment. They have rated with a moderate control perception the lighting and shading from the sun parameters. Noise was the worst control parameter, while temperature and ventilation control were rated in the low control scale. Among the five control parameters, there was a significant group of occupants who were not able to control their environment at all. Nearly all occupants have no or low control on noise. Half of the occupants declared no or low control on ventilation and temperature conditions. Almost one-third of them remarked that they do not have satisfactory levels of control for lighting and shading from sun conditions. It is noteworthy that as the occupancy within the offices increases, the degree of personal control becomes lower.
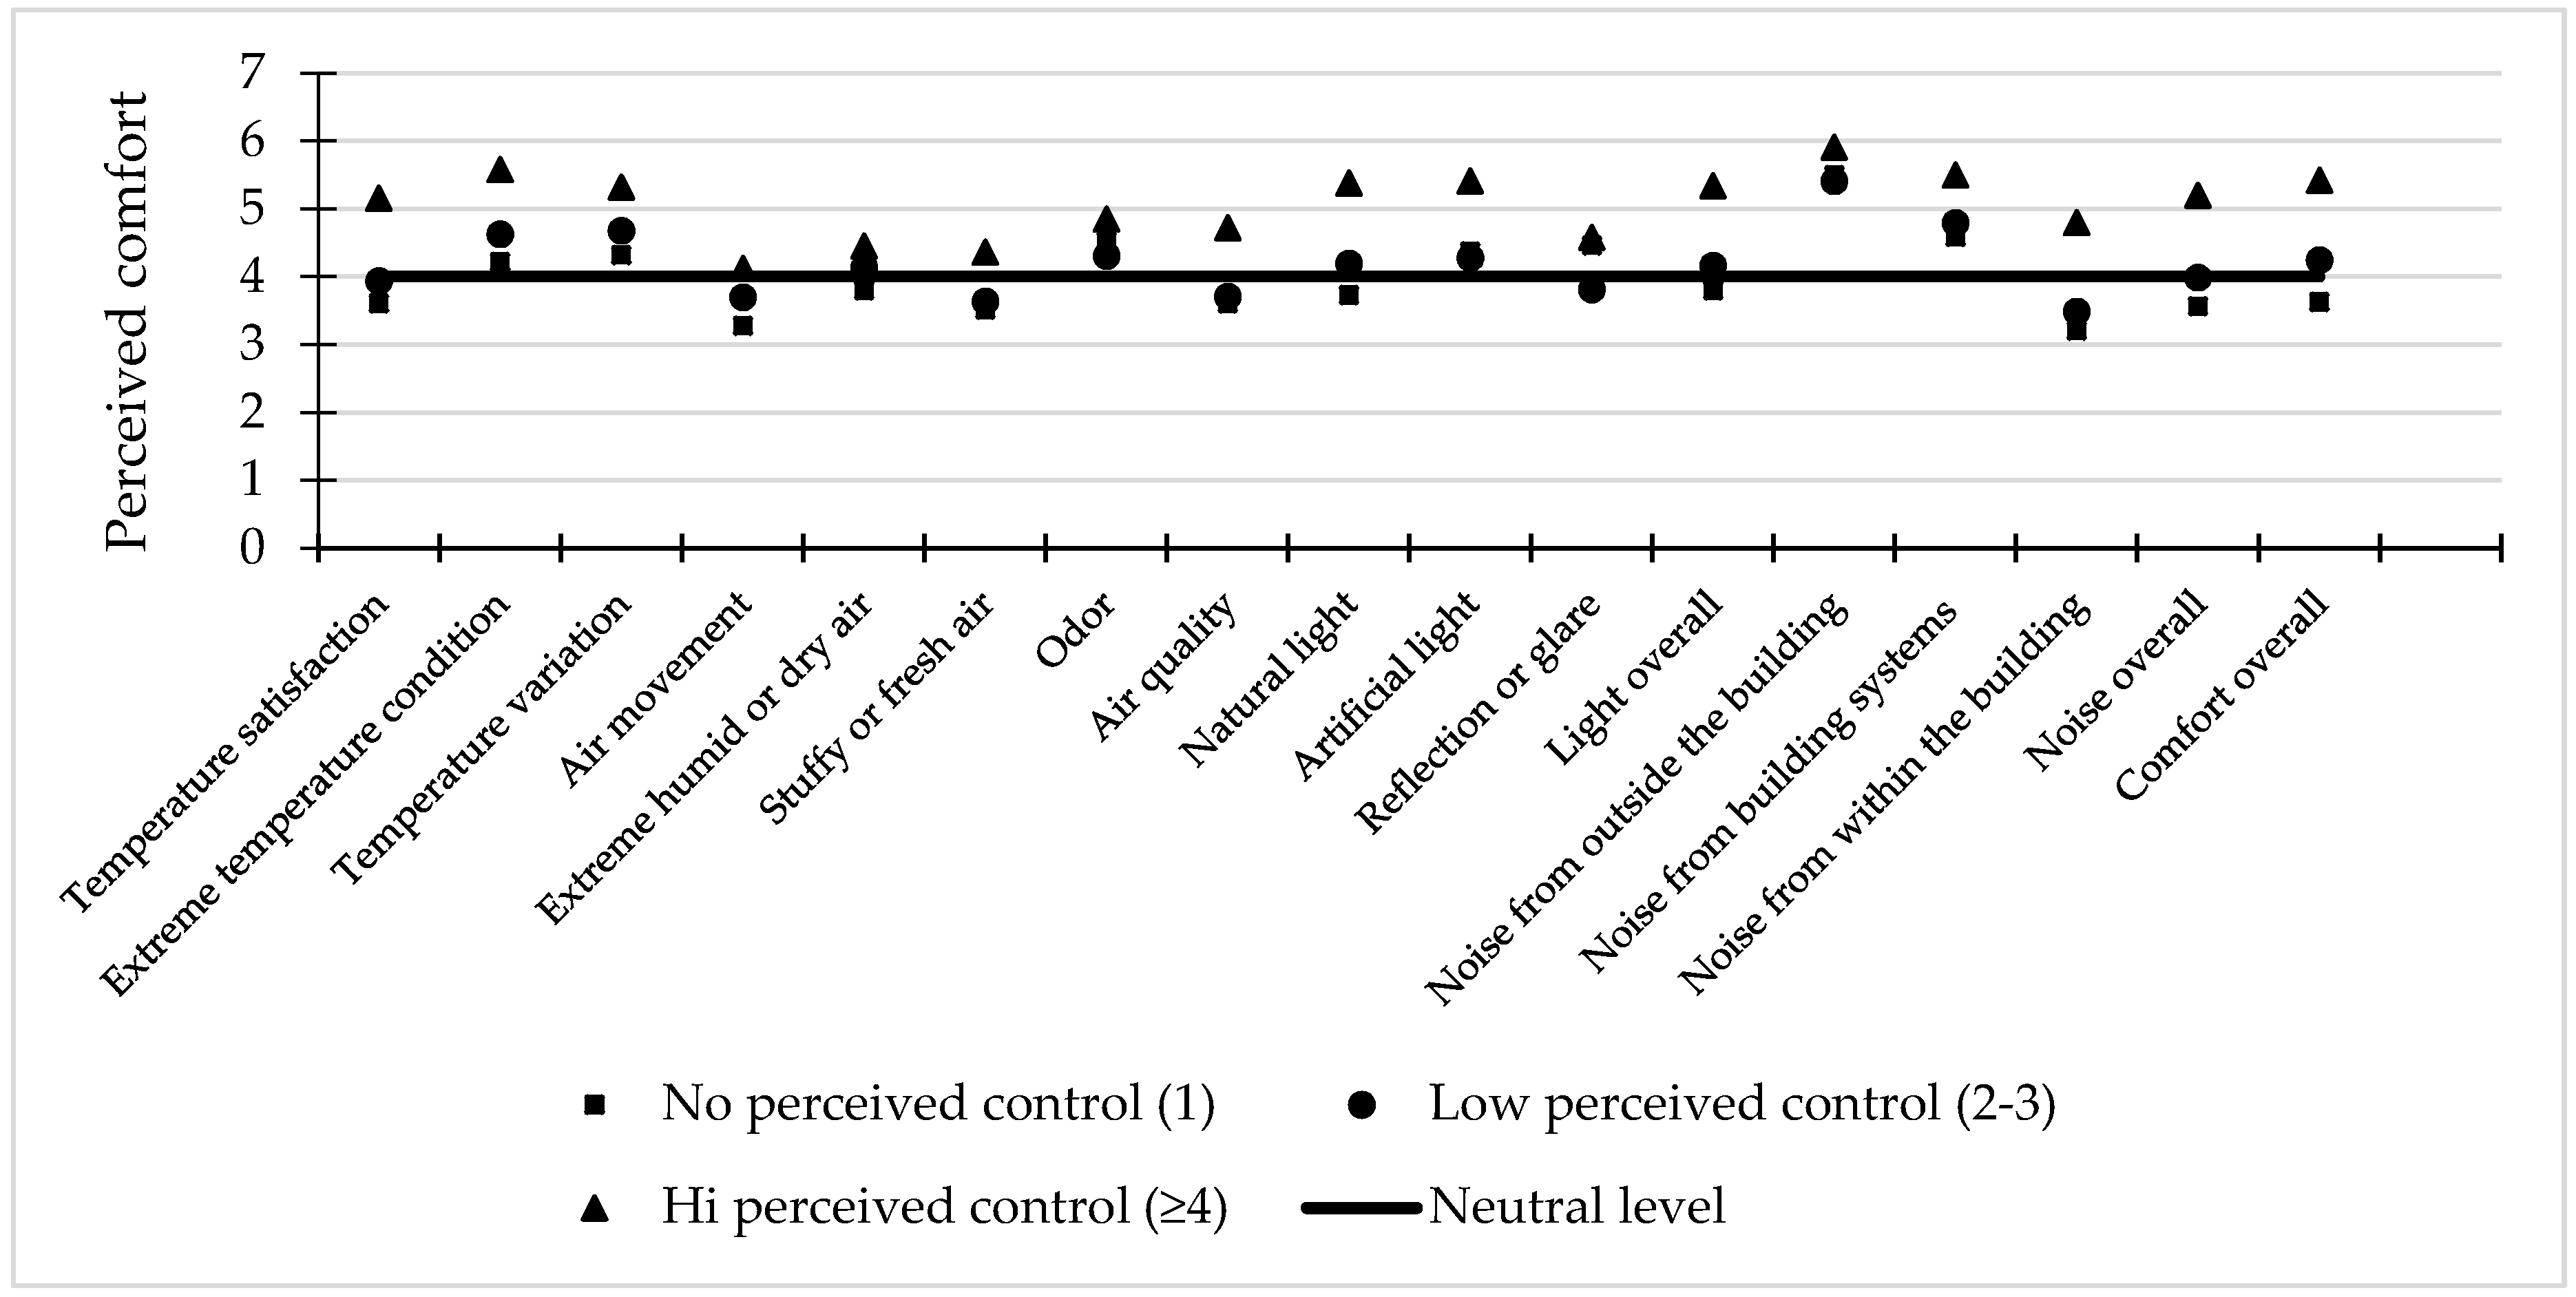
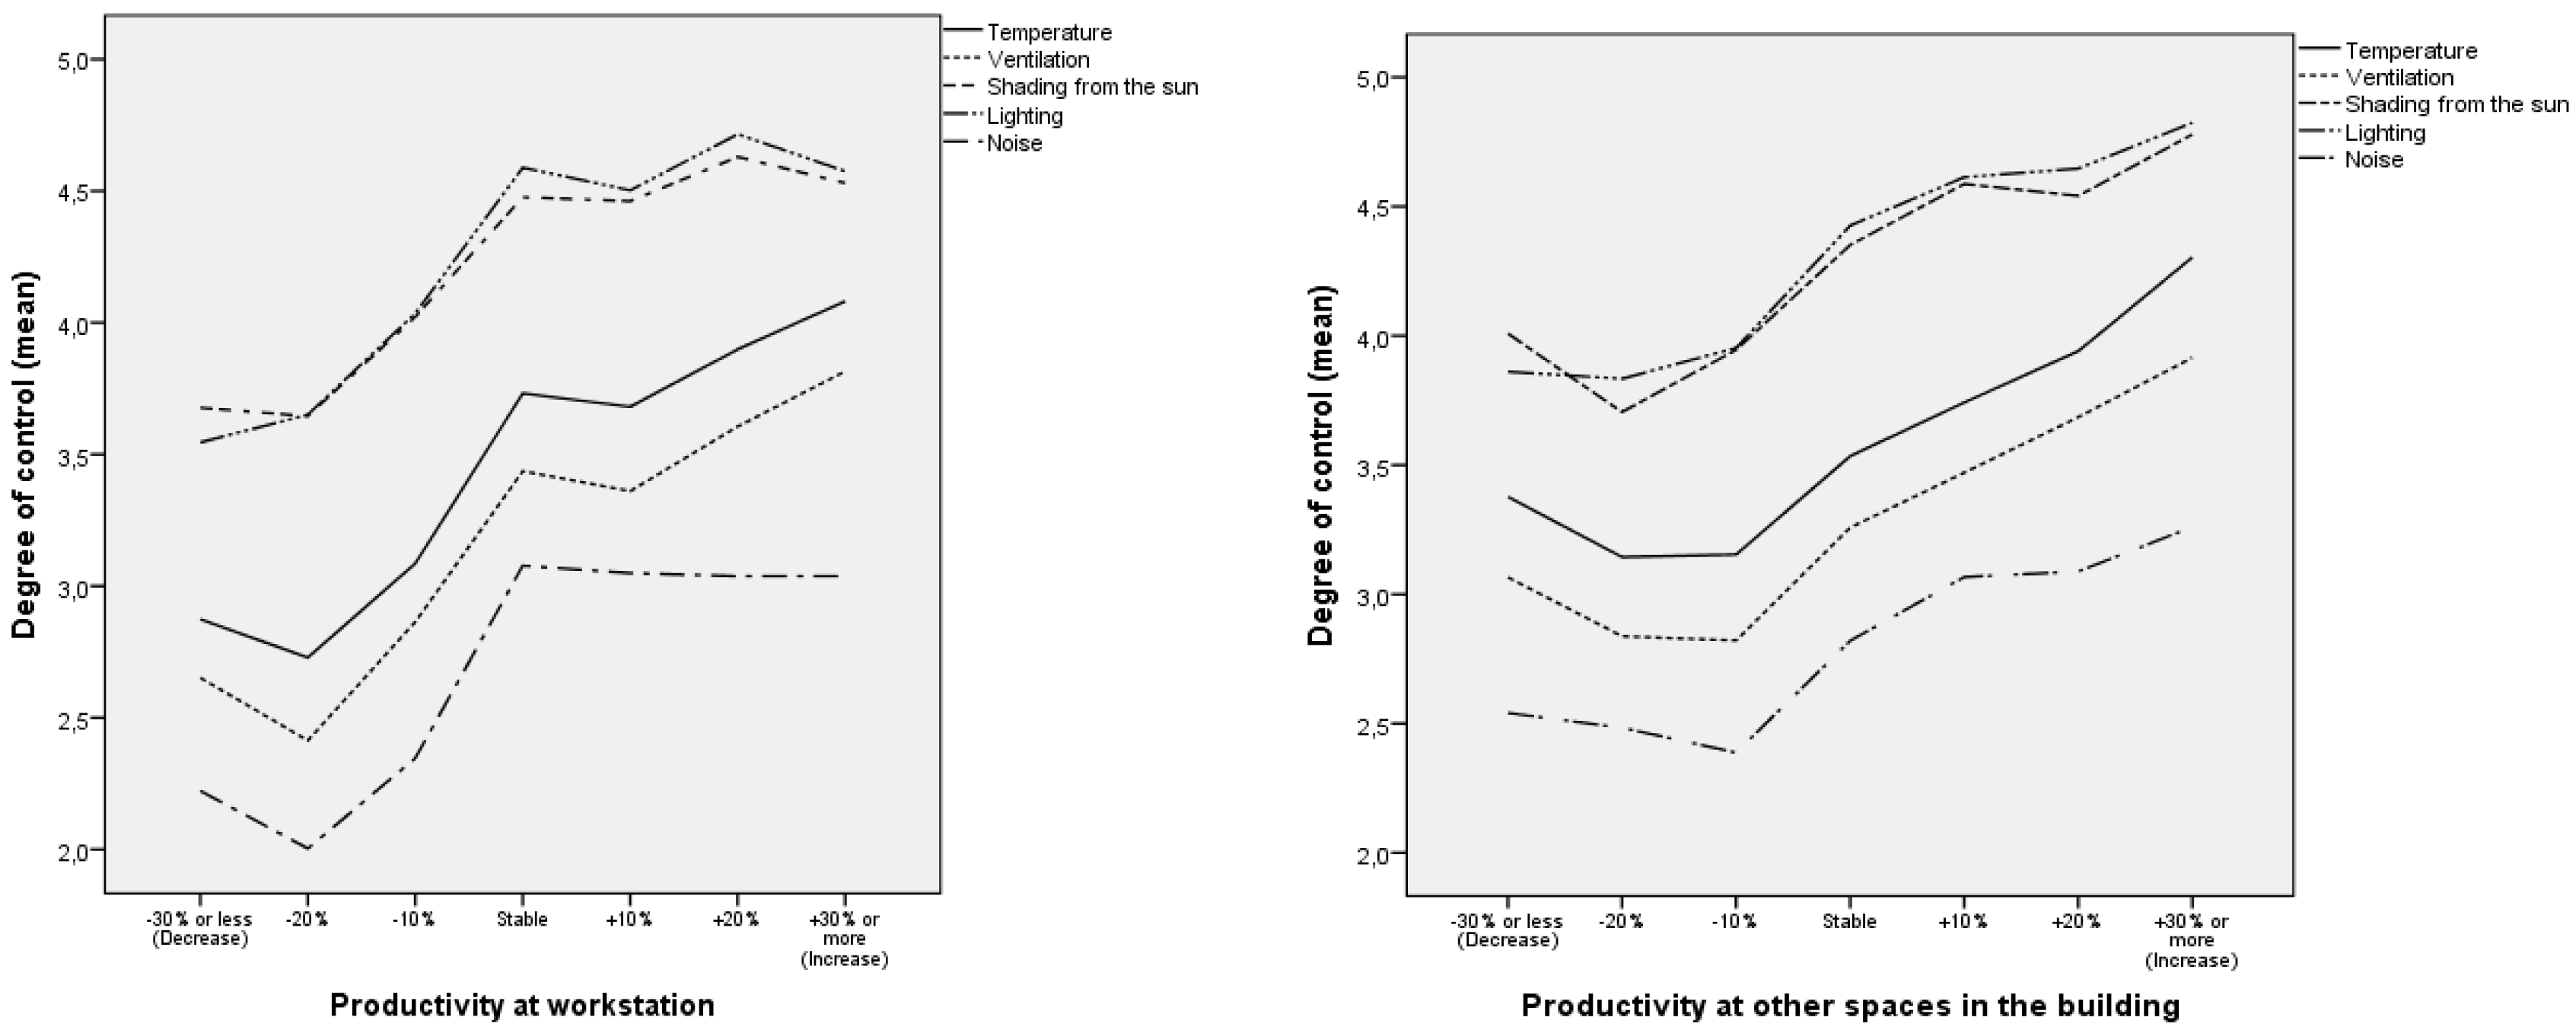
- Occupants with a higher level of personal control were reported to be more productive within their working environment. Moreover, occupants who declared high degrees of personal control reported higher levels of IEQ satisfaction.
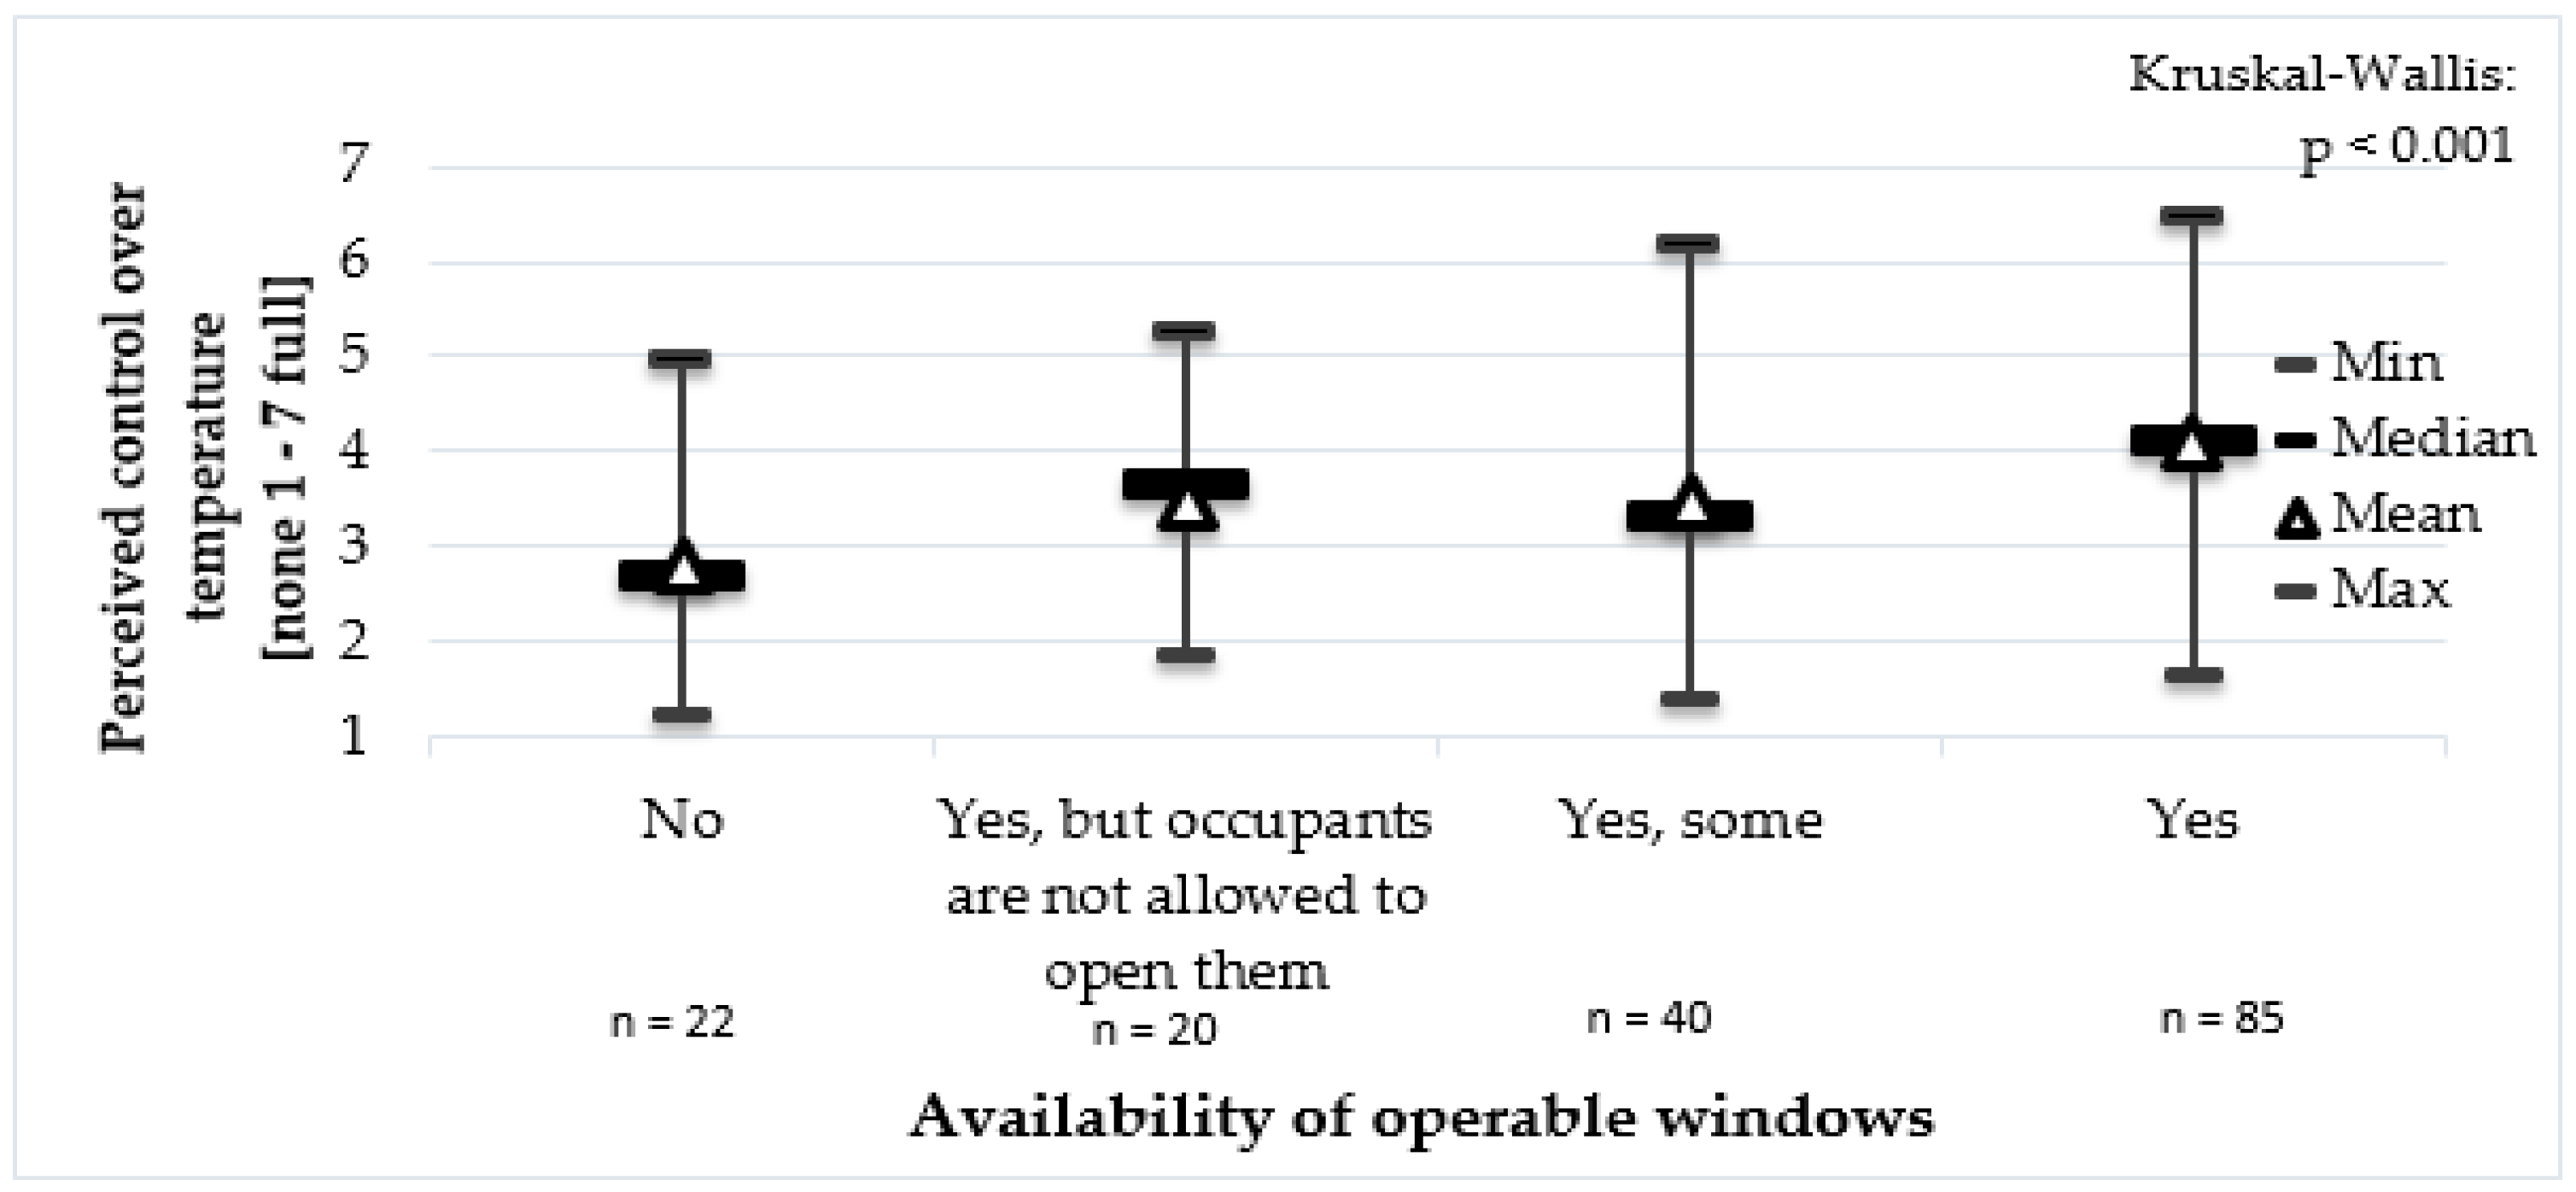
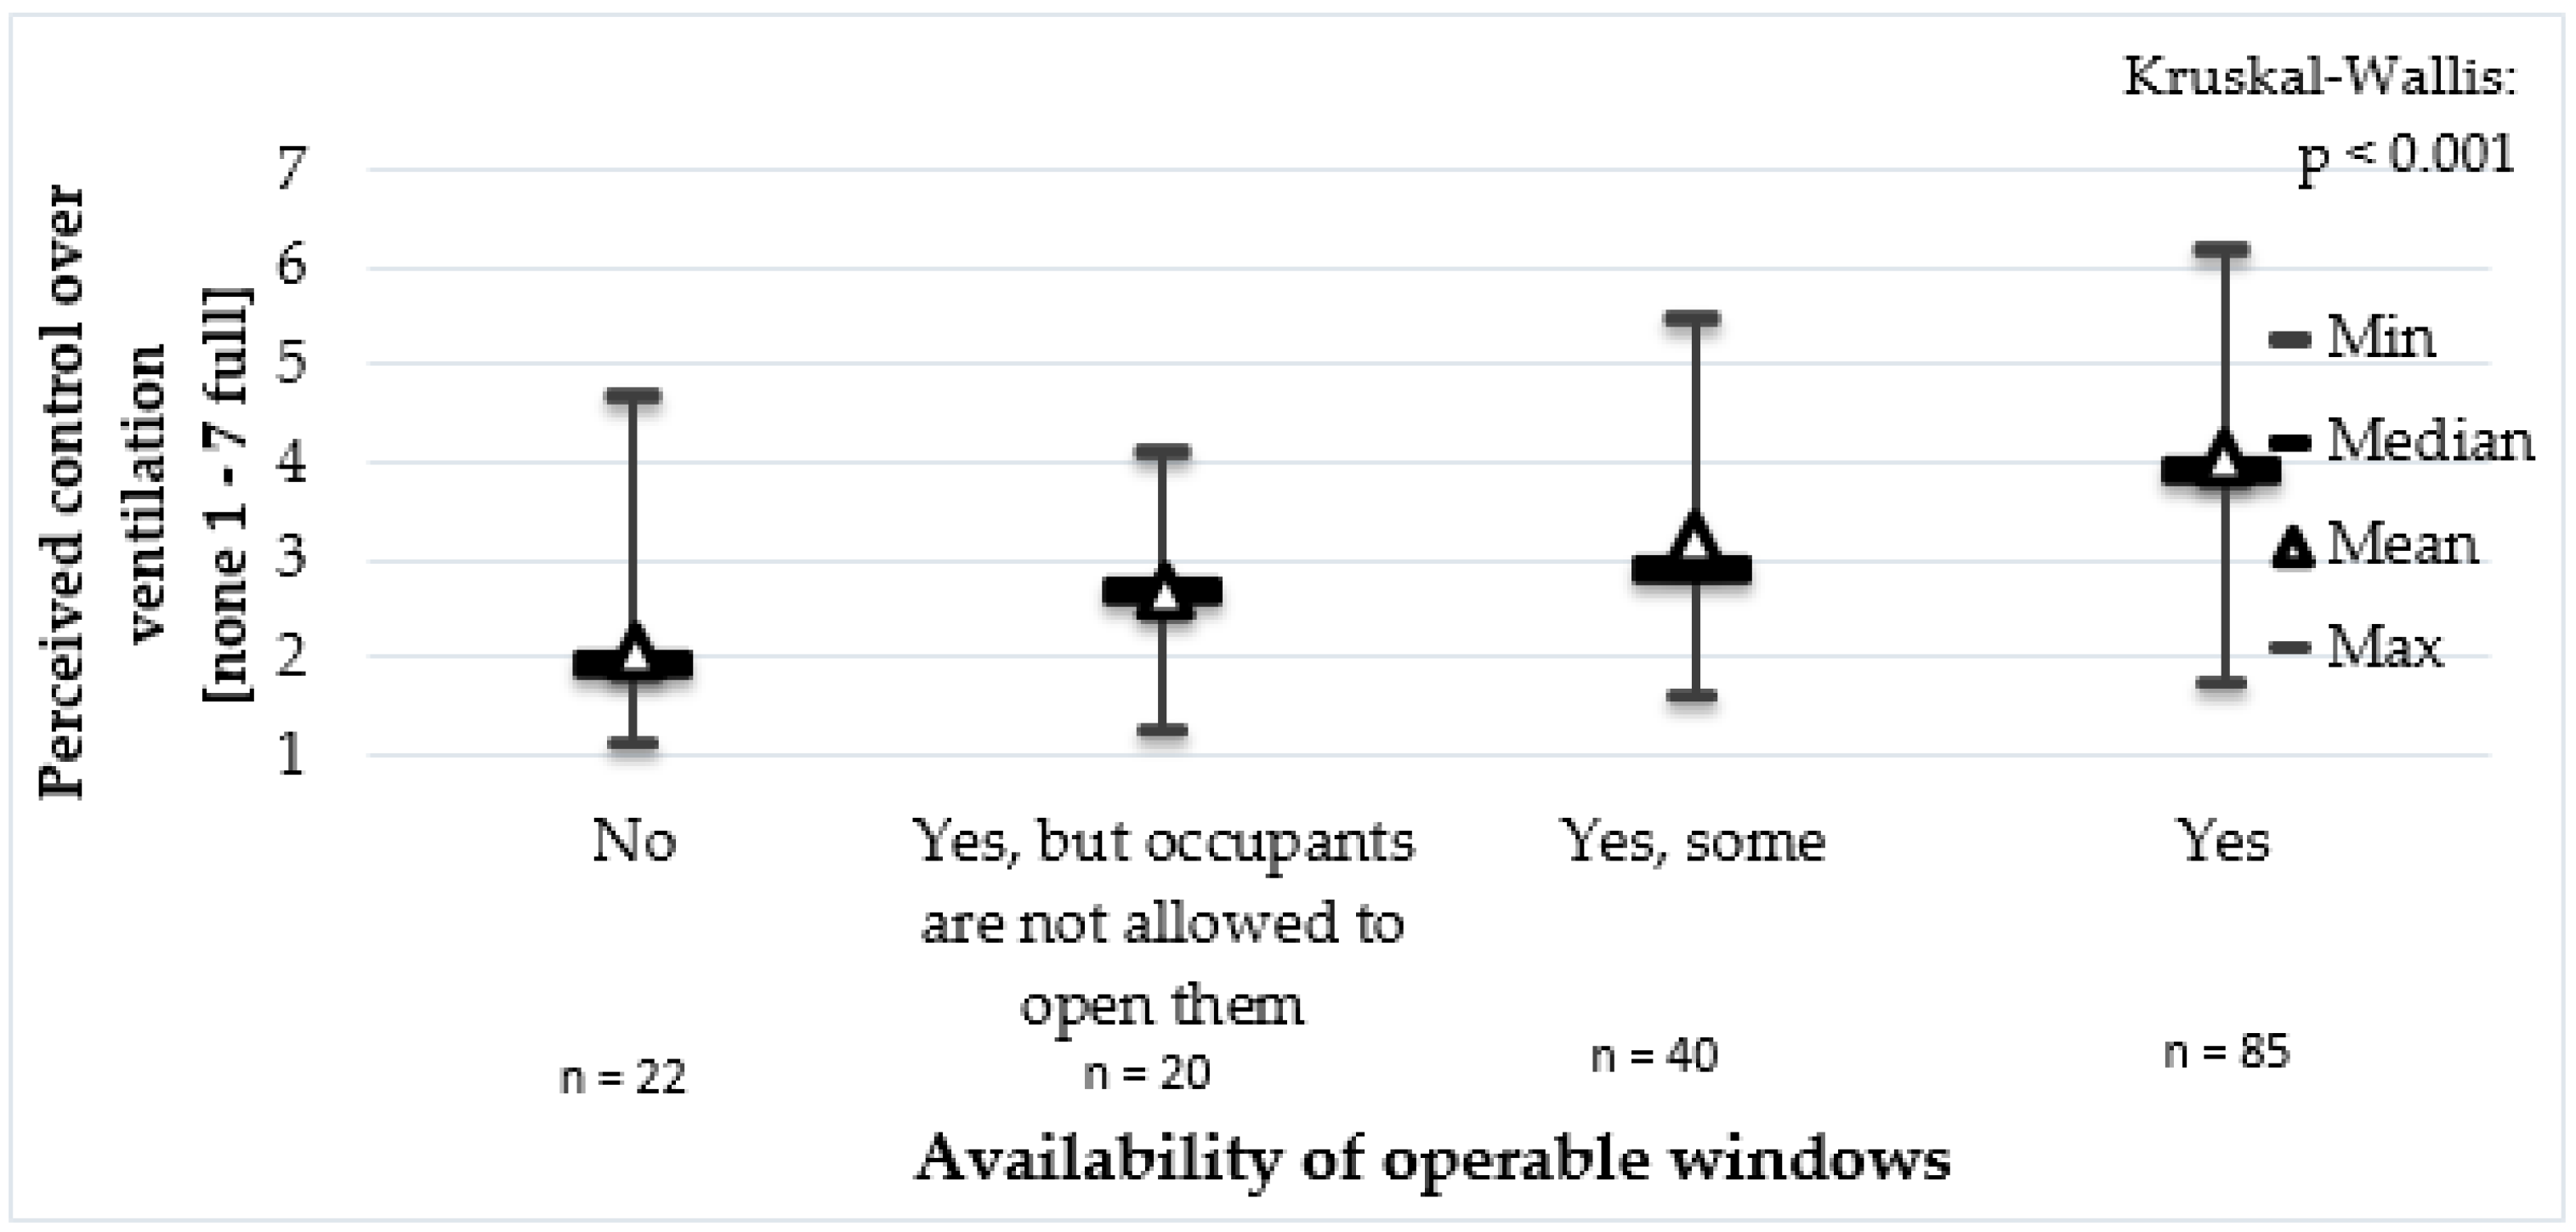
- Some significant correlations were found between the available controls within the building and the perceived control. The availability of operable windows had a higher impact on the occupants’ control perception over temperature, ventilation, light and noise than floor area or occupancy. Perceived control over temperature differed significantly with the different types of solar devices.
- Occupants’ perceived control is related to psychological aspects. General building characteristics, such as floor number and floor area, office type, operable windows, etc., which help occupants feel freedom were positively associated with the perceived control. ERI remains a significant parameter of the controlling perception in office environments.
- Concerning the impact of perceived control on perceived comfort, the results of the present study are in general agreement with the literature. More specifically:
- The perceived combined control over all studied parameters is positive on the overall comfort
- The combined control over all parameters seems to have a stronger effect on overall comfort than the single controls
- Temperature variation seems to be more related to the combined control of temperature and shading from the sun control
- Combined control perception over temperature, ventilation and shading positively affects the occupants and gives them the feeling of fresher air and an overall satisfaction with air quality
- Noise from the buildings systems seems to be more affected by the combined control perception of all parameters rather than single controls
- The combined perceived control of all parameters was found to affect the occupants’ privacy, office layout and decoration satisfaction more
- Regarding reported health symptoms, office occupants with a higher degree of personal controls reported less building-related health symptoms.
Author Contributions
Funding
Acknowledgments
Conflicts of Interest
References
- Huang, Y.-H.; Robertson, M.M.; Chang, K.-I. The Role of Environmental Control on Environmental Satisfaction, Communication, and Psychological Stress: Effects of Office Ergonomics Training. Environ. Behav. 2004, 36, 617–637. [Google Scholar] [CrossRef]
- Gee, G.C.; Payne-Sturges, D.C. Environmental Health Disparities: A Framework Integrating Psychosocial and Environmental Concepts. Environ. Health Perspect. 2004, 112, 1645–1653. [Google Scholar] [CrossRef] [Green Version]
- Kalimeri, K.K.; Saraga, D.E.; Lazaridis, V.D.; Legkas, N.A.; Missia, D.A.; Tolis, E.I.; Bartzis, J.G. Indoor air quality investigation of the school environment and estimated health risks: Two-season measurements in primary schools in Kozani, Greece. Atmos. Pollut. Res. 2016, 7, 1128–1142. [Google Scholar] [CrossRef]
- Lee, S.Y.; Brand, J.L. Effects of control over office workspace on perceptions of the work environment and work outcomes. J. Environ. Psychol. 2005, 25, 323–333. [Google Scholar] [CrossRef]
- Huizenga, C.; Abbaszadeh, S.; Zagreus, L.; Arens, E.A. Air quality and thermal comfort in office buildings: Results of a large indoor environmental quality survey. Proceeding Healthy Build. 2006, 3, 393–397. [Google Scholar]
- Brager, G.; Baker, L. Occupant satisfaction in mixed-mode buildings. Build. Res. Inf. 2009, 37, 369–380. [Google Scholar] [CrossRef] [Green Version]
- Langevin, J.; Wen, J.; Gurian, P.L. Relating occupant perceived control and thermal comfort: Statistical analysis on the ASHRAE RP-884 database. HVAC&R Res. 2012, 18, 179–194. [Google Scholar]
- Vine, E.; Lee, E.; Clear, R.; DiBartolomeo, D.; Selkowitz, S. Office worker response to an automated Venetian blind and electric lighting system: A pilot study. Energy Build. 1998, 28, 205–218. [Google Scholar] [CrossRef]
- Lee, S.Y.; Brand, J.L. Can personal control over the physical environment ease distractions in office workplaces? Ergonomics 2010, 53, 324–335. [Google Scholar] [CrossRef]
- Samani, S.A. The Impact of Personal Control over Office Workspace on Environmental Satisfaction and Performance. J. Soc. Sci. Humanit. 2015, 1, 163–172. [Google Scholar]
- Xuan, X. Study of indoor environmental quality and occupant overall comfort and productivity in LEED- and non-LEED–certified healthcare settings. Indoor Built Environ. 2018, 27, 544–560. [Google Scholar] [CrossRef]
- Yun, G.Y. Influences of perceived control on thermal comfort and energy use in buildings. Energy Build. 2018, 158, 822–830. [Google Scholar] [CrossRef]
- Zhao, Z.; Amasyali, K.; Chamoun, R.; El-Gohary, N. Occupants’ Perceptions about Indoor Environment Comfort and Energy Related Values in Commercial and Residential Buildings. Procedia Environ. Sci. 2016, 34, 631–640. [Google Scholar] [CrossRef]
- Al horr, Y.; Arif, M.; Katafygiotou, M.; Mazroei, A.; Kaushik, A.; Elsarrag, E. Impact of indoor environmental quality on occupant well-being and comfort: A review of the literature. Int. J. Sustain. Built Environ. 2016, 5, 1–11. [Google Scholar] [CrossRef]
- Frontczak, M.; Schiavon, S.; Goins, J.; Arens, E.; Zhang, H.; Wargocki, P. Quantitative relationships between occupant satisfaction and satisfaction aspects of indoor environmental quality and building design. Indoor Air 2012, 22, 119–131. [Google Scholar] [CrossRef]
- Paciuk, M. The Role of Personal Control of the Environment in Thermal Comfort and Satisfaction at the Workplace; University of Wisconsin-Milwaukee: Milwaukee, WI, USA, 1989. [Google Scholar]
- Collins, B.L.; Fisher, W.; Gillette, G.; Marans, R.W. Second-Level Post-Occupancy Evaluation Analysis. J. Illum. Eng. Soc. 1990, 19, 21–44. [Google Scholar] [CrossRef]
- Bordass, B.; Bromley, K.; Leaman, A. User and Occupant Controls in Office Buildings; BRE: Brussels, Belgium, 1993; p. 13. [Google Scholar]
- Haghighat, F.; Donnini, G. Impact of psycho-social factors on perception of the indoor air environment studies in 12 office buildings. Build. Environ. 1999, 34, 479–503. [Google Scholar] [CrossRef]
- Zweers, T.; Preller, L.; Brunekreef, B.; Boleij, J.S.M. Health and Indoor Climate Complaints of 7043 office Workers in 61 Buildings in the Netherlands. Indoor Air 1992, 2, 127–136. [Google Scholar] [CrossRef]
- Toftum, J. Central automatic control or distributed occupant control for better indoor environment quality in the future. Build. Environ. 2010, 45, 23–28. [Google Scholar] [CrossRef]
- Zagreus, L.; Huizenga, C.; Arens, E.; Lehrer, D. Listening to the occupants: A Web-based indoor environmental quality survey. Indoor Air 2004, 14, 65–74. [Google Scholar] [CrossRef]
- Boerstra, A.; Beuker, T.; Loomans, M.; Hensen, J. Impact of available and perceived control on comfort and health in European offices. Archit. Sci. Rev. 2013, 56, 30–41. [Google Scholar] [CrossRef] [Green Version]
- Kwon, M.; Remøy, H.; van den Dobbelsteen, A.; Knaack, U. Personal control and environmental user satisfaction in office buildings: Results of case studies in the Netherlands. Build. Environ. 2019, 149, 428–435. [Google Scholar] [CrossRef]
- Luo, M.; Cao, B.; Ji, W.; Ouyang, Q.; Lin, B.; Zhu, Y. The underlying linkage between personal control and thermal comfort: Psychological or physical effects? Energy Build. 2016, 111, 56–63. [Google Scholar] [CrossRef]
- Karjalainen, S. Thermal comfort and use of thermostats in Finnish homes and offices. Build. Environ. 2009, 44, 1237–1245. [Google Scholar] [CrossRef]
- De Dear, R.; Brager, G.S. Developing an Adaptive Model of Thermal Comfort and Preference. ASHRAE Trans. 1998, 104, 1–18. [Google Scholar]
- ASHRAE Standard 55 Thermal Environmental Conditions for Human Occupancy; ANSI/ASHRAE: Atlanta, GA, USA, 2013.
- International Organization for Standardization ISO 7730:2005. Available online: http://www.iso.org/cms/render/live/en/sites/isoorg/contents/data/standard/03/91/39155.html (accessed on 26 July 2019).
- Olesen, B.W.; Parsons, K.C. Introduction to thermal comfort standards and to the proposed new version of EN ISO 7730. Energy Build. 2002, 34, 537–548. [Google Scholar] [CrossRef]
- OFFICAIR Project. Available online: http://www.officair-project.eu/ (accessed on 6 August 2019).
- Nørgaard, A.W.; Kofoed-Sørensen, V.; Mandin, C.; Ventura, G.; Mabilia, R.; Perreca, E.; Cattaneo, A.; Spinazzè, A.; Mihucz, V.G.; Szigeti, T.; et al. Ozone-initiated Terpene Reaction Products in Five European Offices: Replacement of a Floor Cleaning Agent. Environ. Sci. Technol. 2014, 48, 13331–13339. [Google Scholar] [CrossRef]
- Mihucz, V.G.; Szigeti, T.; Dunster, C.; Giannoni, M.; de Kluizenaar, Y.; Cattaneo, A.; Mandin, C.; Bartzis, J.G.; Lucarelli, F.; Kelly, F.J.; et al. An integrated approach for the chemical characterization and oxidative potential assessment of indoor PM2.5. Microchem. J. 2015, 119, 22–29. [Google Scholar] [CrossRef]
- Bluyssen, P.M.; Roda, C.; Mandin, C.; Fossati, S.; Carrer, P.; de Kluizenaar, Y.; Mihucz, V.G.; de Oliveira Fernandes, E.; Bartzis, J. Self-reported health and comfort in ‘modern’ office buildings: First results from the European OFFICAIR study. Indoor Air 2016, 26, 298–317. [Google Scholar] [CrossRef]
- De Kluizenaar, Y.; Roda, C.; Dijkstra, N.E.; Fossati, S.; Mandin, C.; Mihucz, V.G.; Hänninen, O.; de Oliveira Fernandes, E.; Silva, G.V.; Carrer, P.; et al. Office characteristics and dry eye complaints in European workers-The OFFICAIR study. Build. Environ. 2016, 102, 54–63. [Google Scholar] [CrossRef]
- Sakellaris, I.; Saraga, D.; Mandin, C.; Roda, C.; Fossati, S.; de Kluizenaar, Y.; Carrer, P.; Dimitroulopoulou, S.; Mihucz, V.; Szigeti, T.; et al. Perceived Indoor Environment and Occupants’ Comfort in European “Modern” Office Buildings: The OFFICAIR Study. Int. J. Environ. Res. Public Health 2016, 13, 444. [Google Scholar] [CrossRef]
- Szigeti, T.; Dunster, C.; Cattaneo, A.; Cavallo, D.; Spinazzè, A.; Saraga, D.E.; Sakellaris, I.A.; de Kluizenaar, Y.; Cornelissen, E.J.M.; Hänninen, O.; et al. Oxidative potential and chemical composition of PM2.5 in office buildings across Europe—The OFFICAIR study. Environ. Int. 2016, 92–93, 324–333. [Google Scholar] [CrossRef]
- Campagnolo, D.; Saraga, D.E.; Cattaneo, A.; Spinazzè, A.; Mandin, C.; Mabilia, R.; Perreca, E.; Sakellaris, I.; Canha, N.; Mihucz, V.G.; et al. VOCs and aldehydes source identification in European office buildings—The OFFICAIR study. Build. Environ. 2017, 115, 18–24. [Google Scholar] [CrossRef]
- Mandin, C.; Trantallidi, M.; Cattaneo, A.; Canha, N.; Mihucz, V.G.; Szigeti, T.; Mabilia, R.; Perreca, E.; Spinazzè, A.; Fossati, S.; et al. Assessment of indoor air quality in office buildings across Europe—The OFFICAIR study. Sci. Total Environ. 2017, 579, 169–178. [Google Scholar] [CrossRef]
- Szigeti, T.; Dunster, C.; Cattaneo, A.; Spinazzè, A.; Mandin, C.; Le Ponner, E.; de Oliveira Fernandes, E.; Ventura, G.; Saraga, D.E.; Sakellaris, I.A.; et al. Spatial and temporal variation of particulate matter characteristics within office buildings—The OFFICAIR study. Sci. Total Environ. 2017, 587–588, 59–67. [Google Scholar] [CrossRef]
- Raw, G.J.; Roys, M.S.; Whitehead, C.; Tong, D. Questionnaire design for sick building syndrome: An empirical comparison of options. Environ. Int. 1996, 22, 61–72. [Google Scholar] [CrossRef]
- Theodorsson-Norheim, E. Kruskal-Wallis test: BASIC computer program to perform nonparametric one-way analysis of variance and multiple comparisons on ranks of several independent samples. Comput. Methods Programs Biomed. 1986, 23, 57–62. [Google Scholar] [CrossRef]
- Gelman, A.; Hill, J. Data Analysis Using Regression and Multilevel/Hierarchical Models; Cambridge University Press: Cambridge, UK, 2007; ISBN 978-0-521-68689-1. [Google Scholar]
- Goldstein, H. Multilevel Statistical Models; John Wiley & Sons: West Sussex, UK, 2011; ISBN 978-1-119-95682-2. [Google Scholar]
- Mukaka, M. A guide to appropriate use of Correlation coefficient in medical research. Malawi Med. J. 2012, 24, 69–71. [Google Scholar]
- IBM SPSS Statistics for Windows; Version 22.0; IBM: Armonk, NY, USA, 2013.
- Brager, G.; Paliaga, G.; de Dear, R.; Olesen, B.; Wen, J.; Nicol, F.; Humphreys, M. Operable Windows, Personal Control, and Occupant Comfort. ASHRAE Trans. 2004, 110, 17–35. [Google Scholar]
- Raja, I.A.; Nicol, J.F.; McCartney, K.J.; Humphreys, M.A. Thermal comfort: Use of controls in naturally ventilated buildings. Energy Build. 2001, 33, 235–244. [Google Scholar] [CrossRef]
- Gou, Z.; Zhang, J.; Shutter, L. The Role of Personal Control in Alleviating Negative Perceptions in the Open-Plan Workplace. Buildings 2018, 8, 110. [Google Scholar] [CrossRef]
- Moore, T.; Carter, D.; Slater, A. User attitudes toward occupant controlled office lighting. Light. Res. Technol. 2002, 34, 207–216. [Google Scholar] [CrossRef]
- Roulet, C.-A.; Johner, N.; Foradini, F.; Bluyssen, P.; Cox, C.; De Oliveira Fernandes, E.; Müller, B.; Aizlewood, C. Perceived health and comfort in relation to energy use and building characteristics. Build. Res. Inf. 2006, 34, 467–474. [Google Scholar] [CrossRef]


| Parameter | Items |
|---|---|
| Are there solar shading devices present? Which kind? | Not present |
| South side only One or more other facades | |
| External vertical blinds | |
| External shutters | |
| External roller shutters | |
| External louvers | |
| External screens | |
| External window films | |
| External horizontal blinds | |
| External awnings/canopies | |
| External overhangs | |
| External vertical fins | |
| Blind between glazing | |
| Internal vertical blinds | |
| Internal louvers | |
| Atrium | |
| Double façade | |
| Other | |
| How are the solar shading devices controlled? | No control (fixed) |
| Individual | |
| Central down, individual up | |
| Automatic | |
| How is the room temperature controlled? | Manual radiator valve |
| Local thermostat at radiator/heating unit | |
| Local thermostat (e.g., on wall) | |
| Central sensor | |
| Façade sensor(s)—i.e., outside temperature | |
| Zone sensor(s) | |
| Manual control in room(s) | |
| According to occupancy | |
| Other | |
| Are the windows operable? | Yes |
| Yes, some | |
| Yes, but occupants are not allowed to open them | |
| No | |
| How are main lights (e.g., ceiling or wall) controlled? | Automatic by time (building/floor/zone) |
| Automatic with manual end control (building/floor/zone) | |
| Demand control: Daylight (photocells) | |
| Demand control: Occupants (motion sensors) | |
| Manual | |
| What type of control system is there for mechanical ventilation? | Central—Manual (on/off) |
| Central—Clock/Central—Demand control (temperature, CO2, other pollutant, relative humidity) | |
| Local—Manual (on/off) | |
| Local—Clock/Local—Demand control (temperature, CO2, other pollutant, relative humidity) | |
| Recirculation control |
| Parameter | Sub-Parameters | Type of Answer |
|---|---|---|
| Overall Comfort Temperature | Overall temperature | Seven-point Likert-like scale Seven-point Likert-like scale |
| Too hot/too cold temperature | From “−3, too hot” to “+3, too cold” | |
| Temperature variation | From “−3, too much” to “+3, not enough” | |
| Air movement | From “−3, too draughty” to “+3, too still” | |
| Air quality | Overall air quality | Seven-point Likert-like scale |
| Humid/dry air | From “−3, too humid” to “+3, too dry” | |
| Stuffy or fresh air | Seven-point Likert-like scale | |
| Odor | Seven-point Likert-like scale | |
| Light | Overall light | Seven-point Likert-like scale |
| Natural | Seven-point Likert-like scale | |
| Artificial | Seven-point Likert-like scale | |
| Glare | Seven-point Likert-like scale | |
| Noise | Overall noise | Seven-point Likert-like scale |
| Outside noise | Seven-point Likert-like scale | |
| Noise from building systems | Seven-point Likert-like scale | |
| Noise within the building | Seven-point Likert-like scale | |
| Vibration | Seven-point Likert-like scale | |
| Amount of privacy | Seven-point Likert-like scale | |
| Office layout | Seven-point Likert-like scale | |
| Office decoration | Seven-point Likert-like scale | |
| View from the windows | Seven-point Likert-like scale |
| Perceived Control over Temperature | Perceived Control over Shading | Perceived Control over Light | Perceived Control over Ventilation | |
|---|---|---|---|---|
| Type of Available Temperature Controls | ||||
| Manual radiator valve | 3.38 | |||
| Local thermostat at radiator/heating unit | 3.96 | |||
| Local thermostat (e.g., on wall) | 3.53 | |||
| Central sensor | 3.52 | |||
| Facade sensor(s)—i.e., outside temperature | 4.12 | |||
| Zone sensor(s) | 4.03 | |||
| Manual control in room(s) | 3.70 | |||
| p-value (Kruskal-Wallis test) | 0.166 | |||
| Availability of shading devices | ||||
| None | 4.09 | 4.69 | ||
| Internal | 4.43 | 4.43 | ||
| External | 4.22 | 4.44 | ||
| p-value (Kruskal-Wallis test) | 0.635 | 0.255 | ||
| Type of control of the available solar shading devices | ||||
| No control (fixed) | 3.45 | 3.90 | 4.53 | |
| Individual | 3.60 | 4.43 | 4.43 | |
| Central down, individual up | 3.25 | 4.46 | 3.76 | |
| Automatic | 3.77 | 4.18 | 4.61 | |
| p-value (Kruskal-Wallis test) | 0.755 | 0.147 | 0.710 | |
| Type of operable windows | ||||
| Yes | 4.42 | |||
| Yes, some | 4.15 | |||
| Yes, but occupants are not allowed to open them | 4.81 | |||
| No | 4.11 | |||
| p-value (Kruskal-Wallis test) | 0.100 | |||
| Type of available light controls | ||||
| Manual | 4.52 | |||
| Demand control: Occupants (motion sensors) | 4.42 | |||
| Demand control: Daylight (photocells) | 4.26 | |||
| Automatic with manual end control (building/floor/zone) | 4.91 | |||
| Automatic by time (buildings/floor/zone) | 4.54 | |||
| p-value (Kruskal-Wallis test) | 0.328 | |||
| Type of available mechanical ventilation controls | ||||
| Central—Manual (on/off) | 3.81 | 3.33 | ||
| Central—Clock | 3.62 | 3.23 | ||
| Central—Demand control (temperature, CO2, other pollutant, relative humidity) | 3.58 | 3.27 | ||
| Local—Manual (on/off) | 4.11 | 4.27 | ||
| Local—Clock | 3.74 | 3.78 | ||
| Local—Demand control (temperature, CO2, other pollutant, relative humidity) | 4.42 | 3.73 | ||
| p-value (Kruskal-Wallis test) | 0.768 | 0.105 | ||
| Characteristics | n1/N1 | n2/N2 | OR (CI 95%) | p-Value |
|---|---|---|---|---|
| General building characteristics | ||||
| Location | ||||
| Mixed industrial/residential area (vs. industrial area) | 696/7441 | 14/167 | 1.68 (0.76–3.69) | 0.199 |
| Commercial area (vs. industrial area) | 789/7441 | 18/167 | 0.95 (0.46–1.95) | 0.883 |
| Mixed commercial/residential area (vs. industrial area) | 2279/7441 | 50/167 | 1.71 (0.94–3.09) | 0.076 |
| City center, densely packed housing (vs. industrial area) | 1344/7441 | 30/167 | 1.35 (0.7–2.63) | 0.374 |
| Town, with no or small gardens (vs. industrial area) | 328/7441 | 8/167 | 3.42 (1.33–8.75) | 0.010 |
| Suburban, with larger gardens (vs. industrial area) | 864/7441 | 22/167 | 3.88 (1.92–7.82) | <0.001 |
| Village in a rural area (vs. industrial area) | 24/7441 | 1/167 | 0.82 (0.09–7.46) | 0.859 |
| Rural area with no or few other homes nearby (vs. industrial area) | 192/7441 | 6/167 | 1.27 (0.45–3.57) | 0.646 |
| Façades with adjacent buildings | ||||
| 2 façades (vs. 1 façade) | 1932/4664 | 37/102 | 0.6 (0.38–0.95) | 0.030 |
| 3 façades (vs. 1 façade) | 288/4664 | 9/102 | 1.48 (0.68–3.25) | 0.322 |
| Density of nearby obstructions | ||||
| Moderately dense (vs. very dense) | 2610/7441 | 58/167 | 1.31 (0.69–2.5) | 0.407 |
| Few buildings (vs. very dense) | 2992/7441 | 58/167 | 1.43 (0.74–2.76) | 0.285 |
| Free standing (vs. very dense) | 1031/7441 | 26/167 | 1.95 (0.93–4.09) | 0.076 |
| Neighboring buildings with glass facades or light-colored facades causing glare | ||||
| Yes, in summer (vs. No) | 215/7441 | 4/167 | 0.4 (0.13–1.27) | 0.120 |
| A little in summer (vs. No) | 654/7441 | 12/167 | 0.5 (0.25–1) | 0.049 |
| Yes, in winter (vs. No) | 102/7441 | 2/167 | 0.35 (0.07–1.71) | 0.195 |
| A little in winter (vs. No) | 217/7441 | 5/167 | 0.24 (0.09–0.68) | 0.007 |
| Maximum number of occupants in the building | ||||
| Between 101 and 250 (vs. ≤100) | 2288/7260 | 56/163 | 0.79 (0.52–1.2) | 0.272 |
| ≥251 (vs. ≤100) | 3544/7260 | 51/163 | 0.39 (0.25–0.61) | <0.001 |
| Total floor area (m²) | ||||
| Between 1441 and 3210 (≤1440) | 2300/7234 | 53/160 | 0.78 (0.49–1.24) | 0.295 |
| ≥3211 (≤1440) | 3341/7234 | 54/160 | 0.51 (0.31–0.83) | 0.007 |
| Activities in the building besides office work | ||||
| Underground car park (vs. No) | 2678/7441 | 44/167 | 0.73 (0.46–1.16) | 0.178 |
| Print shop (vs. No) | 428/7441 | 7/167 | 1.92 (0.78–4.73) | 0.156 |
| Pesticide treatment plan (vs. No) | 7025/7441 | 99/164 | 0.59 (0.39–0.88) | 0.010 |
| Documented complaints procedure for occupants (vs. No) | 5112/7349 | 99/165 | 0.41 (0.28–0.61) | <0.001 |
| Smoking permission | ||||
| Only outside the building (vs. No) | 3916/7441 | 88/167 | 0.55 (0.33–0.93) | 0.026 |
| Only in separately ventilated rooms (vs. No) | 973/7441 | 13/167 | 0.29 (0.13–0.63) | 0.002 |
| Percentage of office furniture is less than one year old and made of MDF | 7025/7441 | 162/162 | 0.99 (0.99–1) | 0.200 |
| Portable air cleaner (vs. No) | 225/7441 | 5/167 | 0.33 (0.12–0.93) | 0.035 |
| Office characteristics | ||||
| Floor surface of the office | 7410/7441 | 167/167 | 1.05 (1.02–1.09) | 0.001 |
| Number of people in the office on average | ||||
| Private (vs. 30+) | 1501/7352 | 144/167 | 7.65 (6.19–9.45) | <0.001 |
| 2–4 (vs. 30+) | 2134/7352 | 152/167 | 5.15 (4.24–6.26) | <0.001 |
| 5–9 (vs. 30+) | 1019/7352 | 117/167 | 2.62 (2.15–3.21) | <0.001 |
| 10–29 (vs. 30+) | 1492/7352 | 100/167 | 1.48 (1.25–1.76) | <0.001 |
| Type of office | ||||
| Shared private office (vs. single person private office) | 2236/7417 | 150/167 | 0.56 (0.48–0.65) | <0.001 |
| Open space with partitions (vs. single person private office) | 991/7417 | 115/167 | 0.21 (0.17–0.26) | <0.001 |
| Open space without partitions (vs. single person private office) | 2602/7441 | 139/167 | 0.21 (0.17–0.25) | <0.001 |
| Other (vs. single person private office) | 90/7417 | 60/167 | 0.39 (0.24–0.65) | <0.001 |
| Partitions within the offices (vs. No) | 4112/7441 | 91/167 | 0.67 (0.45–0.99) | 0.043 |
| Noise source of occupants–distracting conversations (vs. No) | 2653/7441 | 64/167 | 0.66 (0.45–0.98) | 0.040 |
| PC or laptop monitor position | ||||
| In front of windows (vs. Not) | 3018/7441 | 69/167 | 1.44 (1–2.08) | 0.052 |
| Printer/copy machines location | ||||
| In the offices (vs. on the corridor) | 2976/7441 | 75/167 | 0.62 (0.39–1) | 0.051 |
| In a separate printing room (vs. on the corridor) | 2501/7441 | 47/167 | 0.64 (0.39–1.05) | 0.075 |
| Operable windows | ||||
| Yes (vs. No) | 3724/7441 | 85/163 | 5.51 (3.14–9.67) | <0.001 |
| Yes, some (vs. No) | 1769/7441 | 40/163 | 3.08 (1.72–5.53) | <0.001 |
| Yes, but occupants are not allowed to open them (vs. No) | 913/7441 | 20/163 | 1.54 (0.79–2.98) | 0.204 |
| Location of air supply devices inside offices—ceiling (vs. No air supply) | 5783/7441 | 123/167 | 0.63 (0.4–0.99) | 0.046 |
| Location of air exhaust devices inside offices | ||||
| High (vs. None) | 6189/7089 | 128/154 | 0.46 (0.25–0.87) | 0.017 |
| Low (vs. None) | 382/7089 | 10/154 | 0.63 (0.24–1.63) | 0.339 |
| Factors | OR (CI 95%) | p-Value |
|---|---|---|
| Individual characteristics/personal activities | ||
| Female (vs. Male) | 1.21 (1.06–1.38) | 0.006 |
| Age | ||
| <35 (vs. 55+) | 0.89 (0.69–1.14) | 0.345 |
| 35–45 (vs. 55+) | 0.78 (0.61–0.99) | 0.040 |
| 46–55 (vs. 55+) | 0.95 (0.74–1.23) | 0.720 |
| Effort-reward ratio | 0.31 (0.25–0.38) | <0.001 |
| Experience of negative events (vs. No) | 0.94 (0.83–1.07) | 0.367 |
| Type of job | ||
| Managerial (vs. Other) | 0.97 (0.75–1.27) | 0.844 |
| Professional (vs. Other) | 0.98 (0.78–1.23) | 0.873 |
| Clerical-secretarial (vs. Other) | 0.95 (0.77–1.17) | 0.625 |
| Type of job’s contract–Full-time (vs. Part-time) | 1.12 (0.89–1.41) | 0.344 |
| Job’s contract duration–Permanent (vs. Fixed-term) | 1.13 (0.91–1.39) | 0.263 |
| Air fresheners use in home (vs. No) | 1.26 (1.11–1.44) | <0.001 |
| Building characteristics | ||
| Location | ||
| Mixed industrial/residential area (vs. industrial area) | 0.64 (0.31–1.29) | 0.208 |
| Commercial area (vs. industrial area) | 1.59 (0.83–3.07) | 0.164 |
| Mixed commercial/residential area (vs. industrial area) | 1.05 (0.61–1.83) | 0.849 |
| City Centre, densely packed housing (vs. industrial area) | 1.15 (0.62–2.1) | 0.660 |
| Town, with no or small gardens (vs. industrial area) | 2.98 (0.95–9.39) | 0.062 |
| Suburban, with larger gardens (vs. industrial area) | 1.73 (0.63–4.72) | 0.285 |
| Village in a rural area (vs. industrial area) | 0.24 (0.06–0.96) | 0.043 |
| Rural area with no or few other homes nearby (vs. industrial area) | 1.02 (0.24–4.45) | 0.974 |
| Density of nearby obstructions | ||
| Moderately dense (vs. Very dense) | 1.11 (0.63–1.95) | 0.729 |
| Few buildings (vs. Very dense) | 1.14 (0.65–2.02) | 0.648 |
| Free standing (vs. Very dense) | 0.99 (0.44–2.19) | 0.972 |
| Maximum number of occupants in the building | ||
| Between 101 and 250 (vs. ≤100) | 0.67 (0.46–0.99) | 0.045 |
| ≥251 (vs. ≤100) | 0.92 (0.56–1.52) | 0.745 |
| Total floor area | ||
| Between 1441 and 3210 (≤1440) | 1.99 (1.22–3.25) | 0.006 |
| ≥3211 (≤1440) | 1.44 (0.81–2.57) | 0.217 |
| Façades with adjacent buildings | ||
| 2 façades (vs. 1 façade) | 0.65 (0.44–0.97) | 0.033 |
| 3 façades (vs. 1 façade) | 1 (0.51–1.95) | 0.992 |
| Neighboring buildings with glass facades or light-colored facades causing glare | ||
| Yes, in Summer (vs. No) | 3.16 (1.15–8.66) | 0.025 |
| A little in Summer (vs. No) | 1.52 (0.74–3.14) | 0.256 |
| Yes, in Winter (vs. No) | 0.24 (0.06–0.94) | 0.040 |
| A little in Winter (vs. No) | 0.49 (0.17–1.39) | 0.180 |
| Operable windows | ||
| Yes (vs. No) | 4.81 (2.85–8.14) | <0.001 |
| Yes, some (vs. No) | 6.53 (3.76–11.34) | <0.001 |
| Yes, but occupants are not allowed to open them (vs. No) | 3.64 (1.82–7.27) | <0.001 |
| Activities in the building besides office work | ||
| Underground car park (vs. No) | 0.79 (0.52–1.19) | 0.258 |
| Print shop (vs. No) | 1.4 (0.6–3.27) | 0.435 |
| Portable air cleaner (vs. No) | 0.79 (0.31–2) | 0.622 |
| Pesticide treatment plan (vs. No) | 1.33 (0.74–2.38) | 0.336 |
| Smoking permission | ||
| Only outside the building (vs. No) | 0.82 (0.46–1.46) | 0.492 |
| Only in separately ventilated rooms(vs. No) | 0.66 (0.32–1.36) | 0.260 |
| Documented complaints procedure for occupants (vs. No) | 0.77 (0.5–1.17) | 0.221 |
| Percentage of office furniture is less than one year old and made of MDF | 1 (0.99–1.01) | 0.800 |
| Office characteristics | ||
| Floor surface of the office | 1.06 (1.02–1.1) | 0.002 |
| Number of people in the office on average | ||
| Private (vs. 30+) | 2.51 (1.59–3.97) | <0.001 |
| 2–4 (vs. 30+) | 3.73 (2.78–4.99) | <0.001 |
| 5–9 (vs. 30+) | 2.3 (1.79–2.96) | <0.001 |
| 10–29 (vs. 30+) | 1.58 (1.29–1.93) | <0.001 |
| Type of office | ||
| Shared private office (vs. Single person private office) | 0.36 (0.23–0.55) | <0.001 |
| Open space with partitions (vs. Single person private office) | 0.23 (0.14–0.36) | <0.001 |
| Open space without partitions (vs. Single person private office) | 0.26 (0.17–0.4) | <0.001 |
| Other (vs. Single person private office) | 0.57 (0.25–1.29) | 0.178 |
| Partitions within the offices (vs. No) | 1.02 (0.64–1.61) | 0.935 |
| Noise source of Occupants–distracting conversations (vs. No) | 0.69 (0.49–0.97) | 0.034 |
| PC or laptop monitor position | ||
| In front of windows (vs. Not) | 1.32 (0.94–1.86) | 0.103 |
| Printer/copy machines location | ||
| In the offices (vs. on the corridor) | 0.99 (0.63–1.55) | 0.956 |
| In a separate printing room (vs. on the corridor) | 1.23 (0.76–1.99) | 0.396 |
| Location of air supply devices inside offices—ceiling (vs. No air supply) | 0.81 (0.51–1.28) | 0.365 |
| Location of air exhaust devices inside offices | ||
| High (vs. None) | 1.43 (0.61–3.34) | 0.408 |
| Low (vs. None) | 0.93 (0.37–2.35) | 0.879 |
| County level σ2/PCV (%) | 0.42/10 | |
| Building level σ2/PCV (%) | 0.14/88 |
| Perceived Control over Temperature and Ventilation Combined [2: None at all-14: Full Control] | Perceived Control over Temperature and Shading from the Sun Combined [2: None at all-14: Full Control] | Perceived Control over Temperature, Ventilation and Shading from the Sun Combined [3: None at all-21: Full Control] | Perceived Control over Temperature, Ventilation, Shading from the Sun, Light and Noise Combined [5: None at all-35: Full Control] | |
|---|---|---|---|---|
| Overall comfort [1: Unsatisfactory-7: Satisfactory] | 0.367 | 0.415 | 0.415 | 0.465 |
| <0.001 | <0.001 | <0.001 | <0.001 | |
| Temperature [1: Too hot/cold- 7: Satisfactory] | 0.258 | 0.257 | 0.255 | 0.245 |
| <0.001 | <0.001 | <0.001 | <0.001 | |
| Temperature [1: Varies too much/not enough variation-7: Satisfactory] | 0.154 | 0.209 | 0.186 | 0.188 |
| <0.001 | <0.001 | <0.001 | <0.001 | |
| Temperature [1: Unsatisfactory-7: Satisfactory] | 0.403 | 0.414 | 0.416 | 0.43 |
| <0.001 | <0.001 | <0.001 | <0.001 | |
| Air movement [1: Draughty/Still- 7: Satisfactory] Air movement | 0.175 | 0.164 | 0.178 | 0.182 |
| <0.001 | <0.001 | <0.001 | <0.001 | |
| Air quality [1: Dry/humid-7: Satisfactory] | 0.143 | 0.142 | 0.147 | 0.162 |
| <0.001 | <0.001 | <0.001 | <0.001 | |
| Air quality [1: Stuffy- 7: Fresh] | 0.287 | 0.312 | 0.322 | 0.342 |
| <0.001 | <0.001 | <0.001 | <0.001 | |
| Air quality [1: Smelly-7: Odorless] | 0.129 | 0.183 | 0.17 | 0.195 |
| <0.001 | <0.001 | <0.001 | <0.001 | |
| Air quality [1: Unsatisfactory-7: Satisfactory] | 0.35 | 0.363 | 0.38 | 0.405 |
| <0.001 | <0.001 | <0.001 | <0.001 | |
| Natural light [1: Unsatisfactory-7: Satisfactory] | 0.247 | 0.356 | 0.342 | 0.361 |
| <0.001 | <0.001 | <0.001 | <0.001 | |
| Artificial light [1: Unsatisfactory-7: Satisfactory] | 0.245 | 0.281 | 0.284 | 0.331 |
| <0.001 | <0.001 | <0.001 | <0.001 | |
| Reflection or glare [1: Glare|-7: No glare] | 0.123 | 0.145 | 0.142 | 0.166 |
| <0.001 | <0.001 | <0.001 | <0.001 | |
| Light overall [1: Unsatisfactory-7: Satisfactory] | 0.295 | 0.364 | 0.361 | 0.401 |
| <0.001 | <0.001 | <0.001 | <0.001 | |
| Noise from outside the building [1: Unsatisfactory-7: Satisfactory] | −0.004 | 0.077 | 0.048 | 0.077 |
| 0.707 | <0.001 | <0.001 | <0.001 | |
| Noise from building systems (e.g., heating, plumbing, ventilation, air conditioning) [1: Unsatisfactory-7: Satisfactory] | 0.172 | 0.191 | 0.198 | 0.226 |
| <0.001 | <0.001 | <0.001 | <0.001 | |
| Noise from within the building other than from building systems (e.g., phone calls, colleagues chatting, photocopiers, etc.) [1: Unsatisfactory-7: Satisfactory] | 0.28 | 0.302 | 0.304 | 0.367 |
| <0.001 | <0.001 | <0.001 | <0.001 | |
| Noise overall [1: Unsatisfactory-7: Satisfactory] | 0.286 | 0.322 | 0.321 | 0.389 |
| <0.001 | 0.000 | 0.000 | 0.000 | |
| Vibration [1: Unsatisfactory-7: Satisfactory] | 0.108 | 0.177 | 0.16 | 0.193 |
| <0.001 | <0.001 | <0.001 | <0.001 | |
| Amount of privacy [1: Unsatisfactory-7: Satisfactory] | 0.333 | 0.385 | 0.379 | 0.433 |
| <0.001 | <0.001 | <0.001 | <0.001 | |
| Layout [1: Do not like at all-7: Like very much] | 0.31 | 0.367 | 0.361 | 0.403 |
| <0.001 | <0.001 | <0.001 | <0.001 | |
| Decoration [1: Do not like at all-7: Like very much] | 0.22 | 0.295 | 0.278 | 0.315 |
| <0.001 | <0.001 | <0.001 | <0.001 | |
| View from the windows [1: Do not like at all-7: Like very much] | 0.147 | 0.256 | 0.233 | 0.246 |
| <0.001 | <0.001 | <0.001 | <0.001 | |
| PSI5 | −0.249 | −0.251 | -0.263 | −0.289 |
| <0.001 | <0.001 | <0.001 | <0.001 |
| Parameters | OR CI (95%) | p-Value |
|---|---|---|
| Perceived control over noise | 1.28 (1.25–1.32) | p < 0.001 |
| Perceived control over lighting | 1.16 (1.13–1.19) | p < 0.001 |
| Perceived control over temperature | 1.14 (1.11–1.18) | p < 0.001 |
| Perceived control over shade | 1.12 (1.10–1.15) | p < 0.001 |
| Perceived control over ventilation | 1.03 (1.00–1.06) | p < 0.05 |
| Parameters—Low Control Group | OR CI (95%) | p-Value | Parameters—High Control Group | OR CI (95%) | CI (95%) |
|---|---|---|---|---|---|
| Perceived control over noise | 1.21 (1.15–1.27) | p < 0.001 | Perceived control over noise | 1.37 (1.32–1.43) | p < 0.001 |
| Perceived control over lighting | 1.14 (1.11–1.17) | p < 0.001 | Perceived control over lighting | 1.32 (1.25–1.39) | p < 0.001 |
| Perceived control over temperature | 1.11 (1.06–1.15) | p < 0.001 | Perceived control over temperature | 1.26 (1.20–1.31) | p < 0.001 |
| Perceived control over shade | 1.10 (1.07–1.13) | p < 0.001 | Perceived control over shade | 1.19 (1.14–1.25) | p < 0.001 |
| Perceived control over ventilation | 0.99 (0.95–1.04) | p > 0.05 | Perceived control over ventilation | 1.08 (1.04–1.12) | p < 0.001 |
© 2019 by the authors. Licensee MDPI, Basel, Switzerland. This article is an open access article distributed under the terms and conditions of the Creative Commons Attribution (CC BY) license (http://creativecommons.org/licenses/by/4.0/).
Share and Cite
Sakellaris, I.; Saraga, D.; Mandin, C.; de Kluizenaar, Y.; Fossati, S.; Spinazzè, A.; Cattaneo, A.; Szigeti, T.; Mihucz, V.; de Oliveira Fernandes, E.; et al. Personal Control of the Indoor Environment in Offices: Relations with Building Characteristics, Influence on Occupant Perception and Reported Symptoms Related to the Building—The Officair Project. Appl. Sci. 2019, 9, 3227. https://doi.org/10.3390/app9163227
Sakellaris I, Saraga D, Mandin C, de Kluizenaar Y, Fossati S, Spinazzè A, Cattaneo A, Szigeti T, Mihucz V, de Oliveira Fernandes E, et al. Personal Control of the Indoor Environment in Offices: Relations with Building Characteristics, Influence on Occupant Perception and Reported Symptoms Related to the Building—The Officair Project. Applied Sciences. 2019; 9(16):3227. https://doi.org/10.3390/app9163227
Chicago/Turabian StyleSakellaris, Ioannis, Dikaia Saraga, Corinne Mandin, Yvonne de Kluizenaar, Serena Fossati, Andrea Spinazzè, Andrea Cattaneo, Tamas Szigeti, Victor Mihucz, Eduardo de Oliveira Fernandes, and et al. 2019. "Personal Control of the Indoor Environment in Offices: Relations with Building Characteristics, Influence on Occupant Perception and Reported Symptoms Related to the Building—The Officair Project" Applied Sciences 9, no. 16: 3227. https://doi.org/10.3390/app9163227