Article

How Working Tasks Influence Biocontamination in an Animal Facility

1
Department of Occupational and Environmental Medicine, Epidemiology and Hygiene, Italian Workers’ Compensation Authority (INAIL), Via Fontana Candida 1, Monte Porzio Catone, 00078 Rome, Italy
2
Santa Lucia Foundation IRCCS, Via Ardeatina 306, 00142 Rome, Italy
3
Institute of Cell Biology and Neurobiology, National Research Council (CNR), Via E. Ramarini 32, Monterotondo, 00015 Rome, Italy
4
Department of Occupational and Environmental Medicine, Epidemiology and Hygiene, Italian Workers’ Compensation Authority (INAIL), Via Stefano Gradi 55, 00143 Rome, Italy
*
Author to whom correspondence should be addressed.
Appl. Sci. 2019, 9(11), 2216; https://doi.org/10.3390/app9112216
Submission received: 30 April 2019 / Revised: 23 May 2019 / Accepted: 27 May 2019 / Published: 29 May 2019
(This article belongs to the Special Issue Indoor Air Quality)

Abstract

:
The exposure to biocontaminants in animal facilities represents a risk for developing infectious, allergic and toxic diseases. The aim of this study was to determine what factors could be associated with a high level of exposure to biological agents through the measure and characterization of airborne fungi, bacteria, endotoxin, (1,3)-β-d-glucan and animal allergens. Airborne microorganisms were collected with an air sampler and identified by microscopic and biochemical methods. Endotoxin, (1,3)-β-d-glucan, Mus m 1, Rat n 1, Can f 1, Fel d 1, Equ c 4 allergens were detected on inhalable dust samples by Kinetic LAL, Glucatell, and ELISA assays, respectively. Our data evidenced that changing cages is a determinant factor in increasing the concentration of the airborne biocontaminants; the preparation of bedding and distribution of feed, performed in the storage area, is another critical working task in terms of exposure to endotoxins (210.7 EU/m3) and (1,3)-β-d-glucans (4.3 ng/m3). The highest concentration of Mus m 1 allergen (61.5 ng/m3) was observed in the dirty washing area. The detection of expositive peaks at risk of sensitization (>2 μg/g) by Fel d 1 in animal rooms shows passive transport by operators themselves, highlighting their role as vehicle between occupational and living environments.

1. Introduction

The exposure to biocontaminants is well documented and studied in several occupational settings, and few data are available in animal facilities, although more attention has been addressed to animal allergens. These biological agents are aeroallergens, mainly lipocalins, derived by different biological fluids and/or tissue (saliva, serum, urine, dander, hair, fur) that remain in suspension for different times in relation to meteorological conditions and factors influencing their dispersion [1,2]. In recent years, the topic regarding animal allergen exposure has been treated both in pets [3,4,5] and experimental animals [6,7,8,9], and attention has been also addressed to co-exposure of allergens and endotoxins in these workplaces, although in a more restricted way [10,11,12,13,14,15]. Exposure to biocontaminants in animal facilities in USA and in the United Kingdom has received great attention [16,17,18,19] as demonstrated by the NIOSH publication in 1998 [20], where the so-called LAA (Laboratory Animal Allergy) was considered an occupational risk, and by Gordon in 2001 [21]. Various papers have been published in scientific literature both as a review [22,23,24] and experimental studies [25,26,27] while in Italy the topic of LAA is not studied carefully yet.
Health effects reported on laboratory animal workers (LAWs) are mainly represented by asthma, rhinitis, conjunctivitis, dermatitis and anaphylaxis [8,19,28]. Discordant percentages of LAA have been reported in the LAWs and these differences could be attributed to different evaluation methods (questionnaires, analytical test, etc.). In this context a relevant aspect is represented by environmental exposure to animal allergens, and although a lot of papers report the monitoring of these biocontaminants, there is some difficulty in comparing results because of the differences in sampling and analytical methods [29,30,31,32]. In addition to allergens, there are several other biological agents in animal facilities with possible health consequences such as airborne bacteria, fungi and microbial indicators (endotoxin and (1,3)-β-d-glucan) which may originate from animals (fur, epidermal material), their waste (feces and urine) and materials used in their maintenance (food, bedding) [33]. Airborne endotoxin, an outer membrane component of Gram-negative bacteria, has been identified as the major risk factor for nasal, chest and skin symptoms also contributing to allergy diseases [11,34]. Some authors report that fecal bacteria in soiled bedding may produce increased concentrations of endotoxin compared to other settings and this may be an occupational health concern. The authors concluded that the percentage of dust and endotoxin in different types of rodent bedding could be an important factor affecting the occupational exposure of personnel working with laboratory animals causing airway inflammation, hypersensitivity pneumonitis, organic dust toxic syndrome (ODTS), chronic obstructive pulmonary disease (COPD) and asthma-like syndrome, as well as having harmful effects on the animals themselves [33].
Pathogenic moulds, yeast and their products may also exist in the air of animal units, causing further risk for personnel working there. In particular, (1,3)-β-d-glucans are non-allergenic and hardly soluble in water glucose polymers, which consist of a part of the cellular wall of most fungi, but also many plants and some bacteria. Due to their presence in both viable and dead cells, they may be considered a good indicator of exposure to fungi [35]. Although little information is available on their health effects in animal facilities, however, their association with dry cough, cough associated with phlegm, hoarseness, and atopy, has been reported in different studies [36,37,38]. Very few and not recent investigations dealing with airborne biological agents in laboratory animal settings, other than allergens, can be found [12,13,14,15,39] to date. These issues have received little attention in our country. The objective of this study was to determine factors (working tasks, cage changing frequency and animal strains) were associated with the greatest level of exposure to biological agents of the personnel working with rodents through the measure and characterization of airborne viable fungi, bacteria, endotoxin, (1,3)-β-d-glucan and animal allergens.

2. Materials and Methods

2.1. Animal Facility

The study was conducted in a Biomedical Research Institute where animals are maintained in agreement with Italian Legislative decree 26/2014 [40]. The facility includes 14 conventional animal rooms (3 housing rats and 11 housing mice) where animals are housed in stainless steel wire cages (on average 2–3 animals/cage) with perforated floor and trays underneath; filters on the top prevent the distribution of airborne particles. Each cage is stacked in a rack that can hold up to 30 cages for mice and 24 for rats. The facility houses about 7000 rodents.
The racks are washed every 4 months. The cages and their equipment (grids containing bottles of water and feed, the bottles and soiled bedding) are changed once or twice per week depending on experimental protocols. When cages are changed, a clean rack is brought into the room, animals and accessories are moved to new cages and dirty cages are moved to the cage-washing area where they are emptied and washed (dirty washing area). Subsequently, the cages are allowed to dry and restacked for future use (clean washing area). There is also a storage area where preparation of the bedding and distribution of feed are carried out; these activities are performed only in the afternoon. The staff is divided into laboratory technicians and researchers; laboratory technicians perform shifts of 8 h and 30 min, and are engaged in changing cages, bedding and feeding animals, cleaning rooms, washing cages; researchers are engaged in several experimental procedures such as collecting blood and urine specimens, surgery and sacrifice. Personal protective equipment is required for all personnel working in the facility and includes surgical cap, mask, gloves, shoe cover, and disposable coat.
Animal rooms and the storage area have a ventilation system separate from the rest of the facility. The outside air is collected and treated by an Air Handling Unit (AHU) located on the coverage plan. Another AHU treats the air entering the two washing areas. In each work environment the air enters through vents located on the ceiling (two in each room), while the exhaust air is removed through grilles located on the walls near the floor (four in each rooms) or on the ceiling in the dirty and clean washing areas. In animal rooms 15–20 air changes per hour are guaranteed; the values of temperature and relative humidity are maintained in a controlled range (T: 20 °C ± 1 °C; RH: 45–55%).

2.2. Sampling and Analysis of Airborne Bacteria and Fungi

Triplicate air samples were collected using a portable microbiological sampler (SAS Super ISO, PBI International, Milan, Italy) at a flow rate of 100 L min−1, from 10 workplaces: 7 animal rooms randomly selected (3 housing rats and 4 housing mice) (see Table 1), 2 washing areas (dirty and clean), and the storage area. Two offices were investigated: the technician’s and manager’s offices. All measurements were taken in the middle. In order to evaluate the influence of changing cages on environmental contamination, in animal rooms air samples were taken over three consecutive days: the day of changing cages, the one before, and the one after. Regarding the storage area, air sampling was carried out in the morning (without activity) and in the afternoon.
Air volumes of 300 L were sampled. Total cultivable and Gram-negative bacteria were impacted on Tryptone Soy Agar (TSA) and Mac Conkey 3 (McC3) plates, respectively, fungi on Malt Extract Agar (MEA) and Dichloran Glycerol Agar (DG18) (all from Oxoid S.p.A, Milan, Italy). TSA and McC3 plates were subsequently incubated for 1–2 days at 37 °C (mesophilic bacteria), DG18 and MEA at 25 °C for 7–10 days.
The bacterial isolates were identified with microscopic and biochemical methods by API 20E and NE tests (bioMerieux, Marcy l’Etoile, France) and Microstation ID instrument (Biolog Inc., Hayward, CA, USA). Identification of moulds and yeasts were accomplished via macroscopic and microscopic examination, referring to the manual Medically Important Fungi: A guide to Identification [41], while biochemical identifications were performed using the Microstation ID instrument. Data are expressed as CFU/m3. The limit of detection (LOD) was 2 CFU/m3. The uncertainty assessment results are presented in Table 2.

2.3. Inhalable Dust Sampling and Analysis of Endotoxin, (1,3)-β-d-glucan and Allergens

Stationary inhalable dust samples were collected using airChek2000 pumps (SKC Inc., Eighty Four, PA, USA), at a sampling flow rate of 2 L·min−1, equipped with stainless IOM sampler and glass (GF, pore size 1.6 µm) and polycarbonate (PC, pore size 0.8 µm) for respectively endotoxin and (1,3)-β-d-glucan analysis.
Closed-face cassette with support pad and mixed cellulose ester (MCE, diameter 33 mm, 0.8 µm porosity), at a flow rate of 2.5 L·min−1, were used for allergen sampling. Samplers were placed in the middle of the room at 1.5 m above the floor to simulate human breathing zone. A field blank was deployed on each sampling. The sampling strategy was the same as environmental monitoring (three consecutive days in animal rooms, in the morning and in the afternoon inside the storage area). The sampling time was 3 h.
GF extracts (5 mL of 0,05% Tween 20 in Pyrogen Free Water) were centrifuged at 1000× g rpm for 20 min. and analysed in duplicate with Kinetic LAL method (QCL-LAL assay Lonza Walkersville, MD USA). Concentrations are reported in EU/m3. The LOD was 0.005 EU/mL.
For (1,3)-β-d-glucan, PC extracts (5 mL of 0.85% NaCl and 0.05% tween 80) were vigorously shaken for 30′ at room temperature (250 rpm) and analyzed with the (1,3)-β-d-glucan specific Kinetic Chromogenic LAL assay (Glucatell, Associates of Cape Cod), as previously described [42,43]. (1,3)-β-d-glucan concentrations are presented in ng/m3. The LOD in suspension was 2.53 pg/mL.
MCE filters were extracted by submerging in 1 mL phosphate saline buffer (PBS plus 0.01% Tween 20) in a 15 mL centrifuge tube, vortexed at room temperature and shaken for 2 h. The eluate was collected by compressing the filter in a plastic syringe, 1% of human serum albumin was added for protein stabilization and stored at −20 °C until assay. ELISA kits for Mus m 1, Rat n 1, Can f 1, Fel d 1, Equ c 4 were performed following the protocols of analysis (Indoor Biotechnologies Ltd., Manchester, UK.) with read of the plates at 405 nm optical density. Results are expressed as ng/m3. The uncertainty assessment results are reported in Table 2.
(*) Type A standard uncertainty with a confidence level 1-α > 0.95 using the Student’s T to find the appropriate coverage factor based on degrees of freedom. (**) Measures are detected in the morning (without activity) and in the afternoon (during activity).

2.4. Statistical Analysis

One way ANOVA and Students’t-test were considered to evaluate significant differences in environmental biocontaminant concentrations in various work tasks and areas. Univariate and multivariate, both fixed and mixed effect linear regression models were used, in which the concentration of the different biological agents acts as outcome variable.
Data were analyzed using the statistical software R (R Foundation for Statistical Computing, Vienna, Austria—ISBN 3-900051-07-0, URL http://www.R-project.org).

3. Results

Table 1 shows strains and number of animals (divided into males, females and pups) housed in investigated rooms (A–G) and the frequency of changing cages. Concentrations (mean value and standard deviation) of mesophilic bacteria, fungi, endotoxin, (1,3)-β-d-glucan, Rat n 1 and Mus m 1 detected in each working areas are reported in Table 3. Regarding animal rooms, data are also presented by sampling room and the number of rodents is indicated.

3.1. Airborne Bacteria and Fungi

A total of 306 air samples were analysed. Mean mesophilic bacteria levels ranged from 33.8 to 480 CFU/m3 with a peak value of 885 CFU/m3 found in an animal room during the changing cages. Gram-negative concentrations were below the LOD (2 CFU/m3) except for animal rooms, during the changing cages, and for the storage area where a mean value of 3 CFU/m3 was recorded. Among a total of 18 genera and species, the most frequently isolated were Staphylococcus warneri (23.9%), Staphylococcus xylosus (21.4%) Micrococcus spp. (14.5%), Acinetobacter schindleri (10.4%).
Colonies of Escherichia coli, Enterobacter cloacae and Enterococcus faecalis (risk group 2, according to Annex XLVI of the Italian Legislative Decrees [44,45], were isolated in four animal rooms during the changing cages.
Mean concentrations of moulds and yeasts were low (flora was dominated by moulds such as Alternaria, Ulocladium, Cladosporium, Penicillium, Eurotium, Aspergillus, Scopulariopsis, Phoma, with occasional isolates of yeasts. No pathogen was identified.

3.2. Endotoxin, (1,3)-β-d-glucan and Allergens

The mean concentrations of endotoxin, (1,3)-β-d-glucan and allergens (See Table 3) were obtained on 89 samples taken in different occupational environments. Statistically significant differences were found between offices and animal rooms, these last having a higher concentration of endotoxin (p = 0.00616) and between the animal rooms and the storage area in the concentration of (1,3)-β-d-glucan (p = 0.038).
The evaluation of allergens was performed on 181 air samples for ELISA tests. Mus m 1 allergens were detected in all working areas except for offices, with the highest value (61.5 ng/m3) in the dirty washing area while Rat n 1 allergens were absent except for in animal rooms. Can f 1 and Equ c 4 allergens were absent while Fel d 1 allergen was detected in rat rooms with the highest levels during the changing cages activity (range 0.4–3 ng/m3).

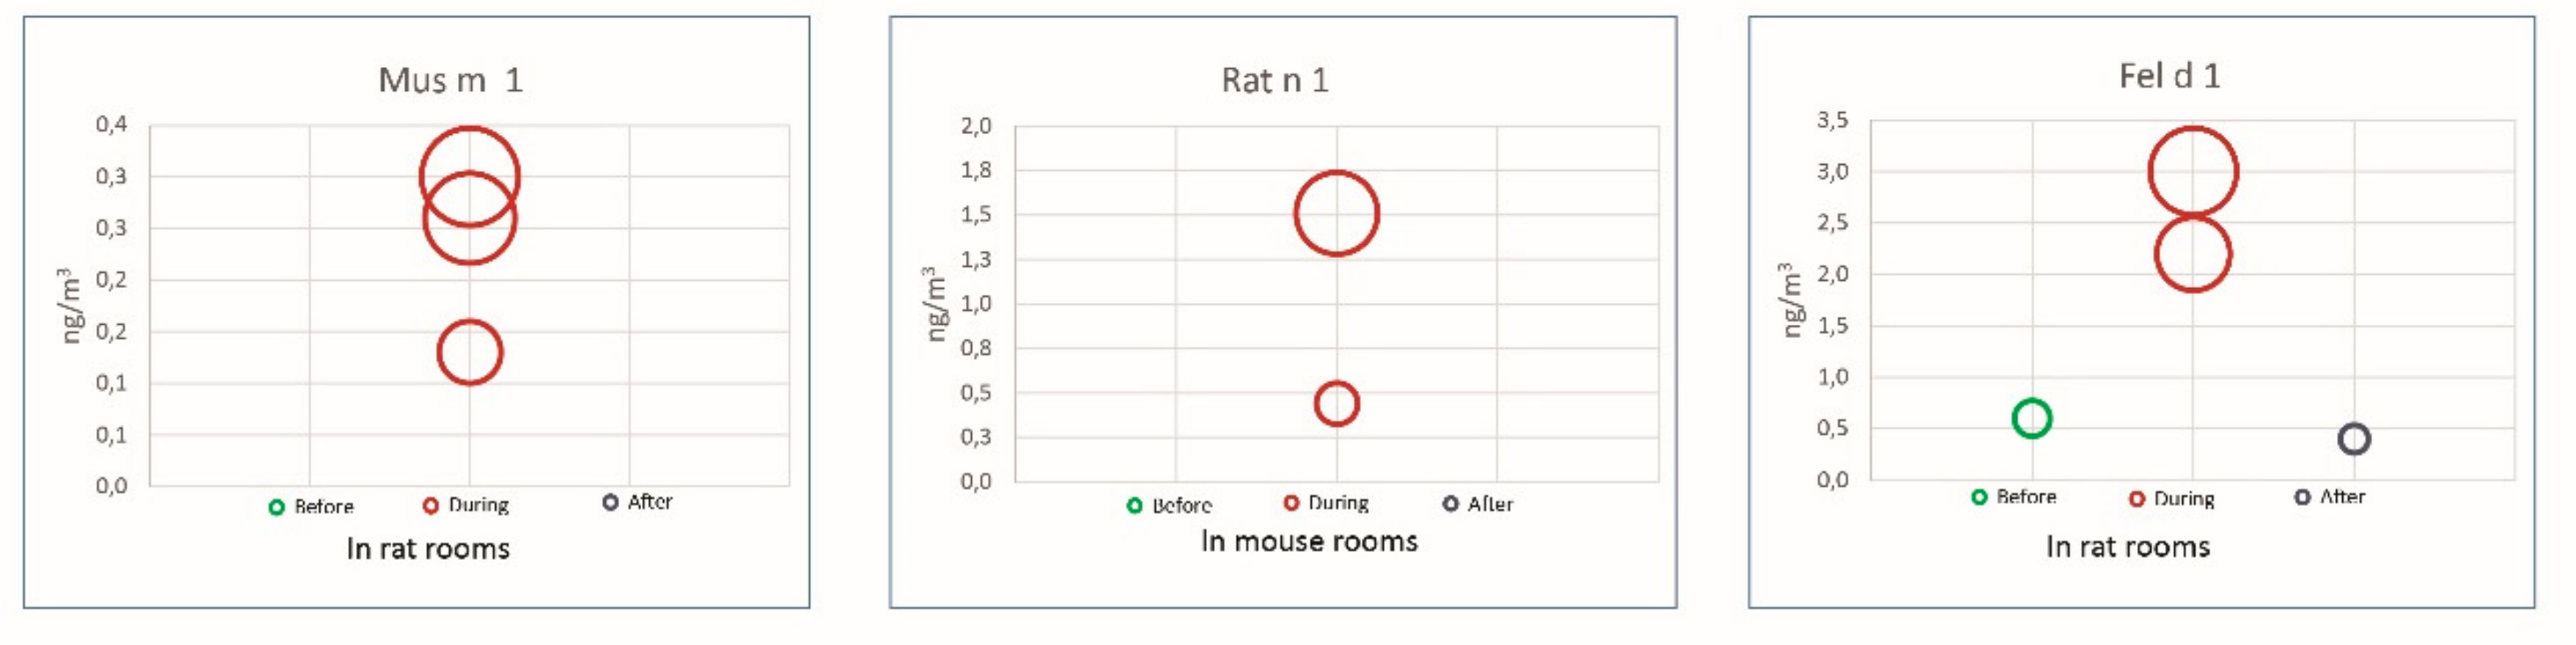
3.3. Effect of the Working Activities

One of our main questions was whether or not specific working tasks may cause an increased risk of biological exposure for personnel working in animal facilities. The hypothesis that the airborne concentration of biocontaminants could increase during the changing cages was tested. To point out the increase in level of (1,3)-β-d-glucan the time was considered a two-level factor: sampling during the changing cages was compared to the sampling before and after. The β-glucans concentration “during” increases on average by a factor of 1.3 with respect to the concentration “before” and “after” and the difference is statistically significant (p = 0.04). For endotoxins, a mixed effect linear regression model was used in which animal room was introduced as a random effect variable. The concentrations increased on average by a factor of 1.8 with respect to the levels before or after (p = 0.04). The highest mean concentrations of endotoxin (210.7 EU/m3) and (1,3)-β-d-glucan (4.3 ng/m3) were measured in the afternoon during the preparation of bedding and distribution of feed (storage area) (See Table 4).
The allergenic concentration was treated as a continuous variable. As in the case of endotoxin, to increase the statistics, the time was considered a two-level factor and a mixed effect linear regression model was used with the animal room treated as a random effect variable. The concentration level of the mouse allergenic contaminant increases on average by a factor of 9.3 with respect to the levels before or after the changing cages (p = 0.037).

3.4. Effect of Animal Strains and Changing Cages Frequency

In order to determine the effect of the animal strains on environmental biocontamination, the concentration measured in animal rooms was normalized according to the number of animals. This normalized quantity was related to the strain treated as a two level factor. In the case of the mesophilic bacteria and endotoxin, the average level was lowered in the case of mice with respect to the case of rats by a factor of −0.5070 (p = 0.020) and by a factor of −0.032 (p = 1.5·10-8) respectively. The result was not statistically significant for Gram-negative bacteria, fungi and (1,3)-β-d-glucan.
To test if animal species have an effect on the allergenic pollutants concentration, a Pearson’s Chi-squared with Yates’ continuity correction test was applied. The test was statistically significant in the case of the Mus m 1 and Fel d 1 (p = 0.004 and p = 0.045 respectively). The positive result of the Mus m 1 is statistically associated with the mouse species whilst the Fel d 1 is statistically associated with the rat.
In regards to the cage changing frequency, the concentrations normalized to the number of animals have been compared with once per week and twice per week cage changing frequency, treated as a two-level factor. A statistically significant difference has been found only in the case of mesophilic bacteria concentration. The twice per week frequency has on average a bacteria concentration reduced by a factor of 0.13 with respect to the level of rooms with a once per week frequency (p = 0.019).

4. Discussion

To the best of our knowledge, this is the first Italian study which assesses the exposure to biological agents in a conventional animal facility, taking into account the biocontamination of different occupational areas in conjunction with the effect of specific working tasks, cage changing frequency and animal strains on it.
The most frequent genera identified in this study are common skin inhabitants and are thus easily shed into the environment on desquamated epithelial skin cells. Some bacterial species have been reported to cause a variety of diseases, ranging from pneumonia (Acinetobacter) to intestinal infections (E. coli) (https://www.cdc.gov). Other microorganisms, such as Enterobacter and Pseudomonas, exhibit a high degree of biological activity, are producers of endotoxin, and often show strong allergenic properties that increase the risk of disease in workers [46,47]. However, colonies of bacterial species belonging to risk group 2, according to the Italian Legislative Decrees 81/2008 and 106/2009 [44,45], have been isolated in some animal rooms during the changing cages. With regard to endotoxin, no regulatory value is currently available, but various recommendations are available. Among them, Dutch Expert Committee on Occupational Standards recommends an occupational exposure limit of 90 EU/m3 [48]. Endotoxin concentrations measured in this study were below this standard in all settings except for the storage area during activities where a mean value of 210.6 EU/m3 was observed. Our data confirm what was reported by Kaliste et al., 2002 [33], that bedding material could be a significant source of accumulation and release of bacterial endotoxins. This evidence was demonstrated also by Whiteside et al., 2010 [49] who measured a range of endotoxins between 3121 and 5401 EU/g in hardwood rodent bedding.
Endotoxin concentrations measured in this study are higher than those reported by Hwang et al., 2016 [50], who found a mean value of 0.14 EU/m3 (range = 0.03–0.60 EU/m3) in an animal laboratory housing mice, where the main tasks were feeding/weighing with air exchange rates comparable to ours, and then those reported by Pacheco et al., 2006 [13] who measured a mean endotoxin concentration of 315 pg/m3 (about 3.15 EU/m3) with a peak value of 678 pg/m3 (corresponding about 6.78 EU/m3) during the changing cages in a mouse facility.
Our data are also slightly higher than those reported by Ooms et al., 2008 [39] (mean value = 4.7 EU/m3; range = 3.4–6.3 EU/m3) in rabbit rooms; this difference may be attributed to higher mechanical air-change rates (30.3 air changes/h) in the animal housing space. Finally, results of the present study are quite lower than those shown by Lieutier-Colas et al., 2001 [15], who found the highest concentration (15.4 ng/m3 = 154.7 EU/m3) associated with cage cleaning and feeding in animal rooms housing rats.
The detection of endotoxin in the technician’s office (mean value = 2.3 EU/m3) suggests that these components may be carried on clothes and shoes or on airborne particles like allergens.
The highest levels of (1,3)-β-d-glucan were found in the storage area, indicating that activities performed in this environment were also associated with an increased exposure to fungi, some of which belong to strongly allergenic and mycotoxin producers genera (Alternaria spp., Penicillium spp.).
Regarding animal allergens, no occupational environmental limits are available, partly due to the lack of standardized measurement methods and partly because of complex exposure-response relationships and the influence of genetic susceptibility; it is important to keep the allergen exposure as low as possible.
We found the highest concentration for Mus m 1 in the dirty washing area (mean value = 61.5 ng/m3) and its concentrations increased significantly during the changing cages on average by a factor of 9.3 with respect to the levels before or after (p = 0.037). Straumfors et al., [16] in a recent paper report that cage emptying and cage washing in the cage washroom represented the highest exposure with a median value of 3.0 ng/m3 for Mus m 1. The lower concentration found by these authors could be explained by the use of individually ventilated cages in respect to cage-rack systems and by the different sampling methodologies (stationary versus personal monitoring).
Our data regarding the highest values of Mus m 1 in respect to Rat n 1 in animal facilities are in agreement with the ones reported in literature (range: 17–564 ng/m3 for Mus m 1; 0.43–27.36 ng/m3 for Rat n 1) [1,15,51].
For cat allergens (Fel d 1), limit values between 2 and 8 μg/g Fel d 1 for sensitization and above 8 μg/g for the development of acute asthma attacks, respectively, have been proposed [52]. In this work we measured concentrations at risk of sensitization (>2 μg/g) in two rat rooms.
The detection of cat allergens (Fel d 1) in animal rooms is unexpected, along with the presence of rat and mouse allergens (Figure 1), showing a cross-contamination likely due to the passive transport by operators themselves; this highlights their role as vehicle between occupational areas and living environments [53,54,55,56].

5. Conclusions

The environmental monitoring of airborne biocontaminants has been confirmed as a valid tool to identify the working tasks more critical in terms of exposure to biological agents in animal facilities.
Statistical analysis proves that the changing of cages is a determinant factor in increasing the concentration of all the airborne biocontaminants and in releasing biological agents that could risk the health of workers. It can also be pointed out that the concentrations of the biocontaminants increase significantly during this task with respect to the other days, but return to the background levels indicating the effectiveness of the ventilation system. Our data also identify the preparation of bedding and distribution of feed performed in the storage area as critical working tasks in terms of exposure to endotoxins, fungi and (1,3)-β-d-glucans.
The frequency of the changing of cages does not seem to affect the microbiological contamination; a statistical difference has been found only in the case of mesophilic bacteria levels. In regard to the animal strains, rats seem to influence only mesophilic bacteria and endotoxin levels.
Our data can be particularly useful for increasing knowledge about the biological risk in this occupational sector and to support all actors of prevention, employers, health and safety representatives and workers in all phases of risk management.
Simple preventive measures must be adopted to control the biological risk in this occupational setting.

Author Contributions

Environmental monitoring and laboratory procedures, A.M.M. and A.C.; Laboratory procedures, S.D.R.; Data set built, P.M.; Logistics support A.W. and M.C.R.; Statistical analysis, writing-review and editing, S.M. and R.S.; Conceived and designed the research topic, writing original draft, revising, editing and supervision, M.C.D. and E.P.

Funding

This research received no external funding.

Acknowledgments

The authors are grateful to the workers who collaborated in our experimental phases of the study.

Conflicts of Interest

The authors declare no conflict of interest.

References

  1. Zahradnik, E.; Raulf, M. Respiratory allergens from furred mammals: Environmental and occupational exposure. Vet. Sci. 2017, 4, 38. [Google Scholar] [CrossRef] [PubMed]
  2. Zahradnik, E.; Raulf, M. Animal allergens and their presence in the environment. Front. Immunol. 2014, 3, 76. [Google Scholar] [CrossRef] [PubMed]
  3. Liccardi, G.; Calzetta, L.; Baldi, G.; Berra, A.; Billeri, L.; Caminati, M.; Capano, P.; Carpentieri, E.; Ciccarelli, A.; Crivellaro, M.A.; et al. Italian Allergic Respiratory Diseases Task ForceAllergic sensitization to common pets (cats/dogs) according to different possible modalities of exposure: An Italian Multicenter Study. Clin. Mol. Allergy 2018, 16, 3. [Google Scholar] [CrossRef]
  4. Liccardi, G.; Salzillo, A.; Piccolo, A.; Calzetta, L.; Rogliani, P. Dysfunction of small airways and prevalence, airway responsiveness and inflammation in asthma: Much more than small particle size of pet animal allergens. Ups. J. Med. Sci. 2016, 121, 196–197. [Google Scholar] [CrossRef] [PubMed]
  5. Patelis, A.; Dosanjh, A.; Gunnbjörnsdottir, M.; Borres, M.P.; Högman, M.; Alving, K.; Janson, C.; Malinovschi, A. New data analysis in a population study raises the hypothesis that particle size contributes to the pro-asthmatic potential of small pet animal allergens. Ups. J. Med. Sci. 2016, 121, 25–32. [Google Scholar] [CrossRef]
  6. Stave, G.M. Occupational animal allergy. Curr. Allergy Asthma Rep. 2018, 18, 11. [Google Scholar] [CrossRef] [PubMed]
  7. Mason, H.J.; Willerton, L. Airborne exposure to laboratory animal allergens. AIMS Allergy Immunol. 2017, 1, 78–88. [Google Scholar] [CrossRef]
  8. Simoneti, C.S.; Ferraz, E.; Menezes, M.B.; Bagatin, E.; Arruda, L.K.; Vianna, E.O. Allergic sensitization to laboratory animals is more associated with asthma, rhinitis, and skin symptoms than sensitization to common allergens. Clin. Exp. Allergy 2017, 47, 1436–1444. [Google Scholar] [CrossRef]
  9. Bush, R.K.; Stave, G.M. Laboratory animal allergy: An update. ILAR J. 2003, 44, 28–51. [Google Scholar] [CrossRef]
  10. Lai, P.S.; Allen, J.G.; Hutchinson, D.S.; Ajami, N.J.; Petrosino, J.F.; Winters, T.; Hug, C.; Wartenberg, G.R.; Vallarino, J.; Christiani, D.C. Impact of environmental microbiota on human microbiota of workers in academic mouse research facilities: An observational study. PLoS ONE 2017, 12, e0180969. [Google Scholar] [CrossRef] [PubMed]
  11. Oppliger, A.; Barresi, F.; Maggi, M.; Schmid-Grendelmeier, P.; Huaux, F.; Hotz, P.; Dressel, H. Association of endotoxin and allergens with respiratory and skin symptoms: A descriptive study in laboratory animal workers. Ann. Work. Expo. Health 2017, 61, 822–835. [Google Scholar] [CrossRef] [PubMed]
  12. Samadi, S.; Heederik, D.J.; Krop, E.J.; Jamshidifard, A.R.; Willemse, T.; Wouters, I.M. Allergen and endotoxin exposure in a companion animal hospital. Occup. Environ. Med. 2010, 67, 486–492. [Google Scholar] [CrossRef] [PubMed]
  13. Pacheco, K.A.; McCammon, C.; Thorne, P.S.; O’Neill, M.E.; Liu, A.H.; Martyny, J.W.; Vandyke, M.; Newman, L.S.; Rose, C.S. Characterization of endotoxin and mouse allergen exposure in mouse facilities and research laboratories. Am. Occup. Hyg. 2006, 50, 563–572. [Google Scholar]
  14. Platts-Mills, J.; Custis, N.; Kenney, A.; Tsay, A.; Chapman, M.; Feldman, S.; Platts-Mills, T. The effects of cage design on airborne allergens and endotoxin in animal rooms: High-volume measurements with an ion-charging device. Contemp. Top. Lab. Anim. Sci. 2005, 44, 12–16. [Google Scholar] [PubMed]
  15. Lieutier-Colas, F.; Meyer, P.; Larsson, P.; Malmberg, P.; Frossard, N.; Pauli, G.; de Blay, F. Difference in exposure to airborne major rat allergen (Rat n 1) and to endotoxin in rat quartes according to tasks. Clin. Exp. Allergy 2001, 31, 1449–1456. [Google Scholar] [CrossRef] [PubMed]
  16. Straumfors, A.; Eduard, W.; Andresen, K.; Sjaastad, A.K. Predictors for increased and reduced rat and mouse allergen exposure in laboratory animal facilities. Ann. Work Expo. Health 2018, 62, 953–965. [Google Scholar] [CrossRef]
  17. Feary, J.; Cullinan, P. Laboratory animal allergy: A new world. Curr. Opin. Allergy Clin. Immunol. 2016, 16, 107–112. [Google Scholar] [CrossRef]
  18. Simoneti, C.S.; Freitas, A.S.; Barbosa, M.C.; Ferraz, E.; de Menezes, M.B.; Bagatin, E.; Arruda, L.K.; Vianna, E.O. Study of risk factors for atopic sensitization, asthma, and bronchial hyperresponsiveness in animal laboratory workers. J. Occup. Health 2016, 58, 7–15. [Google Scholar] [CrossRef]
  19. Kampitak, T.; Betschel, S.D. Anaphylaxis in laboratory workers because of rodent handling: Two case reports. J. Occup. Health 2016, 58, 381–383. [Google Scholar] [CrossRef]
  20. National Institute for Occupational Safety and Health (NIOSH). Preventing Asthma in Animal Handlers; NIOSH: Washington, DC, USA, 1998; pp. 97–116.
  21. Gordon, S. Laboratory animal allergy: A British perspective on a global problem. ILAR J. 2001, 42, 37–46. [Google Scholar] [CrossRef]
  22. Corradi, M.; Ferdenzi, E.; Mutti, A. The characteristics, treatment and prevention of laboratory animal allergy. Lab. Anim. 2012, 42, 26–33. [Google Scholar] [CrossRef] [PubMed]
  23. D’Ovidio, M.C.; Martini, A.; Melis, P.; Signorini, S. Value of the microarray for the study of laboratory animal allergy (LAA). G. Ital. Med. Lav. Ergon. 2011, 33, 109–116. [Google Scholar] [PubMed]
  24. Folletti, I.; Forcina, A.; Marabini, A.; Bussetti, A.; Siracusa, A. Have the prevalence and incidence of occupational asthma and rhinitis because of laboratory animals declined in the last 25 years? Allergy 2008, 63, 834–841. [Google Scholar] [CrossRef]
  25. D’Ovidio, M.C.; Wirz, A.; Zennaro, D.; Masssari, S.; Melis, P.; Peri, V.M.; Rafaiani, C.; Riviello, M.C.; Mari, A. Biological occupational allergy: Protein microarray for the study of laboratory animal allergy (LAA). AIMS Public Health 2018, 5, 352–365. [Google Scholar] [CrossRef] [PubMed]
  26. Larese Filon, F.; Drusian, A.; Mauro, M.; Negro, C. Laboratory animal allergy reduction from 2001 to 2016: An intervention study. Respir. Med. 2018, 136, 71–76. [Google Scholar] [CrossRef] [PubMed] [Green Version]
  27. Tafuro, F.; Selis, L.; Goldoni, M.; Stendardo, M.; Mozzoni, P.; Ridolo, E.; Boschetto, P.; Corradi, M. Biomarkers of respiratory allergy in laboratory animal care workers: An observational study. Int. Arch. Occup. Environ. Health 2018, 91, 735–744. [Google Scholar] [CrossRef]
  28. Bhabha, F.K.; Nixon, R. Occupational exposure to laboratory animals causing a severe exacerbation of atopic eczema. Austr. J. Dermatol. 2012, 53, 155–156. [Google Scholar] [CrossRef] [PubMed]
  29. Jones, M. Laboratory animal allergy in the modern era. Curr. Allergy Asthma Rep. 2015, 15, 73. [Google Scholar] [CrossRef]
  30. Muzembo, B.A.; Eitoku, M.; Inaoka, Y.; Oogiku, M.; Kawakubo, M.; Tai, R.; Takechi, M.; Hirabayashi, K.; Yoshida, N.; Ngatu, N.R.; et al. Prevalence of occupational allergy in medical researchers exposed to laboratory animals. Ind. Health 2014, 52, 256–261. [Google Scholar] [CrossRef]
  31. Acton, D.; McCauley, L. Laboratory animal allergy: An occupational hazard. AAOHN J. 2007, 55, 241–244. [Google Scholar] [CrossRef]
  32. Elliott, L.; Heederik, D.; Marshall, S.; Peden, D.; Loomis, D. Incidence of allergy and allergy symptoms among workers exposed to laboratory animals. Occup. Environ. Med. 2005, 62, 766–771. [Google Scholar] [CrossRef] [PubMed] [Green Version]
  33. Kaliste, E.; Linnainmaa, M.; Meklin, T.; Nevalainen, A. Airborne contaminants in conventional laboratory rabbit rooms. Lab. Anim. 2002, 36, 43–50. [Google Scholar] [CrossRef] [Green Version]
  34. Freitas, A.S.; Simoneti, C.S.; Ferraz, E.; Bagatin, E.; Brandão, I.T.; Silva, C.L.; Borges, M.C.; Vianna, EO. Exposure to high endotoxin concentration increases wheezing prevalence among laboratory animal workers: A cross-sectional study. BMC Pulm. Med. 2016, 16, 69. [Google Scholar] [CrossRef] [PubMed]
  35. Douwes, J. (1-->3)-Beta-D-glucans and respiratory health: A review of the scientific evidence. Indoor Air 2005, 15, 160–169. [Google Scholar] [CrossRef] [PubMed]
  36. Paba, E.; Chiominto, A.; Marcelloni, A.M.; Proietto, A.; Sisto, R. Exposure to airborne culturable microorganisms and endotoxin in two Italian poultry slaughterhouses. J. Occup. Environ. Hyg. 2014, 11, 469–478. [Google Scholar] [CrossRef]
  37. Rylander, R.; Lin, R.H. (1-->3)-beta-D-glucan-relationship to indoor air-related symptoms, allergy and asthma. Toxicology 2000, 152, 47–52. [Google Scholar] [CrossRef]
  38. Rylander, R.; Norhall, M.; Engdahl, U.; Tunsater, A.; Holt, P.G. Airways inflammation, atopy, and (1-->3)-beta-D-glucan exposure in two schools. Am. J. Respir. Crit. Care Med. 1998, 158, 1685–1687. [Google Scholar] [CrossRef]
  39. Ooms, T.G.; Artwohl, J.E.; Conroy, L.M.; Schoonover, T.D.; Fortman, J.D. Concentration and emission of airborne contaminants in a laboratory animal facility housing rabbits. J. Am. Assoc. Lab. Anim. Sci. 2008, 47, 39–48. [Google Scholar] [PubMed]
  40. Implementation of the Directive 2010/63/EU on the protection of animals used for scientific purposes, Italian Legislative Decree 4 march 2014, n. 26. Off. J. 2014, 60.
  41. Larone, D.H. Medically Important Fungi: A guide to Identification, 3rd ed.; ASM: Washington, DC, USA, 1995. [Google Scholar]
  42. Lee, T.; Grinshpun, S.A.; Kim, K.Y.; Iossifova, Y.; Adhikari, A.; Reponen, T. Relationship between indoor and outdoor airborne fungal spores, pollen, and (1→3)-β-D-glucan in homes without visible mold growth. Aerobiologia 2006, 22, 227–236. [Google Scholar] [CrossRef]
  43. Iossifova, Y.Y.; Reponen, T.; Bernstein, D.I.; Levin, L.; Kalra, H.; Campo, P.; Villareal, M.; Lockey, J.; Hershey, G.K.; LeMasters, G. House dust (1-3)-beta-D-glucan and wheezing in infants. Allergy 2007, 62, 504–513. [Google Scholar] [CrossRef]
  44. Implementation of the article 1 of the law 3 august 2007, no. 123 concerning the protection of health and safety in the workplaces, Italian Legislative Decree no. 81/2008. Ordinary Suppl. No.108 Off. J. 2008, 101.
  45. Supplementary and corrective provisions of the legislative decree 9 April 2008, no. 81, concerning the protection of health and safety in the workplaces, Italian Legislative Decree no. 106/2009. Ordinary Suppl. No. 142 Off. J. 2009, 180.
  46. Duchaine, C.; Grimard, Y.; Cormier, Y. Influence of building maintenance, environmental factors, and seasons on airborne contaminants of swine. Am. Ind. Hyg. Assoc. J. 2000, 61, 56–63. [Google Scholar] [CrossRef]
  47. Mandryk, J.; Alwis, K.U.; Hocking, A.D. Effects of personal exposures on pulmonary function and work-related symptoms among sawmill workers. Ann. Occup. Hyg. 2000, 44, 281–289. [Google Scholar] [CrossRef]
  48. Health Council of the Netherlands. Endotoxins-Health-Based Recommended Occupational Exposure Limit; Publication no. 2010/04OSH. 010; Health Council of the Netherlands: The Hague, The Netherlands, 2010. [Google Scholar]
  49. Whiteside, T.E.; Thigpen, J.E.; Kissling, M.G.; Grant, M.G.; Forsythe, D.B. Endotoxin, coliform, and dust levels in various types of rodent bedding. J. Am. Assoc. Lab. Anim. Sci. 2010, 49, 184–189. [Google Scholar] [PubMed]
  50. Hwang, S.H.; Park, D.J.; Park, W.M.; Park, D.U.; Ahn, J.K.; Yoon, C.S. Seasonal variation in airborne endotoxin levels in indoor environments with different micro-environmental factors in Seoul, South Korea. Environ. Res. 2016, 145, 101–108. [Google Scholar] [CrossRef]
  51. Ohman, J.L.; Hagberg, K.; MacDonald, M.R.; Jones, R.R.; Paigen, B.J.; Kacergis, J.B. Distribution of airborne mouse allergen in a major mouse breeding facility. J. Allergy. Clin. Immunol. 1994, 94, 810–817. [Google Scholar]
  52. Liccardi, G.; Triggiani, M.; Piccolo, A.; Salzillo, A.; Parente, R.; Manzi, F.; Vatrella, A. Sensitization to common and uncommon pets or other furry animals: Which may be common mechanisms? Transl. Med. UniSa 2016, 14, 9–14. [Google Scholar]
  53. Liccardi, G.; Salzillo, A.; Piccolo, A.; D’Amato, M.; D’Amato, G. Can the levels of Can f 1 in indoor environments be evaluated without considering passive transport of allergen indoors? J. Allergy Clin. Immunol. 2013, 131, 1258–1259. [Google Scholar] [CrossRef]
  54. Krop, E.J.; Doekes, G.; Stone, M.J.; Alberse, R.C.; van der Zee, J.S. Spreading of occupational allergens: Laboratory animal allergens on hair-covering caps and in mattress dust of laboratory animal workers. Occup. Environ. Med. 2007, 64, 267–272. [Google Scholar] [CrossRef] [PubMed]
  55. Pereira, F.L.; Silva, D.A.; Sopelete, M.C.; Sung, S.S.; Taketomi, E.A. Mite and cat allergen exposure in Brazilian public transport vehicles. Ann. Allergy Asthma Immunol. 2004, 93, 179–184. [Google Scholar] [CrossRef]
  56. Ferrari, M.; Perfetti, L.; Moscato, G. A case of indirect exposure to cat at school. Monaldi Arch. Chest. Dis. 2003, 59, 169–170. [Google Scholar] [PubMed]
Figure 1. Aeroallergen levels over three consecutive days in mouse and rat rooms: before, during and after changing cages (Each circle represents the observed value and dimension/diameter indicates the concentration).
Applsci 09 02216 g001
Table 1. Animals housed in each investigated room during the study and frequency of changing cages.
RoomsStrainsTotal NumberMaleFemalePupsChanging Cages
ARats14963860Bi-weekly
BMice4943281660Weekly
CMice682311267104Weekly
DMice613225283105Bi-weekly
ERats155856010Weekly
FMice72331638027Bi-weekly
GRats3773785255Bi-weekly
Table 2. Uncertainty measurement (*) for sampled biological agents by working areas.
WorkplaceMesophilic Bacteria
(UFC/m3)
Fungi
(UFC/m3)
Endotoxin
(EU/m3)
(1,3)-β-d-glucan (ng/m3)Rat n 1
(ng/m3)
Mus m 1
(ng/m3)
Animal rooms±52.26±0.58±1.35±0.59±0.16±4.56
Washing area clean±21.18±16.91±9.25
Washing area dirty±434.69±66.18±6.54
Storage area (**)±44.77±94.89±163.54±4.57±0.00±8.32
(*) Type A standard uncertainty with a confidence level 1-α > 0.95 using the Student’s T to find the appropriate coverage factor based on degrees of freedom. (**) Measures are detected in the morning (without activity) and in the afternoon (during activity).
Table 3. Concentrations (mean value and standard deviation) of mesophilic bacteria, fungi, endotoxin, (1,3)-β-d-glucan, Rat n 1 and Mus m 1 by working areas (number of animals is indicated for each room).
WorkplaceMesophilic Bacteria
(UFC/m3)
Fungi
(UFC/m3)
Endotoxin
(EU/m3)
(1,3)-β-d-glucan
(ng/m3)
Rat n 1
(ng/m3)
Mus m 1
(ng/m3)
Animal rooms130.7 ± 207.51.6 ± 3.045.9 ± 3.61.5 ± 1.30.1 ± 0.44.3 ± 11.0
Room A (149)63.1 ± 92.72.1 ± 4.47.8 ± 0.71.8 ± 1.20.0 ± 0.00.0 ± 0.1
Room B (494)122.9 ± 110.22.0 ± 1.77.2 ± 4.23.6 ± 2.30.0 ± 0.06.1 ± 9.9
Room C (682)112.4 ± 115.71.1 ± 2.43.6 ± 3.50.9 ± 0.60.1 ± 0.32.7 ± 4.2
Room D (613)64.8 ± 83.51.3 ± 2.70.1 ± 0.01.9 ± 0.80.5 ± 0.90.3 ± 0.2
Room E (155)317.0 ± 427.03.3 ± 5.37.3 ± 3.20.1 ± 0.00.3 ± 0.50.1 ± 0.2
Room F (723)66.7 ± 75.80.4 ± 1.111.1 ± 4.81.3 ± 0.80.0 ± 0.020.6 ± 24.1
Room G (377)220.5 ± 232.51.7 ± 1.75.2 ± 2.60.9 ± 0.30.0 ± 0.00.1 ± 0.2
Washing area clean78.3 ± 2.419.3 ± 13.67.4 ± 1.81.3 ± 0.70.4 ± 0.0
Washing area dirty211.1 ± 175.0107.8 ± 63.116.7 ± 4.71.6 ± 0.961.5 ± 0.0
Storage area *266.7 ±36.1112.5 ± 76.4124.2 ± 102.83.9 ± 1.71.5 ± 0.8
Offices308.0 ± 91.260.0 ± 25.92.4 ± 0.81.4 ± 1.1
* Mean concentrations measured in the storage area refer to samplings performed the morning and in the afternoon.
Table 4. Concentrations (mean value and standard deviation) of inhalable endotoxin, (1,3)-β-d-glucan, Rat n 1 and Mus m 1 by working activities.
WorkplaceEndotoxin
(EU/m3)
(1,3)-β-d-glucan
(ng/m3)
Rat n 1
(ng/m3)
Mus m 1
(ng/m3)
Animal rooms
Before5.2 ± 3.70.8 ± 0.50.1 ± 0.1
During7.1 ± 3.82.4 ± 1.90.4 ± 0.610.5 ± 17.4
After5.4 ± 3.51.4 ± 0.62.2 ± 5.3
Storage area
Morning37.8 ± 37.33.5 ± 2.40.9 ± 0.0
Afternoon210.7 ± 20.04.3 ± 1.62.2 ± 0.0

