Article

Development of Hybrid Artificial Intelligence Approaches and a Support Vector Machine Algorithm for Predicting the Marshall Parameters of Stone Matrix Asphalt

1
University of Transport Technology, Hanoi 100000, Vietnam
2
Le Quy Don Technical University, Hanoi 100000 Vietnam
3
Institute of Research and Development, Duy Tan University, Da Nang 550000, Vietnam
4
Department of Civil and Environmental Engineering, Graduate School of Engineering, Hiroshima University, 1-4-1, Kagamiyama, Higashi-Hiroshima, Hiroshima 739-527, Japan
5
Faculty of Engineering, Vietnam National University of Agriculture, Gia Lam, Hanoi 100000, Vietnam
*
Authors to whom correspondence should be addressed.
Appl. Sci. 2019, 9(15), 3172; https://doi.org/10.3390/app9153172
Submission received: 18 June 2019 / Revised: 2 August 2019 / Accepted: 2 August 2019 / Published: 4 August 2019
(This article belongs to the Special Issue Soft Computing Techniques in Structural Engineering and Materials)

Abstract

:
The main objective of this study is to develop and compare hybrid Artificial Intelligence (AI) approaches, namely Adaptive Network-based Fuzzy Inference System (ANFIS) optimized by Genetic Algorithm (GAANFIS) and Particle Swarm Optimization (PSOANFIS) and Support Vector Machine (SVM) for predicting the Marshall Stability (MS) of Stone Matrix Asphalt (SMA) materials. Other important properties of the SMA, namely Marshall Flow (MF) and Marshall Quotient (MQ) were also predicted using the best model found. With that goal, the SMA samples were fabricated in a local laboratory and used to generate datasets for the modeling. The considered input parameters were coarse and fine aggregates, bitumen content and cellulose. The predicted targets were Marshall Parameters such as MS, MF and MQ. Models performance assessment was evaluated thanks to criteria such as Root Mean Squared Error (RMSE), Mean Absolute Error (MAE) and correlation coefficient (R). A Monte Carlo approach with 1000 simulations was used to deduce the statistical results to assess the performance of the three proposed AI models. The results showed that the SVM is the best predictor regarding the converged statistical criteria and probability density functions of RMSE, MAE and R. The results of this study represent a contribution towards the selection of a suitable AI approach to quickly and accurately determine the Marshall Parameters of SMA mixtures.

1. Introduction

Stone Matrix Asphalt (SMA), created in Germany during the 1960s [1], is a hot mixed asphalt which contains mainly a high binder content mortar and a coarse aggregate structure. The SMA maximizes stone-to-stone contact with an important concentration of coarse aggregate. The latter are held and bonded with a matrix of stabilizer and mineral filler in a thick asphalt layer [2]. The SMA has been widely used due to its many advantages such as high durability, high rut resistance, reduced noise pollution and resistance to reflective cracking [3,4]. Several well-known disadvantages of the SMA can also be pointed out, for instance, drainage of binder or higher initial production costs compared to conventional hot-mix asphalt mixtures [5,6]. However, many studies have demonstrated that despite the higher production cost, the durability of the SMA is better than that of conventional ones, thus selection becomes a cost-effectiveness analysis problem [7], making the need to carefully analyze the mechanical properties of the SMA highly required.
Marshall parameters such as Marshall Stability (MS), Marshall Flow (MF) and Marshall Quotient (MQ) are important mechanical properties of the SMA, which directly reflect the performance of such asphalt concretes [6]. Indeed, the MS is an important property of the SMA as it indicates the performance of pavement subjected to shoving and rutting under usage conditions [8]. A good SMA stability depends essentially on internal friction—the interlocking as well as frictional resistance of aggregates—and the cohesion—a kind of binding force of the binder. The MF is, on the contrary, considered as an opposite property of the MS. It measures the reversible behavior of the wear course of pavements under traffic conditions [9]. Last but not least, the MQ, defined as a ratio of the MS and MF, indicates the resistance of asphalt mixtures to permanent deformation. The three Marshall parameters are widely used for the evaluation of resistance to displacement, distortion, rutting as well as shearing stresses of SMA [10,11]. As the pavement is frequently subjected to traffic loads, it is very necessary to find an optimum manner to determine these parameters [7]. In general, these parameters are often determined by laboratory experiments or by traditional statistical approaches [7]. However, such procedures are complicated, cost and time consuming, and operator expertise is also required. Besides, various interesting parameters such as the specific gravity, air voids and voids in aggregates could be deduced directly by simple mathematical calculations if researchers can obtain these Marshall parameters by the help of another means.
Apart from traditional laboratory experiments or traditional statistical analysis [12], the estimation of Marshall parameters could be approximated by another manner which has been recently investigated over the last three decades: Artificial Intelligence (AI) approaches. Indeed, AI simulations have been widely applied in many fields of structural engineering [13,14,15], civil engineering materials [16,17,18,19,20] as well as in pavement engineering due to their simplicity and effectiveness. The applications of AI in this field cover a broad range, such as pavement crack detection and classification [21], condition rating of jointed concrete pavements [22], prediction of the International Roughness Index (IRI) [23], evaluation of pavement conditions to deduce performance prediction models [24]. Regarding the mechanical properties of asphalt concrete, Ozgan et al. [25,26] applied Fuzzy Logic (FL) along with Artificial Neural Networks (ANN) to predict the relationship between the MS with related physical properties. The authors reported a better prediction capability of the AI models compared with classical statistical methods. In another attempt, Tapkin et al. [27,28] affirmed the use of Neural Networks (NN) to predict Marshall Test results and introduced the relationships in a closed form solution. The k-Nearest Neighbor (k-NN) algorithm has also been applied to predict the Marshall Test results for asphalt mixtures, as reported in the work of Aksoy et al. [8]. Although diverse studies have been carried out to predict the SMA mechanical properties, only single methods have been employed. The possibility to use hybrid AI models or more robust technique is still questioned. More important, up to date, limited investigations clearly demonstrate the performance of AI models in predicting the Marshall parameters of the SMA mixtures in particular, or of other asphalt concretes in general.
Consequently, the main objective of this study is to develop and compare hybrid AI approaches namely Adaptive Network-based Fuzzy Inference System (ANFIS) optimized by Genetic Algorithm (GAANFIS) and Particle Swarm Optimization (PSOANFIS) and Support Vector Machine (SVM) for predicting the MS of the SMA materials. Other important properties of the SMA namely MF and MQ were also predicted using the best model found. These AI models have not been applied yet for the prediction of Marshall Parameters of the SMA mixtures. To this purpose, laboratory experiments were first performed to fabricate the SMA samples using coarse and fine aggregates, two types of bitumen as binder and cellulose as stabilizer. Various criteria, namely Root Mean Squared Error (RMSE), Mean Absolute Error (MAE) and correlation coefficient (R) were used for model performance assessment. A Monte Carlo approach with 1000 simulations was used to deduce the statistical results to assess the performance of the proposed AI models.

2. Experimental Program and Data Preparation

The SMA samples were carefully fabricated in our laboratory by an expert operator to ensure maximum precision of the experimental results. Detailed information about the compounds and fabrication process used, as well as the testing procedures, are presented in the following sections.

2.1. Material Properties

The SMA samples were fabricated with three main ingredients: crushed stone coarse and fine aggregates, bitumen and stabilizer. Crushed granite aggregates were collected from a local quarry at Phu Man (Ha Noi, Viet Nam). The physical properties of the fine and coarse aggregates are given in Table 1. The bulk specific density of the mineral filler is 2720 g/cm3. In this work, asphalt cements were selected as 60/70 penetration bitumen (denoted as Bitumen 60/70) and Polymer Modified Bitumen I (denoted as PMB I). They were provided by Vietnam National Petroleum Group (Petrolimex, Ha Noi, Viet Nam). Physical properties of the bitumen samples are shown in Table 2. Cellulose fiber was added to the SMA mixtures as a drain down inhibitor. It was a type of Chinese-grown fiber and the properties are provided in Table 3.

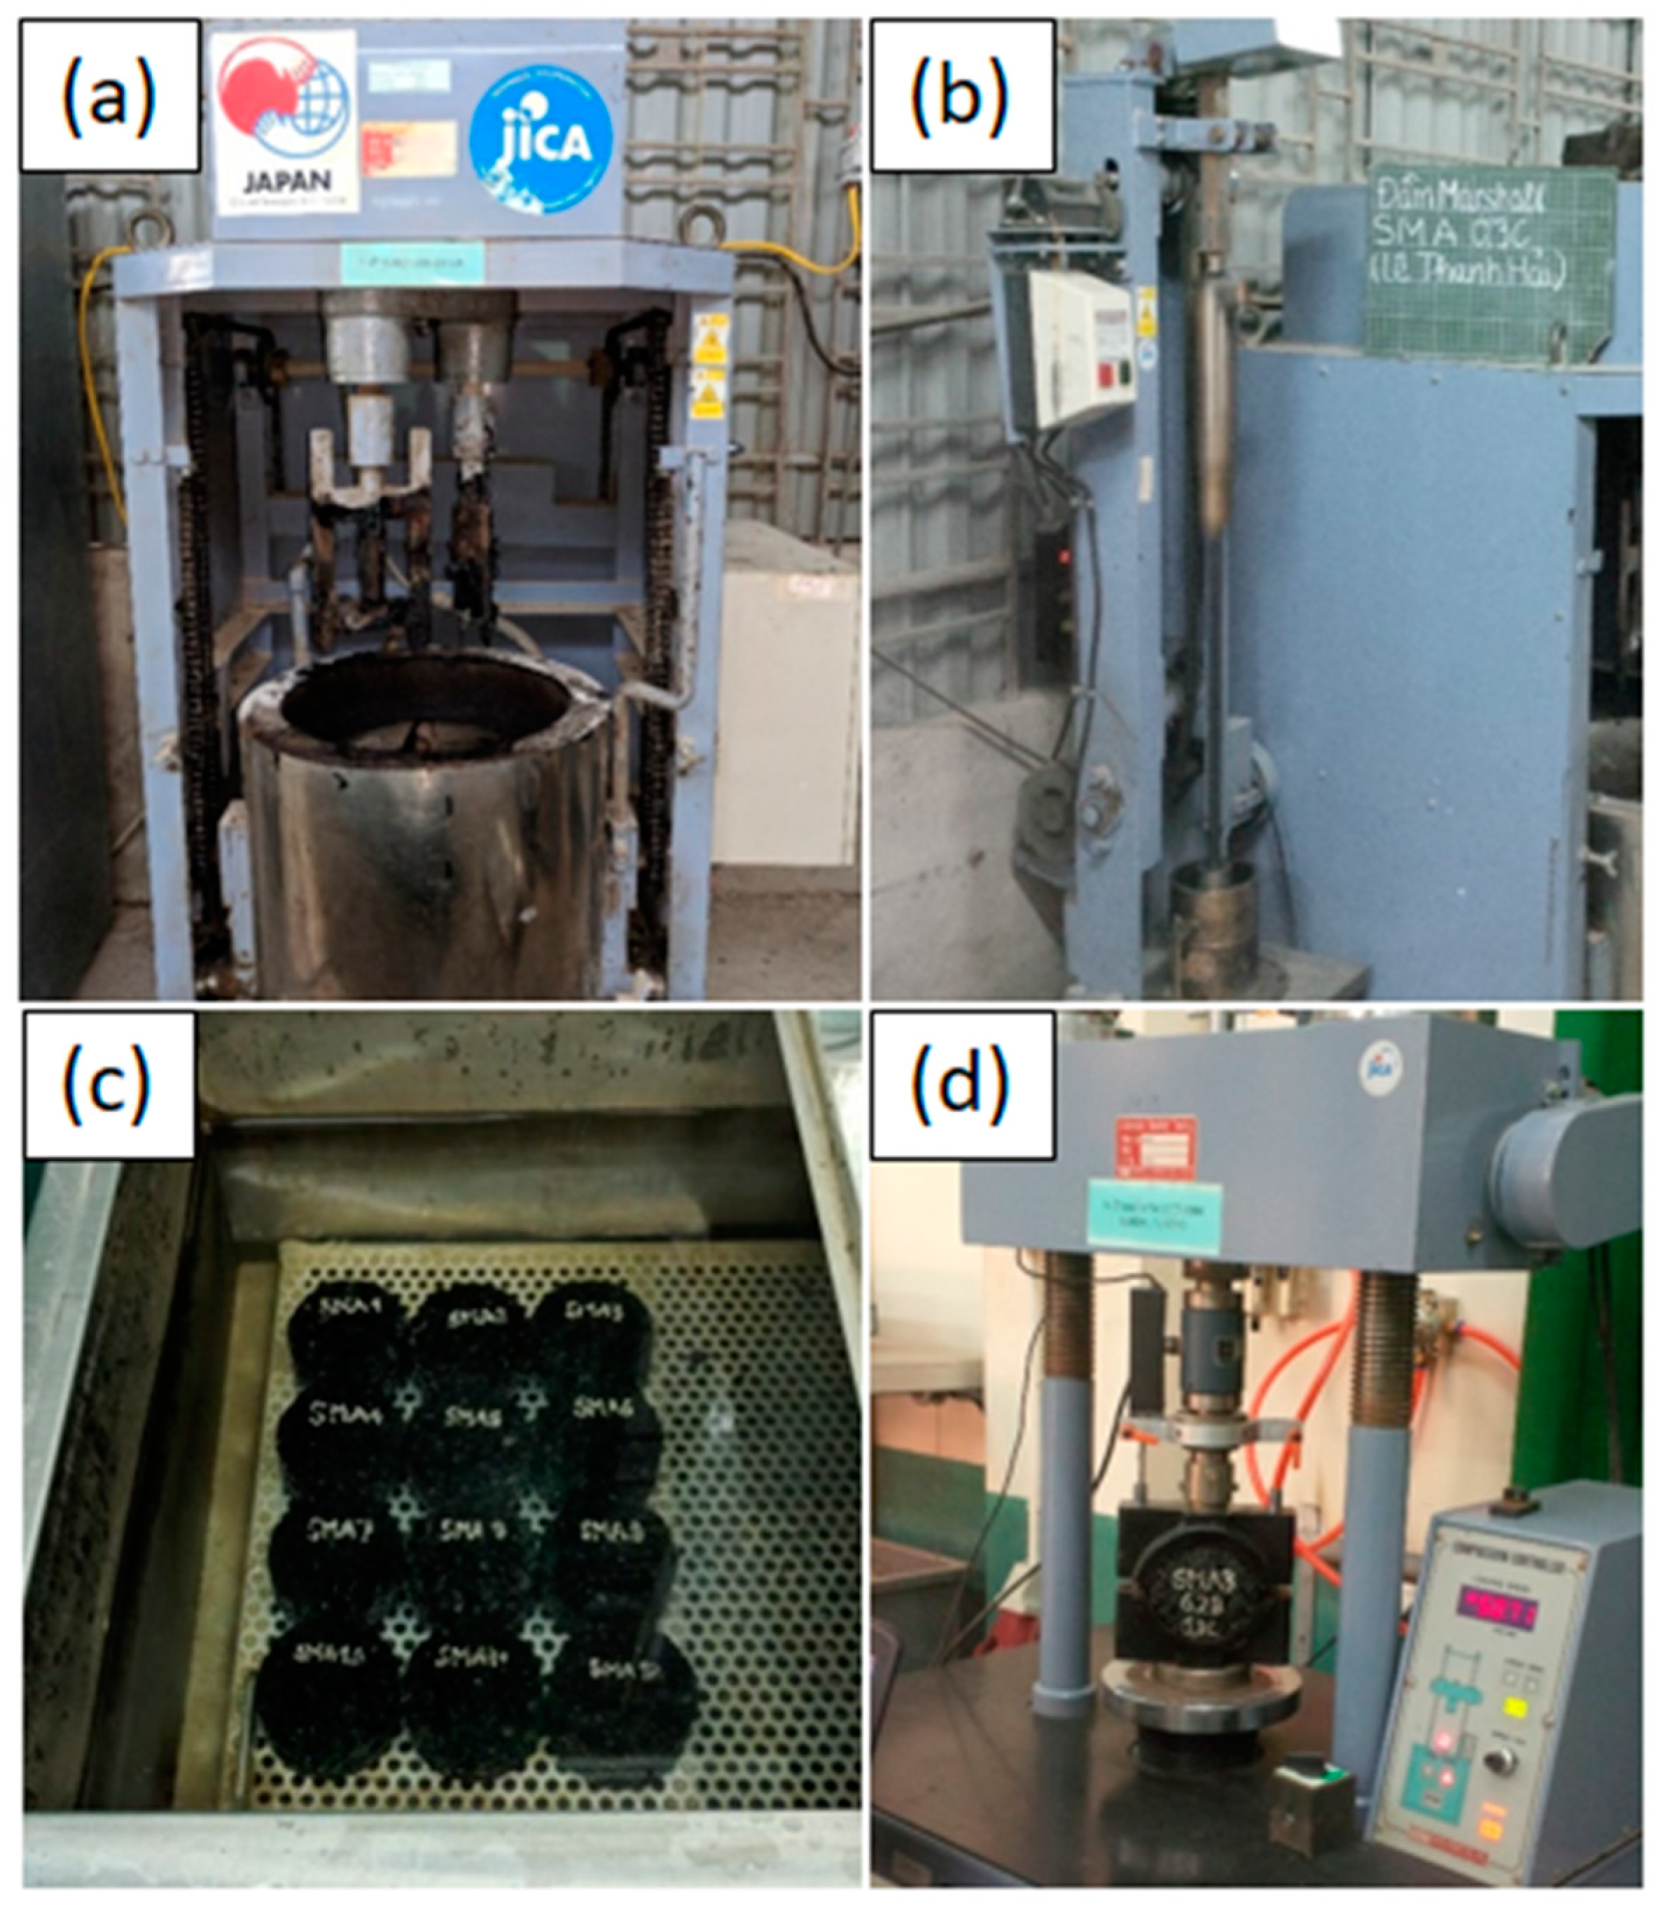
2.2. Samples Preparation and Testing

Sample preparation used three different aggregate gradations with 12.5 mm nominal maximum aggregate sizes to prepare the SMA mixtures, namely SMA type I, SMA type II and SMA type III. The mixture gradation and gradation limits were subjected to the AASHTO M325 testing and the results plotted in Figure 1. The SMA I samples were prepared with coarse and fine aggregates, mineral filler, Bitumen 60/70 and cellulose fibers, the SMA II samples were produced with similar aggregates, cellulose fibers and PMB I as binder, whereas the SMA III samples were using different weight percentages of coarse and fine aggregates, mineral filler, Bitumen 60/70 and cellulose fibers. Out of these, with the SMA I samples, the bitumen content is in a range from 5.4% to 7.0% and retained coarse aggregates on the 4.75 mm sieve was 76.1 wt.%; with the SMA II samples, the bitumen contents varied from 5.5% to 7.5% and the retained coarse aggregates on the 4.75 mm sieve is 71.17 wt.%; and with the SMA III samples, the bitumen content is in a range from 5.7% to 6.9% and the retained coarse aggregates on the 4.75 mm sieve is 74.2 wt%. In summarize, a number of 60 mixtures were prepared.
For the experimental procedures, the aggregates were first dried in an oven at 105 °C to 110 °C until a constant mass was achieved, following the ASTM D6926 norms [29]. The separation of aggregates by dry-sieving was performed next in order to obtain the desired size fractions. The mixing process was conducted following the ASTM D6926 standard [29], using an asphalt mixer with 30 L capacity. Before adding cellulose fiber, the mixture of aggregates and mineral filler were homogeneously mixed together. The corresponding bitumen content was then added into the mixing machine and stirred for 120 s to assure the aggregates and mineral filler are well covered by bitumen [29]. The asphalt cements were heated in order to get the viscosities of 170 ± 20 cP and 280 ± 30 cP for mixing and compacting procedures, respectively [29]. The Marshall Automatic Compaction was next used for the compacting procedure. The SMA samples were compacted on two faces, using 50 blows of a 4536 g hammer falling from a 457.2 mm of height, following the ASTM D6927 procedure [30]. After cooling down to ambient room temperature, the samples were extracted from the cylindrical mould and kept under laboratory conditions. The testing procedure was performed within 24 h after the compaction [30].
The Marshall test was carried out with cylindrical specimens of 63.5 mm in height and 101.6 mm in diameter, a standard compaction hammer and a cylindrical mold. Marshall Tests were conducted as per ASTM D6927 [30], with an Automatic Stability Testing machine. Before each measurement, the specimen was placed in a hot water at 60°C for 40 min [30]. Data of the MS and MF were collected after each measurement, whereas the MQ was deduced as a ratio of MS and MF. The SMA materials and testing machine are shown in Figure 2.

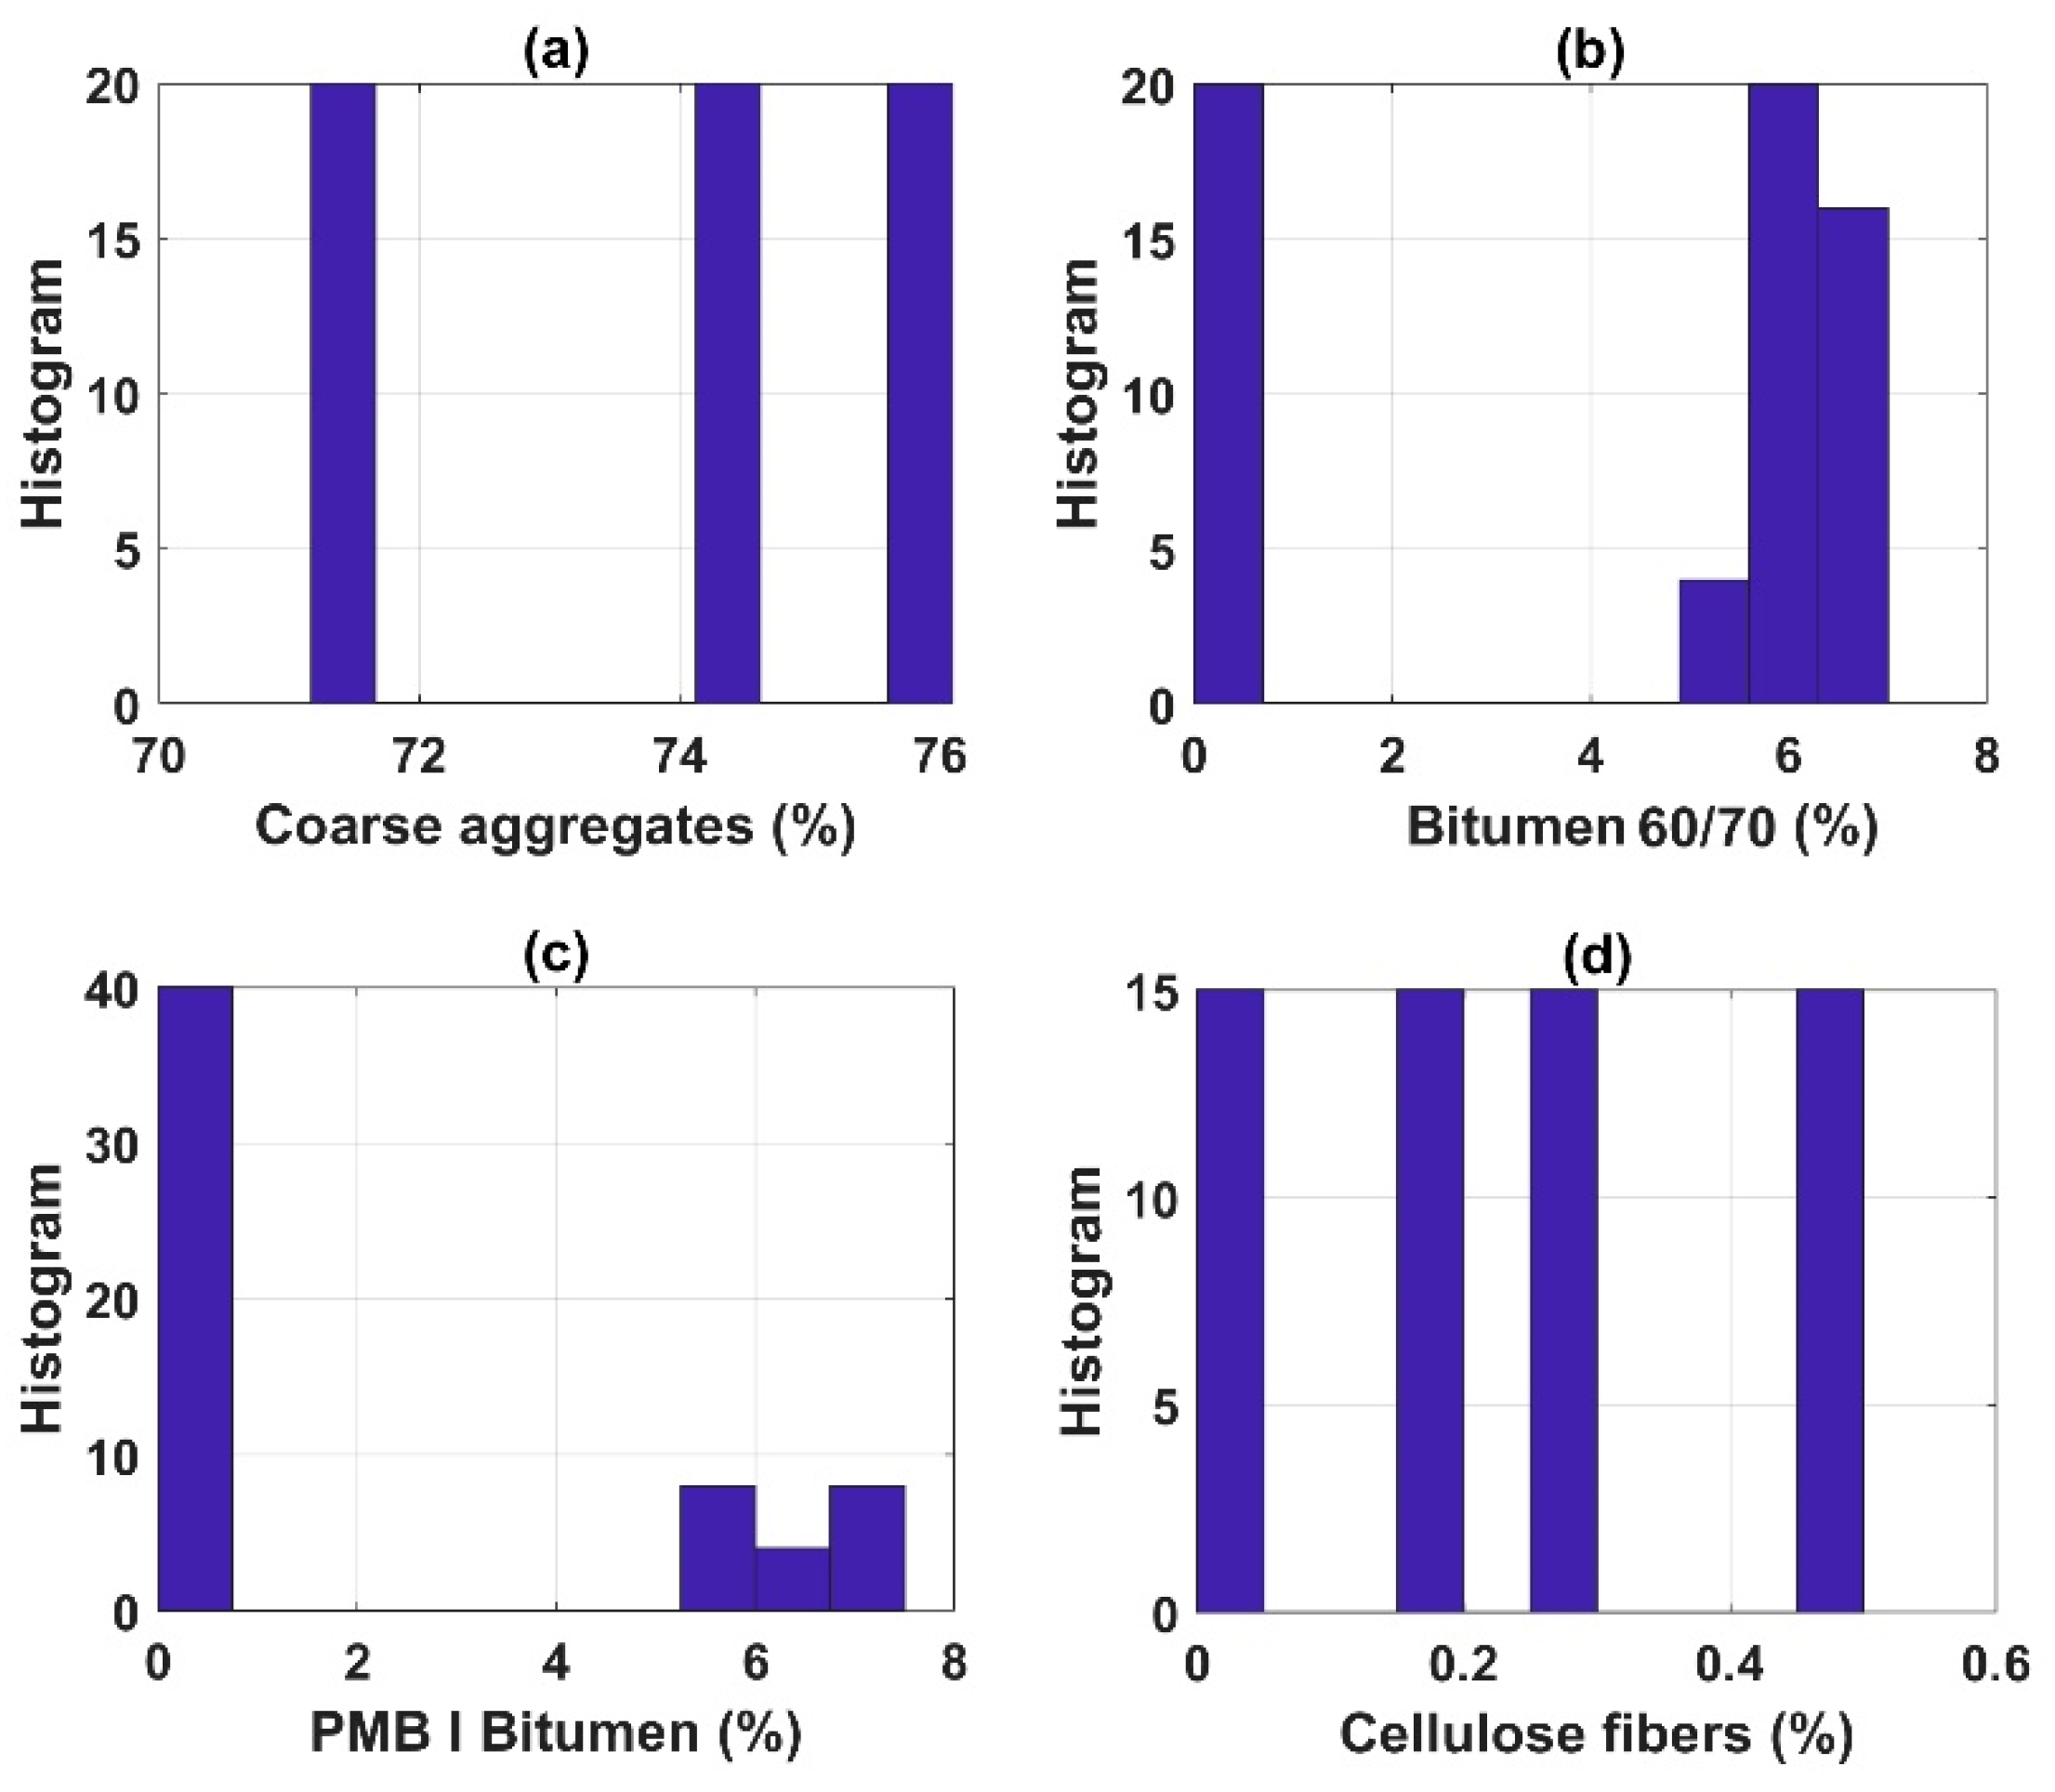
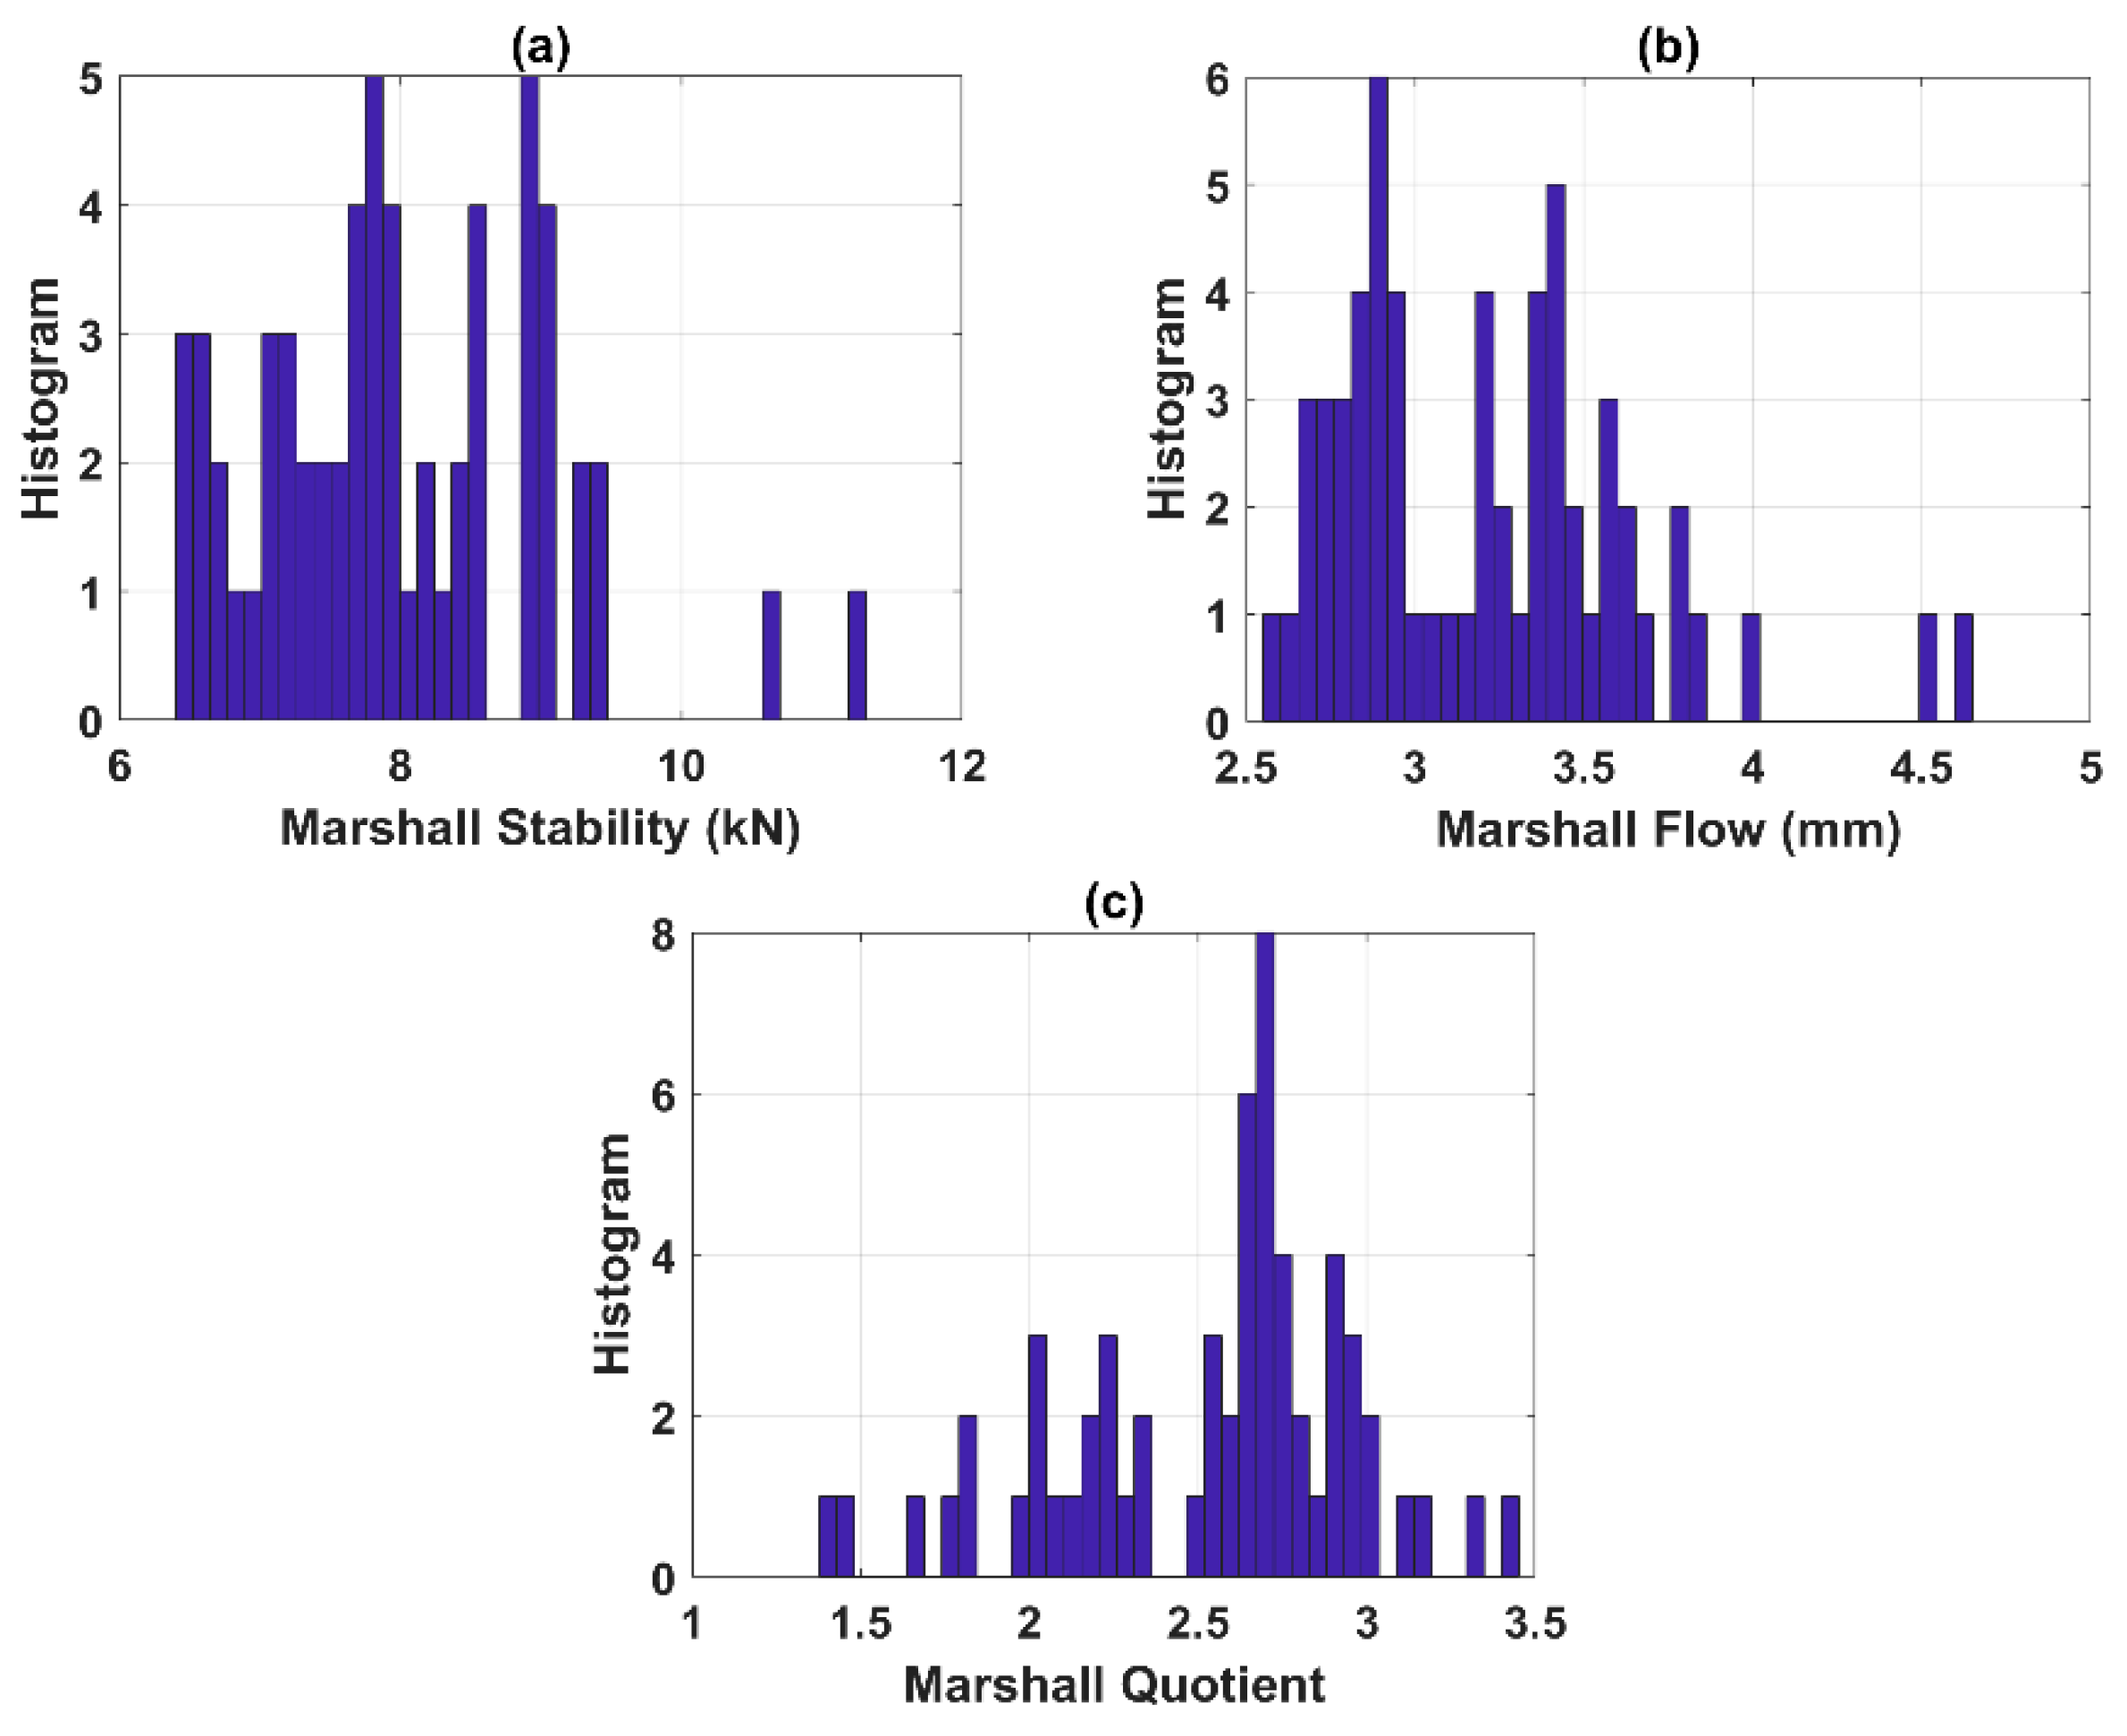
2.3. Data Statistical Information

After experimental tests, the data were collected and summarized in Appendix A (Table A1), whereas the statistical information of the dataset is presented in Table 4.
In this study, input variables considered were coarse aggregates (%), two types of bitumen, namely Bitumen 60/70 and PMB I, and the cellulose fibers contents (%). In this study, the polymer-modified bitumen was selected since it is one of the most common types of modified binders in Vietnam and many other regions [31,32,33]. The targets were three Marshall Parameters, i.e., MS, MF and MQ. The histogram of the inputs and outputs are presented in Figure 3 and Figure 4. It is noticed that all the values of inputs and outputs parameters covered a reasonable range, which corresponded to typical characteristics of the SMA mixtures as well as SMA component materials.

3. Method Used

In this study, four main techniques, namely ANFIS, Genetic Algorithm (GA), Particle Swarm Optimization (PSO), and SVM were used. Out of these methods, the GA and PSO were used to optimize the parameters of the ANFIS to develop hybrid AI models (PSOANFIS and GAANFIS), whereas the SVM was used as a single benchmark model for comparison. A brief description of these techniques is given in the following sections.

3.1. Adaptive Network-Based Fuzzy Inference System

Adaptive Network-based Fuzzy Inference System (ANFIS) is a hybrid algorithm with the combination of fuzzy systems and neural networks. It was first proposed by Jang [34] and often used to investigate nonlinear systems. Generally, an ANFIS includes five layers and each layer is formulated by some nodes and node functions [35]. In this study, the ANFIS uses Takagi-Sugeno model which is the most prominent fuzzy inference system (FIS) model [36].

3.2. Genetic Algorithm

Genetic algorithm (GA) is an optimization method which is similar to natural evolution, where a population of a specific species becomes adapted to the environmental conditions [37]. It was first introduced by Holland [38], and has become one of the oldest and most widely used evolution algorithms. Its structure consists of a population, in which each individual is called a chromosome, which is a possible solution of the problem. The search process of the GA is made by developing a random chromosome population and the next generation is determined by applying three operators (i.e., selection operator, crossover operator, and mutation operator) [35,39].

3.3. Particle Swarm Optimization

Particle Swarm Optimization (PSO), introduced by Kennedy and Eberhart [40,41], is one of the most commonly evolutionary methods in optimizing the parameters of a given model. The principle of the PSO algorithm is based on the social and biological behaviors of animals when seeking food. The PSO originates with a random group of particles where each particle stands for a specific solution to the problem. It comprises of group of particles, in which the position of each individual is affected by the surrounding most optimal position during its movement. In a PSO, each individual can adjust its position in the search space related to the best locations that can ever have and the best location adjacent to its neighbors. In the PSO, the position of each particle at every iteration step is updated based on its current position and velocity [35].

3.4. Support Vector Machine

Support vector machine (SVM) was firstly introduced in the work of Vapnik [42]. The principle of SVM is to create a hyperplane to classify a dataset into distinct classes. By using a mapping, the SVM completely plots the original input space into a high-dimensional feature space [43]. Thereafter, the optimal plane is determined by maximizing the margins of class boundaries in the feature space. There are two kinds of the SVM problems, the first kind deals with classification problems whereas the second one deals with regression problems. This work used the SVM to predict the Marshall Parameters, therefore the regression problem is studied [44].

3.5. Quality Assessment

The efficiency of the developed models is evaluated using various statistical indexes namely Mean Absolute Error (MAE), Root Mean Squared Error (RMSE) and correlation coefficient (R). The value of R ranges from [0, 1], the higher value of R (i.e., closer to 1) indicates more successful model. On the contrary, lower value of RMSE, MAE indicates better performance of proposed AI models. The criteria are determined by the following equations:
RMSE = i = 1 N ( y 0 y p ) 2 / N
MAE = 1 N i = 1 N | y 0 y p |
R = 1 i = 1 N ( y 0 y p ) 2 i = 1 N ( y 0 y i ¯ ) 2
where N is defined as the number of input data, y ¯ is the mean value of the outputs, and y0 and yp express the actual and modeled values, respectively.

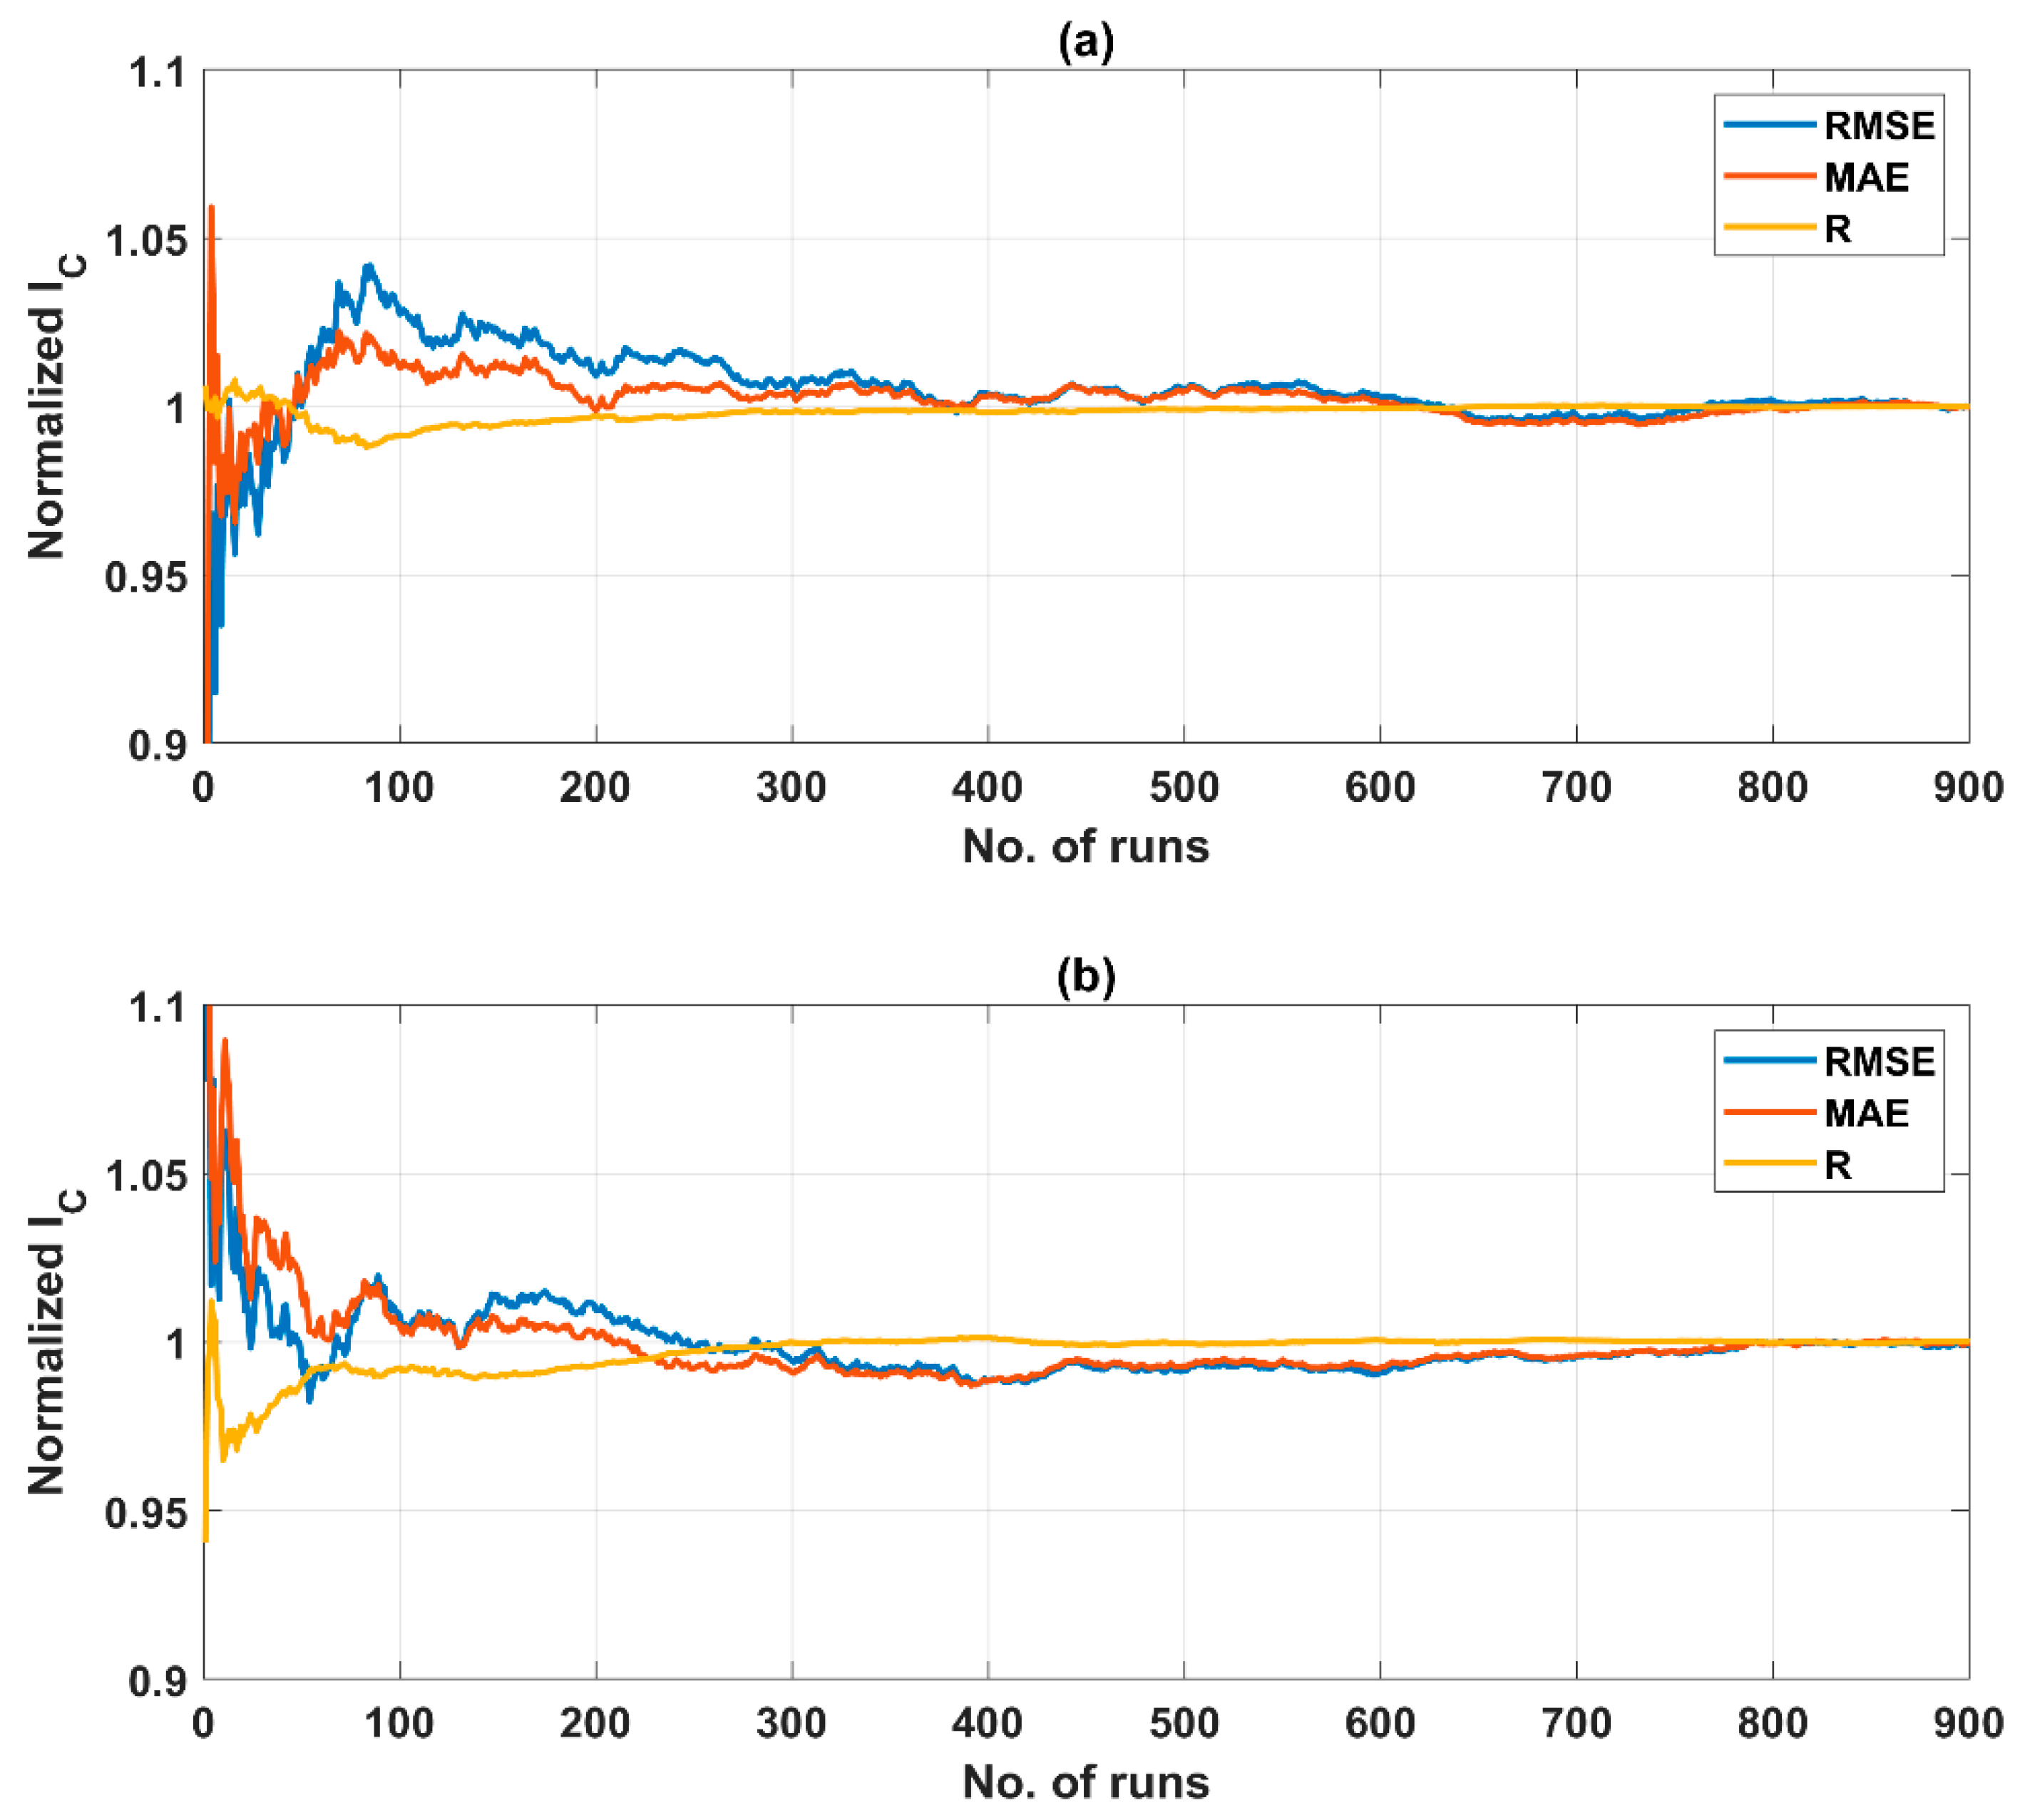
3.6. Monte Carlo Method

In this study, a Monte Carlo approach was applied to propagate input variability on the predicted output. The method exhibits a high numerical performance because of its automatic parallelization and is widely adopted in many fields [45,46,47], especially for multi-variable problems [44,48,49]. Random samplings of input variables (by a uniform distribution) are generated and incorporated into the model to simulate output results [50]. By doing so, any variability of the input dataset could be fully accounted for in the prediction results. Various types of quantitative information could be obtained as a result of statistical analysis of predicted outputs, for instance, (i) robustness of the proposed models under presence of input variability and/or (ii) sensitivity of each input on the prediction results. In order to investigate the optimal number of Monte Carlo simulations, an indicator of convergence, named as IC, is introduced [51,52]:
N I C ( N ) = 1 N k = 1 N θ k ,
where N is defined as the number of Monte Carlo simulations of the random variable θ . The indicator IC was helpful to identify an optimal number of Monte Carlo simulations, as a relative factor directly reflects time-consuming.

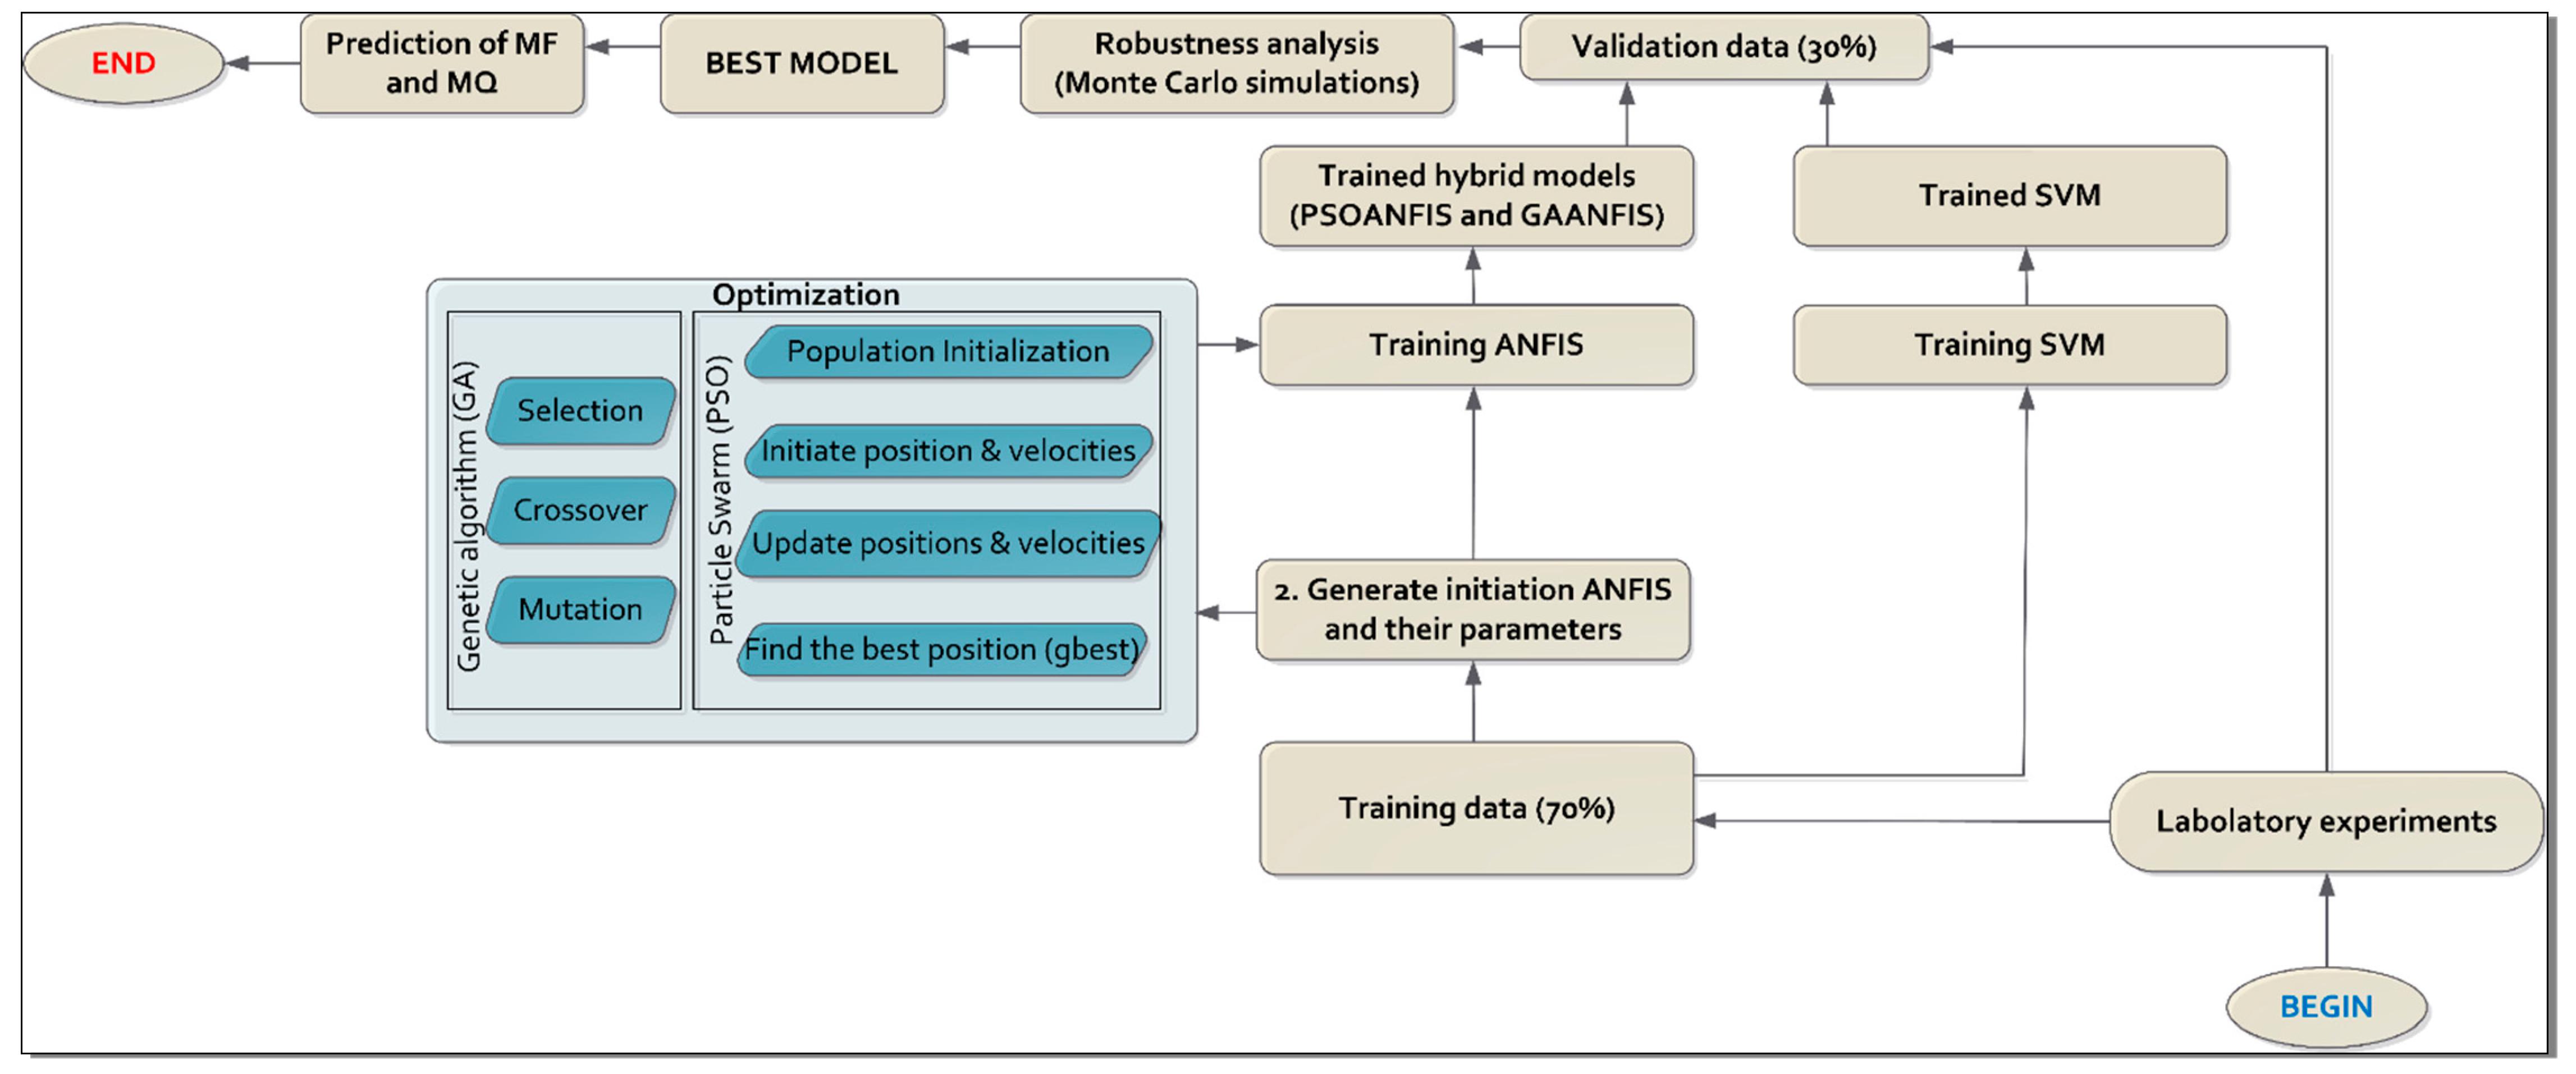
3.7. Modeling Methodology

The modeling methodology of this study was carried out through several main steps described as follows (Figure 5):
Step 1:
Loading the as-obtained dataset and dividing it into two parts. The first part, including 70% of the data, is used to train and construct the AI “black-boxes”, whereas the remaining 30% of data was used for validation of the models. The input parameters were coarse and fine aggregates (wt.%), AC-60/70 (wt.%) or PMB I (wt.%) binders, and cellulose fibers (wt.%). The output of the AI numerical tools was MS (kN), MF (mm) and MQ (kN/mm).
Step 2:
Construction of the models using the training dataset. In the PSOANFIS, the PSO was first used to optimize the consequent and antecedent parameters of the ANFIS with the best number of particles and the inertia weight were set as 25 and 0.01, respectively. The optimal parameters optimized by the PSO were then used to train the ANFIS model for generating the PSOANFIS. For the GAANFIS, the GA was first used to optimize the consequent and antecedent parameters of the ANFIS with the crossover rate, the best number of individuals and mutation rate were set as 0.4, 25, and 0.7, respectively. The optimal parameters optimized by the GA were then used to train the ANFIS model for generating the GAANFIS. With respect to the SVM, the cubic algorithm was used to train and construct the model. A k-fold cross-validation was applied to assess the performance of SVM with the number of 10 folds.
Step 3:
Validation of the models using testing data set was performed in this step. Various criteria namely R, RMSE, MAE were used to validate the three developed models in both the training and testing datasets.
Step 4:
Monte Carlo analysis and asymmetric distribution were finally used to validate the robustness of the developed models. In this step, the uniform distribution was used to generate random sampling of the training dataset for Monte Carlo simulation.
Step 5:
Predicting the MF and MQ of the SMA materials: Using the results of Monte Carlo analysis, asymmetric distribution and other validation criteria, the best model will be determined, this model is then used to predict other important parameters of the SMA materials namely MF and MQ.

4. Results and Discussion

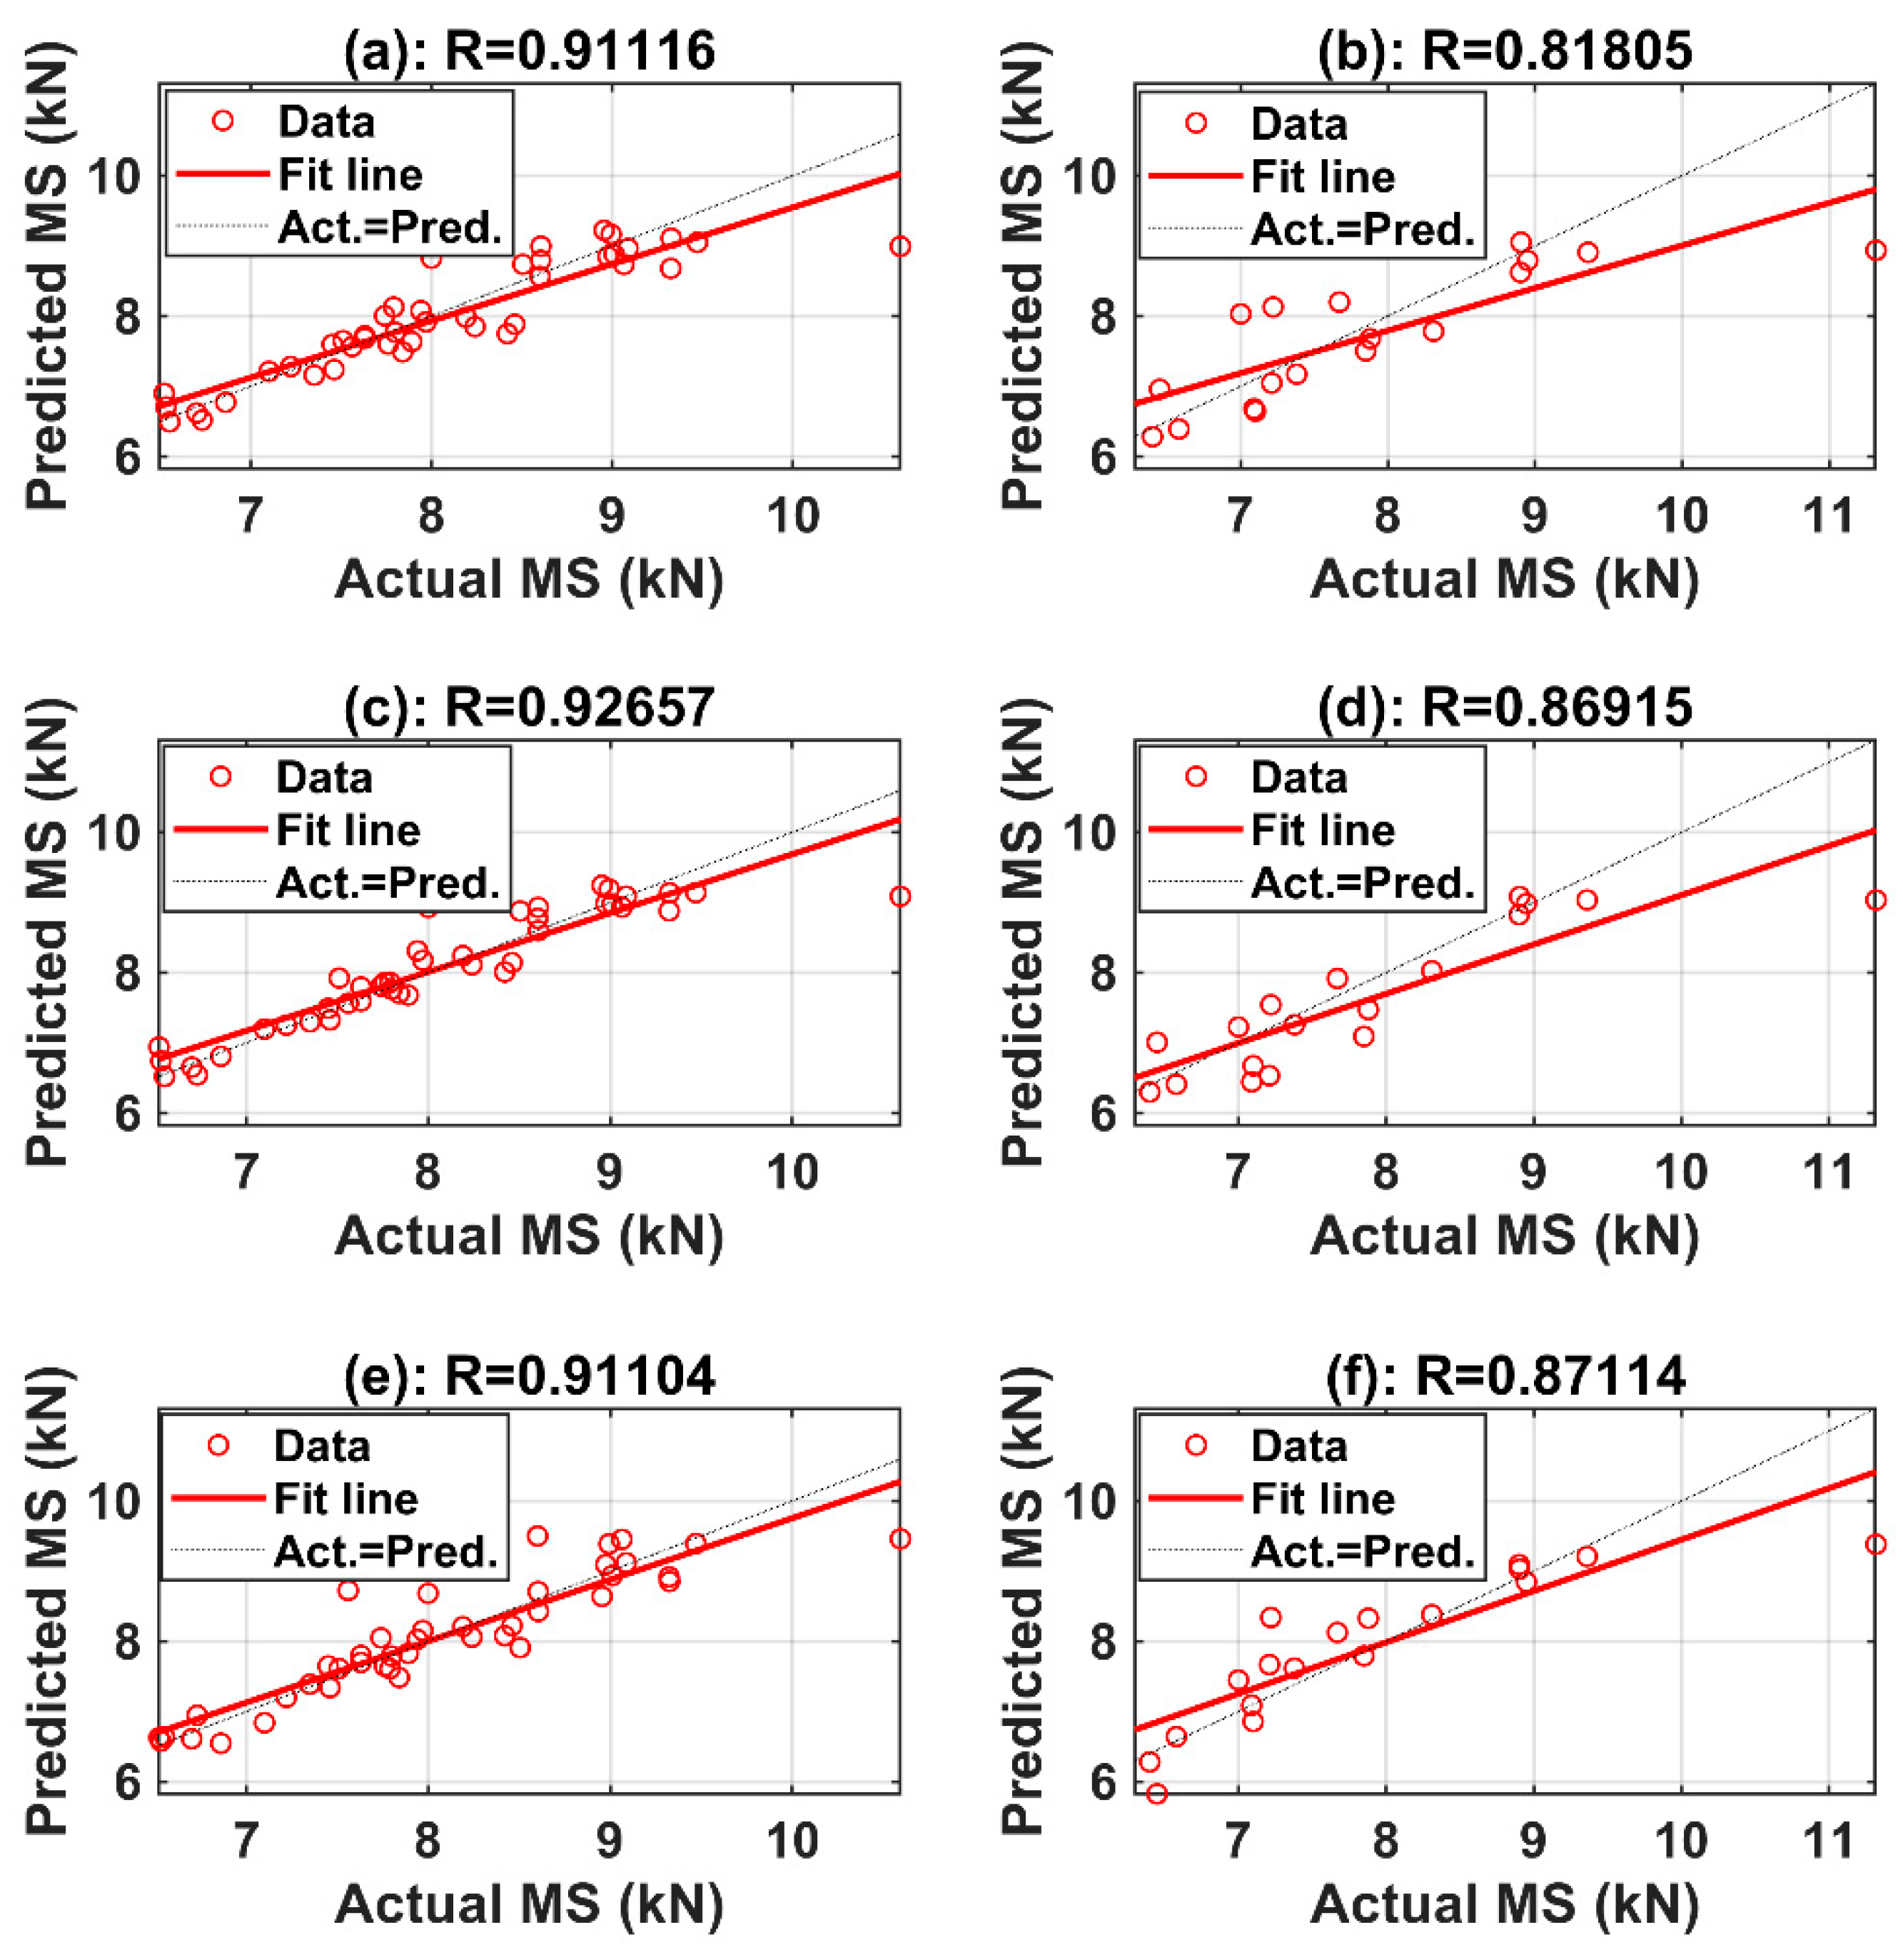
4.1. Prediction Capability

Taking MS as the prediction target, the performance of three proposed AI methods, namely PSOANFIS, GAANFIS and SVM was investigated with both training (Figure 6a,c,e) and testing datasets (Figure 6b,d,f). As regards to the training part, the PSOANFIS technique had the closest fitted line to the diagonal, confirmed by the highest value of R (i.e., 0.9266 compared to 0.9111 and 0.9110 using the GAANFIS and SVM, respectively). With respect to RMSE and MAE, the PSOANFIS appeared the best predictor of the MS as the corresponding values were smallest (Table 5). This is a good indication that RMSE and MAE were in excellent agreement with R, demonstrating that the PSOANFIS performed better than other techniques in term of training dataset.
As regard to the testing part, the SVM technique has the closest fitted line to the diagonal one, proved by the highest value of R (i.e., 0.8711 compared with 0.8692 and 0.8181 while using the PSOANFIS, GAANFIS, respectively). Besides, the SVM algorithm was a very strong candidate with the smallest values of RMSE and MAE (i.e., RMSE = 0.5978 and MAE = 0.3804). All the values are summarized in Table 5.
The training part of an AI algorithm is used for the construction of the model, whereas the testing one reflects its prediction capability [39]. With the main focus on the performance of the AI algorithms to predict the MS, the results on the testing parts are the focused in this study. Besides, a ratio of 70/30 was kept constant for the training/testing data, as recommended by Ahneman et al. [53]. The effect of random sampling of both training and testing datasets will be analyzed in the next section. It is noteworthy noticed that the results presented in the present section refer to one random combination of data indexes. It has been reported elsewhere that the prediction capability was greatly affected by the choice of sample index in the training/testing parts [39]. Therefore, the robustness of the three proposed AI models needs to be analyzed.

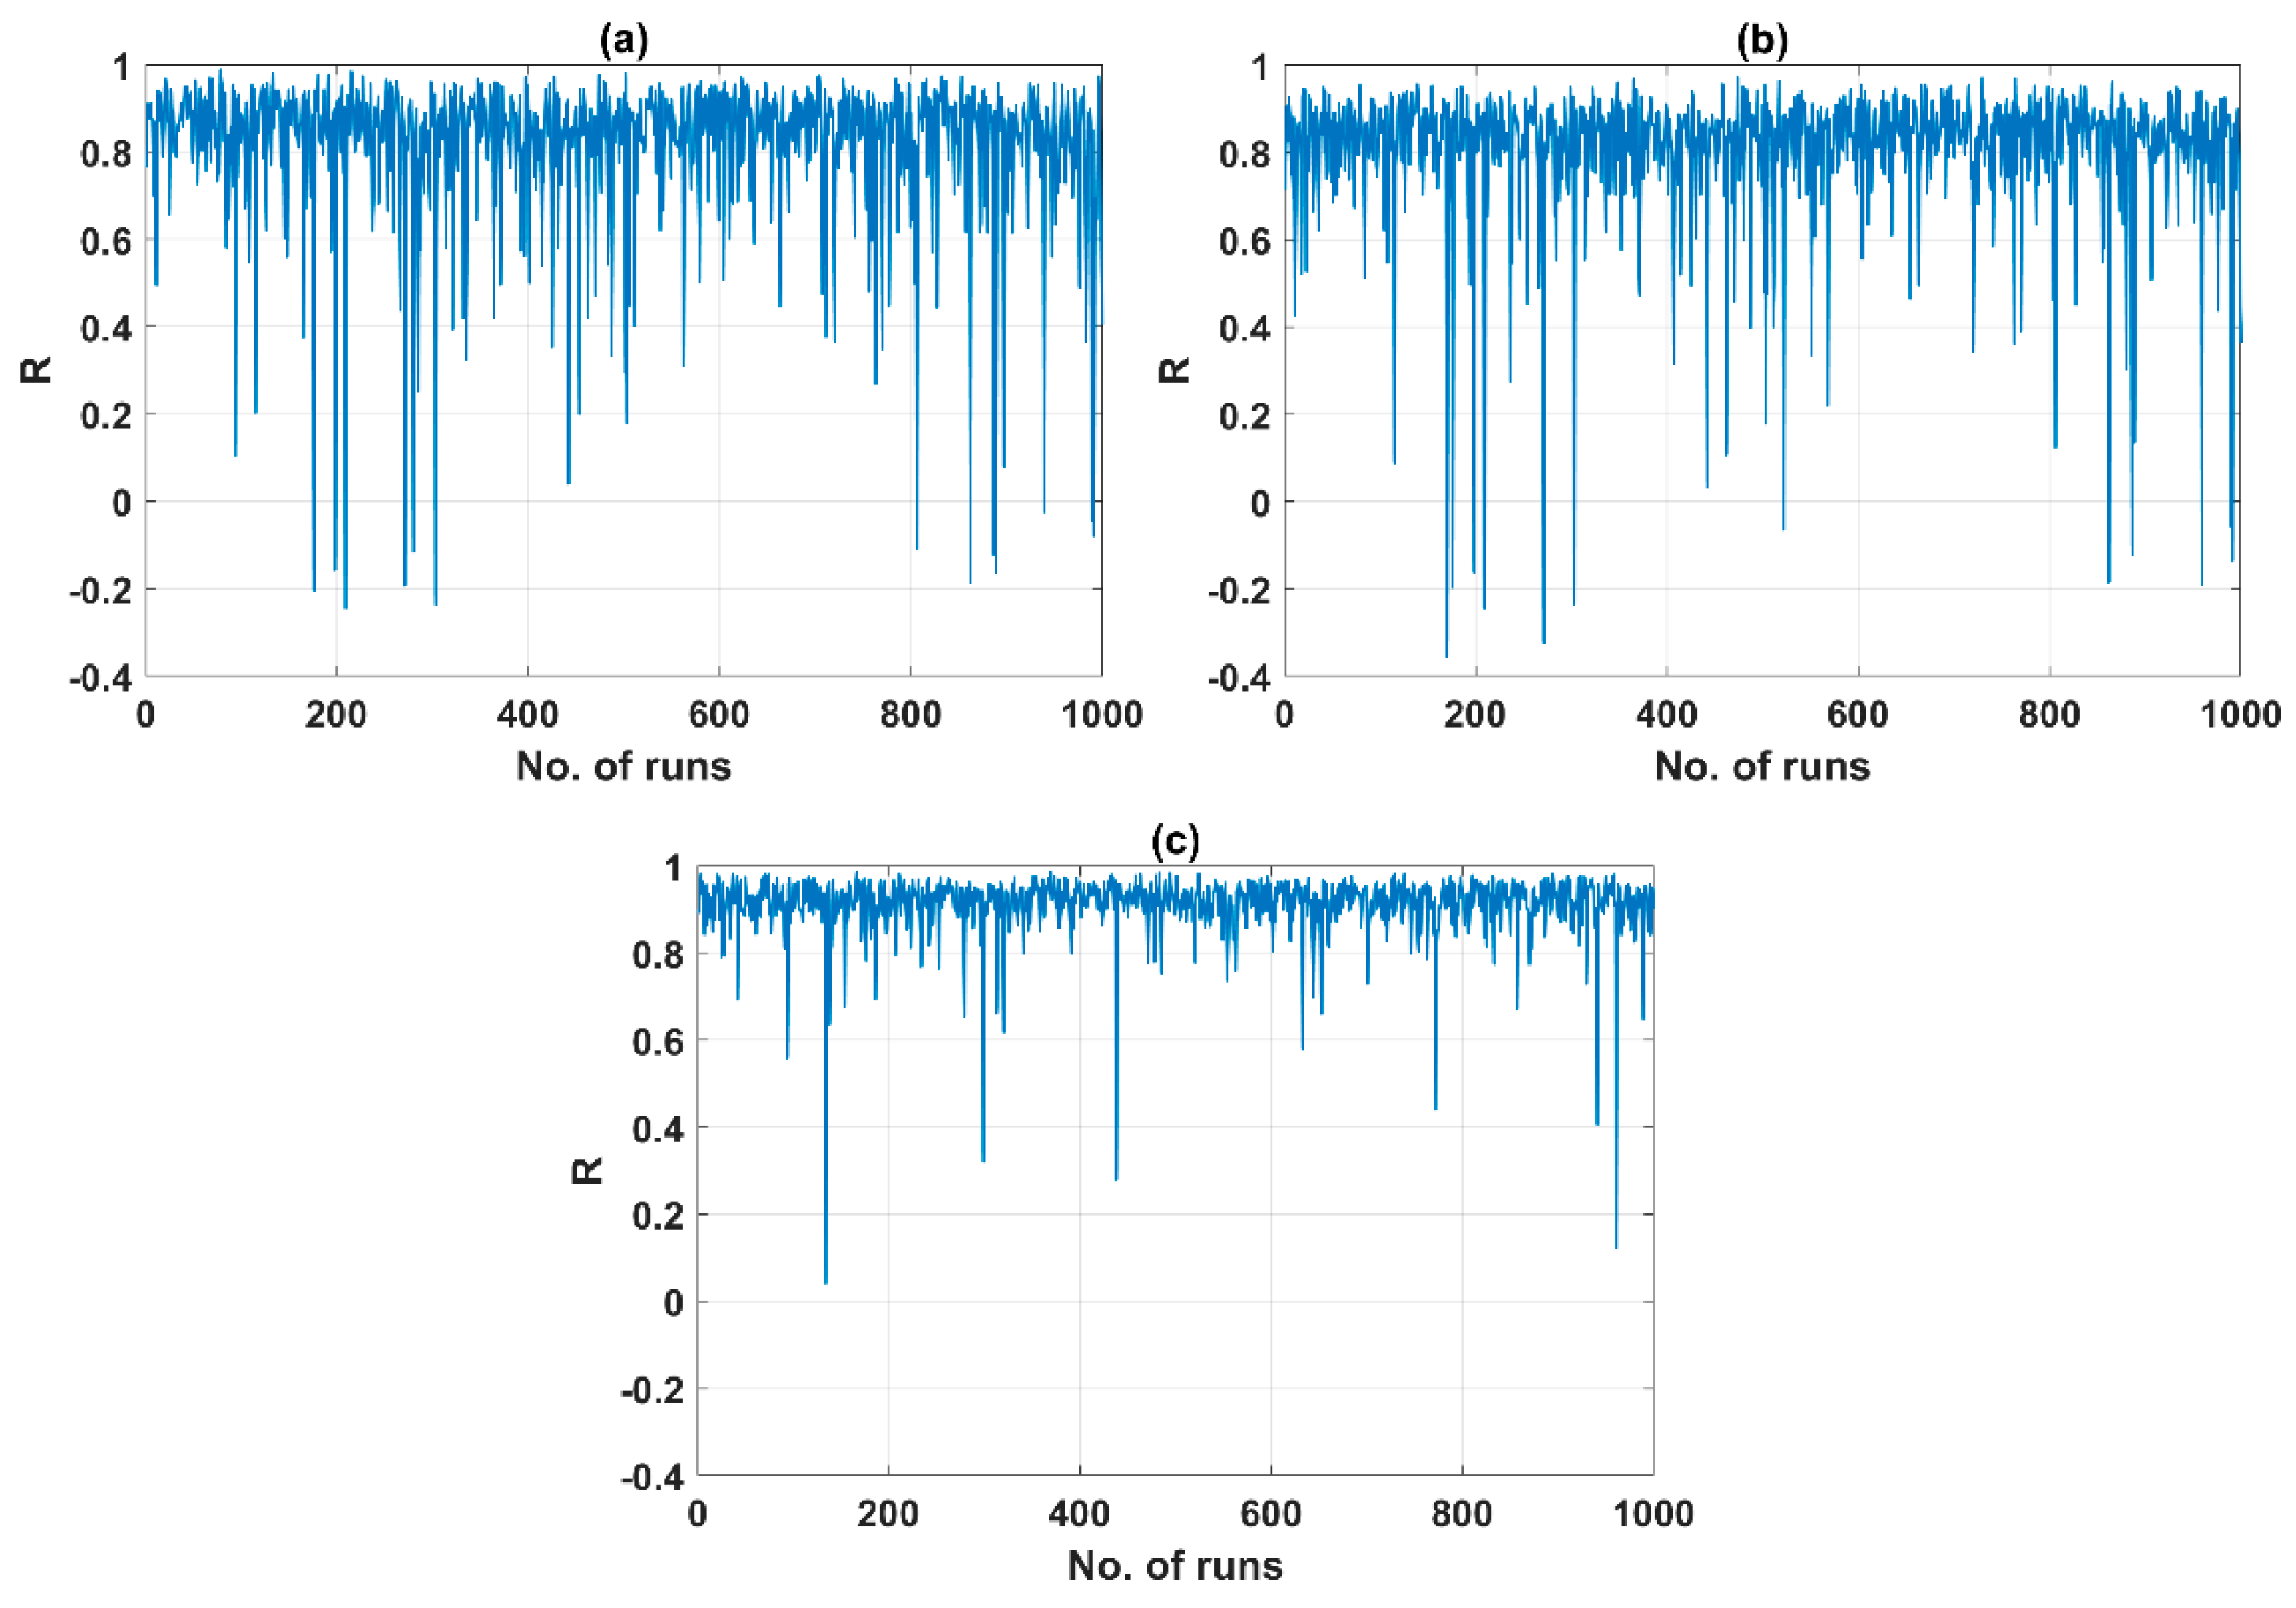
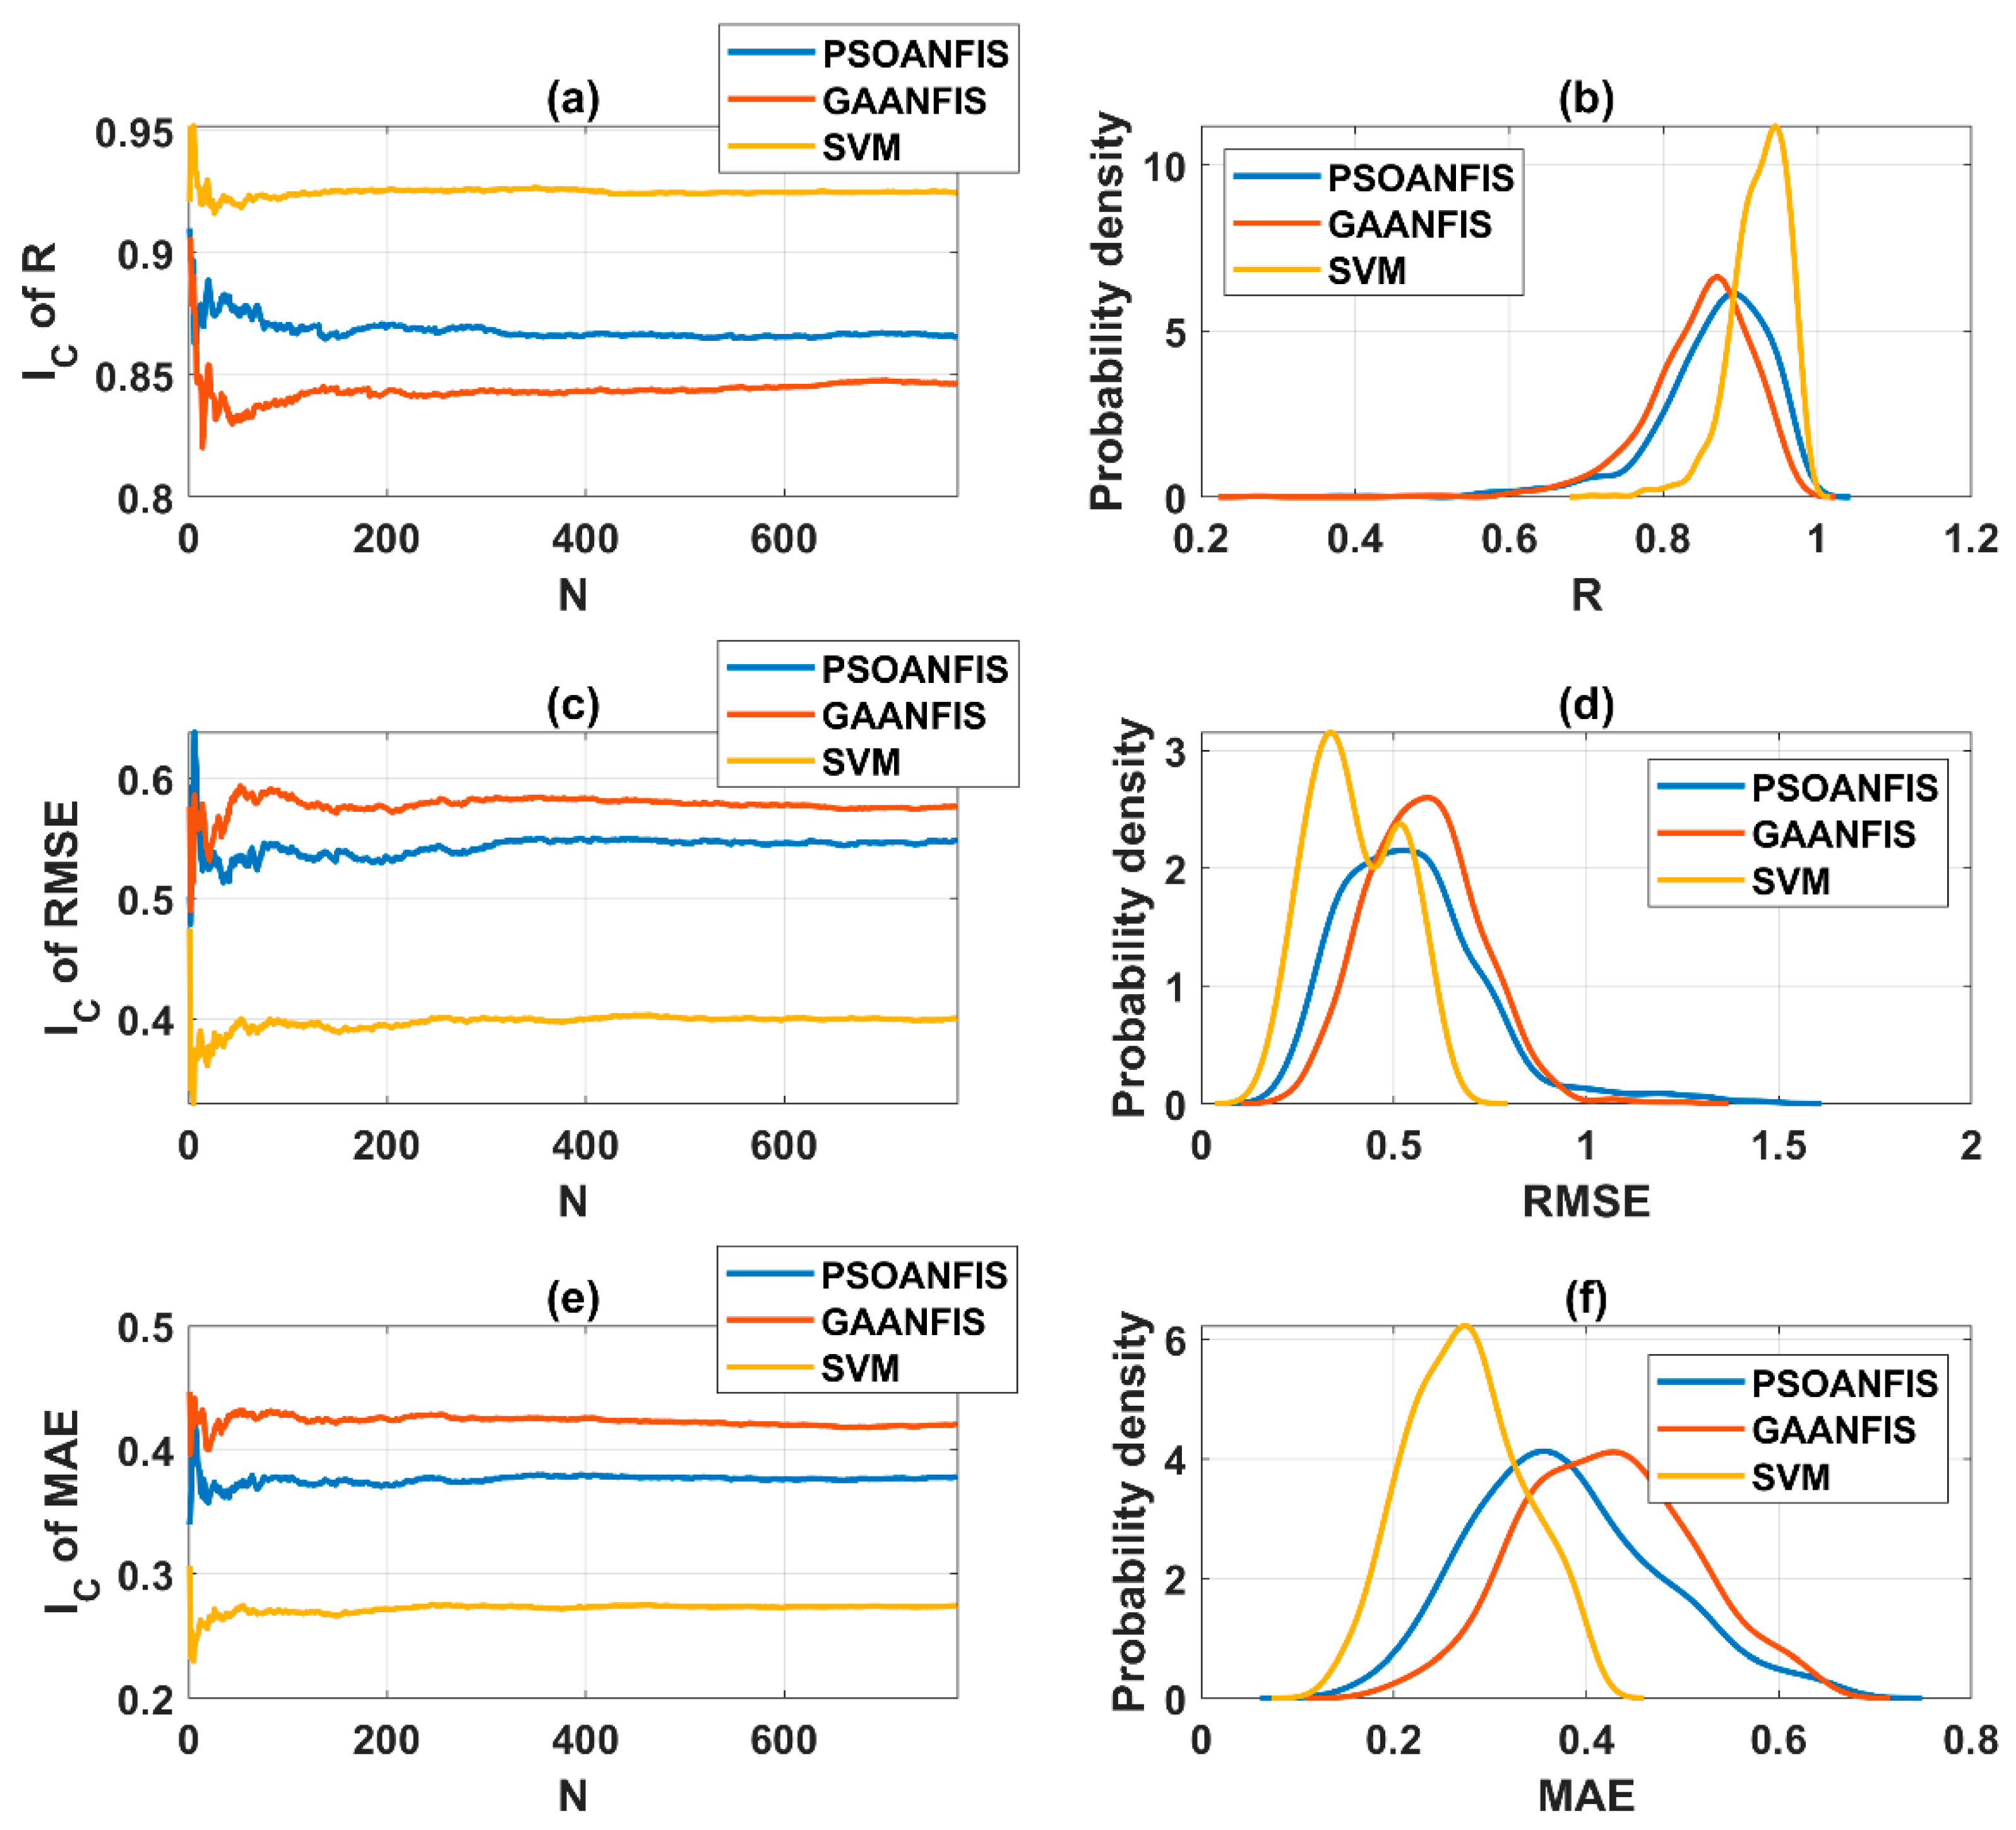
4.2. Models Robustness

Investigation of the robustness of three developed AI algorithms were achieved by performing 1000 Monte Carlo simulations, where an uniform distribution of data index was applied to construct the training and testing dataset for each run. Thereby, 1000 corresponding values of R, RMSE and MAE were obtained. The values of R for testing the PSOANFIS, GAANFIS and SVM over 1000 runs were plotted (Figure 7) to demonstrate the high level of fluctuation of R in function of the choice of dataset.
In order to estimate the robustness of the AI models, statistical analysis of the criteria was performed. It is worth noticingthat a post-treatment was performed at this stage. The outliers were removed using the quantile at 90% of RMSE as a threshold value. These values were extreme and not representative for the statistical analysis of the results obtained by AI models. Of over 1000 values obtained after the simulations, only 774 relevant values were used to perform the statistical analysis. Firstly, the statistical convergence of R, RMSE and MAE was introduced in order to determine the optimal number of Monte Carlo simulations. It is noticed that the convergence indicator IC was introduced in the previous section (see Equation (4)). The values of IC with respect to R (Figure 8a), RMSE (Figure 8c) and MAE (Figure 8e) over 774 Monte Carlo simulations are presented. It is observed that the three AI methods exhibited an optimal number of about 300 runs to reach the stationary solution of R, in other words, the PSOANFIS, GAANFIS, SVM were statistically converged after about 300 simulations (Figure 8). As regards to RMSE and MAE, it is shown that the SVM model possessed a smaller number of runs than that of the PSOANFIS and GAANFIS (i.e., 300 compared with 400 runs for PSOANFIS and GAANFIS). Besides, an important fluctuation of the IC curves of RMSE and MAE using the PSOANFIS and GAANFIS was observed (i.e., at N smaller than 100). Two conclusions can be deduced: (i) outliers should be removed before performing statistical analysis; (ii) at least 500 Monte Carlo simulations were needed to obtain reliable statistical analysis results, and (ii) the SVM algorithm is the most stable and robust predictor even with the variation of input index in the dataset. Detailed statistical information related to the robustness of the three proposed AI models is summarized in Table 6.
The probability density distributions of 774 values of R (Figure 8b), RMSE (Figure 8d) and MAE (Figure 8f) are also presented. It is observed that all distributions are highly asymmetric, particularly in case of the SVM model. In conclusion, from overall statistical analysis, the SVM method is the most robust and powerful algorithm to predict MS. The SVM model, after being carefully evaluated herein, could be used for saving time and cost in laboratory experiment.

4.3. Prediction of Marshall Flow (MF) and Marshall Quotient (MQ)

The SVM algorithm, found as the best predictor, was then employed to predict other properties of the SMA materials, namely MF and MQ. The convergence indicator IC and normalized IC are plotted in Figure 9. The predicted results of MF and MQ. The converged statistical values of R over 1000 Monte Carlo simulations were 0.9246, 0.9429 and 0.9085 for the MS, MF and MQ, respectively. A post-treatment was also performed at this stage. The outliers were removed using the quantile at 90% of RMSE computed by SVM as a threshold value, remaining 900 results for MF and MQ. An important fluctuation of IC with RMSE and MAE was observed in case of prediction of MF (Figure 9a) and prediction of MQ (Figure 9b). It observed that the required number of simulations is about 400 to obtain the converged statistical values of MF and MQ, with respect to RMSE and MAE. Again, it seems that 900 runs were sufficient to reach the converged solutions of MF and MQ. On the contrary, using R as criterion, statistical convergence values were obtained within 100 runs for all MS, MF and MQ. This confirmed the fact that an evaluation of a model generally requires at least two criteria for better quality assessment.
It is interesting to note that over 1000 Monte Carlo simulations, the maximum values of R were 0.9915 and 0.9874 for MF and MQ, respectively. Therefore, the best performance of realization (i.e., the one that gave maximum R and minimum RMSE, MAE are obtained) could not truly reflect the robustness of a given AI algorithm. Using a well-trained AI model, for a parametric study for instance [20], might be correct for only given dataset but not validated for all combinations of dataset. The results showed that the SVM has a good predictive capability in predicting the MS as well as other parameters (MF and MQ).

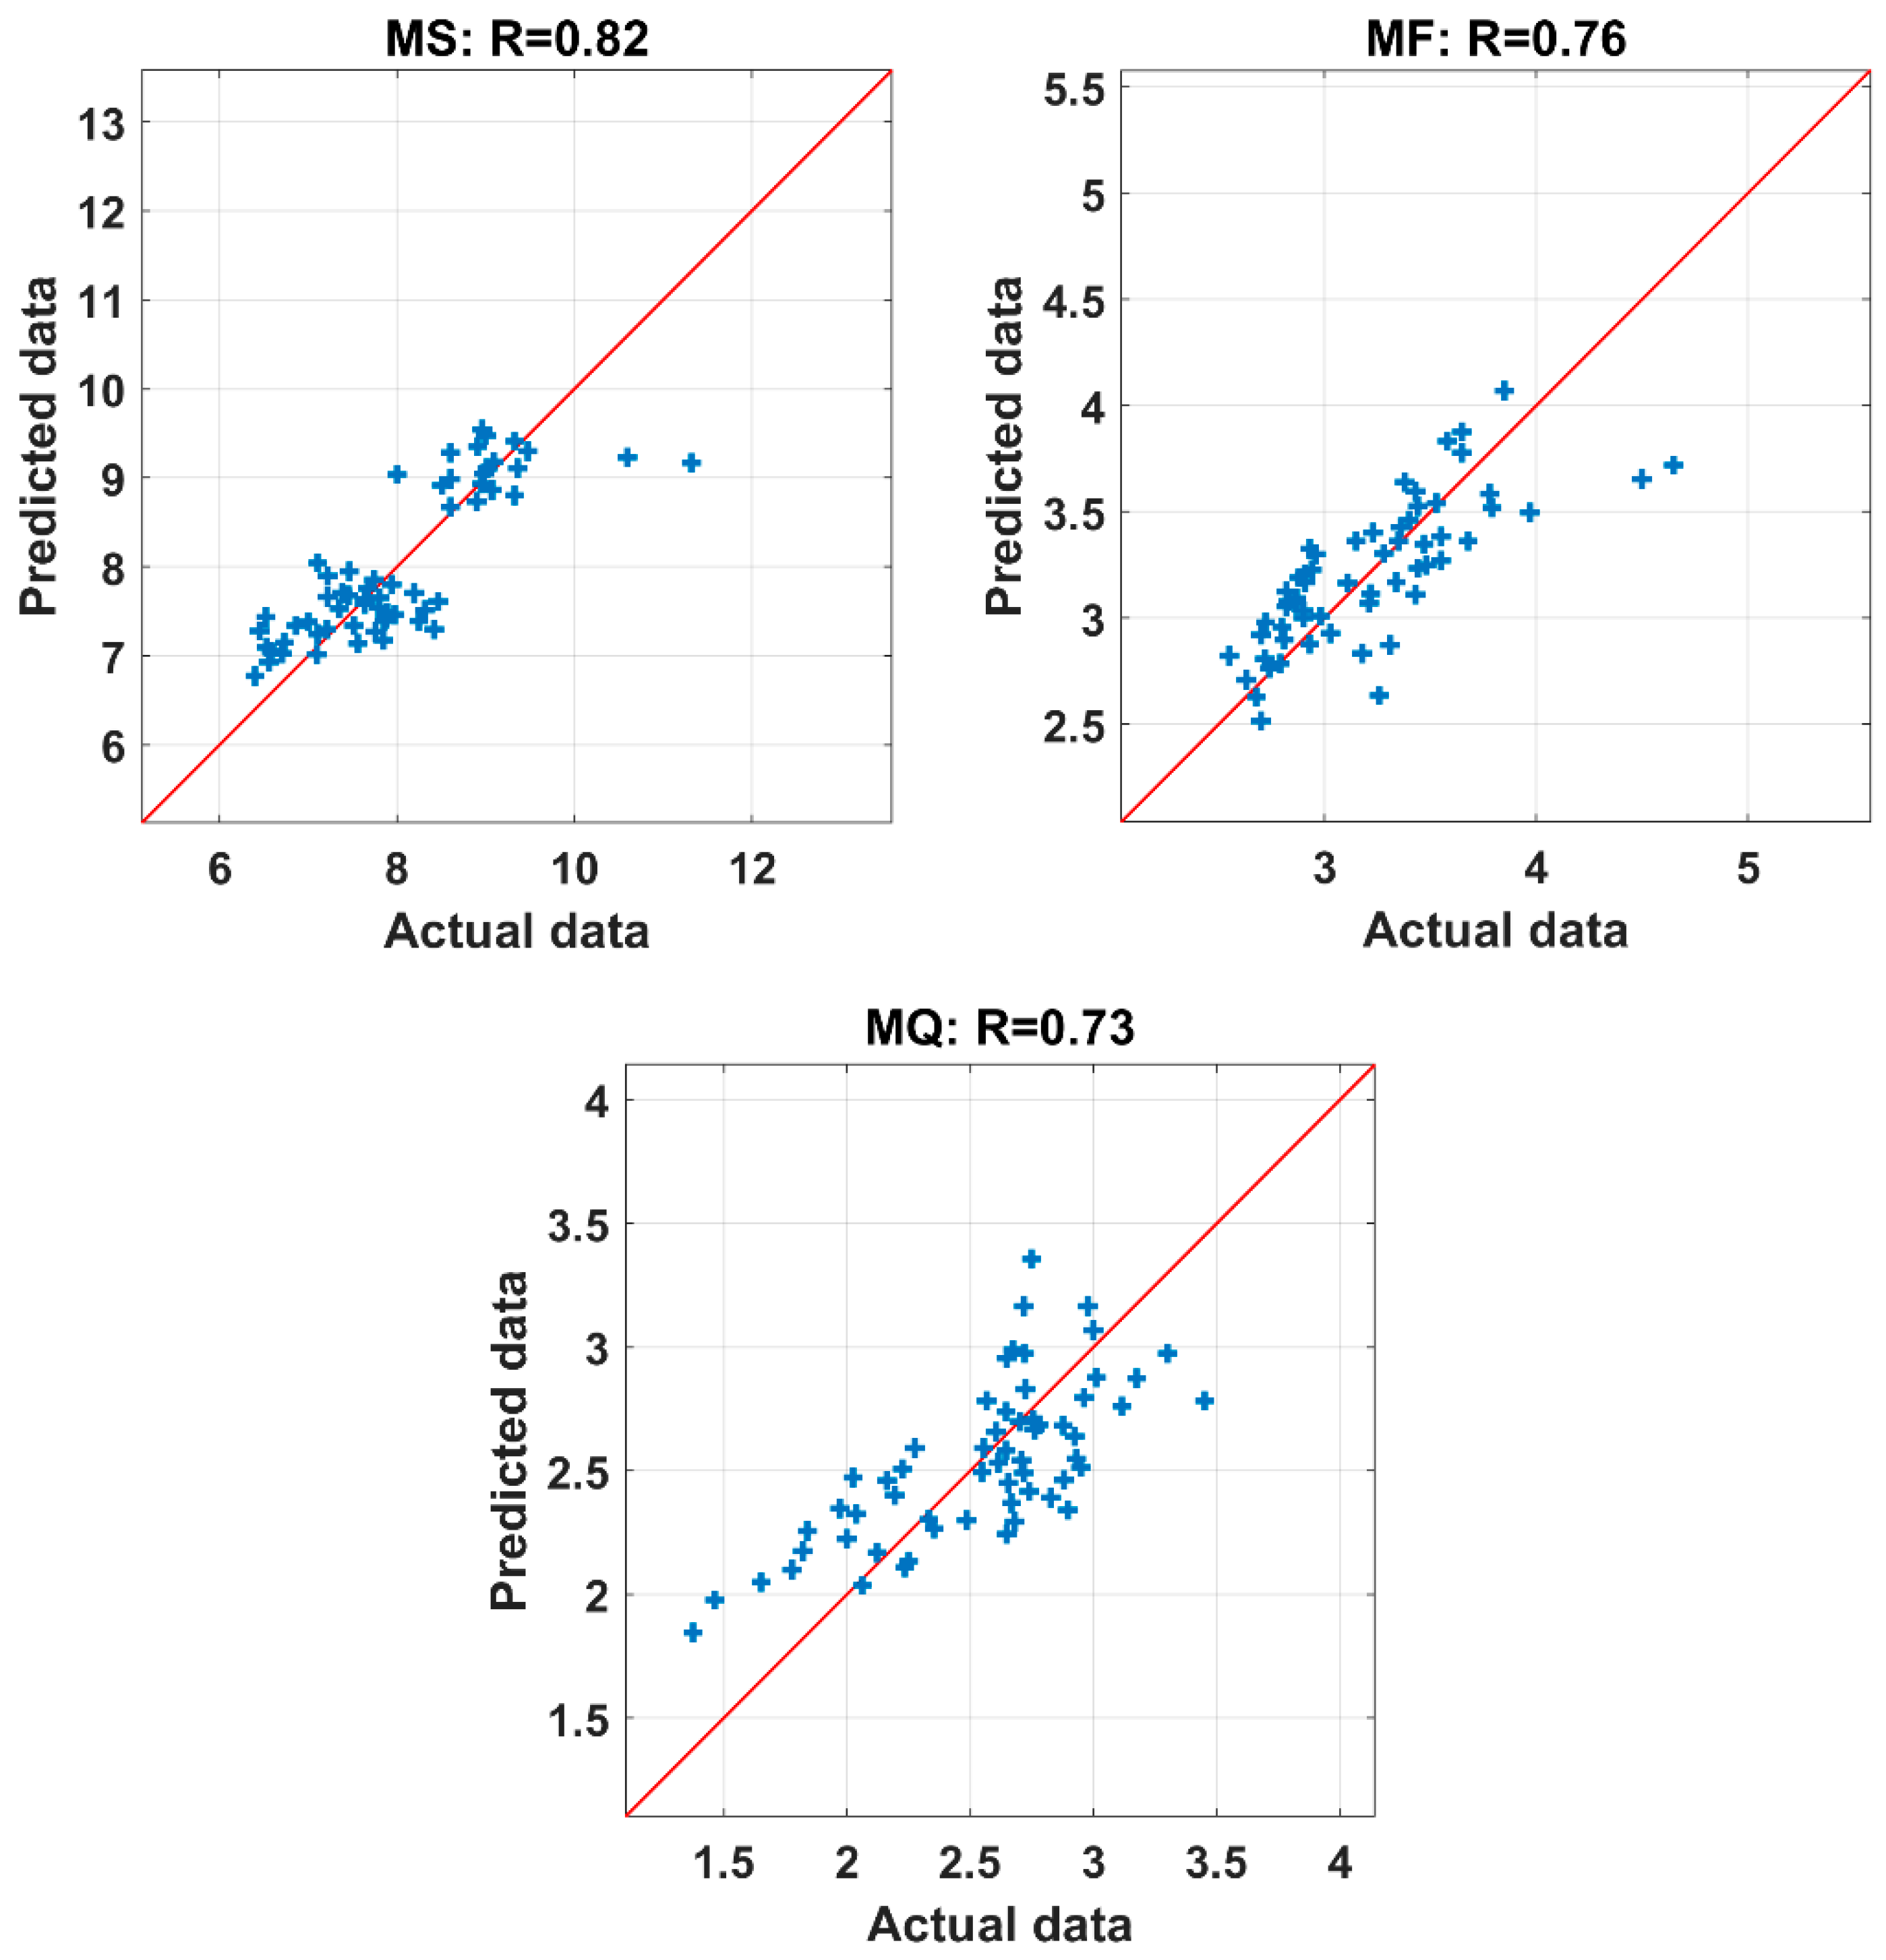
4.4. Comparison with Polynomial Regression Approach

This section demonstrates the effectiveness of AI approaches compared to classical statistical approach using polynomial regression technique. A first order polynomial equation was tested and selected as a reference to compare with SVM model. Such equation is in the following form:
O = AI 1 + BI 2 + CI 3 + DI 4 + E
where O refers to output parameters of the problem (i.e., MS, MF and MQ), whereas I1, I2, I3, I4 correspond to inputs parameters such as the contents of coarse aggregates, Bitumen 60/70, PMB I bitumen and cellulose fibers, respectively. Figure 10 shows the regression of the predicted outputs using the proposed equation (Equation (5)) with respects to the input dataset.
The obtained values of R were R = 0.82, 0.76 and 0.73 using Equation (5), whereas using SVM model, they were R = 0.9246, 0.9429 and 0.9085, for predicting MS, MF and MQ, respectively. The constants used in these equations are presented in Table 7.
It is worth noting that using a higher order polynomial equation could only increase the correlation coefficient by about 3%, but the results fluctuated over a wide range. It could be concluded that with a similar number of samples (i.e., 60 data points), using an AI approach is more efficient in predicting the complex nonlinear relation between the Marshall Parameters and the mixture components than classical regression techniques.

5. Conclusions

In this study, three AI models, namely GAANFIS, PSOANFIS and SVM, were developed and compared for predicting the MS, one of the most important parameters of SMA materials. The best model determined was then applied to predict other important parameters of the SMA materials such as the MF and MQ. For this purpose, a total of 60 groups of the SMA samples were fabricated in our laboratory and then used for generating datasets, which included input parameters (coarse aggregates, bitumen content and cellulose) and output parameter (MS or MF or MQ). Validation of the models was achieved using several criteria such as MAE, RMSE and R. In addition, converged statistical values of criteria deduced from 1000 Monte Carlo simulations were used to evaluate the robustness of the developed models under the variability of inputs.
The results showed that all the proposed AI models performed well for predicting the MS of the SMA materials, but the SVM (MAE = 0.3804, RMSE = 0.5978 and R = 0.8711) exhibited the best compared with other methods such as the PSOANFIS (MAE = 0.4361, RMSE = 0.6592 and R = 0.8692) and the GAANFIS (MAE = 0.5015, RMSE = 0.7213 and R = 0.8181). In addition, the robustness analysis results also showed that under input variability, the SVM was the most stable algorithm (MAE = 0.2741, RMSE = 0.4004 and R = 0.9246) compared with others. Other results also confirmed that the SVM has a good performance for predicting other Marshall Parameters (MF and MQ) of the SMA materials. Thus, it can be reasonably concluded that the SVM is a promising method for predicting the MS, MF and MQ of the SMA materials, which can be used to predict other properties of the SMA materials. It should be pointed out that the statistical robustness analysis in this study was according to the considered range of data but may provide efficient information to prepare experiments in further researches with a wider range of the components of SMA samples. It is also noticed that the dataset in this study is still limited (60 samples), therefore the short term perspective would be dedicated to produce more sophisticated dataset in order to develop more accurate and reliable AI models. In addition, the difference of the PSOANFIS and GAANFIS models was not significant in this study; thus, several tests namely Friedman and Wilcoxon sign rank tests should be carried out to find a better model. In general, the results of this study might help in selecting the suitable AI method for quick determination of several important properties of the SMA mixtures.

Author Contributions

Conceptualization, H.-L.N., T.-H.L., B.T.P. and H.-B.L.; Methodology, H.-L.N., T.-H.L., C.-T.P., T.-T.L., B.T.P. and H.-B.L.; Software, T.-T.L., B.T.P., and H.-B.L.; Validation, H.-L.N., T.-H.L., C.-T.P. and H.-B.L.; Formal Analysis, H.-L.N., T.-H.L., C.-T.P. and L.S.H.; Investigation, T.-H.L., C.-T.P., T.-T.L., L.S.H. and V.M.L; Resources, H.-L.N., T.-H.L., V.M.L., H.-B.L. and B.T.P.; Data Curation, H.-L.N. and T.-H.L.; Writing—Original Draft Preparation, H.-L.N., T.-H.L., C.-T.P., T.-T.L., L.S.H., V.M.L., B.T.P. and H.-B.L.; Writing—Review & Editing, B.T.P. and H.-B.L.; Visualization, T.-T.L., V.M.L., B.T.P. and H.-B.L.; Supervision, B.T.P. and H.-B.L.; Project Administration, H.-L.N., B.T.P. and H.-B.L.; Funding Acquisition, T.-H.L.

Funding

This research received no external funding.

Conflicts of Interest

The authors declare no conflict of interest.

Appendix A

Table A1. The dataset used in this study.
SamplesCoarse Aggregate (%)Bitumen 60/70 (%)Bitumen PMB I (%)Cellulose Fibers (%)MS (kN)MF (mm)MQ (kN/mm)
176.15.4006.4492.9002.224
276.16.0006.5303.5501.839
376.16.2006.7003.6801.821
476.16.5006.5503.9701.650
576.17.0006.4004.6501.376
676.15.400.27.3502.7202.702
776.16.000.27.5102.8302.654
876.16.200.27.7602.9102.667
976.16.500.27.8402.9602.649
1076.17.000.27.0903.4402.061
1176.15.400.37.7992.6332.962
1276.16.000.37.9702.7212.929
1376.16.200.38.2402.8602.881
1476.16.500.38.4202.9072.896
1576.17.000.37.5603.3602.250
1676.15.400.57.2202.7002.674
1776.16.000.57.3802.7902.645
1876.16.200.57.6302.9302.604
1976.16.500.57.7902.9802.614
2076.17.000.57.0003.4402.035
2171.1705.508.9502.8203.174
2271.1706.009.0643.1502.878
2371.1706.509.3243.4302.718
2471.1707.008.9013.5802.486
2571.1707.508.6013.8502.234
2671.1705.50.29.0883.0302.999
2771.1706.00.29.3613.1103.010
2871.1706.50.28.9763.2302.779
2971.1707.00.28.6043.3802.546
3071.1707.50.28.5053.6502.330
3171.1705.50.39.4713.1802.978
3271.1706.00.310.5953.2103.301
3371.1706.50.311.3183.2803.451
3471.1707.00.39.0113.5302.553
3571.1707.50.37.9993.6502.192
3671.1705.50.58.9553.2602.747
3771.1706.00.58.9943.3102.717
3871.1706.50.59.3263.4302.719
3971.1707.00.58.9043.4702.566
4071.1707.50.58.6053.7802.276
4174.25.7006.5203.2202.025
4274.26.0006.8603.4801.971
4374.26.3007.1003.5502.000
4474.26.6006.7303.7901.776
4574.26.9006.5804.5001.462
4674.25.700.27.4502.7002.759
4774.26.000.27.6302.8202.706
4874.26.300.27.8902.8802.740
4974.26.600.27.8502.9302.679
5074.26.900.27.2103.4002.121
5174.25.700.37.9402.5503.114
5274.26.000.38.1902.8002.925
5374.26.300.38.4602.8702.948
5474.26.600.38.3102.9402.827
5574.26.900.37.8803.3502.352
5674.25.700.57.1002.6802.649
5774.26.000.57.4602.7402.723
5874.26.300.57.7402.8102.754
5974.26.600.57.6702.9002.645
6074.26.900.57.2203.3402.162

References

  1. Scherocman, J.A. Stone Mastic Asphalt Reduces Rutting. Better Roads 1991, 61, 26–27. [Google Scholar]
  2. Van Thanh, D.; Feng, C.P. Study on Marshall and Rutting test of SMA at abnormally high temperature. Constr. Build. Mater. 2013, 47, 1337–1341. [Google Scholar] [CrossRef]
  3. Moghaddam, T.B.; Karim, M.R.; Abdelaziz, M. A review on fatigue and rutting performance of asphalt mixes. Sci. Res. Essays 2011, 6, 670–682. [Google Scholar]
  4. Al-Hadidy, A.I.; Tan, Y. Mechanistic analysis of ST and SBS-modified flexible pavements. Constr. Build. Mater. 2009, 23, 2941–2950. [Google Scholar] [CrossRef]
  5. Wu, S.; Xue, Y.; Ye, Q.; Chen, Y. Utilization of steel slag as aggregates for stone mastic asphalt (SMA) mixtures. Build. Environ. 2007, 42, 2580–2585. [Google Scholar] [CrossRef]
  6. Ahmadinia, E.; Zargar, M.; Karim, M.R.; Abdelaziz, M.; Shafigh, P. Using waste plastic bottles as additive for stone mastic asphalt. Mater. Des. 2011, 32, 4844–4849. [Google Scholar] [CrossRef]
  7. Asi, I.M. Laboratory comparison study for the use of stone matrix asphalt in hot weather climates. Constr. Build. Mater. 2006, 20, 982–989. [Google Scholar] [CrossRef]
  8. Aksoy, A.; Iskender, E.; Kahraman, H.T. Application of the intuitive k-NN Estimator for prediction of the Marshall Test (ASTM D1559) results for asphalt mixtures. Constr. Build. Mater. 2012, 34, 561–569. [Google Scholar] [CrossRef]
  9. Hınıslıoğlu, S.; Ağar, E. Use of waste high density polyethylene as bitumen modifier in asphalt concrete mix. Mater. Lett. 2004, 58, 267–271. [Google Scholar] [CrossRef]
  10. Nejad, F.M.; Aflaki, E.; Mohammadi, M.A. Fatigue behavior of SMA and HMA mixtures. Constr. Build. Mater. 2010, 24, 1158–1165. [Google Scholar] [CrossRef]
  11. Sheng, Y.; Li, H.; Guo, P.; Zhao, G.; Chen, H.; Xiong, R. Effect of Fibers on Mixture Design of Stone Matrix Asphalt. Appl. Sci. 2017, 7, 297. [Google Scholar] [CrossRef]
  12. Özgan, E.; Serin, S.; Kap, T. Multi-faceted investigation into the effects of hot-mix asphalt parameters on Marshall Stability. Constr. Build. Mater. 2013, 40, 419–425. [Google Scholar] [CrossRef]
  13. Asteris, P.G.; Nozhati, S.; Nikoo, M.; Cavaleri, L.; Nikoo, M. Krill herd algorithm-based neural network in structural seismic reliability evaluation. Mech. Adv. Mater. Struct. 2019, 26, 1146–1153. [Google Scholar] [CrossRef]
  14. Chen, H.; Asteris, P.G.; Jahed Armaghani, D.; Gordan, B.; Pham, B.T. Assessing Dynamic Conditions of the Retaining Wall: Developing Two Hybrid Intelligent Models. Appl. Sci. 2019, 9, 1042. [Google Scholar] [CrossRef]
  15. Asteris, P.G.; Nikoo, M. Artificial bee colony-based neural network for the prediction of the fundamental period of infilled frame structures. Neural Comput. Applic 2019, 1–11. [Google Scholar] [CrossRef]
  16. Asteris, P.G.; Roussis, P.C.; Douvika, M.G. Feed-Forward Neural Network Prediction of the Mechanical Properties of Sandcrete Materials. Sensors 2017, 17, 1344. [Google Scholar] [CrossRef] [PubMed]
  17. Asteris, P.G.; Kolovos, K.G. Self-compacting concrete strength prediction using surrogate models. Neural Comput. Applic 2019, 31, 409–424. [Google Scholar] [CrossRef]
  18. Cavaleri, L.; Asteris, P.G.; Psyllaki, P.P.; Douvika, M.G.; Skentou, A.D.; Vaxevanidis, N.M. Prediction of Surface Treatment Effects on the Tribological Performance of Tool Steels Using Artificial Neural Networks. Appl. Sci. 2019, 9, 2788. [Google Scholar] [CrossRef]
  19. Psyllaki, P.; Stamatiou, K.; Iliadis, I.; Mourlas, A.; Asteris, P.; Vaxevanidis, N. Surface treatment of tool steels against galling failure. In MATEC Web of Conference; EDP Sciences: Les Ulis, France, 2018; Volume 188, p. 04024. [Google Scholar]
  20. Asteris, P.G.; Tsaris, A.K.; Cavaleri, L.; Repapis, C.C.; Papalou, A.; Di Trapani, F.; Karypidis, D.F. Prediction of the Fundamental Period of Infilled RC Frame Structures Using Artificial Neural Networks. Available online: https://www.hindawi.com/journals/cin/2016/5104907/ (accessed on 17 July 2019).
  21. Kaseko, M.S.; Ritchie, S.G. A neural network-based methodology for pavement crack detection and classification. Transp. Res. Part C Emerg. Technol. 1993, 1, 275–291. [Google Scholar] [CrossRef]
  22. Eldin, N.N.; Senouci, A.B. Use of neural networks for condition rating of jointed concrete pavements. Adv. Eng. Softw. 1995, 23, 133–141. [Google Scholar] [CrossRef]
  23. Roberts, C.A.; Attoh-Okine, N.O. A comparative analysis of two artificial neural networks using pavement performance prediction. Comput.-Aided Civil Infrastruct. Eng. 1998, 13, 339–348. [Google Scholar] [CrossRef]
  24. Attoh-Okine, N.O. Grouping Pavement Condition Variables for Performance Modeling Using Self-Organizing Maps. Comput.-Aided Civil Infrastruct. Eng. 2001, 16, 112–125. [Google Scholar] [CrossRef]
  25. Ozgan, E. Fuzzy logic and statistical-based modelling of the Marshall Stability of asphalt concrete under varying temperatures and exposure times. Adv. Eng. Softw. 2009, 40, 527–534. [Google Scholar] [CrossRef]
  26. Ozgan, E. Artificial neural network based modelling of the Marshall Stability of asphalt concrete. Expert Syst. Appl. 2011, 38, 6025–6030. [Google Scholar] [CrossRef]
  27. Tapkın, S.; Çevik, A.; Uşar, Ü. Accumulated strain prediction of polypropylene modified marshall specimens in repeated creep test using artificial neural networks. Expert Syst. Appl. 2009, 36, 11186–11197. [Google Scholar] [CrossRef]
  28. Tapkın, S.; Çevik, A.; Uşar, Ü. Prediction of Marshall test results for polypropylene modified dense bituminous mixtures using neural networks. Expert Syst. Appl. 2010, 37, 4660–4670. [Google Scholar] [CrossRef]
  29. ASTM D6926. Standard Practice for Preparation of Asphalt Mixture Specimens Using Marshall Apparatus; ASTM International West Conshohocken: Conshohocken, PA, USA, 2016. [Google Scholar]
  30. ASTM. Standard Test Method for Marshall Stability and Flow of Asphalt Mixtures; ASTM D6927–15; ASTM International West Conshohocken: Conshohocken, PA, USA, 2015. [Google Scholar]
  31. Behnood, A.; Modiri Gharehveran, M. Morphology, rheology, and physical properties of polymer-modified asphalt binders. Eur. Polym. J. 2019, 112, 766–791. [Google Scholar] [CrossRef]
  32. Behnood, A.; Olek, J. Rheological properties of asphalt binders modified with styrene-butadiene-styrene (SBS), ground tire rubber (GTR), or polyphosphoric acid (PPA). Constr. Build. Mater. 2017, 151, 464–478. [Google Scholar] [CrossRef]
  33. Behnood, A.; Olek, J. Stress-dependent behavior and rutting resistance of modified asphalt binders: An MSCR approach. Constr. Build. Mater. 2017, 157, 635–646. [Google Scholar] [CrossRef]
  34. Jang, J.-R. ANFIS: Adaptive-network-based fuzzy inference system. IEEE Trans. Syst. ManCybern. 1993, 23, 665–685. [Google Scholar] [CrossRef]
  35. Dao, D.V.; Trinh, S.H.; Ly, H.-B.; Pham, B.T. Prediction of Compressive Strength of Geopolymer Concrete Using Entirely Steel Slag Aggregates: Novel Hybrid Artificial Intelligence Approaches. Appl. Sci. 2019, 9, 1113. [Google Scholar] [CrossRef]
  36. Takagi, T.; Sugeno, M. Fuzzy identification of systems and its applications to modeling and control. In Readings in Fuzzy Sets for Intelligent Systems; Elsevier: Amsterdam, The Netherlands, 1993; pp. 387–403. [Google Scholar]
  37. Johari, A.; Javadi, A.A.; Habibagahi, G. Modelling the mechanical behaviour of unsaturated soils using a genetic algorithm-based neural network. Comput. Geotech. 2011, 38, 2–13. [Google Scholar] [CrossRef]
  38. Holland, J. Adaptation in Natural and Artificial Systems; University of Michigan Press: Ann Arbor, MI, USA, 1975. [Google Scholar]
  39. Dao, D.V.; Ly, H.-B.; Trinh, S.H.; Le, T.-T.; Pham, B.T. Artificial Intelligence Approaches for Prediction of Compressive Strength of Geopolymer Concrete. Materials 2019, 12, 983. [Google Scholar] [CrossRef]
  40. Kennedy, J.; Eberhart, R. Particle swarm optimization. In Proceedings of the ICNN’95—International Conference on Neural Networks, Perth, Western Australia, 27 November–1 December 1995; Volume 4, pp. 1942–1948. [Google Scholar]
  41. Shi, Y.; Eberhart, R.C. Empirical study of particle swarm optimization. In Proceedings of the 1999 Congress on Evolutionary Computation-CEC99 (Cat. No. 99TH8406), Washington, DC, USA, 6–9 July 1999; IEEE: Piscataway, NJ, USA, 1999; Volume 3, pp. 1945–1950. [Google Scholar]
  42. Vapnik, V. The Nature of Statistical Learning Theory, 2nd ed.; Springer: New York, NY, USA, 1999; ISBN 978-0-387-98780-4. [Google Scholar]
  43. Bui, D.T.; Tuan, T.A.; Klempe, H.; Pradhan, B.; Revhaug, I. Spatial prediction models for shallow landslide hazards: A comparative assessment of the efficacy of support vector machines, artificial neural networks, kernel logistic regression, and logistic model tree. Landslides 2016, 13, 361–378. [Google Scholar]
  44. Pham, B.T.; Nguyen, M.D.; Dao, D.V.; Prakash, I.; Ly, H.-B.; Le, T.-T.; Ho, L.S.; Nguyen, K.T.; Ngo, T.Q.; Hoang, V.; et al. Development of artificial intelligence models for the prediction of Compression Coefficient of soil: An application of Monte Carlo sensitivity analysis. Sci. Total Environ. 2019, 679, 172–184. [Google Scholar] [CrossRef]
  45. Le, L.M.; Ly, H.-B.; Pham, B.T.; Le, V.M.; Pham, T.A.; Nguyen, D.-H.; Tran, X.-T.; Le, T.-T. Hybrid Artificial Intelligence Approaches for Predicting Buckling Damage of Steel Columns Under Axial Compression. Materials 2019, 12, 1670. [Google Scholar] [CrossRef]
  46. Ly, H.-B.; Le, L.M.; Duong, H.T.; Nguyen, T.C.; Pham, T.A.; Le, T.-T.; Le, V.M.; Nguyen-Ngoc, L.; Pham, B.T. Hybrid Artificial Intelligence Approaches for Predicting Critical Buckling Load of Structural Members under Compression Considering the Influence of Initial Geometric Imperfections. Appl. Sci. 2019, 9, 2258. [Google Scholar] [CrossRef]
  47. Ly, H.-B.; Desceliers, C.; Le, L.M.; Le, T.-T.; Pham, B.T.; Nguyen-Ngoc, L.; Doan, V.T.; Le, M. Quantification of Uncertainties on the Critical Buckling Load of Columns under Axial Compression with Uncertain Random Materials. Materials 2019, 12, 1828. [Google Scholar] [CrossRef]
  48. Soize, C. Uncertainty Quantification: An Accelerated Course with Advanced Applications in Computational Engineering; Interdisciplinary Applied Mathematics; Springer International Publishing: Berlin, Germany, 2017; ISBN 978-3-319-54338-3. [Google Scholar]
  49. Ly, H.-B.; Monteiro, E.; Le, T.-T.; Le, V.M.; Dal, M.; Regnier, G.; Pham, B.T. Prediction and Sensitivity Analysis of Bubble Dissolution Time in 3D Selective Laser Sintering Using Ensemble Decision Trees. Materials 2019, 12, 1544. [Google Scholar] [CrossRef]
  50. Stochastic Models of Uncertainties in Computational Mechanics; Christian, P.D.S. (Ed.) Amer Society of Civil Engineers: Reston, VA, USA, 2012; ISBN 978-0-7844-1223-7. [Google Scholar]
  51. Le, T.T.; Guilleminot, J.; Soize, C. Stochastic continuum modeling of random interphases from atomistic simulations. Application to a polymer nanocomposite. Comput. Methods Appl. Mech. Eng. 2016, 303, 430–449. [Google Scholar] [CrossRef] [Green Version]
  52. Guilleminot, J.; Le, T.T.; Soize, C. Stochastic framework for modeling the linear apparent behavior of complex materials: Application to random porous materials with interphases. Acta Mech. Sin. 2013, 29, 773–782. [Google Scholar] [CrossRef] [Green Version]
  53. Ahneman, D.T.; Estrada, J.G.; Lin, S.; Dreher, S.D.; Doyle, A.G. Predicting reaction performance in C–N cross-coupling using machine learning. Science 2018, 360, 186–190. [Google Scholar] [CrossRef]
Figure 1. Mixture gradation aggregate for the SMA samples.
Applsci 09 03172 g001
Figure 2. The SMA samples preparation and testing: (a) Asphalt mixer, (b) Marshall Automatic Compaction machine, (c) The SMA samples in hot water bath, and (d) Automatic Stability Testing machine.
Applsci 09 03172 g002
Figure 3. Histogram of the input parameters in this study for: (a) coarse aggregates; (b) Bitumen 60/70; (c) PMB I Bitumen and (d) cellulose fibers.
Applsci 09 03172 g003
Figure 4. Histogram of the output parameters considered in this study for: (a) Marshall Stability (MS); (b) Marshall Flow (MF) and (c) Marshall Quotient (MQ).
Applsci 09 03172 g004
Figure 5. Methodological chart of the present study.
Applsci 09 03172 g005
Figure 6. Correlation results of actual and predicted the MS for: (a) training PSOANFIS; (b) testing PSOANFIS; (c) training GAANFIS; (d) testing GAANFIS; (e) training SVM and (f) testing SVM.
Applsci 09 03172 g006
Figure 7. Values of R over 1000 Monte Carlo simulations in case of (a) testing PSOANFIS, (b) testing GAANFIS and (c) testing SVM.
Applsci 09 03172 g007
Figure 8. Statistical results over 774 Monte Carlo simulations using the PSOANFIS, GAANFIS and SVM for IC in case of: (a) R; (c) RMSE and (e) MAE along with the probability density distribution of (b) R, (d) RMSE and (f) MAE.
Applsci 09 03172 g008
Figure 9. Statistical results of RMSE, MAE, R over 900 Monte Carlo simulation using SVM in case of: (a) Normalized IC for predicted MF; (b) Normalized IC for predicted MQ.
Applsci 09 03172 g009
Figure 10. Correlation coefficient of the regression of the actual and predicted values.
Applsci 09 03172 g010
Table 1. Physical properties of coarse, fine aggregates and mineral filler.
PropertiesValue
Coarse aggregate
Los Angeles abrasion (%)16.22
Flat and Elongated (3 to 1) (%)8.80
Water absorption (%)0.53
Bulk specific density (g/cm3)2.670
Crushed content (one face) (%)100
Crushed content (two faces) (%)100
Fine aggregate
Water absorption (%)0.79
Bulk specific density (g/cm3)2.667
Mineral filler
Bulk specific density (g/cm3)2.720
Table 2. Physical properties of Bitumen 60/70 and PMB I bitumen.
PropertiesBitumen 60/70PMB I
Specific gravity at 25 °C (g/cm3)1.0301.027
Penetration at 25 °C (0.1 mm)64.548
Flash point (°C)310248
Softening point (°C)48.167.5
Ductility at 25 °C (cm)>100>100
Table 3. Properties of cellulose fiber.
PropertiesTest Value
Cellulose content (%)85%
Length (mm)<5
Diameter (µm)46
Density (g/m3)1.6
pH Value6.5
Table 4. Statistical analysis of the inputs and outputs in this study.
ParametersUnitMinimumMaximumAverageStD *Median
Coarse aggregates(%)71.1776.173.822.0574.2
Bitumen 60/70(%)07.04.173.006.00
PMB I(%)07.52.173.120
Cellulose fiber(%)00.50.250.180.25
MS(kN)6.411.327.991.027.85
MF(mm)2.554.653.210.443.20
MQ(kN/mm)1.383.452.540.442.65
StD * = Standard Deviation.
Table 5. Summary of prediction capability for the training and testing parts using PSOANFIS, GAANFIS and SVM.
PartMethodRRMSEMAE
TrainingPSOANFIS0.92660.34290.2134
GAANFIS0.91110.38340.2655
SVM0.91100.37810.2609
TestingPSOANFIS0.86920.65920.4361
GAANFIS0.81810.72130.5015
SVM0.87110.59780.3804
Table 6. The robustness of PSOANFIS, GAANFIS and SVM for testing part.
MethodMeanRStdRMeanRMSEStdRMSEMeanMAEStdMAE
PSOANFIS0.86550.07840.54850.19370.37820.0982
GAANFIS0.84630.07230.57690.14470.42060.0889
SVM0.92460.03760.40040.11580.27410.0600
Table 7. The constants used to fit MS, MF and MQ using Equation (5), along with the corresponding correlation coefficient.
OutputABCDER (Equation (5))R(SVM)
MS−0.13−0.32−0.131.2218.800.820.92
MF0.010.450.47−0.97−0.280.760.94
MQ−0.05−0.41−0.380.978.380.730.91

