Article

Development of High-Efficiency, High-Speed and High-Pressure Ambient Temperature Filling System Using Pulse Volume Measurement

1
Department of Mechanical Engineering, Chungang University, Seoul-si 06974, Korea
2
Institute of Biotechnology and Bioengineering, Sungkyunkwan University, Suwon-si 16419, Korea
*
Authors to whom correspondence should be addressed.
Appl. Sci. 2019, 9(12), 2491; https://doi.org/10.3390/app9122491
Submission received: 27 April 2019 / Revised: 6 June 2019 / Accepted: 17 June 2019 / Published: 19 June 2019

Abstract

:
Adjusting the filling pressure is essential to fit the final gas volume when charging a carbonated beverage with high pressure. However, in the previous mechanical carbonated ambient filling system, it was difficult to control and monitor the charging conditions such as pressure, temperature and flow rate. In this study, we have developed a high efficiency carbonated ambient filling system capable of high speed and high pressure filling, by using a pulse type electronic flow-meter. The response speed characteristics of the M(BC) and F(MH) series valves were investigated. LMS Imagine.Lab Amesim (Siemens PLM Software) was used to calculate the charging and discharging time of the system under a high CO2 gas pressure condition. The quantitative and precise charging system was implemented with the change of filling time and monitoring/controlling/correction of flow rate. Moreover, a dual controller of the high-speed pulse output was established and a high-speed data processing/flow rate charging algorithm was applied in the system. The filling variation of the system was in the range of ±3 gram(gr) (standard deviation 0.57). The developed system could be applied to improve the quality of goods and economic feasibility at various industrial sectors.

1. Introduction

Carbonated beverage fillers can be classified into mechanical and electric fillers. It is difficult to fill an exact amount with conventional mechanical fillers, which adjust to the filling height due to the bottles having different levels of expansion when filling under a high pressure (approximately 3.4 kg/cm2·G or above), and give a low filling yield value due to excessive filling compared to the standard amount [1]. Because of this problem, filling machines with an electronic flowmeter that can fill the correct amount regardless of the expansion level of the filled bottle under a high temperature and pressure have been developed and are being commercialized [2]. However, the pulse output type electronic flowmeter has difficulties in calculating a high-speed pulse output during high-speed filling, so it is difficult to achieve highly accurate filling [3,4]. In this study, a filling system using a ‘pulse output type flow meter’ was designed. The performance of a mass flowmeter is higher than that of an electronic flowmeter. However, in our case, more than 100 flowmeters are required per filling machine, and so the electronic flowmeter was selected as the optimum design considering price competitiveness.
As a result of analyzing the performance of the electronic flowmeter (pulse output, signal distortion of the output waveform, repetition accuracy, etc.), it was found that the pulse signal output waveform was distorted at low-speed filling (filling completion time or filling start time). In order to solve this problem, ‘Low Flow CUT-OFF’ and ‘Pressure shock’ were set as the function of the electronic flowmeter to eliminate the instability at low flow rates and to improve flow measurement accuracy. In addition, the accuracy of the system depends on the response speed of the solenoid valve, diaphragm valve, the flowmeter and the control algorithm. Therefore, in this study, we designed a carbonated beverage filling system at ambient temperature that enables high-speed and high-pressure filling with a filling algorithm, by pressure compensation in the high-speed pulse output flow rate measuring type [5].

2. Hardware Composition

2.1. Component of the Flow Rate Filling System

In this study, the authors designed and built a flow rate filling valve in order to understand the filling characteristics of a high-speed carbonated soft drink filling system as shown in Figure 1 and used an electronic flow meter to conduct tests to understand the characteristics of flow supply and filling. The authors succeeded in high flow rate filling using a pulse output type flow meter. By adding a dualizing control system, the system was constructed so that it could charge at a high speed [5].

2.2. Design of Filling Valve

The conventional filling systems utilized instruments based on the theory of mechanism and fluid dynamics and were composed of the counter pressure process, filling valve opening process, filing process, filing valve closing process, and snifting process (Oh 2016). However, the filling method using a flow meter measures the filling flow rate of the filling valve and converts the electric signal into pneumatic pressure, which should open/close the filling valve or remove the residual pressure, etc. Therefore, even if the flow rate is measured precisely, there will still be a difference between the desired filling amount and the actual filling amount due to the time delay in the operating parts powered by a pneumatic system. Therefore, it is necessary to develop a high precision pneumatic control filling valve that has a higher response speed. As shown in Figure 1, a filler that uses a flow meter measures the filling volume with the flow meter and uses the electric signal from the flow meter to close the filling valve. Therefore, it is not possible to use the conventional, mechanical type. For this reason, it is necessary to operate each filling mode electrically in accordance with a series of pre-determined steps. In theory, if the system is filling at a rate of 150 gr/sec and there is a 30 ms time delay in the operation time, there will be a 4.5 gr difference in the filling volume. In order to reduce this difference, the authors added a low-speed filling control valve when it is close to the target filling level, and performed low-speed filling to reduce the gap.

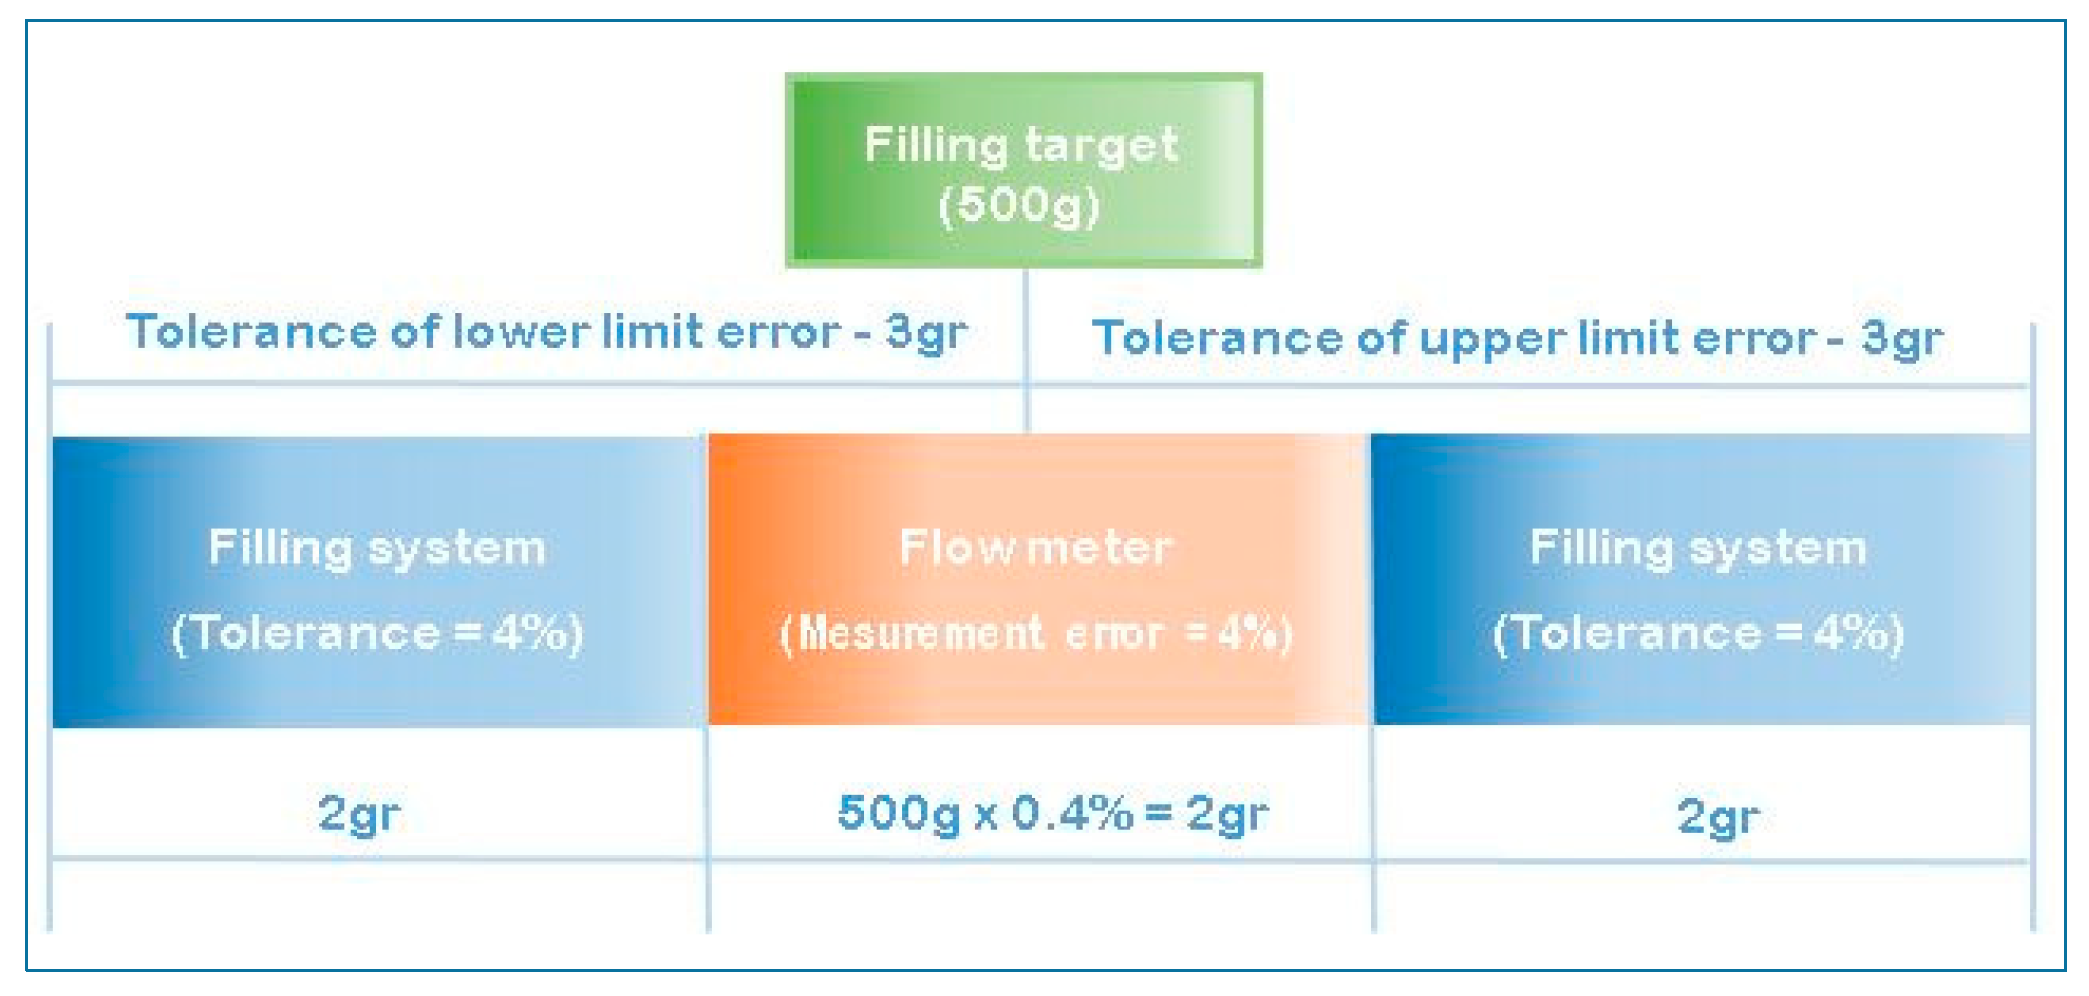
3. Filling Precision Design

3.1. The Control Method to Increase the Precision Level of Filling

Figure 2 shows the result of an analysis on the target filling rate precision level of ±3 gr for the filling performance.
After excluding the error in the flow meter itself, the filling system has an allowance of only ±2 gr. If the filling valve fills at a rate of 150 gr/sec, an allowance of 2 gr will give an allowance window of operation delay that is 13.3 ms (which is 0.013 s).
We selected the XGK model in the XGT series of LS Company, which has fast data processing speed, as the PLC of the controller. At the initial design stage, we could not increase the resolution of the flowmeter because one PLC CPU could not process a large amount of input/output and control related programs. Therefore, in order to improve the pulse processing speed by distributing the CPU load in the controller, the local PLC, controlling only the flow meter and the filling valve control unit, and the main PLC, controlling the remaining machine control unit, were constituted.

3.2. Control Algorithm to Increase the Precision Level of Filling

The pulse flow rate measurement filling system has more I/Os (PLC inputs and outputs) compared to the conventional mechanical filling systems. Therefore, it has several times more control steps. This will burden the PLC CPU and affect the response rate of the valve. Therefore, it was necessary to develop a new control algorithm in order to improve this issue.

3.2.1. Structured Function Block Program

A formalized program was developed using a structured function block program. With a module program, the number of steps in the program was reduced, and the system was easier to debug, while having less program errors. By grouping the module program for each valve unit, it was possible to standardize the program and realize the core algorithms in blocks. The structured function block program could modulate the existing sequence commands program to reduce the number of program steps. This resulted in a shorter scan time, improving the filling precision and accuracy in the iteration.

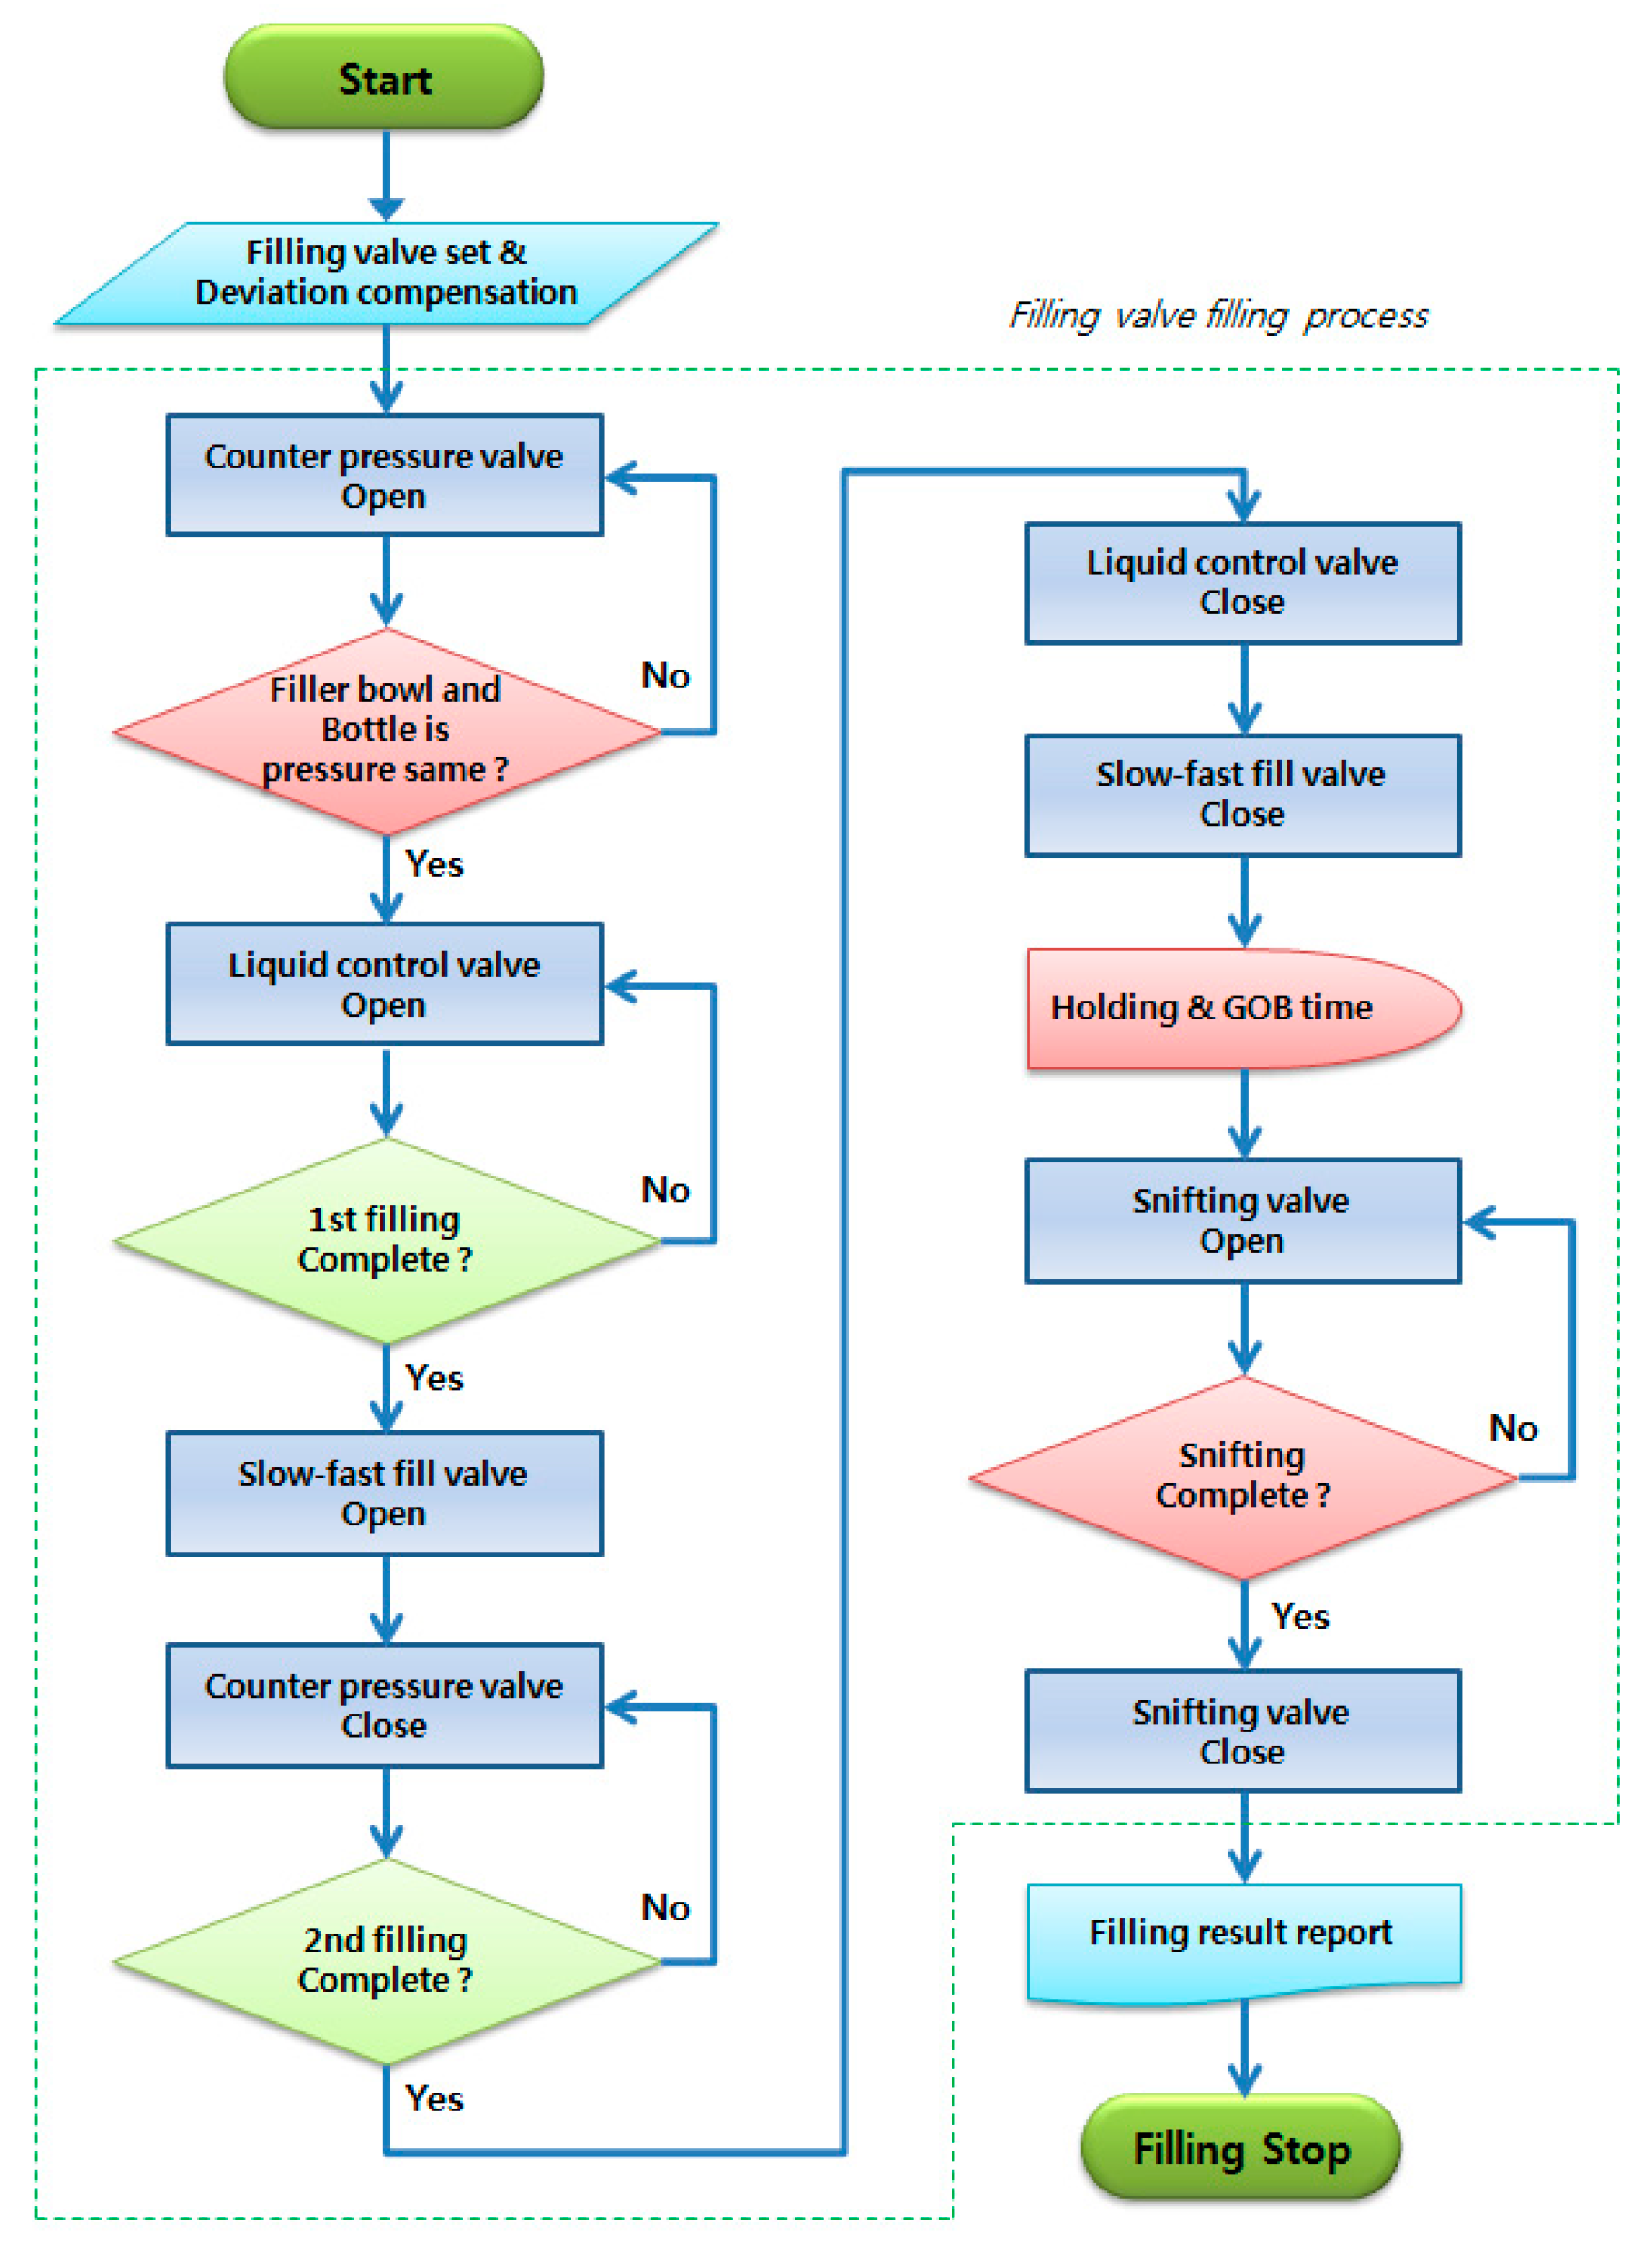
3.2.2. Filling Processing Algorithm

The filling processing algorithm of the filler using the pulse flow rate method is as shown in the flow chart in Figure 3. According to the filling process algorithm in Figure 3, the filling valve counter pressure is a process where the pressure of the filler bowl and the bottle is equalized [5]. The filling valve and liquid valve is the process where the main valve, which fills up the bottle, is opened. The filling valve slow-fast fill valve is the process where the filling speed is slowed down from the initial high speed to a lower speed when the bottle is almost full (80% full, if the target volume is 500 gr, at 400 gr). The snifting valve is a process where the residual pressure inside the bottle is removed after filling is over [5]. When filling a bottle, the key element is controlling the level of the bottle and the pressure. In a situation where the level and pressure should be controlled as in carbonate filling, a small amount of change in the pressure can significantly affect the filling precision.
Figure 4 shows the interface, which shows and configures the PID (A piping and instrumentation diagram) of the level and pressure of the filling bottle. Furthermore, for the controller, the automatic tuning configuration and programs were implemented in order to optimize the filling bottle pressure and level with each pressure and level control PID value. Therefore, it is possible to find the optimized PID value with a single touch. The pressure control is implemented as shown above. Therefore, the system is capable of controlling the pressure up to ±0.1 kg/cm2 and the level ±3 mm.

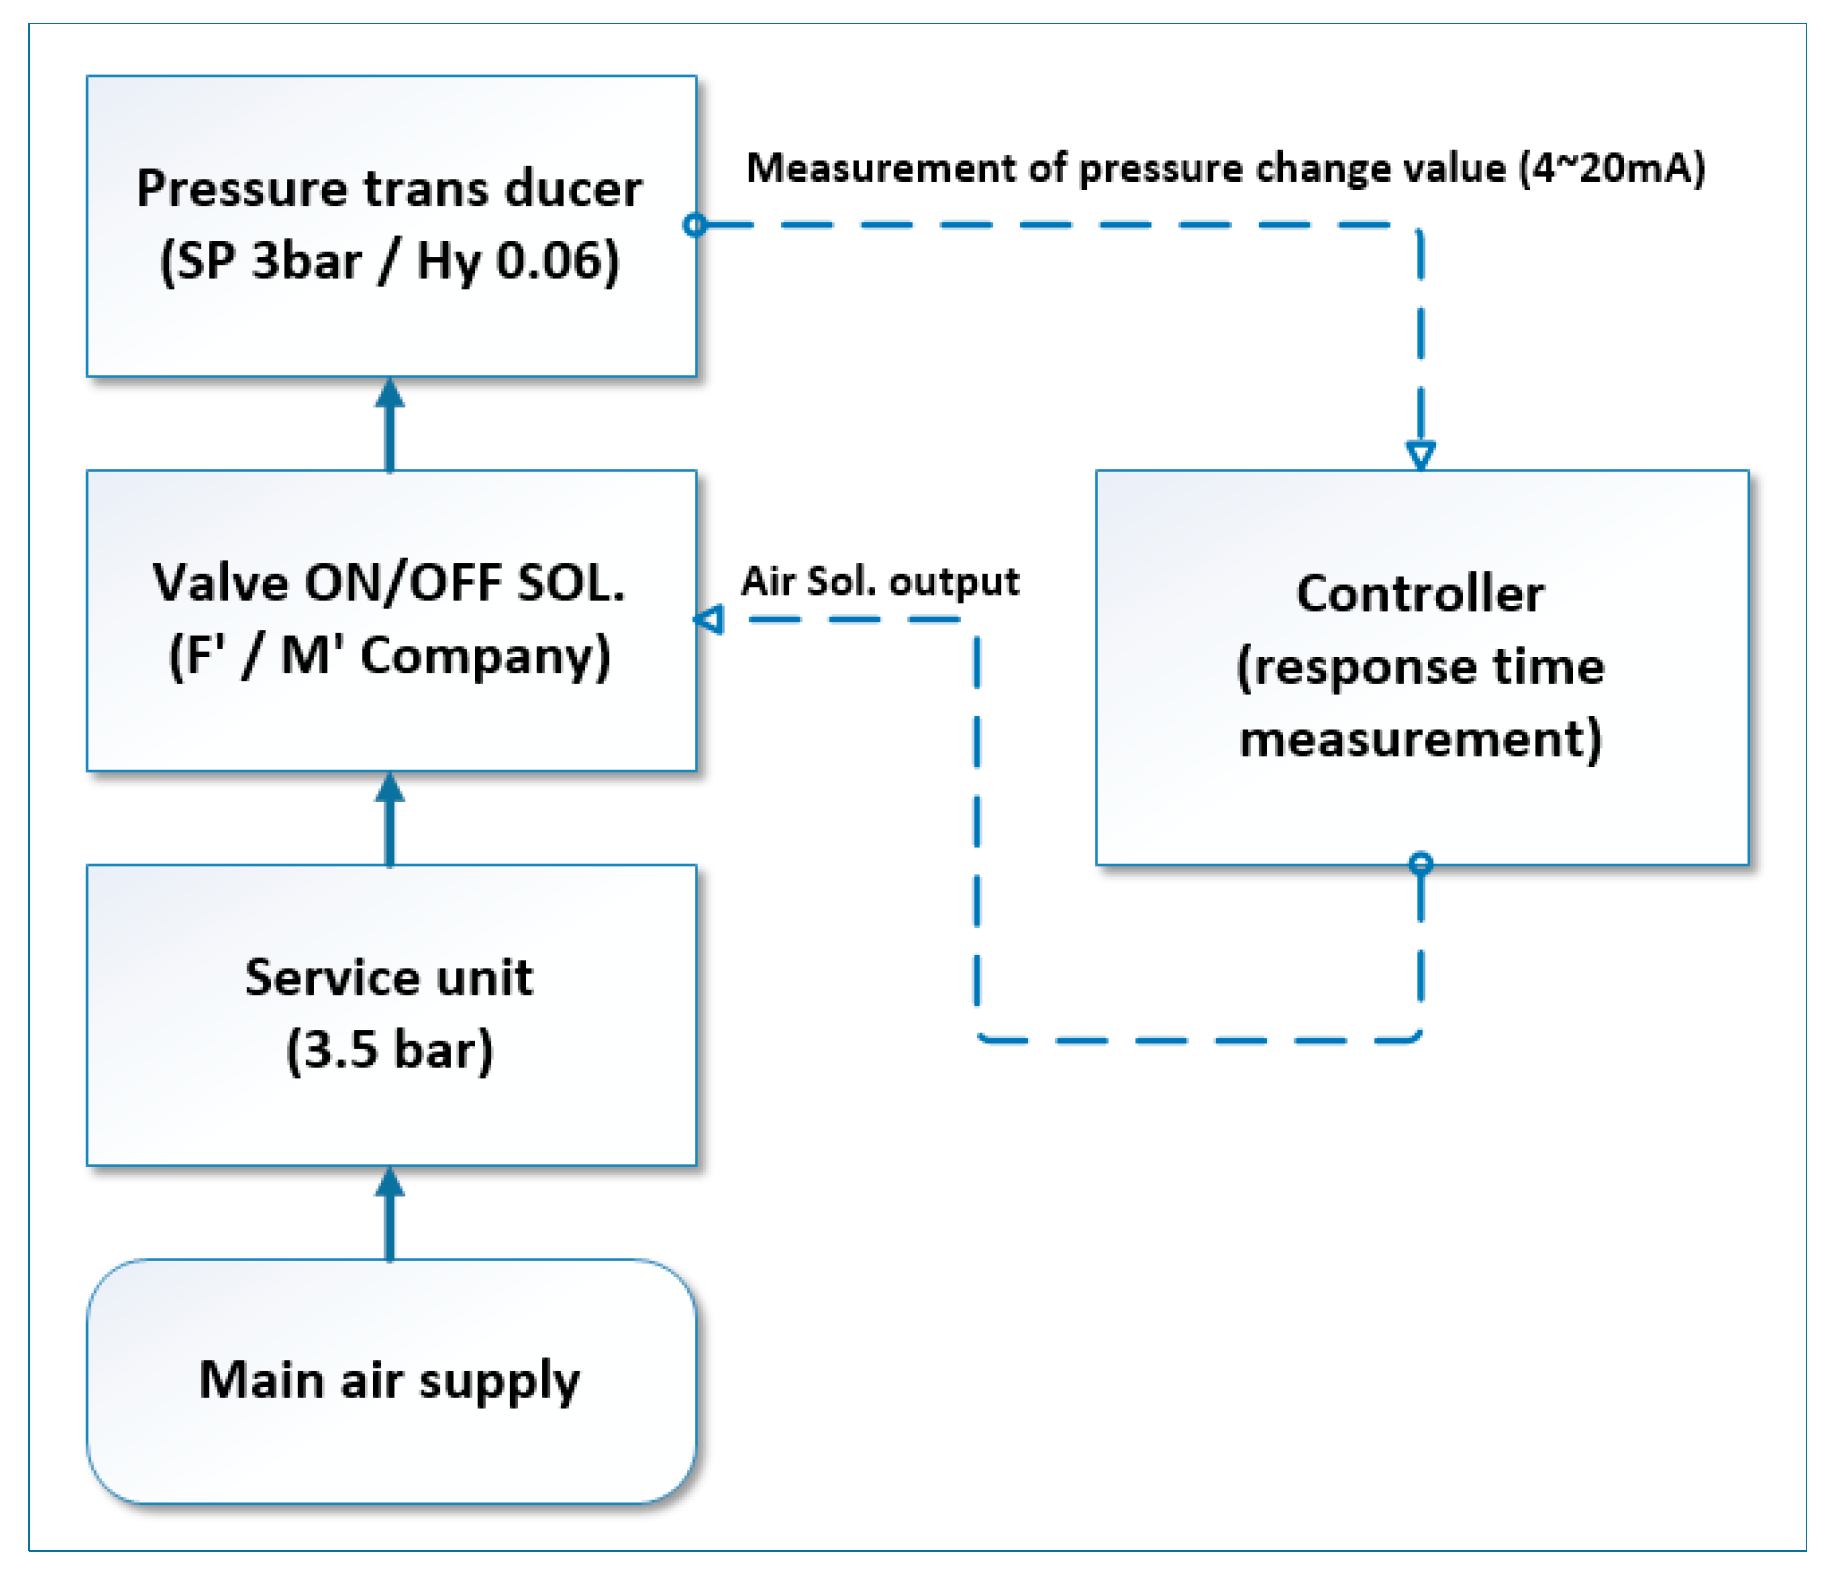
3.3. Experimental Design of Filling Valve Response

In designing the controlling part, the solenoid valve response rate is considered to be important. Therefore, the solenoid valve response time that is related to the control part is considered as important. The response time characteristics of the F company (Germany) and M company (USA) solenoid valve are shown in Figure 5.
As shown in Figure 5, the response rate of the filling valve was assessed by measuring the time taken for detecting the pressure signal at the valve outlet after the solenoid valve is activated by giving an operation signal to the said valve.

4. Results and Discussion

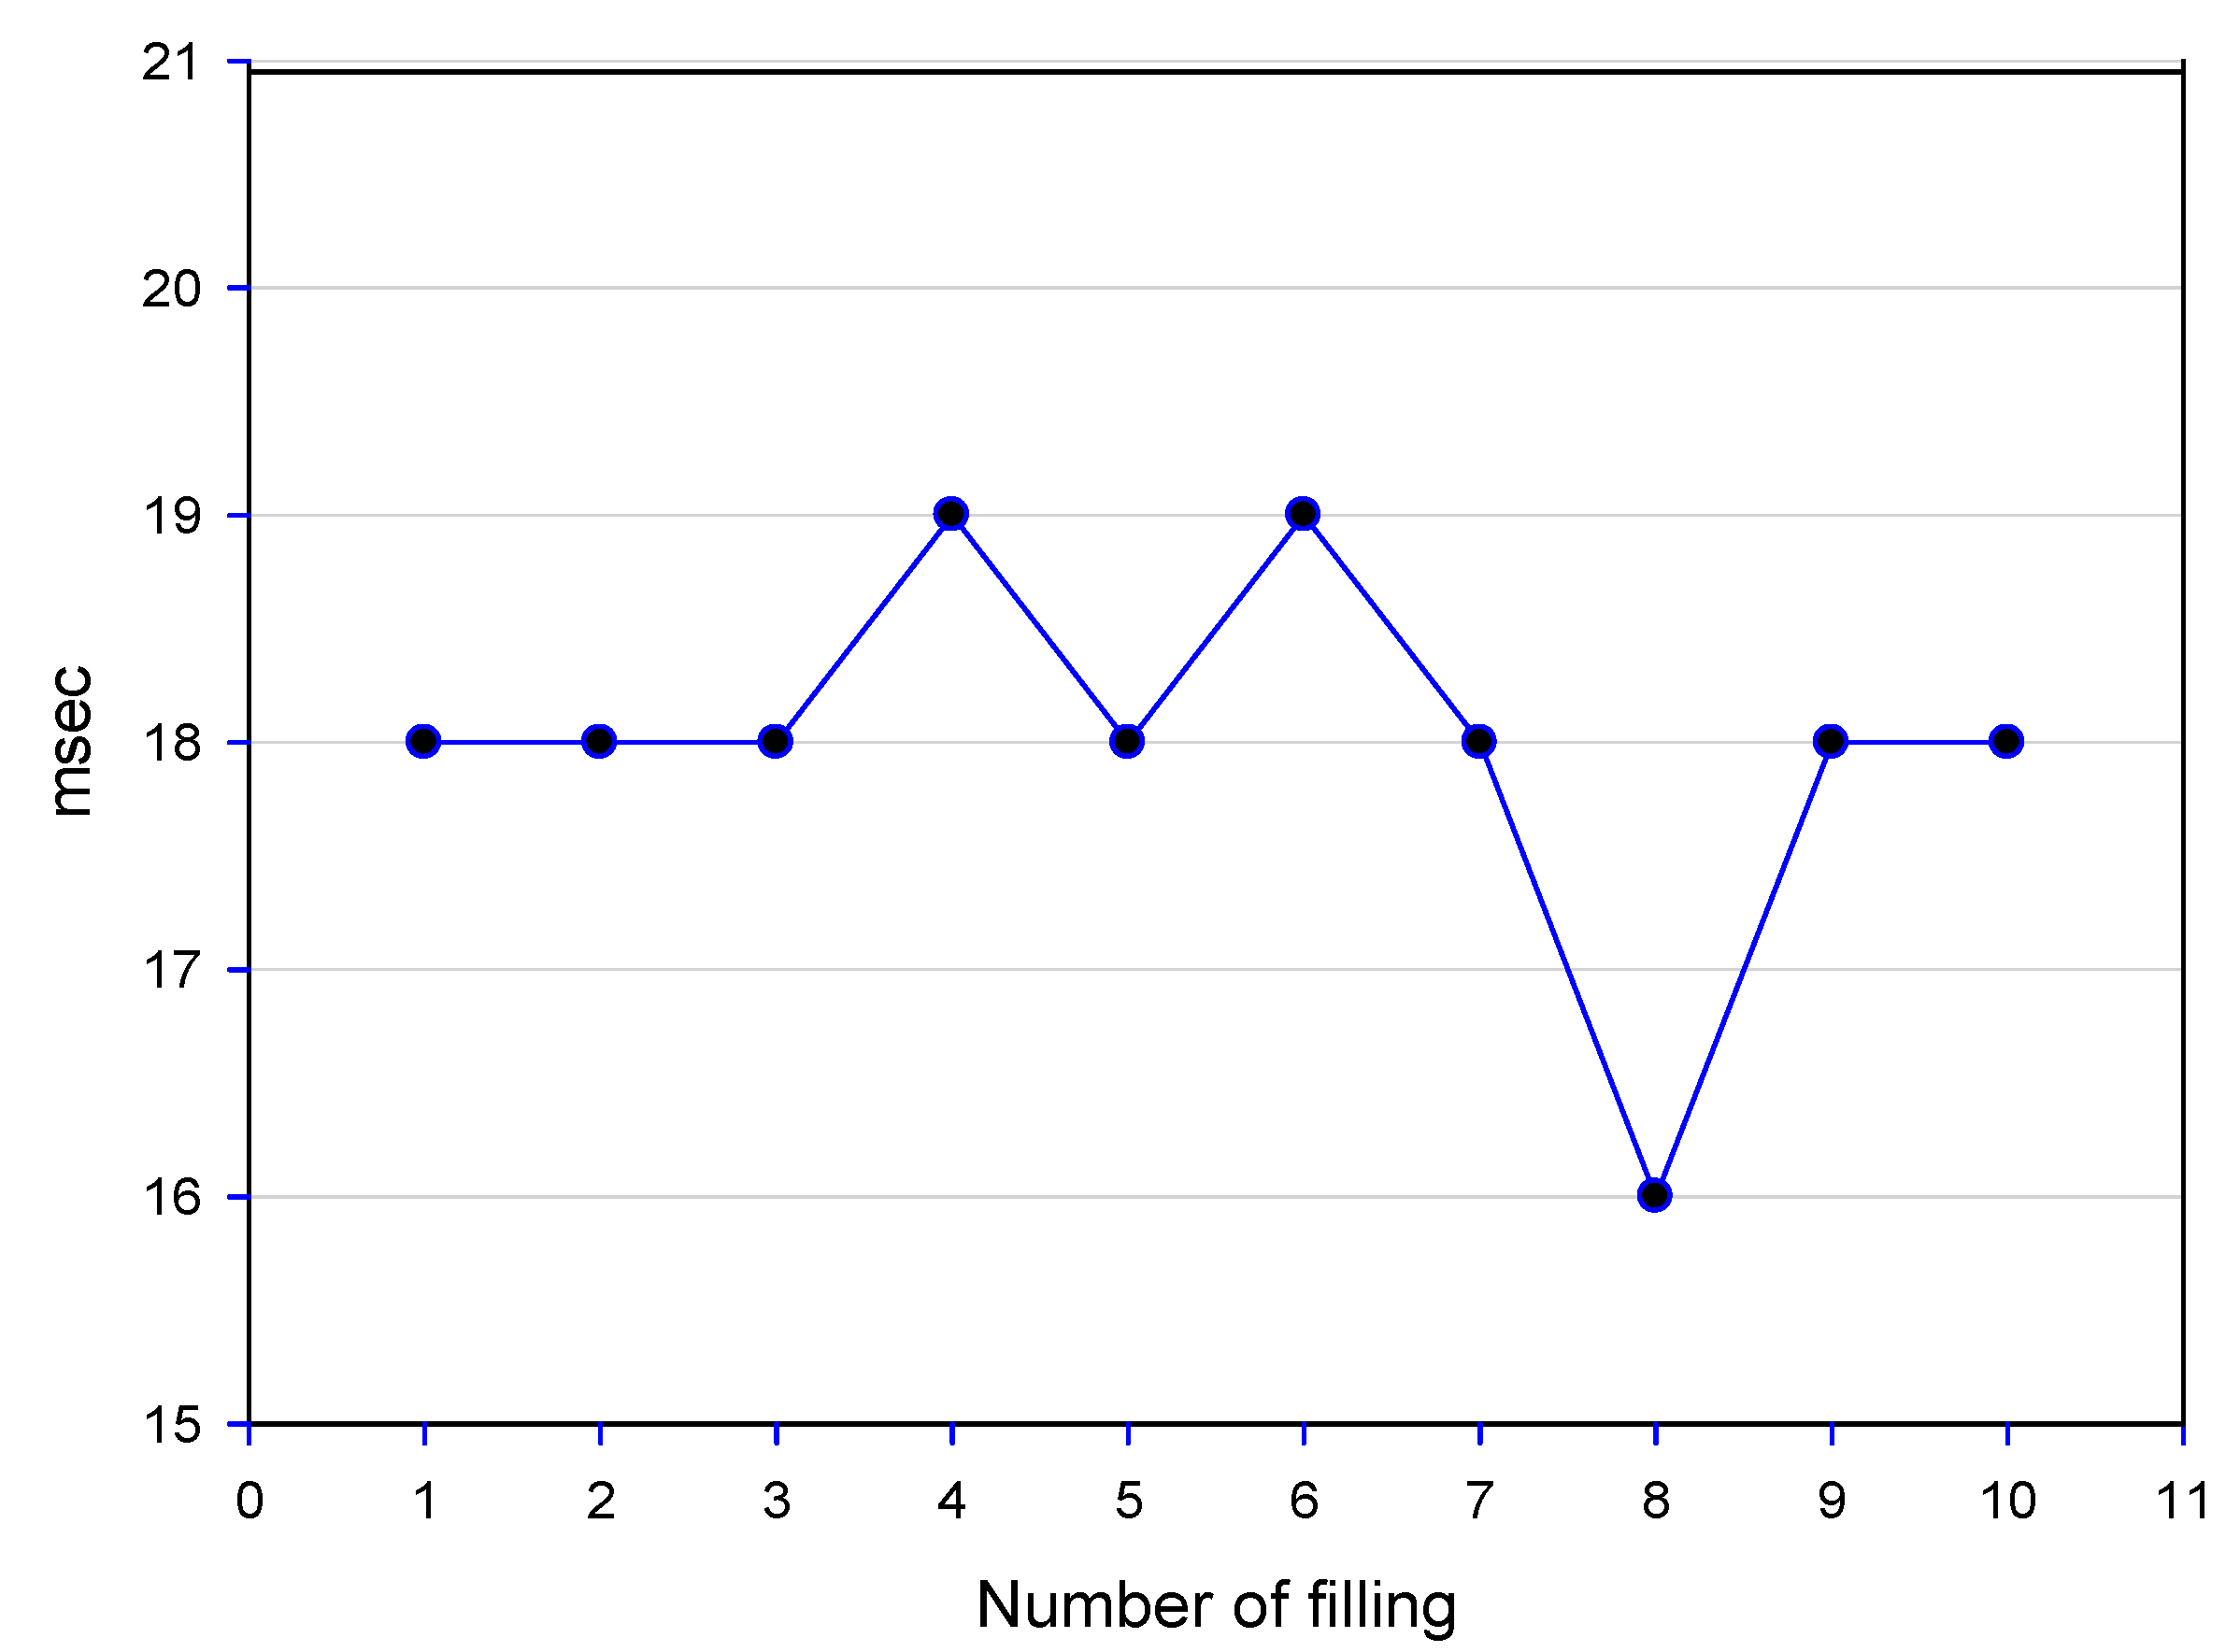
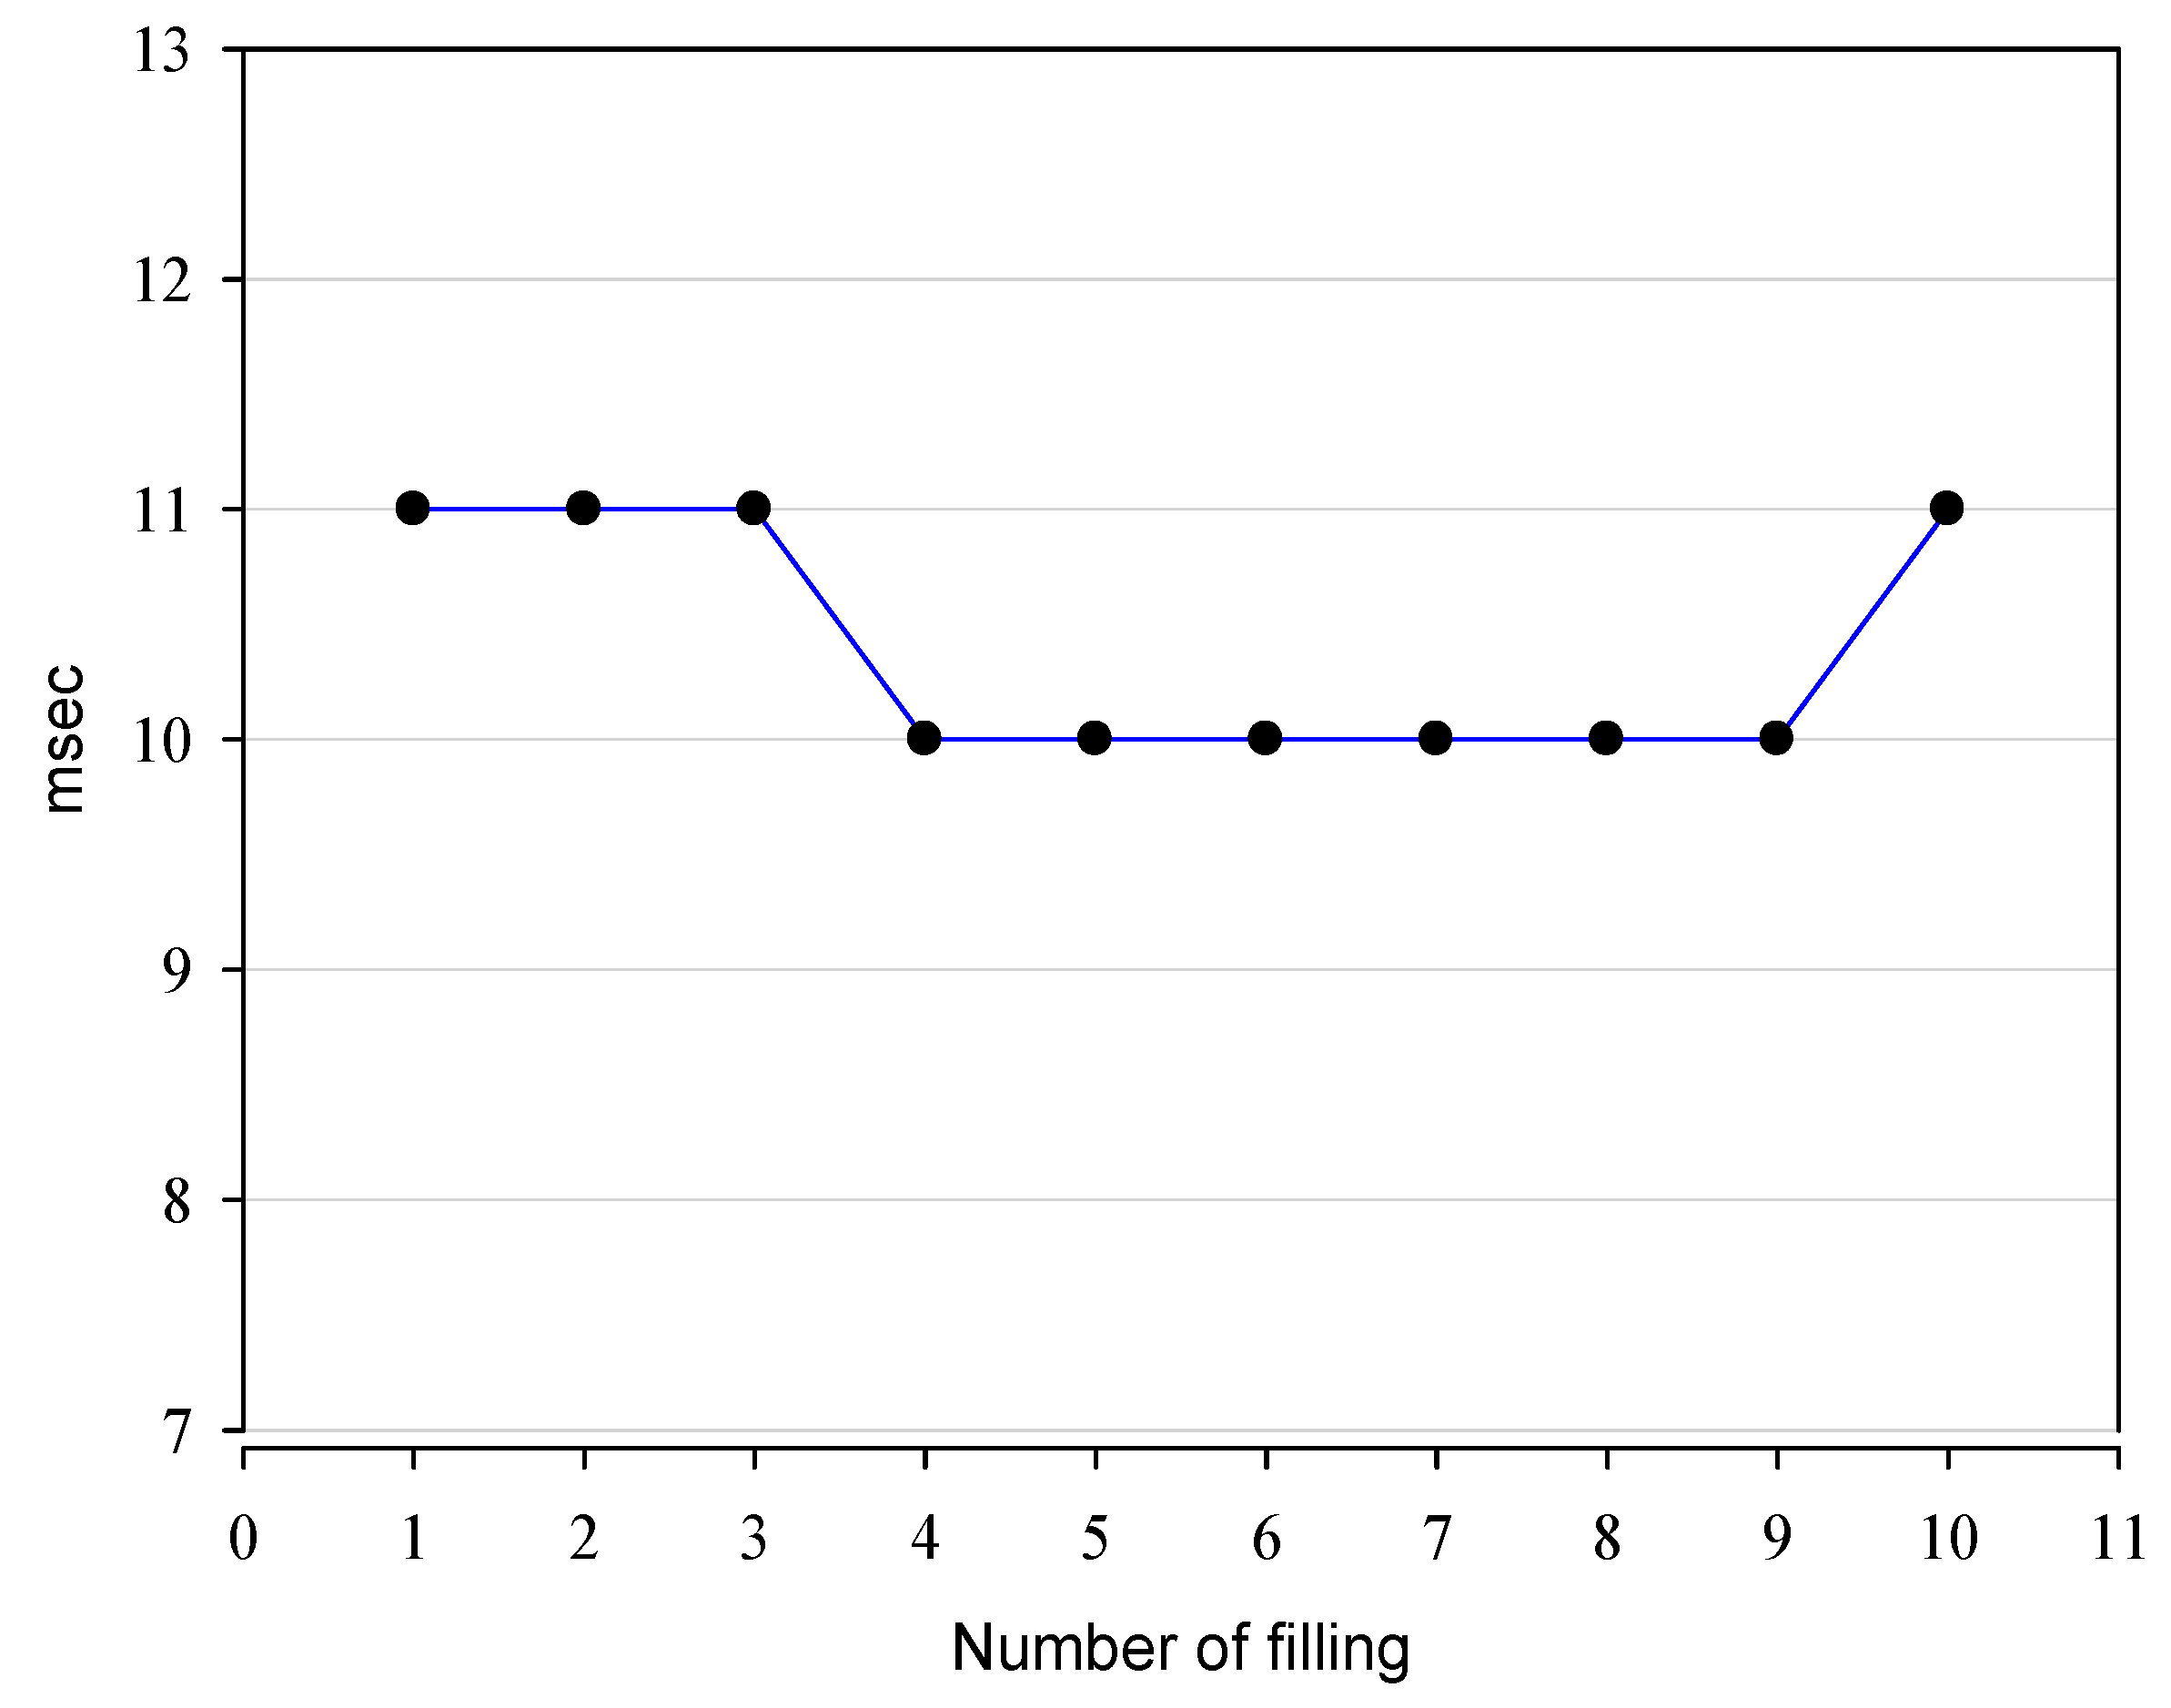
4.1. Analysis of the Response Characteristics of the Filling Valve

Figure 6 and Figure 7 show the results of comparison of the valve response time characteristics of the solenoid valves of M company and F company in designing the filling valves.
The average response rates of the two models of M company ranged from 12 ms to 16ms, while the average response rate of the solenoid valves of F company was 10 ms. In addition, the differences of the response rates of the solenoid valves were 3 ms for M company and 1 ms for F company, indicating that the valves had a good response rate and speed difference.
As for the response rate of the filling valve, the maximum rate differences of the solenoid valves of M company ranged from 14ms to 16ms, which is significant. However, the result was 10~11 ms for F company, indicating that the products of this company performed better in terms of the differences.

4.2. Comparison of the response characteristics of the filling valve

Figure 8 and Figure 9, Table 1 and Table 2 show the filling accuracy of the ‘MHE2 model F Company’ using a pulse output flow meter and the repeat accuracy of the filling valve. The initial test value was disrupted by an external factor, resulting in some of the valves exceeding the maximum filling level. However, after removing the disrupting factors, the levels were all within the limit.
Figure 8 and Figure 9 show that the average filling values of the filling valves were, respectively, 501.4 gr and 501.9 gr, which were within the target value of 500 gr ± 3 gr. In addition, the filling precision and iteration accuracy were found to be satisfactory under a high pressure and high-speed filling condition (3 bar, 350 bpm (bottle per minute) or higher). Therefore, it is believed that the proposed filling system can be a good alternative for the conventional mechanical type or the load cell communication type flow meter.

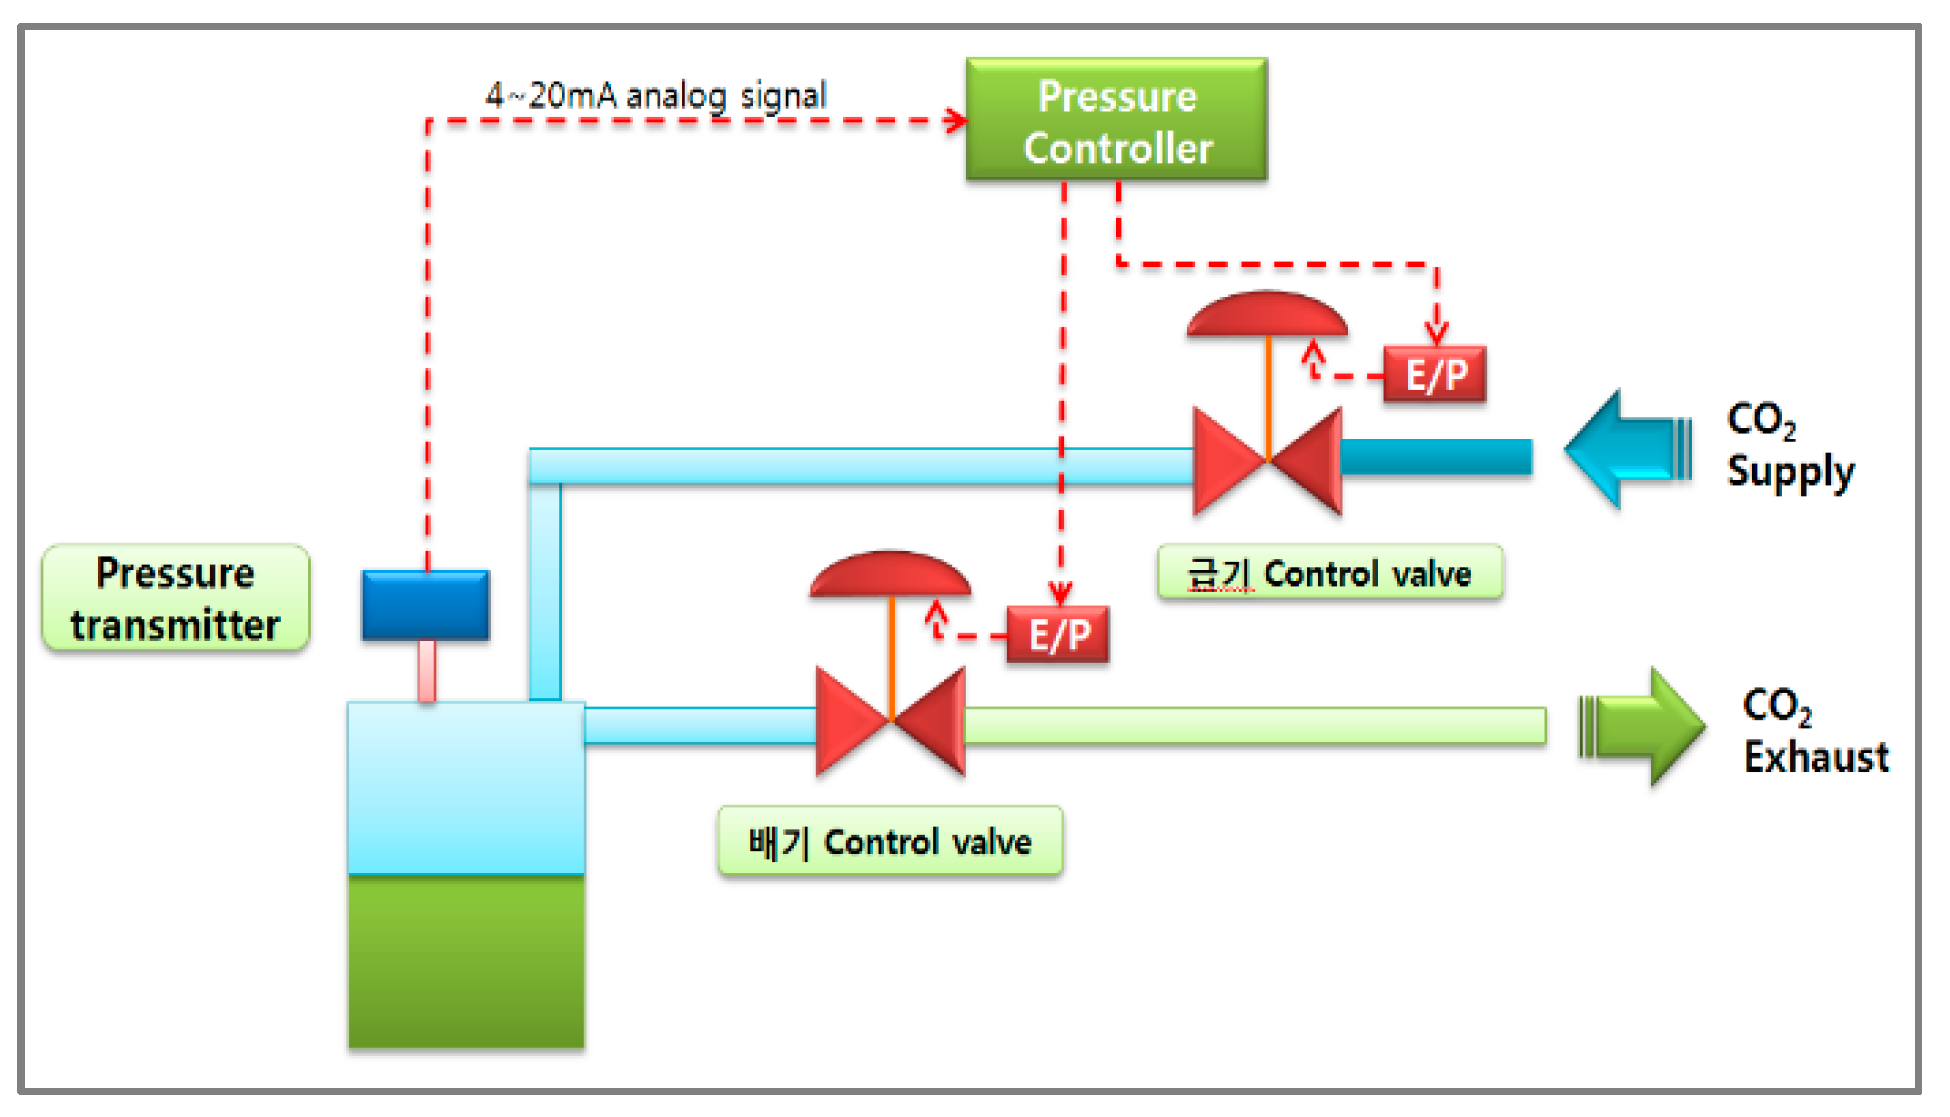
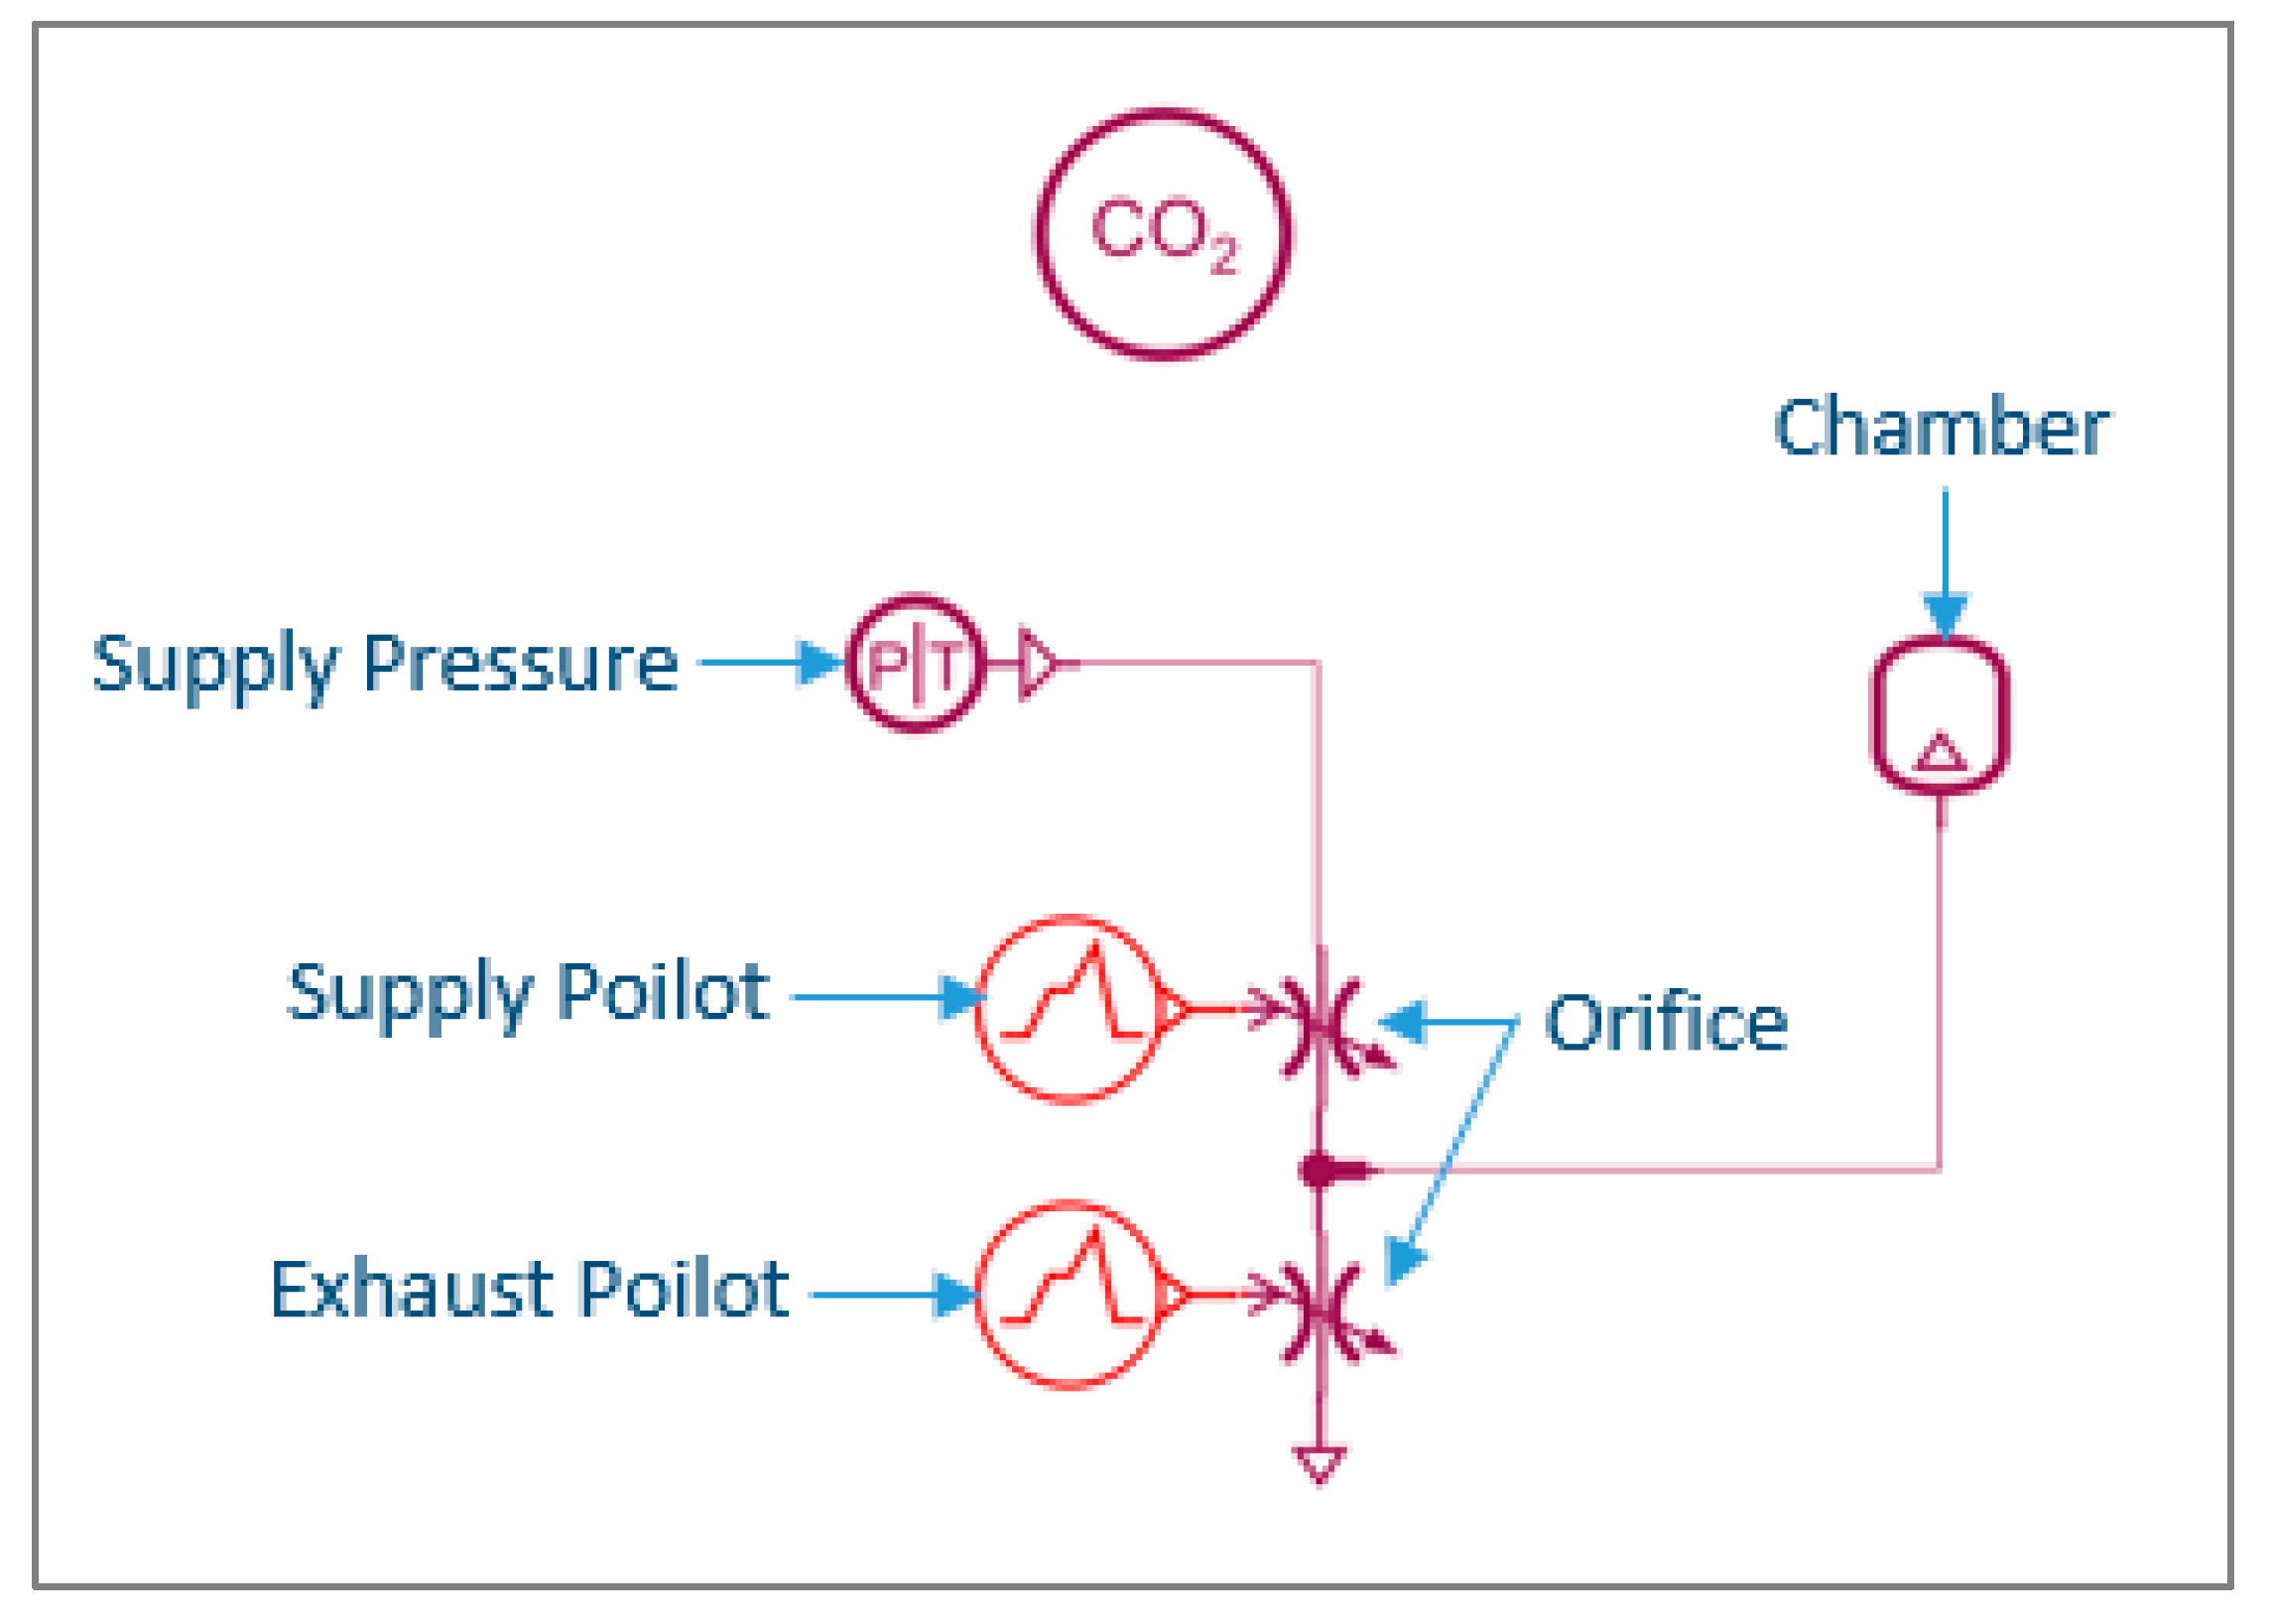
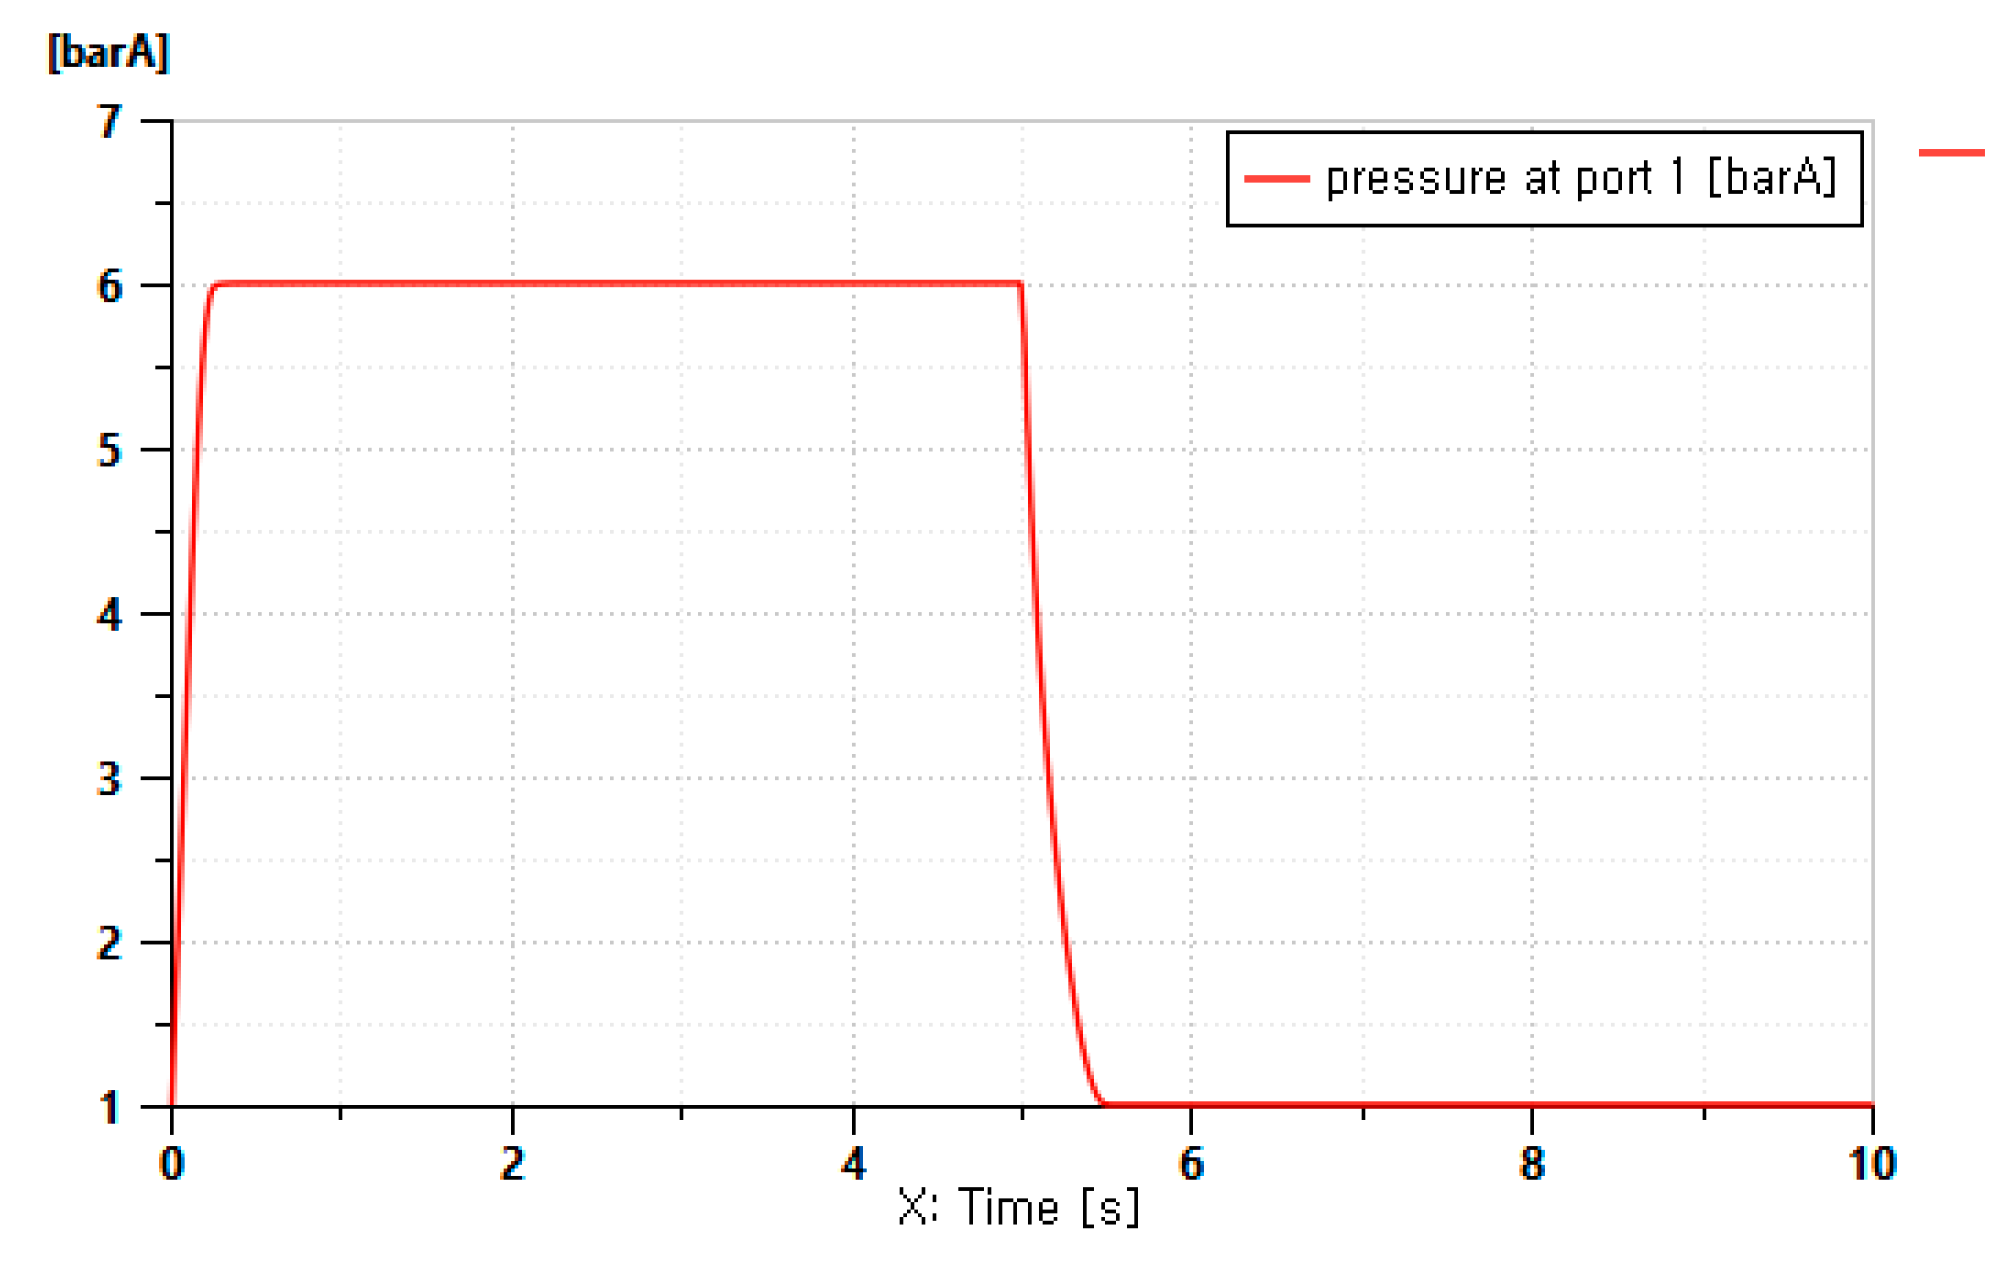
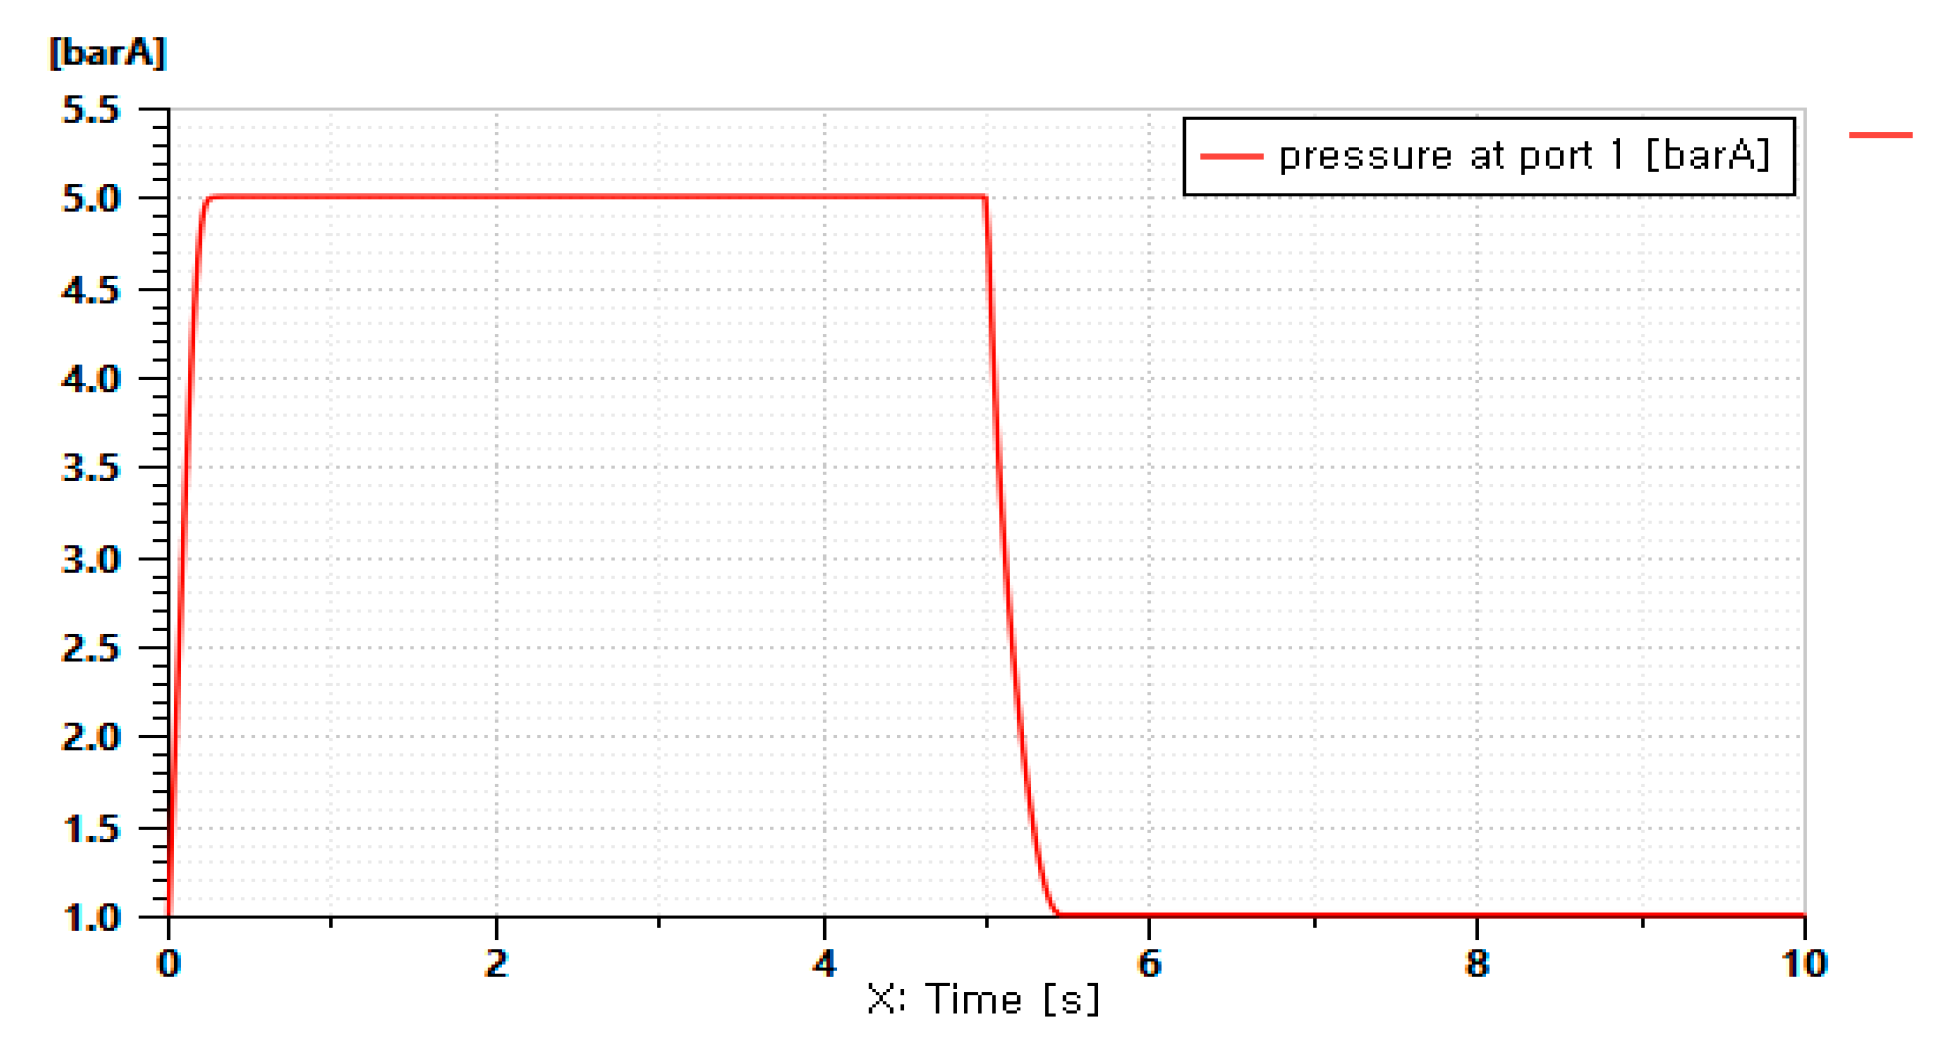
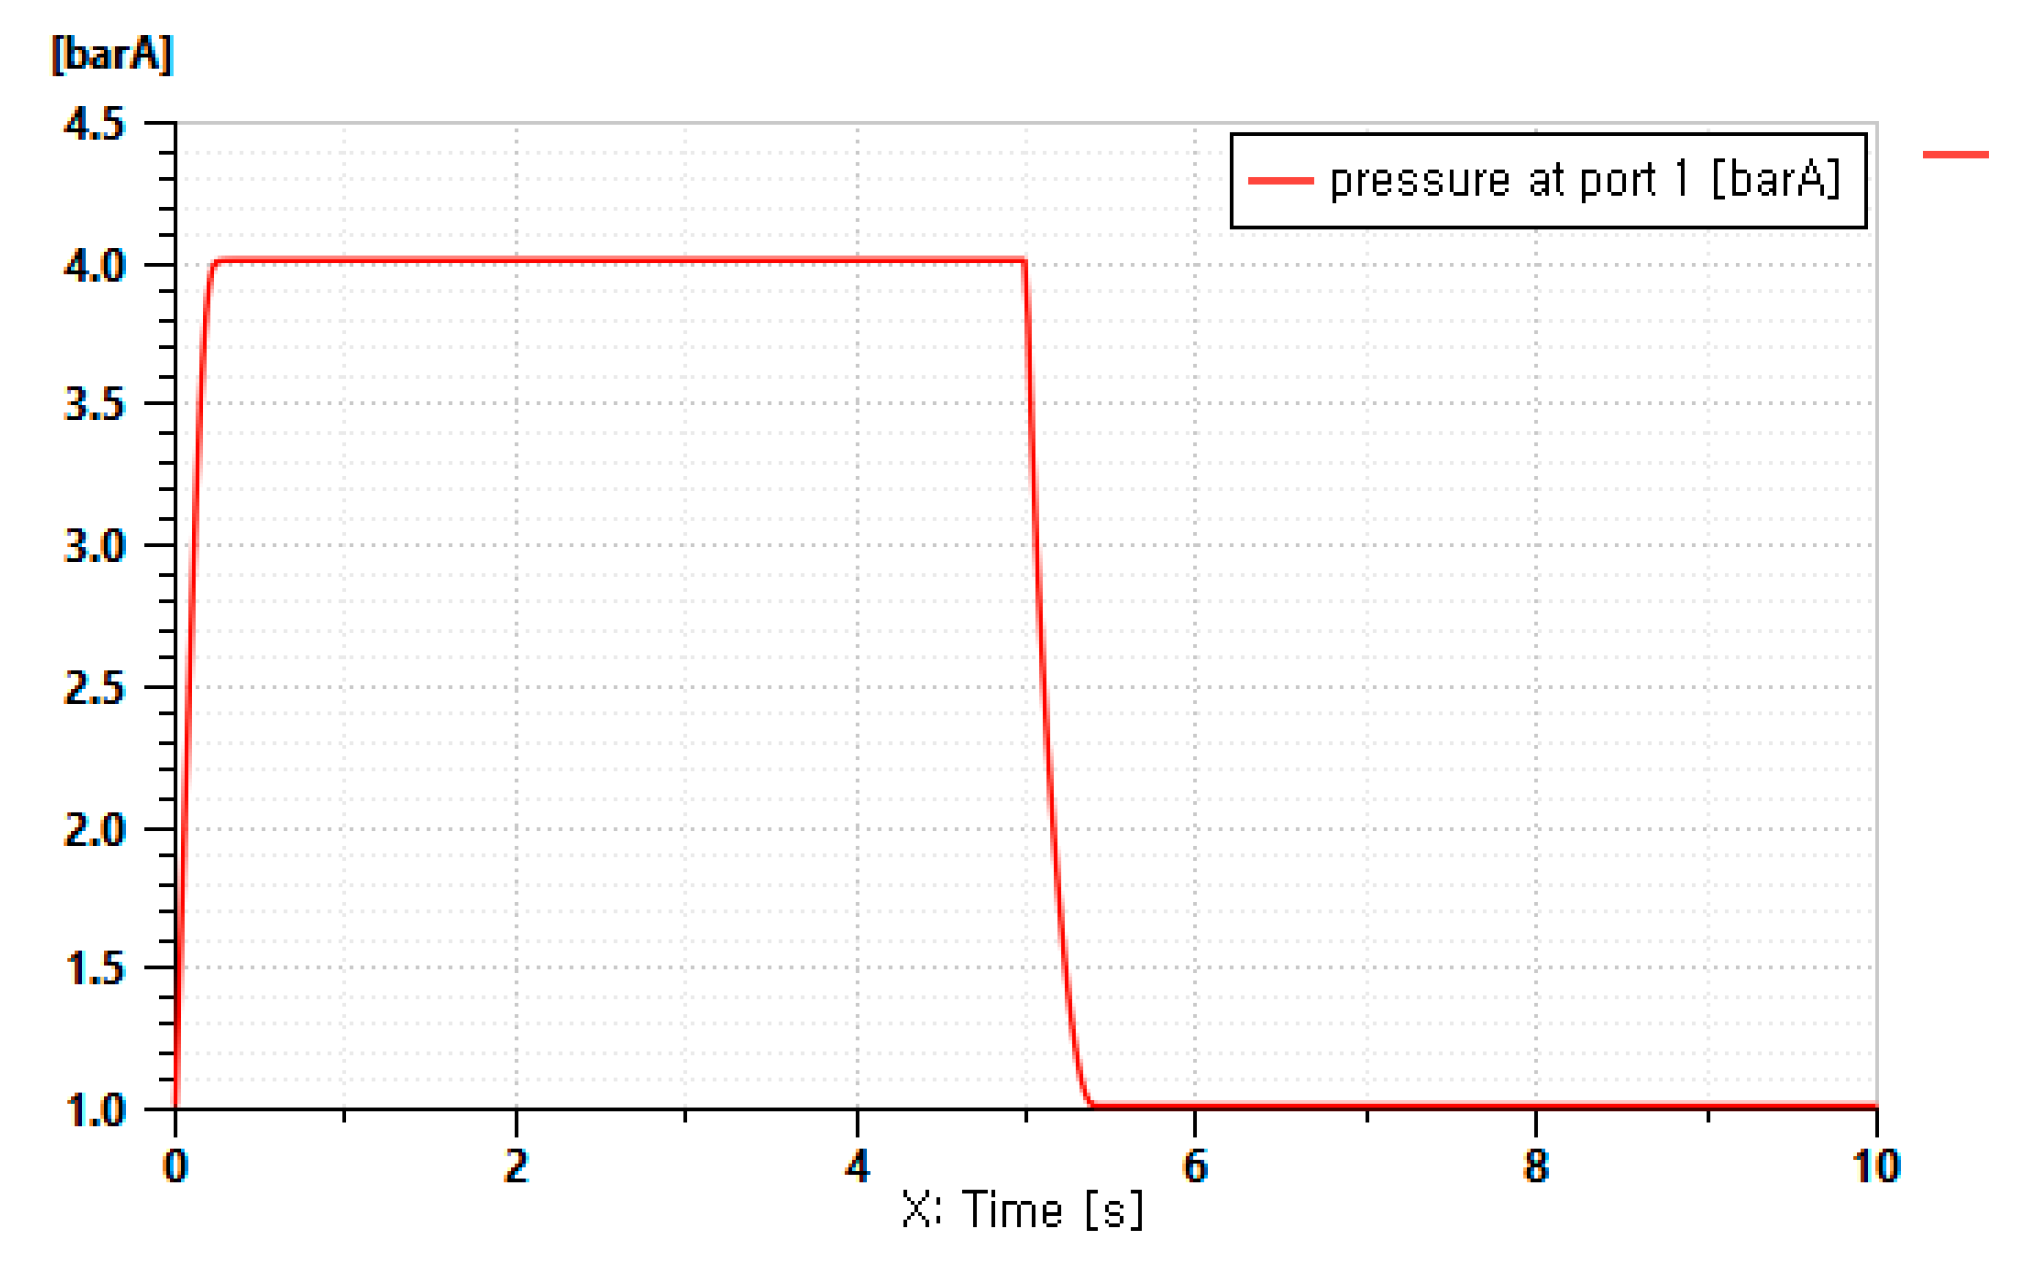
4.3. Counter Pressure and Exhaust Time Analysis of the Chamber

Counter pressure and exhaust time analysis of the chamber was analyzed using AMESim (Advanced Modeling Environment for Simulation of Engineering System) [6].
The pressurization time of the filling vessel was determined based on the following assumptions, taking into account the boundary values of the design variables that have the greatest effect.
-
Chamber volume: 523 cc
-
Temperature: 293 K
-
Supply pressure: 5 bar
-
Orifice area: 19.625 mm2
-
Chamber initial pressure: 1.013 bar
The pressurization and exhaust time according to the supply pressure condition of the chamber was analyzed as shown in Table 3 through the analysis of the AMESim model. The model to calculate the filling/exhaust time of the chamber was configured as shown in Figure 10. Figure 11, Figure 12 and Figure 13 show the result of the analysis of the pressurization and exhaust time within the CO2 carbonate gas at ambient temperature. The pressurization and exhaust time was analyzed to be approximately 0.2 s and 0.4 s, respectively.
According to the result of the experiment, the filling time of the chamber was induced as shown below:
t = ( 0.92 1 / P c s ) × 7.04 × V / S × 10 5
Equation (1) can be deduced from the experiment formula and is a combination of linear and exponential modelling. The pressurization time in the chamber in the actual design was approximately 0.26 s and 0.5 s was spent for the exhaust time, confirming that the pressurization time and the exhaust time were similar to the design time and the result of the AMESim model [6].

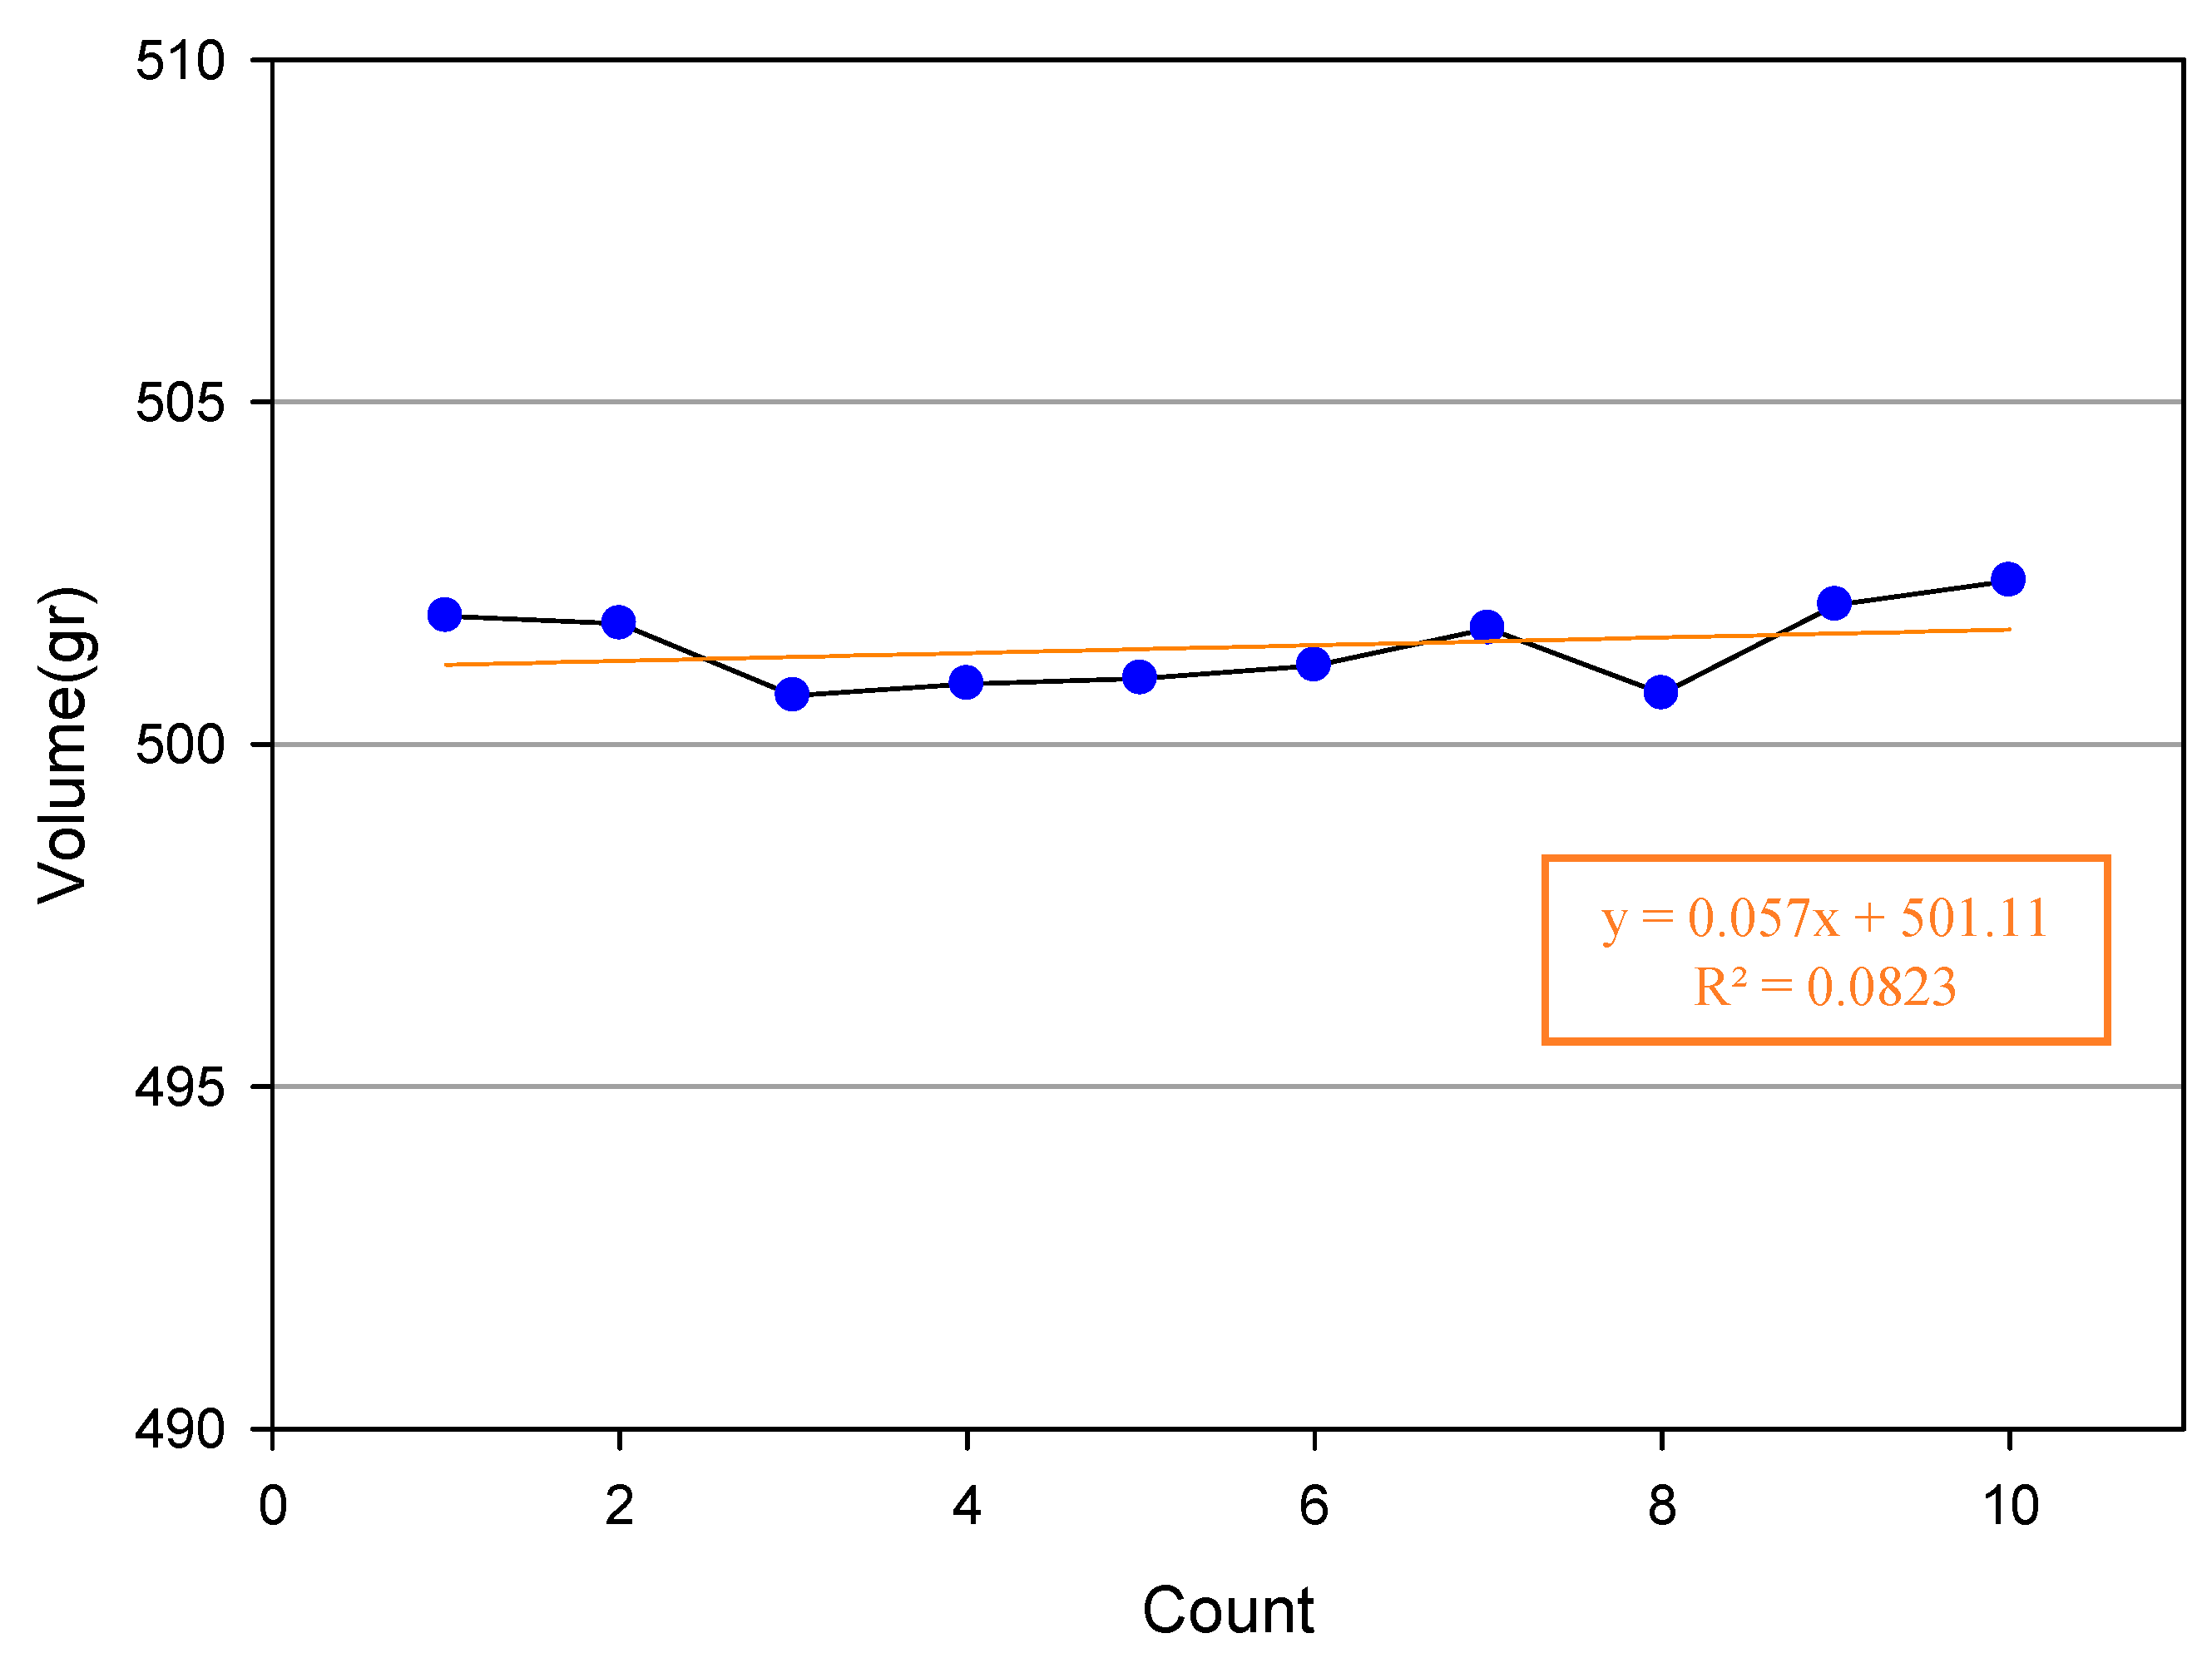
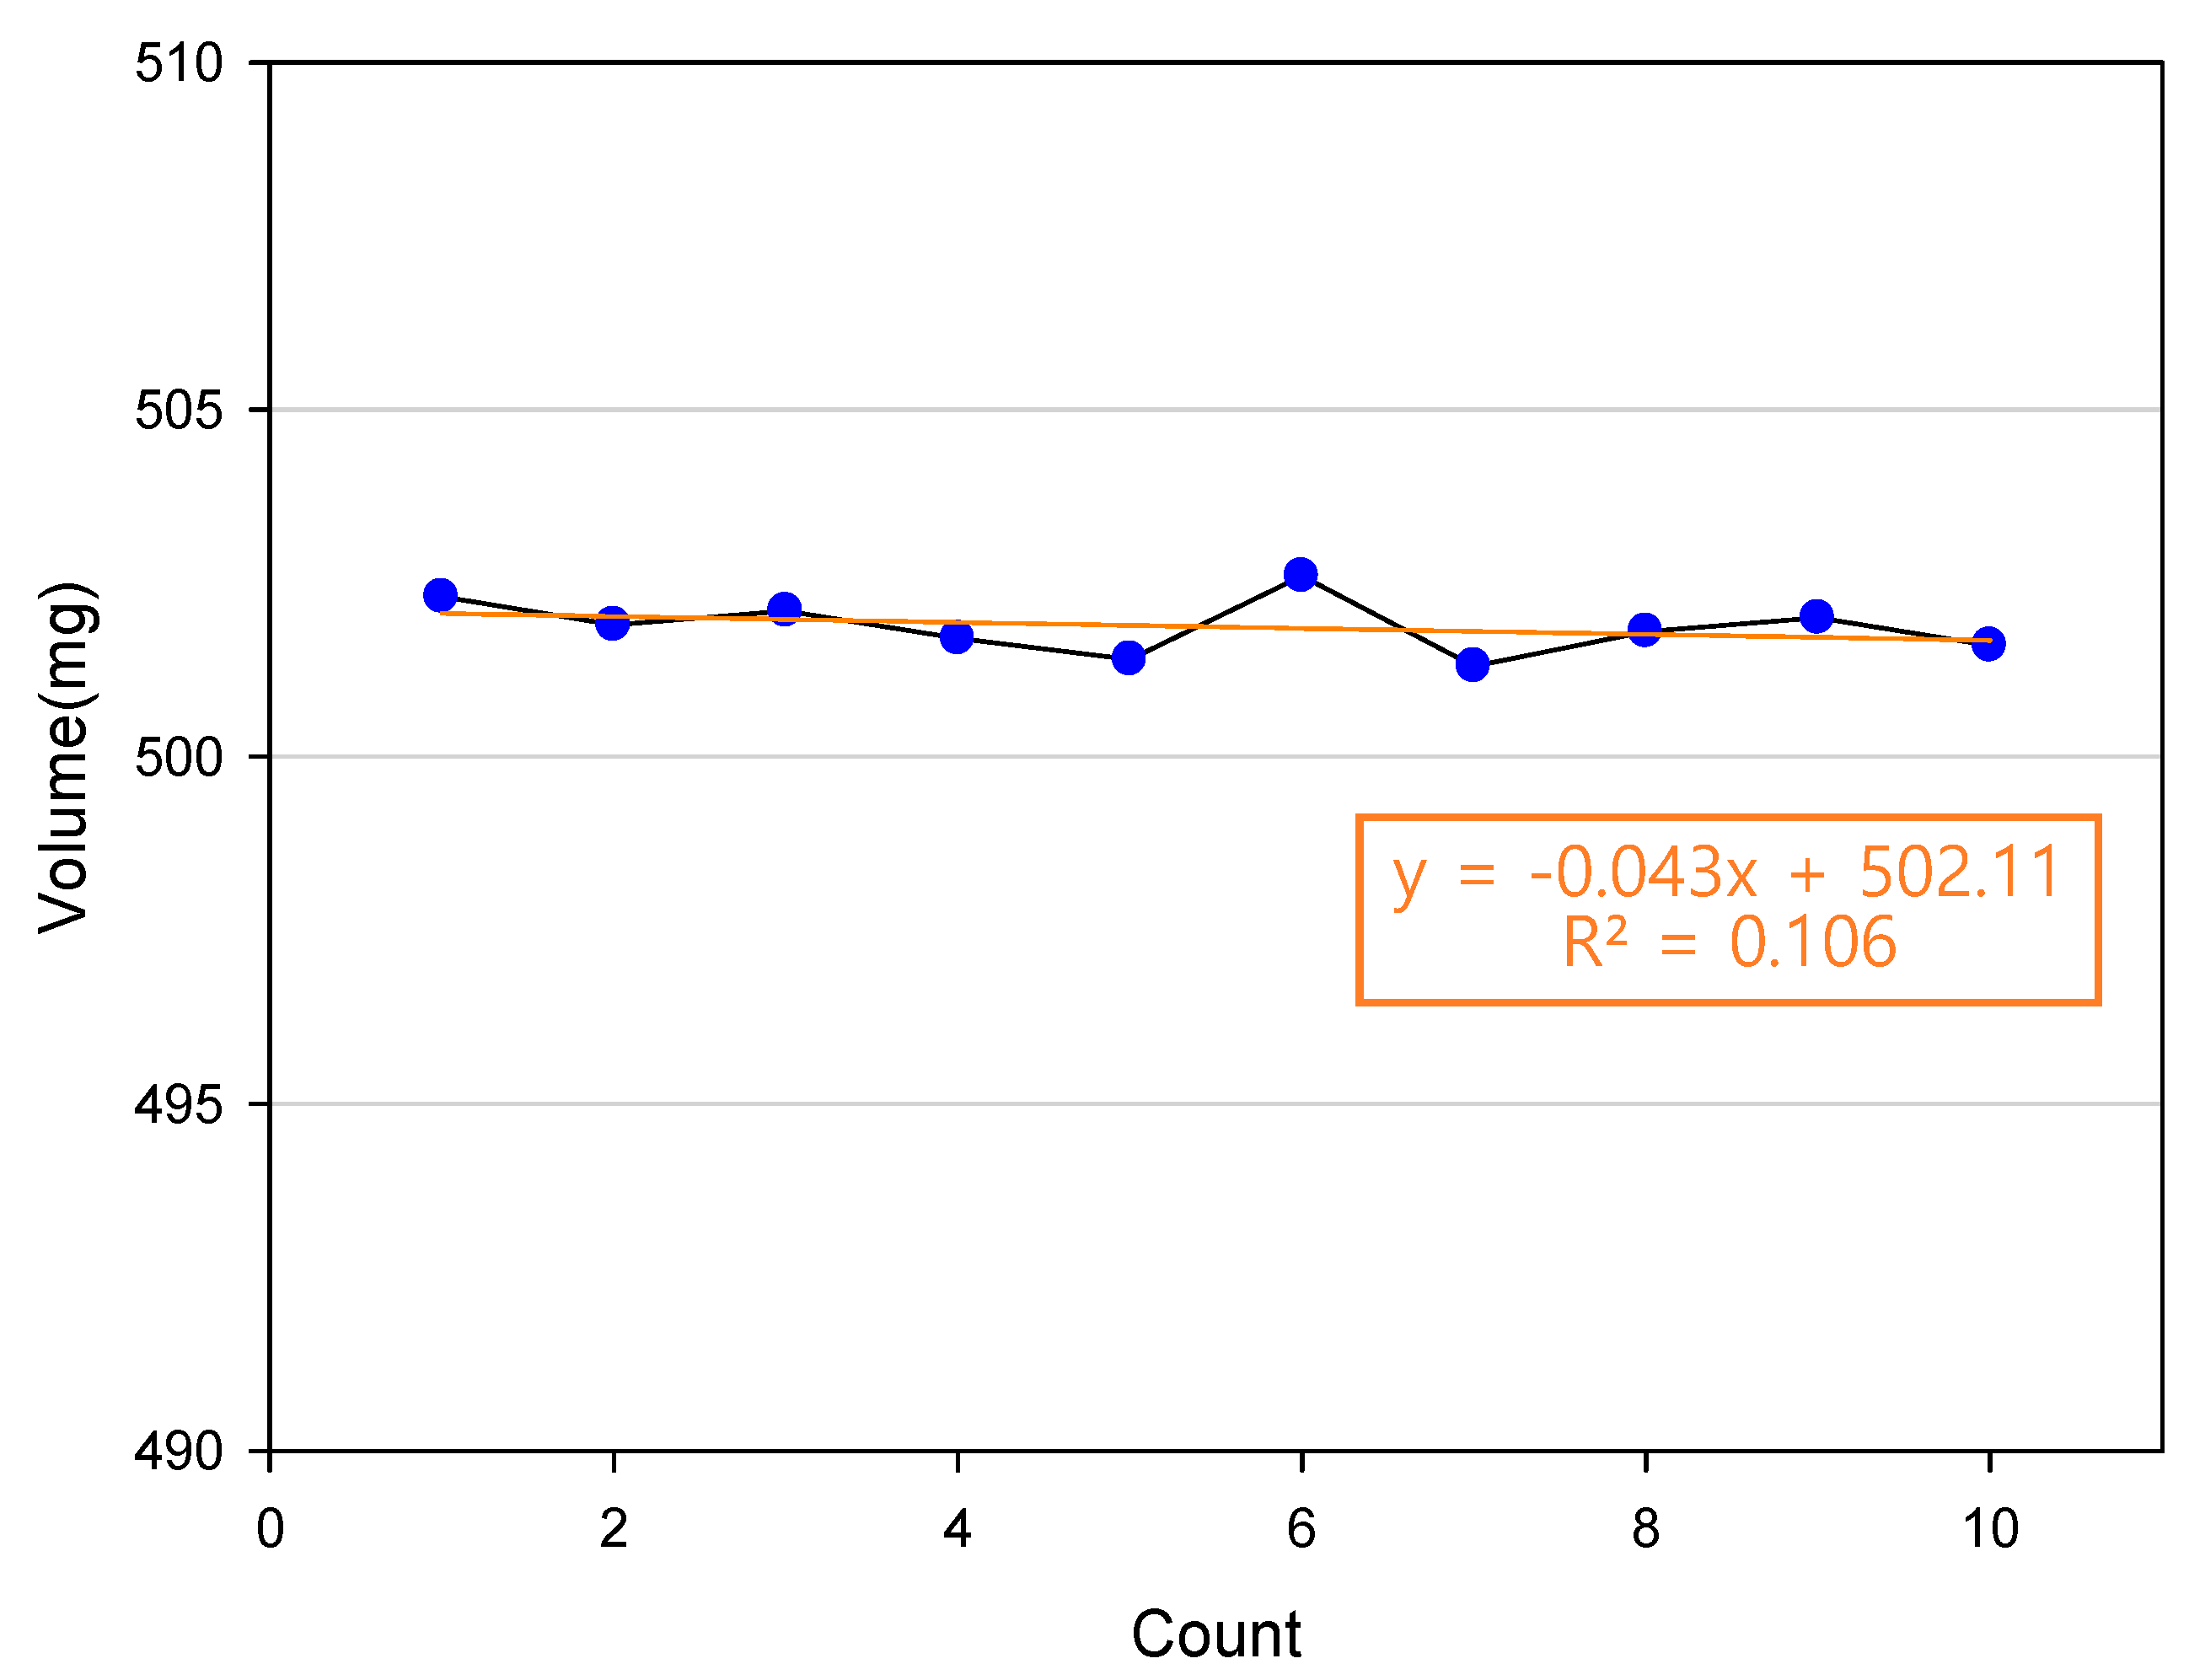
4.4. Performance Evaluation of the Developed Valve

It was difficult to either control or monitor each of the filling condition variables (pressure, temperature, time, flow rate, etc.) in the conventional mechanical carbonated beverage fillers. In this study, the variation of filling time with the temperature and the pressure change, and the filling flow rate with the electronic flow meter, were monitored and controlled, and the filling deviation was measured by individual correction of the filling process. The filling quantity accuracy was measured by measuring 10 different valves. The filling quantity repeatability was measured 10 times with the same valve, and the filling deviation was within ± 3 gr (standard deviation 0.57).
During a high-pressure carbonated beverage filling for ambient temperature filling, filling occurs while turbulence increases, but it was difficult to control individually in the mechanical type. Therefore, in this study, we achieved filling optimization by adjusting the back pressure and the abovementioned calibration of the filling pressure and time among the filling condition variables. Through this study, we determined that when the surface area is constant in the orifice flow of a filling valve, we can predict faulty filling and filling processes by predicting the flow speed when opening a filling valve, monitoring and controlling filling pressure changes (controlling the supply pressure and exhaust pressure).
In this study, we were able to control filling just by flow rate control while solving the inconstancy in filling pressure by adjusting the back pressure during filling. In mechanical filling, we were not able to control various filling condition variables, such as temperature, pressure, time, etc., individually, but as we switched to the pulse flowmeter type electronic filling valve, we removed all uncertainties of the inconstancy in the electronic flow rate pressure through compensation, thereby implementing optimization. When filling with pressurized fluid, there are valves that match the filling pressure to match the pressure of the filler bowl and the pressure of the filling bottle, and the filling valve separately, so we are able to match the same pressure, decreasing faulty filling and increasing filling efficiency. This increases the filling time as more back pressure is applied if there is differential pressure. At this time, we are able to monitor pressure in the case of filling valves and decreasing faulty filling and increasing filling efficiency by gas volume when filling carbonate by controlling the differential pressure and calibrate the pressure deviation by adjusting the differential pressure. Thus, we were able to complete a filler with high versatility and good efficiency.

Author Contributions

S.-B.O. conceived and designed the analysis, collected and analyze the data, funding acquisition; S.-H.O. supervisor, validation, funding acquisition; B.-R.M. supervisor, validation.

Funding

Some results of this paper are the result of the SME Innovation Technology Development Project implemented by the Small and Medium Business Administration (SA113921). This research was supported by the Chung-Ang University research grant in 2014.

Conflicts of Interest

The authors declare no conflict of interest.

Nomenclature

P c Gas pressure in the pilot cavity
P o Pressure in the orifice inlet
V c Cavity volume when initial stroke is 0
T c Gas temperature in the pilot cavity
m c ˙ Flow to pilot cavity
m o ˙ Flow through the orifice in the pilot cavity
f o Surface area of the orifice
μ c v Flow coefficient
T i Gas inlet temperature
R Gas constant
x Travel distance of the bellows
P c s Chamber supply absolute pressure (Mpa)
V Chamber capacity (cm2)
S Orifice effective section area (cm2)

References

  1. Thriveni, T.; Ahn, Y.J.; Choon, H.; Chilakala, R.; Ahn, J.W. A Strategy of Precipitated Calcium Carbonate (CaCO3) Fillers for Enhancing the Mechanical Properties of Polypropylene Polymers. Korean J. Chem. Eng. 2015, 32, 206–215. [Google Scholar]
  2. Eblinger, H.M. Handbook of Brewing: Processes, Technology, Markets; Wiley-VCH: Weinheim, Germany, 2009; pp. 292–293. [Google Scholar]
  3. Kuang, S.; Nie, Y. Preliminary Study on Processing Oil-Based Calcium Carbonate Mud (OBCCM) into Rubber Fillers. Environ. Eng. 2006, 24, 45–47. [Google Scholar]
  4. Middendorf, P.J.; Maclntosh, D.L.; Tow, L.V.; Williams, P.L. Performance of Electronic Flow Rate Meters Used for Calibration of Air Sampling Pumps. Am. Ind. Hyg. Assoc. 2010, 40, 472–476. [Google Scholar]
  5. Oh, S.B. Rotating-Type High-Speed Fluid Filling System Using Pulse-Type Electronic Flow Meter; WO2016/148325A1; WIPO: Geneva, Switzerland, 2016; pp. 1–23. [Google Scholar]
  6. Jang, J.S.; Kwon, O.S.; Lee, K.W.; Cho, I.H. Analysis of Operating Characteristics and Design Review of Oxidizer Fill-Drain Valve. Korea Aerosp. Res. Inst. 2011, 10, 79–88. [Google Scholar]
Figure 1. Components of a high-speed carbonated soft drink flow rate filling system.
Applsci 09 02491 g001
Figure 2. Filling error analysis for filling targets.
Applsci 09 02491 g002
Figure 3. Filling process algorithm.
Applsci 09 02491 g003
Figure 4. Filler bowl pressure control structure.
Applsci 09 02491 g004
Figure 5. Schematic diagram for measuring the response time.
Applsci 09 02491 g005
Figure 6. M Company’s valve response characteristics.
Applsci 09 02491 g006
Figure 7. F Company’s valve response characteristics.
Applsci 09 02491 g007
Figure 8. Accuracy measurement value of filling valve.
Applsci 09 02491 g008
Figure 9. Repeatability measurement value of filling valve.
Applsci 09 02491 g009
Figure 10. Modeling of the chamber counter pressure and exhaust time.
Applsci 09 02491 g010
Figure 11. Counter pressure and exhaust time of the chamber (5 bar).
Applsci 09 02491 g011
Figure 12. Counter pressure and exhaust time of the chamber (4 bar).
Applsci 09 02491 g012
Figure 13. Counter pressure and exhaust time of the chamber (3 bar).
Applsci 09 02491 g013
Table 1. Accuracy measurement value of filling valve.
AverageStandard DeviationDispe RsionMinimum ValueMiddle ValueMaximum Value
501.90.380.14501.3502.0502.6
Table 2. Repeatability measurement value of filling valve.
AverageStandard DeviationDispe RsionMinimum ValueMiddle ValueMaximum Value
501.90.380.14501.3502.0502.6
Table 3. Pressure variation and time analysis of the chamber.
Supply Pressure Condition
[bar]
AMESim Analysis
Counter Pressuring Time
[s]
Exhaust Time
[s]
50.250.5
40.230.45
30.210.4

