1. Introduction
A collimating system is an important part of an optical system. The collimated beam evaluation technology directly affects the wavefront quality of the collimating system, thus affecting the accuracy of the interferometry system. In recent years, a variety of methods for detecting collimated wavefront errors have been proposed, which include the Hartmann method [
1], shearing point diffraction interferometry [
2], and the pentaprism scanning method [
3]. The pentaprism scanning method has been widely adopted to detect the emergent wavefronts of large-aperture optical collimating systems. This method can not only expand the range of the spatial measurement, but also improve the resolution and accuracy of the spatial measurement.
Yu used the pentaprism scanning method to detect wavefronts of small and medium apertures [
4]. By scanning a finite number of wavefronts of wavelets that comprised a wavefront emergent in a certain direction, the slope change of each sample point was analyzed and used to reconstruct the wavefront under measurement. Researchers at the University of Arizona used pentaprism scanning technology for processing and inspecting 2 m flat mirrors [
5]. Hardie et al. developed an off-axis surface test method based on pentaprism scanning and used it for National Institute of Standards and Technology (NIST) performance testing on the 8.4 m giant Magellan telescope [
6]. The test method has also been used to measure low-order aberrations and has served as a verification test for full-aperture interferometer systems with large-aperture non-axisymmetric null correctors. Xu et al. developed a testing system based on an electronic autocollimator, which consisted of a linear rail system, a scanning pentaprism, and an electronic autocollimator. Here, the accuracy of the system increased from 0.91″ to 0.36″ arcsec by calibration of the system error [
7]. Mallik et al. built a scanning pentaprism system to be used as an absolute test for an optical flat. The light from an autocollimator was reflected from two pentaprisms to project reference beams of light onto a flat mirror. This provided information on low-order optical aberrations in the flat mirror [
8]. Peng et al. developed a scanning pentaprism system that exploits geometry to measure off-axis paraboloidal mirrors, which was based on the property of a paraboloidal surface. They gave detailed performance results for the measurement of the 1.7 m mirror and the analysis for a test of the GMT segments [
9]. Sonal et al. reported an improved single shot electrooptic sampling-based detection scheme to measure the time profile of a THz pulse using the inherent curvature of a converging wavefront, which used the converging wavefront [
10]. Rahman et al. presented bandwidth enhancement and frequency scanning for a fan beam array antenna, utilizing a novel technique of band-pass filter integration for wireless vital signs monitoring and vehicle navigation sensors [
11]. Lv et al. presented a fast and accurate method to calculate the displacement errors caused by grating surface errors and line errors in a grating-based interferometer with a Littrow configuration. The diffracted wavefronts were used to calculate the displacement errors at the 1st orders of the grating [
12].
2. Real-Time Compensated Collimating Wavefront Detection Method
The use of the pentaprism scanning method for detection of large-aperture wavefronts is essentially the serial Hartman detection method [
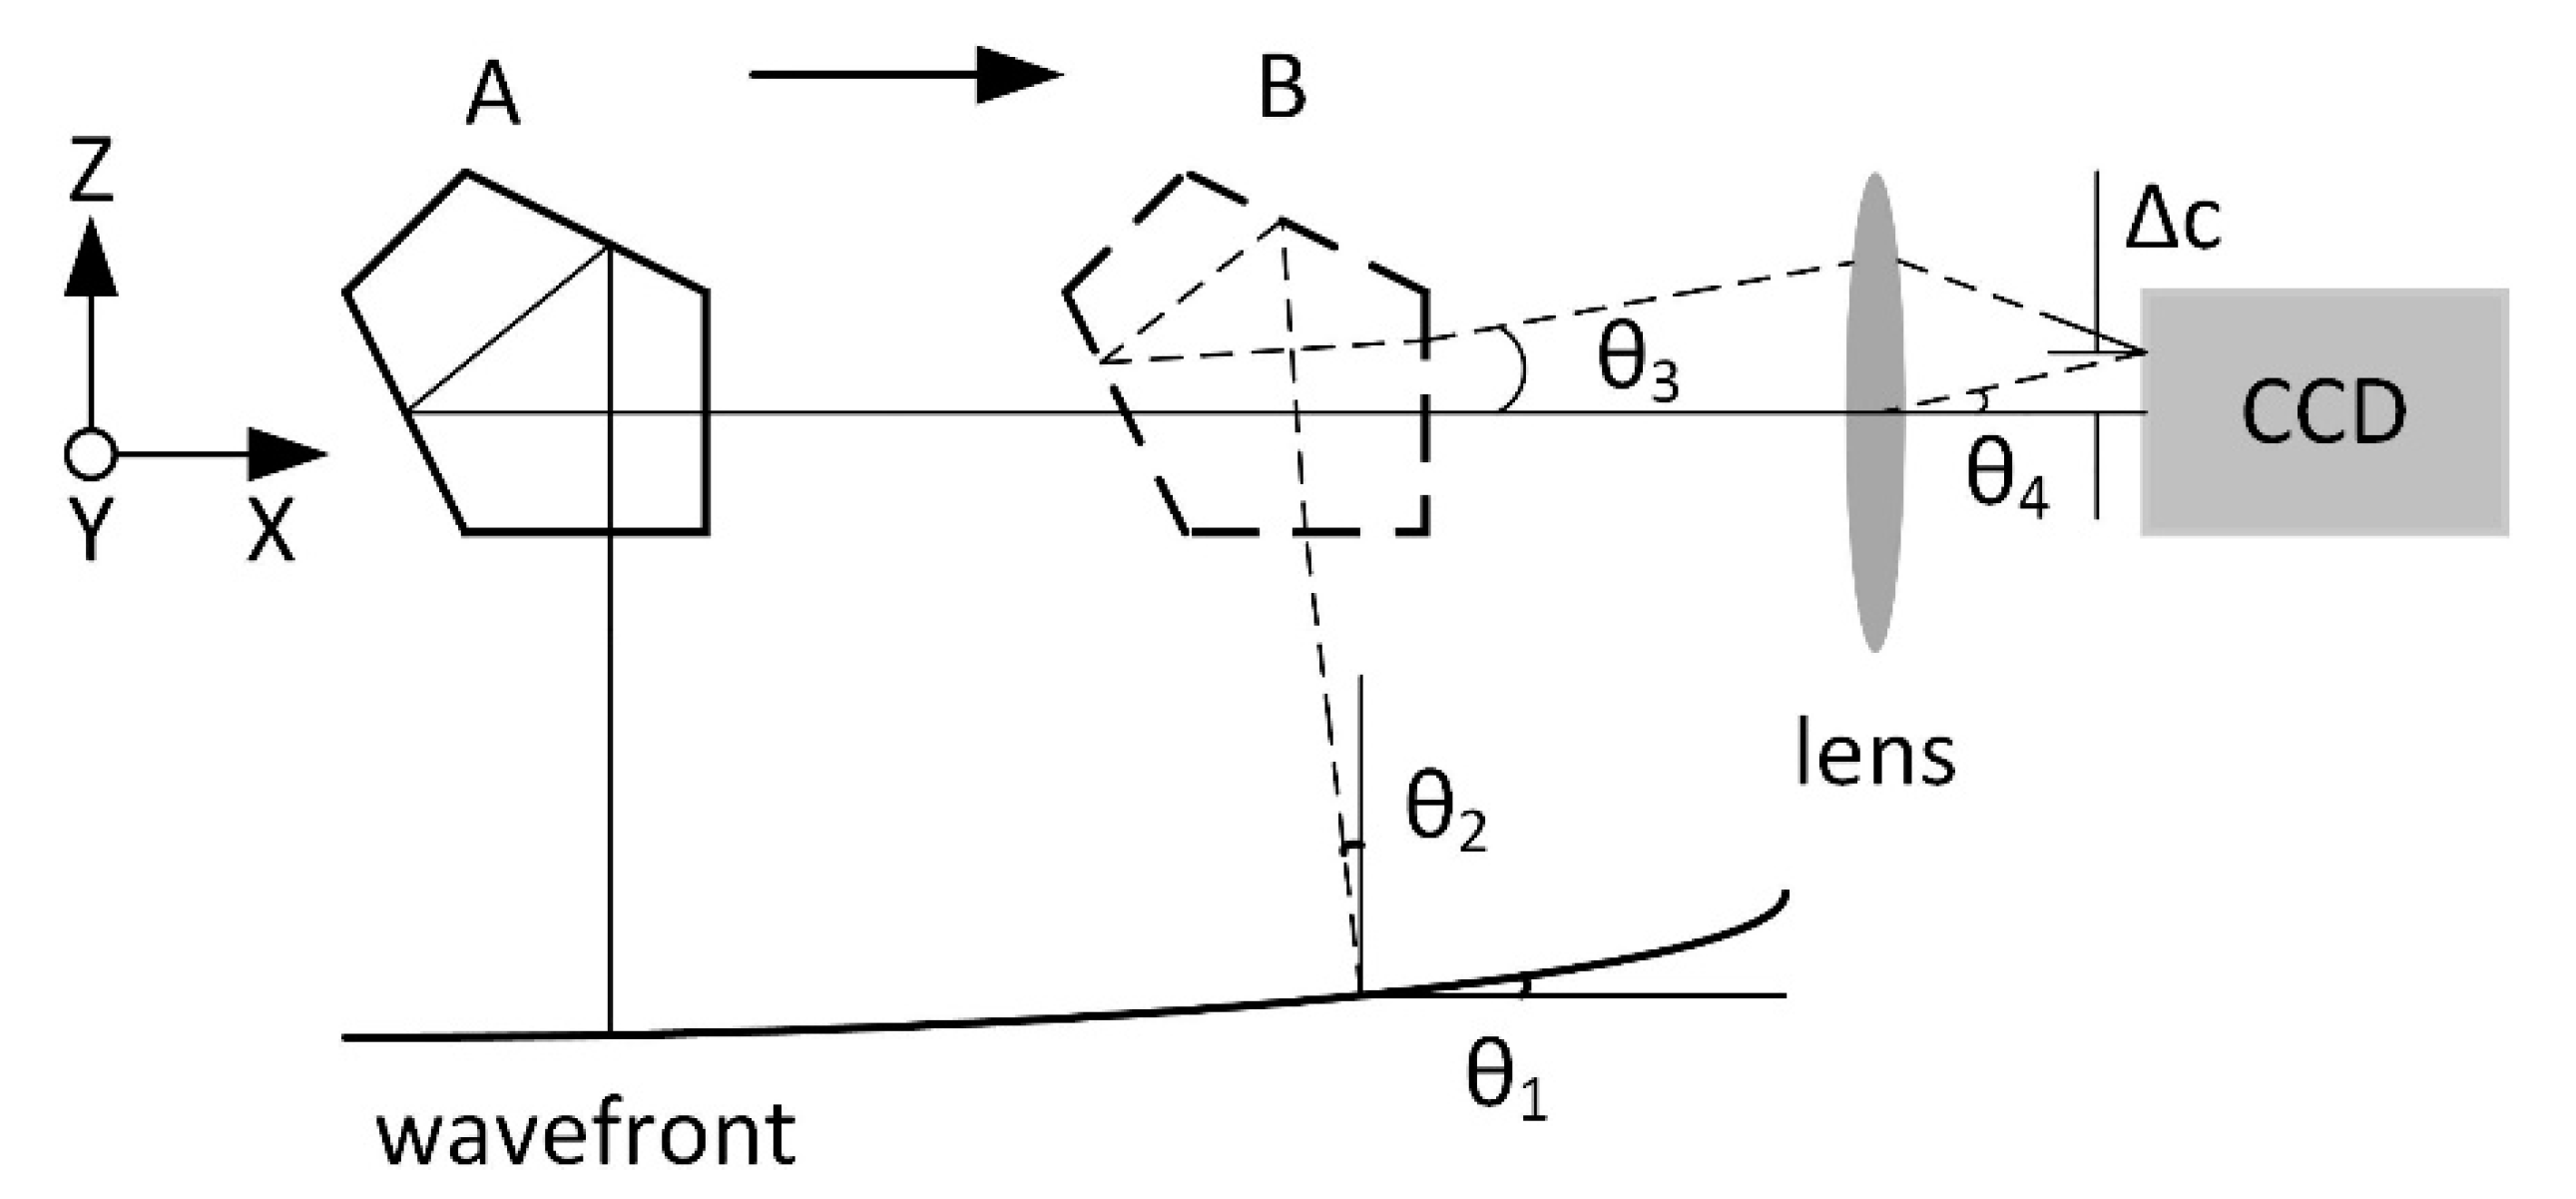
13]. By using the characteristics of a pentaprism, which reflect light at 90° angles, this method decomposes the emergent wavefront into a set of wavelets and separately scans the individual wavelet wavefronts. First, the detector captures the spot pattern at the set intervals, and then a centroid analysis is conducted for the individual wavelet wavefronts. Finally, the wavefront under measurement is obtained by fitting and reconstructing the wave surfaces.
In the pentaprism scanning method, a small-aperture pentaprism is selected, and the collimated wave is scanned sequentially along a precise linear guide rail. The guide rail is perpendicular to the optical axis of a converging lens. A translation stage accurately records the scanning positions. Because the aperture of the pentaprism is small, the method divides the emergent wavefront into multiple wavelet wavefronts. The converging lens converges the reflected light into a spot, and then the spot image is captured. The calculation of the offset between the wavelet and the optical axis yields the slope value of a wavelet (i.e., the value of the first derivative of the sampling points). By taking the integral of these slope values, the original emergent wavefront is reconstructed [
14]. The basic working principle is illustrated in
Figure 1.
When the pentaprism is at position A, the emergent light from the center point of the measured wavefront is reflected by the pentaprism and focused on the charge-coupled device (CCD) camera through the lens. Using this light as the reference basis, when the pentaprism is at position B, the light at the other point of the wavefront is also focused on the CCD. The offset of the spot centroid is Δ
c, and the angle between the two beams is
θ3. The triangular geometric relationship yields
θ3 =
θ4 =
θ2 =
θ1, which are the angles between the tangent line of the wavefront under measurement and the X-axis. Therefore:
where
k is the wavefront slope of the wavelet under measurement, and
f is the focal length of the converging lens. The slope value
k is the first derivative of the wavefront under measurement. The original wavefront of the pentaprism scanning direction can be obtained by taking the first integral:
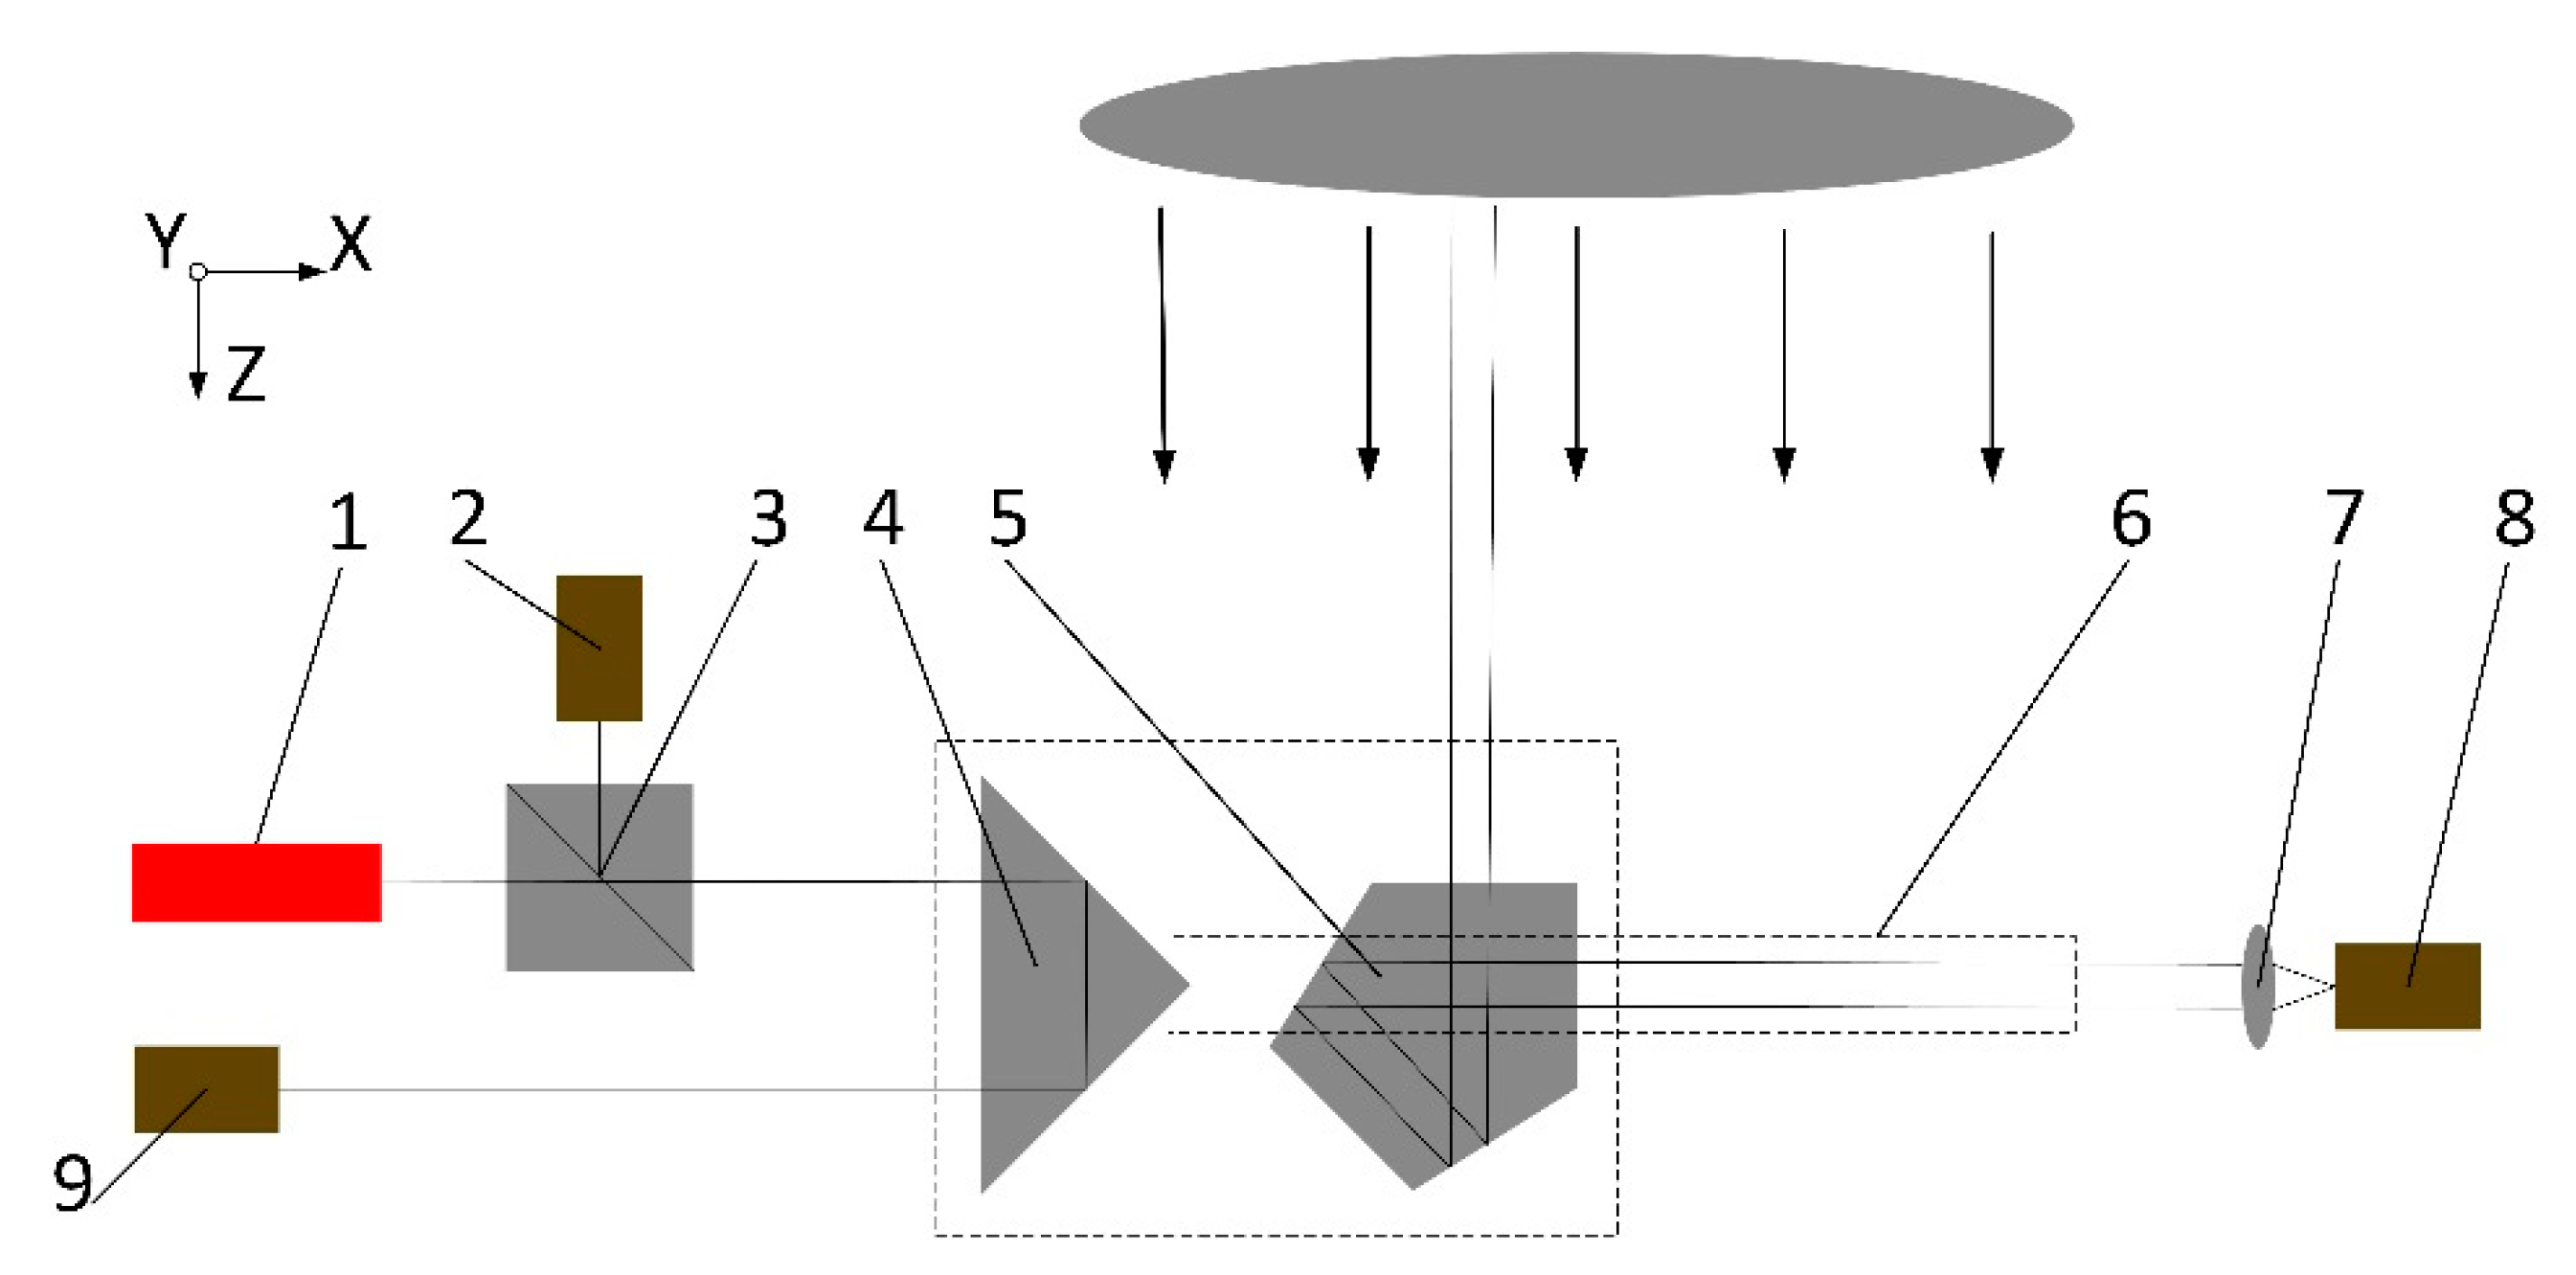
Based on the fundamentals of pentaprism scanning and other wavefront detection methods, this paper proposed a novel real-time compensated large-aperture collimating wavefront error detection method, which can compensate the system error of the collimated beam under tests in different vibration states of the guide rail in real time. As shown in
Figure 2, the detecting device included an optical beam sampling subsystem, an error compensation subsystem, and a linear guide rail.
The optical beam sampling subsystem consisted of a pentaprism, a linear guide rail, and a CCD camera. The collimated light under the test was scanned by the pentaprism moving along the linear guide rail and was captured by CCD 8. The error compensation subsystem consisted of a laser, a beam-splitting prism, a right-angle prism, CCD 2, and CCD 9. The right-angle prism and the pentaprism were mounted on a supporting base and moved together along the linear guide rail. The right-angle prism was coated with a semi-transparent, semi-reflective film to ensure a reflectivity of 50%. There were manufacturing and assembly errors in the movement of the pentaprism on the linear guide rail. The variation of the radial thickness caused the pentaprism to roll and the variation of the axial thickness caused the pentaprism to pitch. A straightness error caused the pentaprism to yaw. These three errors were rotations around the X-axis, the Y-axis, and the Z-axis, respectively. When the pentaprism had yet to rotate, the light emitted by the laser passed through the right-angle prism and was split into two beams. One beam was directly reflected back to the beam-splitting prism and received by CCD 2. The other beam was reflected by CCD 9 after being reflected twice. When the pentaprism rotated around the axis, the right-angle prism also rotated. Therefore, CCD 2 received a light beam that changed due to the rotation around the Y-axis and CCD 9 received a light beam that changed due to the rotations around the Z- and X-axes. Lastly, CCD 8 received the light beam that carried errors on the collimated wavefront.
The coordinates on the object side and on the image side of an ideal pentaprism were correlated. The rotation angles of the pentaprism in the X, Y, and Z directions were unit vectors. With a small-angle approximation, during the process of scanning the entire width of the collimated beam along the linear guide rail by the pentaprism, the rotational error on each axis was mapped on CCD 8. The rotational error changed in different directions as the direction of rotation changed.
The right-angle prism also rotated as the pentaprism rotated on the linear guide rail. When the right-angle prism rotated, the position of the spot generated by the laser beam on the camera changed. The displacement of the spots on the two cameras in different directions was the displacement component of the spot on CCD 8 in different directions. Let the spot coordinates on CCD 8, CCD 2, and CCD 9 be (
x1,
y1), (
x2,
y2), and (
x3,
y3), respectively. After the scanning movement of the pentaprism was completed and the compensation was determined, the spot coordinates of the collimated beam were as follows:
When the pentaprism rotates around the Y-axis, the light spot on CCD 2 changes only in the vertical direction, and, therefore, x2 is zero. If the distance from the compensated spot center to the original position in the x direction is d and the distance to the imaging lens is f, the slope of the collimated beam in the x direction is d/f. The pentaprism scans the entire collimated beam along the linear guide rail and can capture the slope of each sub-beam of the collimated beam on a certain line in the x direction (i.e., the first derivative value of the collimated beam in that one-dimensional direction). The wavefront distribution of a collimated beam at that one-dimensional direction can be obtained by taking the integral of the slope values.
3. Experiment and Analysis
The pentaprism converted the initial transverse wavefront into a longitudinal wavefront. The centroid offset was only related to the offset of the measured spot. By referencing the centroid coordinates after calibration, the centroid offset of the coordinates of the sampling points was obtained. The ratio of the focal point to the focal length of the lens was the slope of each wavelet wavefront. The integral of each slope was taken. The values from the integrals and the positions of the scanned wavefront from the guide rail were used for polynomial curve fitting, and the fitting coefficients for the measured wavefront were obtained. The wavefronts, which had been corrected for tilting, were reconstructed by the obtained coefficients, and the original wavefront under measurement in the pentaprism scanning direction was obtained. The beam of the emergent light wave incident on the pentaprism was incomplete. In the wavefront fitting, the incomplete interference points on the spot edge had to be removed in order to reduce the influence of large errors on the wavefront detection results.
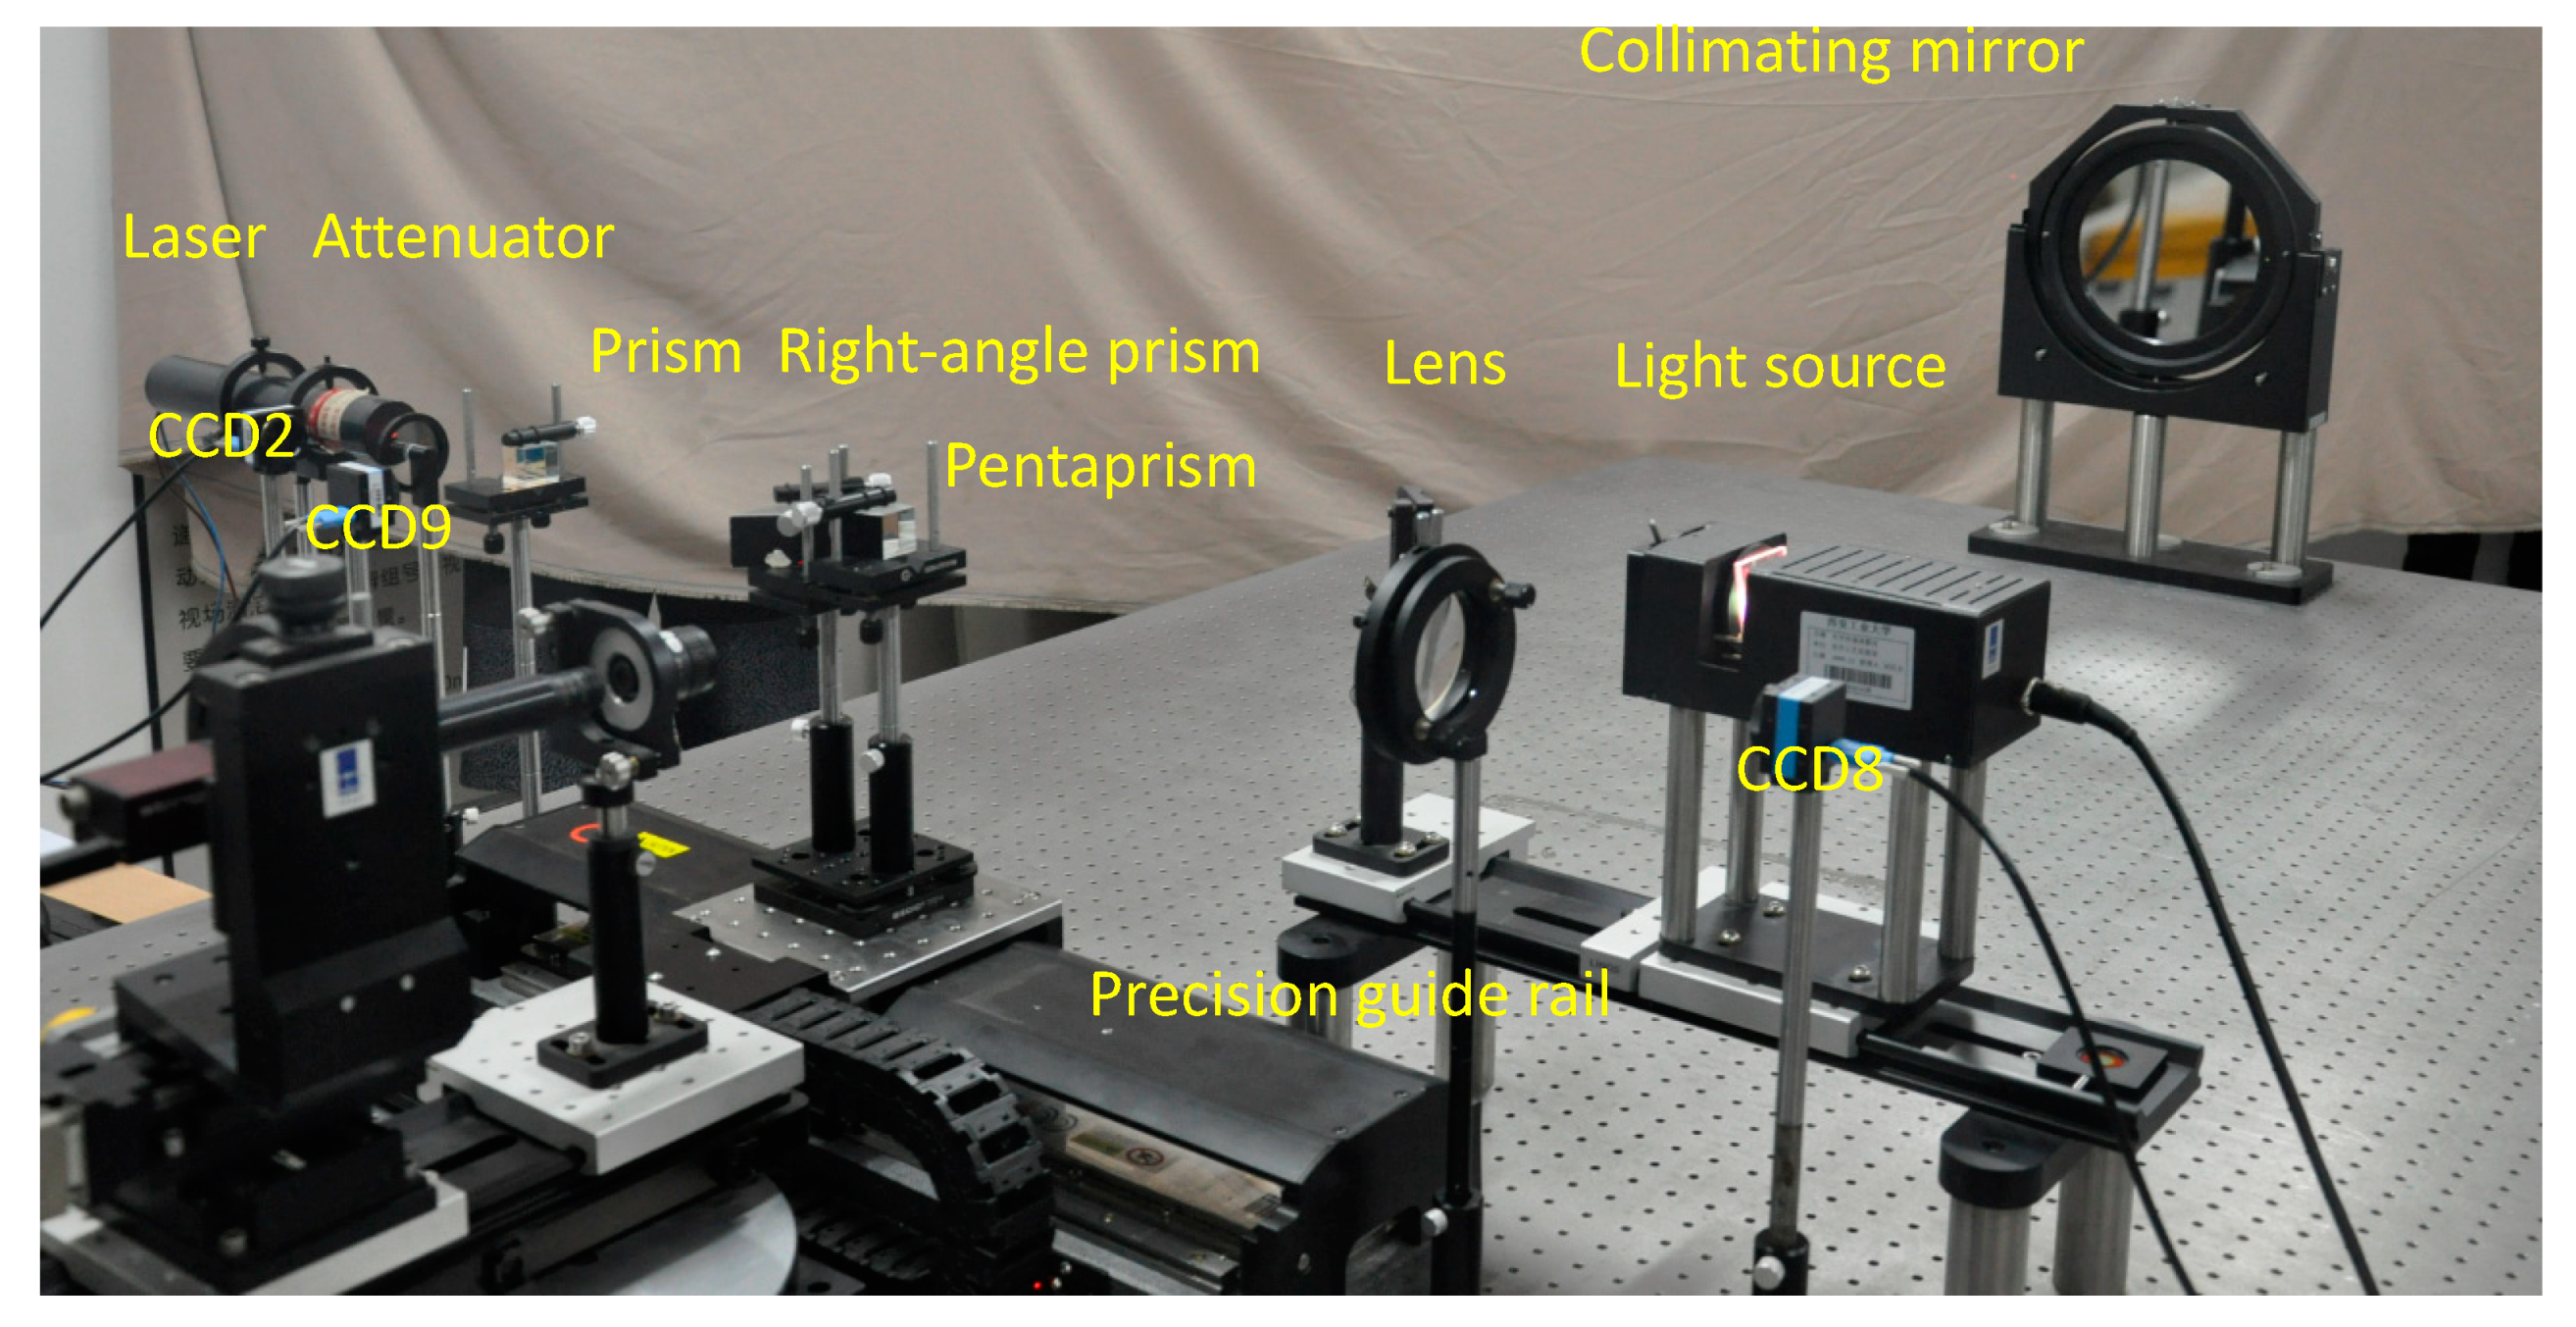
The experimental system mainly included a light source, a collimated wavefront generating system, a high-precision electronically controlled translation stage, a pentaprism scanning system, and a right-angle prism error compensation system, as shown in
Figure 3. The high-precision electronically controlled translation stage was a custom-made marble guide rail and a linear motor-driven micro-translation stage with a displacement resolution of 1 nm and a positioning repeatability of 0.5 μm. For the size of the pentaprism, a smaller optical aperture was selected to improve the detection accuracy of the collimated wavefront with a large aperture. However, the size of the pentaprism was also constrained by the illumination intensity of the beam to be measured; if the size is too small, the optical intensity of the sampled beam is weak. Insufficient luminous flux makes it difficult for CCD cameras to detect valid signals and can lead to difficulties or failures in centroid determination. Therefore, a pentaprism with an optical aperture of 10 mm,
k9 material, and an anti-reflection coating on the surface was used in the experiment.
The wavefront under measurement in the experiment was the collimated wavefront from an Image Science IS-200 transfer function source. The collimated wavefront was reflected from the off-axis parabolic mirror with a 200 mm aperture with a peak-to-valley (PV) value of standard accuracy of 50 nm, or 0.44 λ. According to the sampling theorem, the signal spectrum will be extended periodically in the frequency domain according to the time domain sampling, and the change of the sampling interval is equivalent to the change of the extension period. If the sampling interval is increased, the signal spectral aliasing is abnormal after the expanding periods are reduced, and the final original signal cannot be reconstructed. In order to reconstruct the original signal, the sampling frequency under normal conditions must be greater than twice the signal frequency. If the sampling frequency is reduced to a certain extent, because the sampling interval and frequency have a reciprocal relationship, the sampling theorem is not satisfied. Therefore, the original signal and wavefront cannot be reconstructed.
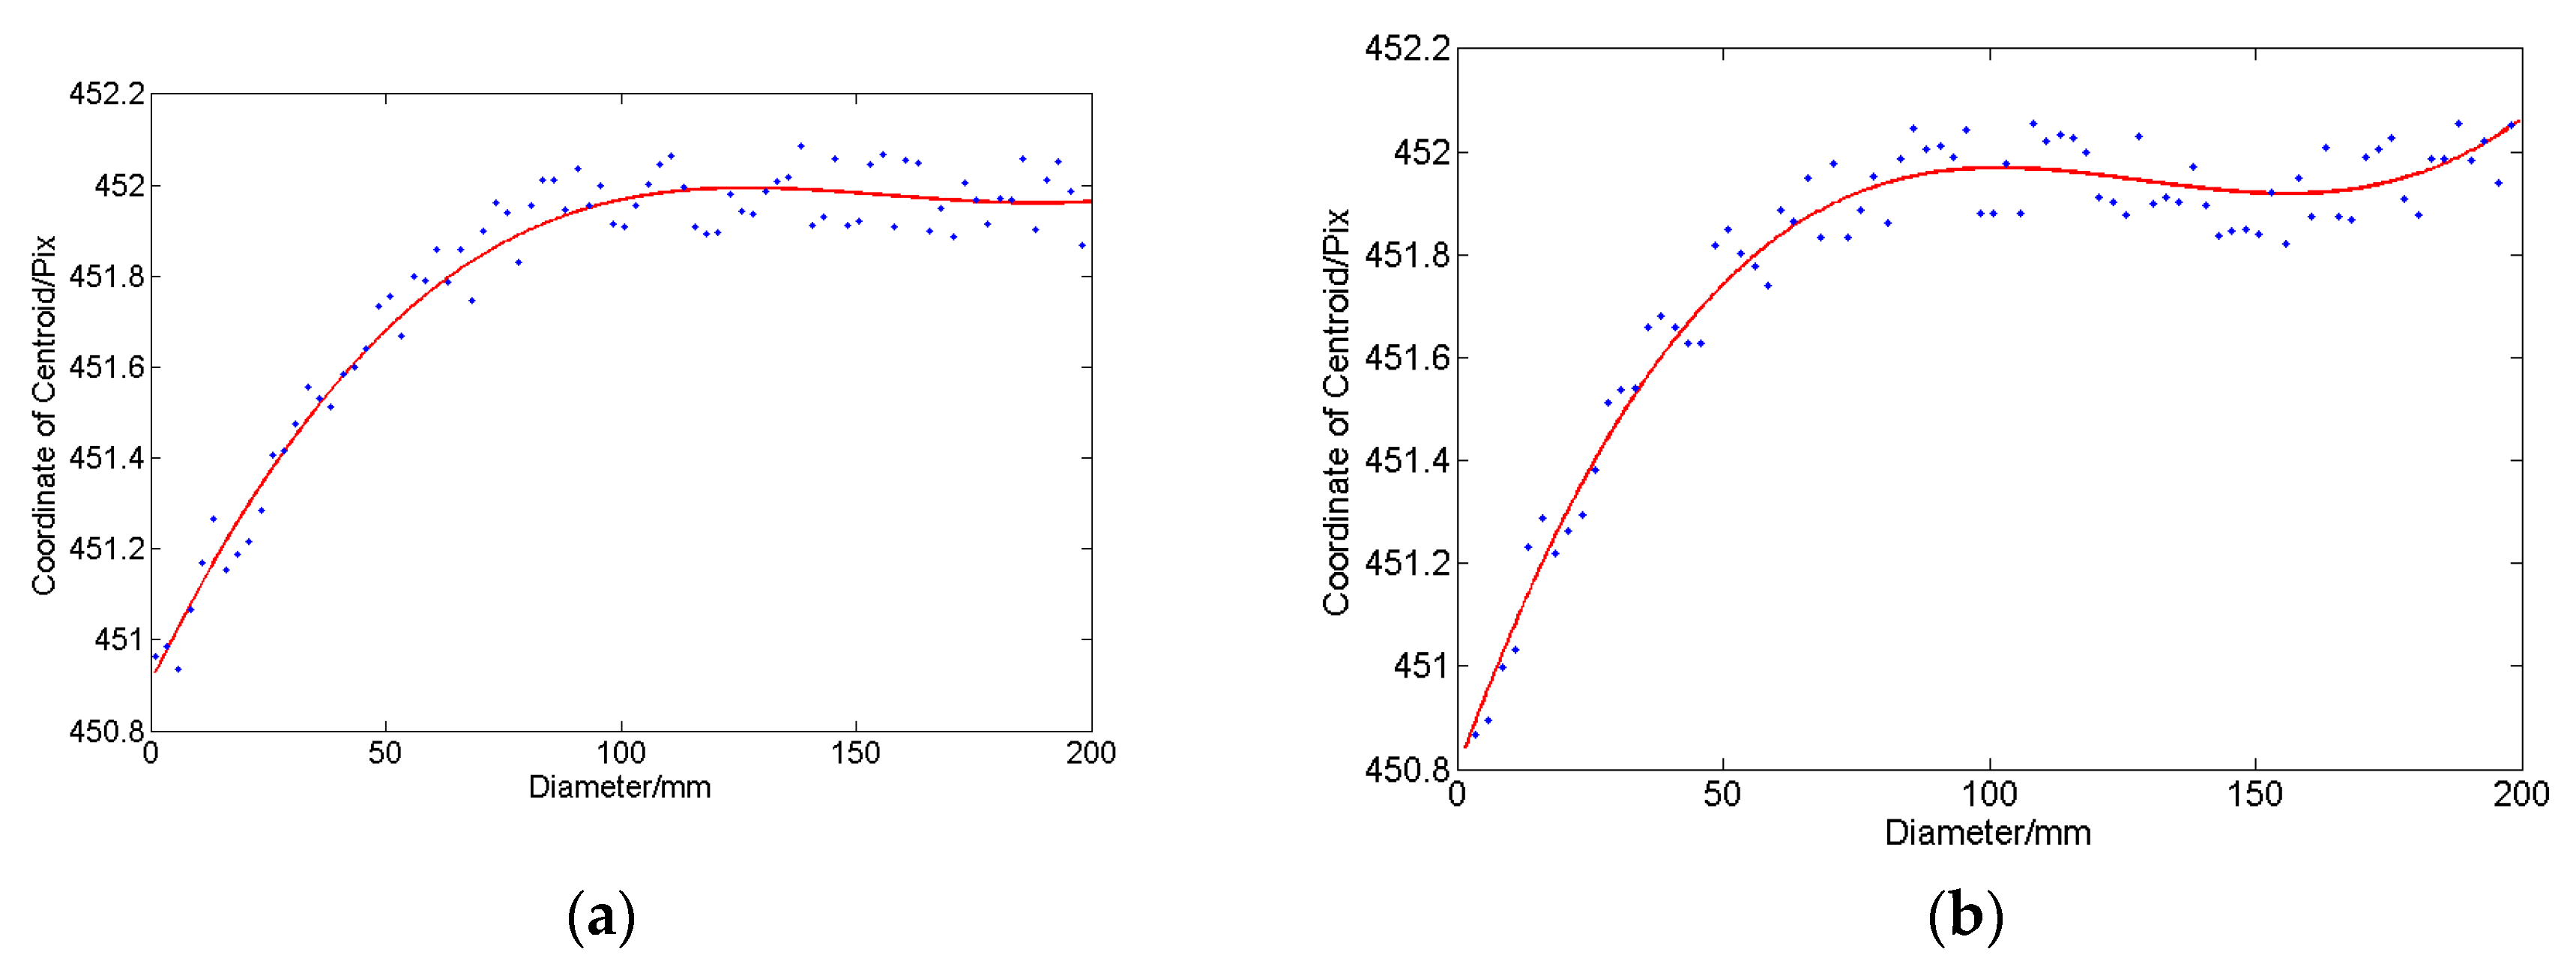
The actual sampling interval of 4 mm was determined according to the Nyquist sampling theorem [
4]. As the stage moved, the spots were obtained by continuous sampling from 0 to 220 mm. The pixel centroid coordinates from the camera were obtained using the centroid algorithm. The data is shown in
Figure 4.
Figure 4a shows the coordinate data of spot centroids obtained by the scanning subsystem, and
Figure 4b shows the coordinate data from the error compensation subsystem. The deviation of the data was large in the travel ranges of 0–10 mm and from 210 mm to 220 mm of the guide rail, which was due to the potential energy error inherent to the precision translation stage. The corresponding deviation data could be obtained through the real-time compensation system. Additionally, there was a tilting-related error in the data before compensation, which generally resulted from the linear motion error of the guide rail.
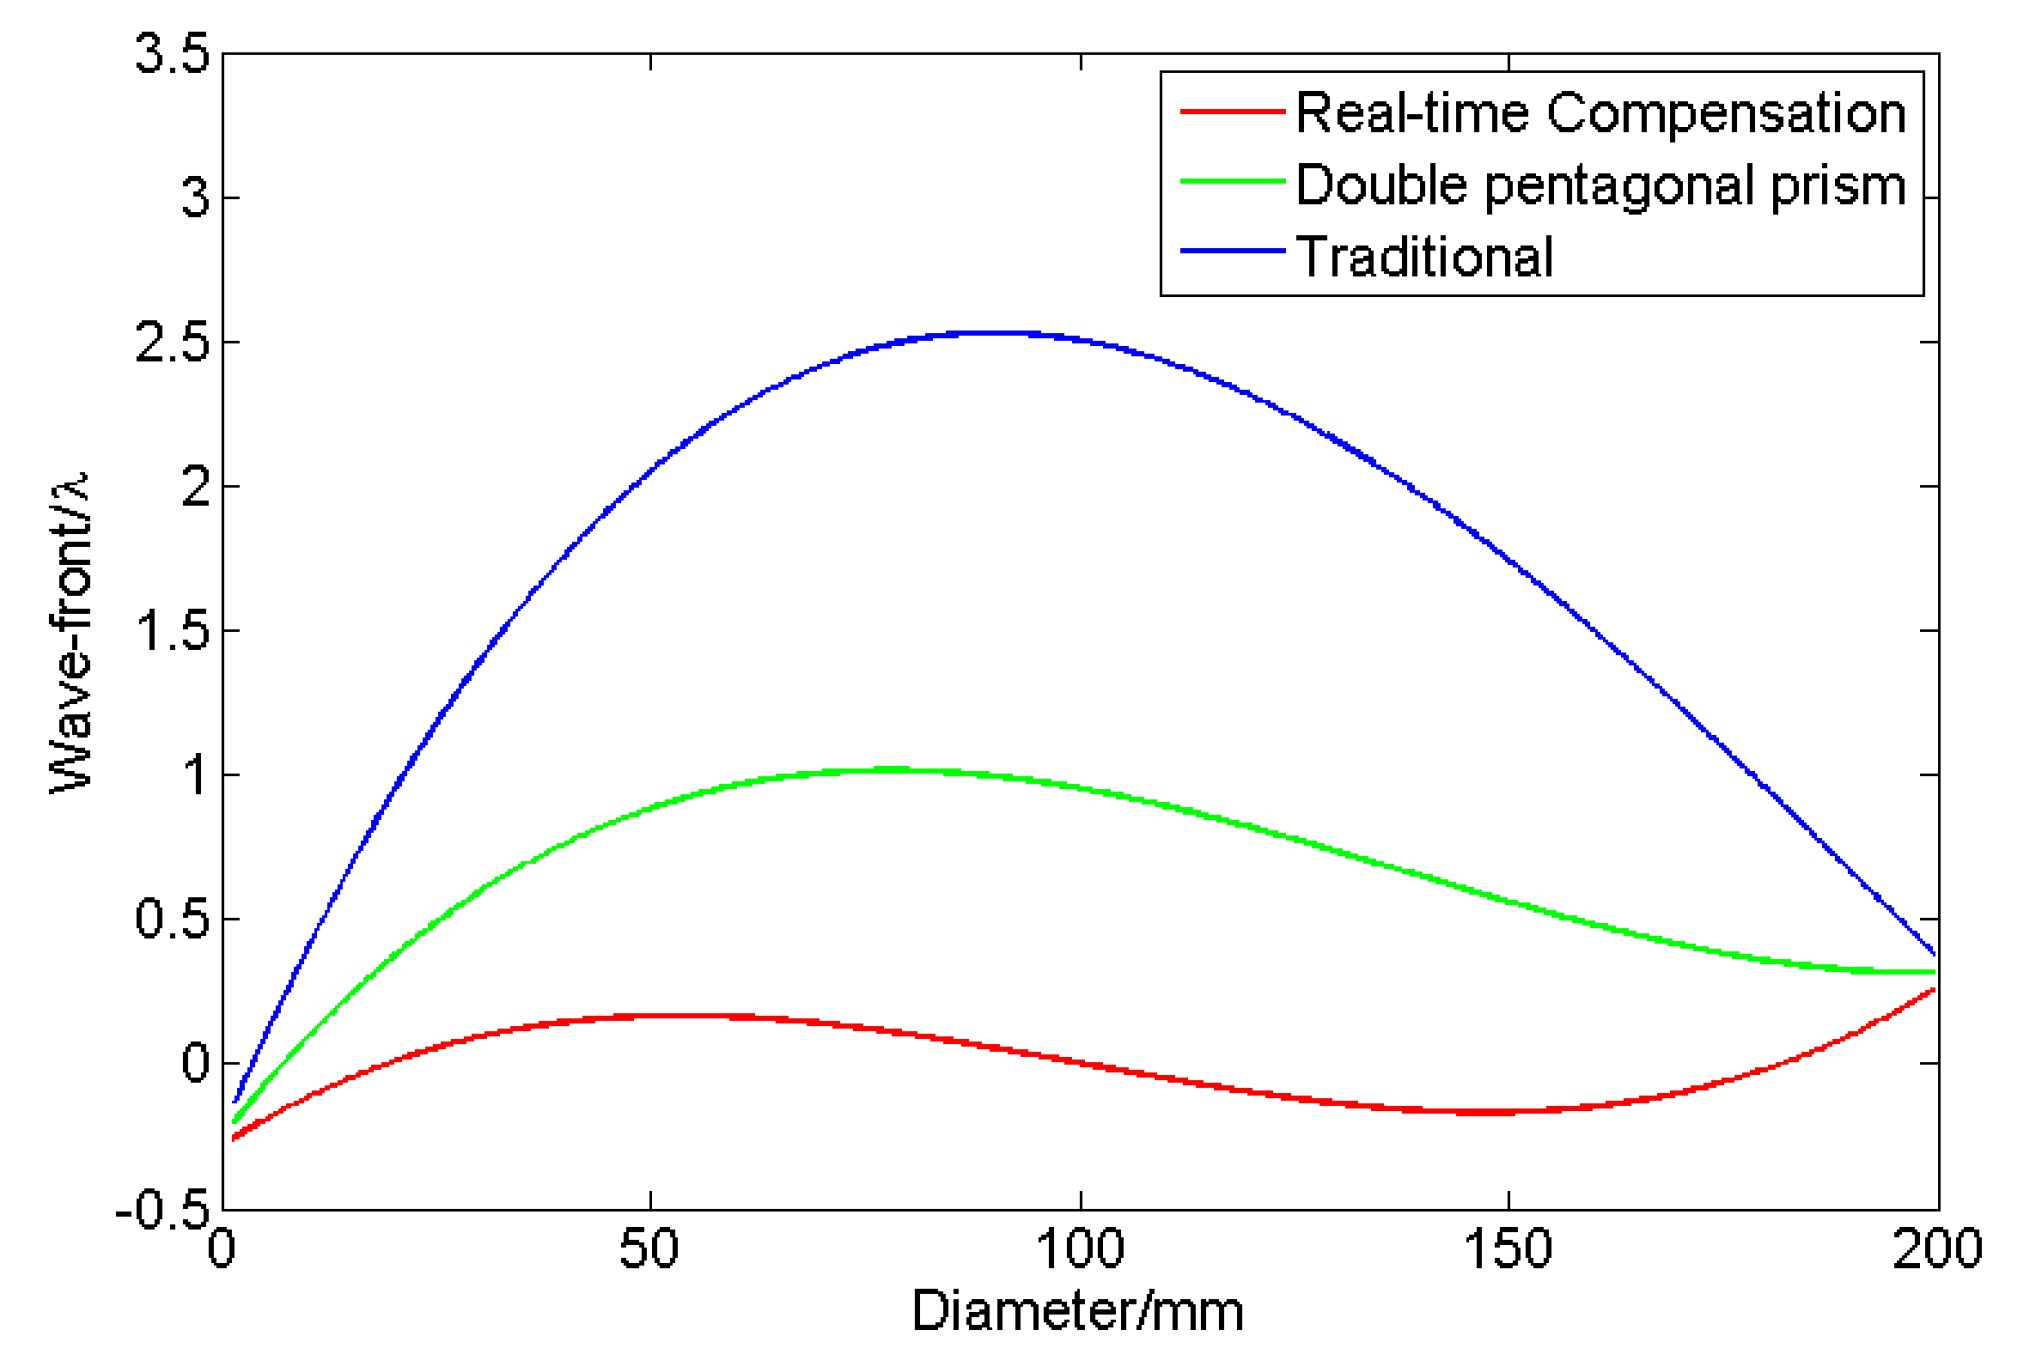
The wavefront under measurement came from the transfer function source with a 300 mm aperture. According to the manufacturer’s datasheet, the values of PV and root mean square (RMS) for the full-aperture wavefront were 0.440 λ and 0.074 λ, respectively. Three pentaprism scanning detection methods: A traditional scanning method, a double pentaprism scanning method [
3], and a real-time compensation scanning method, were used to perform wavefront one-dimensional path scanning. The calculation results are shown in
Table 1 and
Figure 5 shows the data fitting curves. The PV and RMS values measured by the traditional scanning method [
3], the scanning method [
2], and the real-time compensation method proposed in this paper, were 2.65 λ and 0.712 λ, 1.208 λ and 0.360 λ, and 0.512 λ and 0.115 λ, respectively. The wavefront curve after de-tilting and defocusing was generally consistent with the nominal value distribution. The calculations show that the residual for the PV value was 0.072 λ, and the residual for RMS was 0.041 λ. It can be seen that the real-time compensation pentaprism scanning wavefront detection method isolated the guide rail errors and effectively improved the measurement accuracy.
During the experiment, if non-parallel or non-perpendicular alignments occurred with regard to the components, a large error was introduced. The positions between the various components were adjusted, and the linear guide rail was moved as the spot on the CCD was observed. As the displacement distance of the guide rail increased, the spot collected by the CCD remained stable, and then the positional adjustment of the compensation device was complete. The compensated CCD had a large spot variation when the sampling was carried out. The centroid coordinate error could cause the compensated result to be larger than the pre-compensated result. When constructing the compensation device, the laser was ensured to be normally incident to the hypotenuse surface of the right-angle prism and to the CCD.
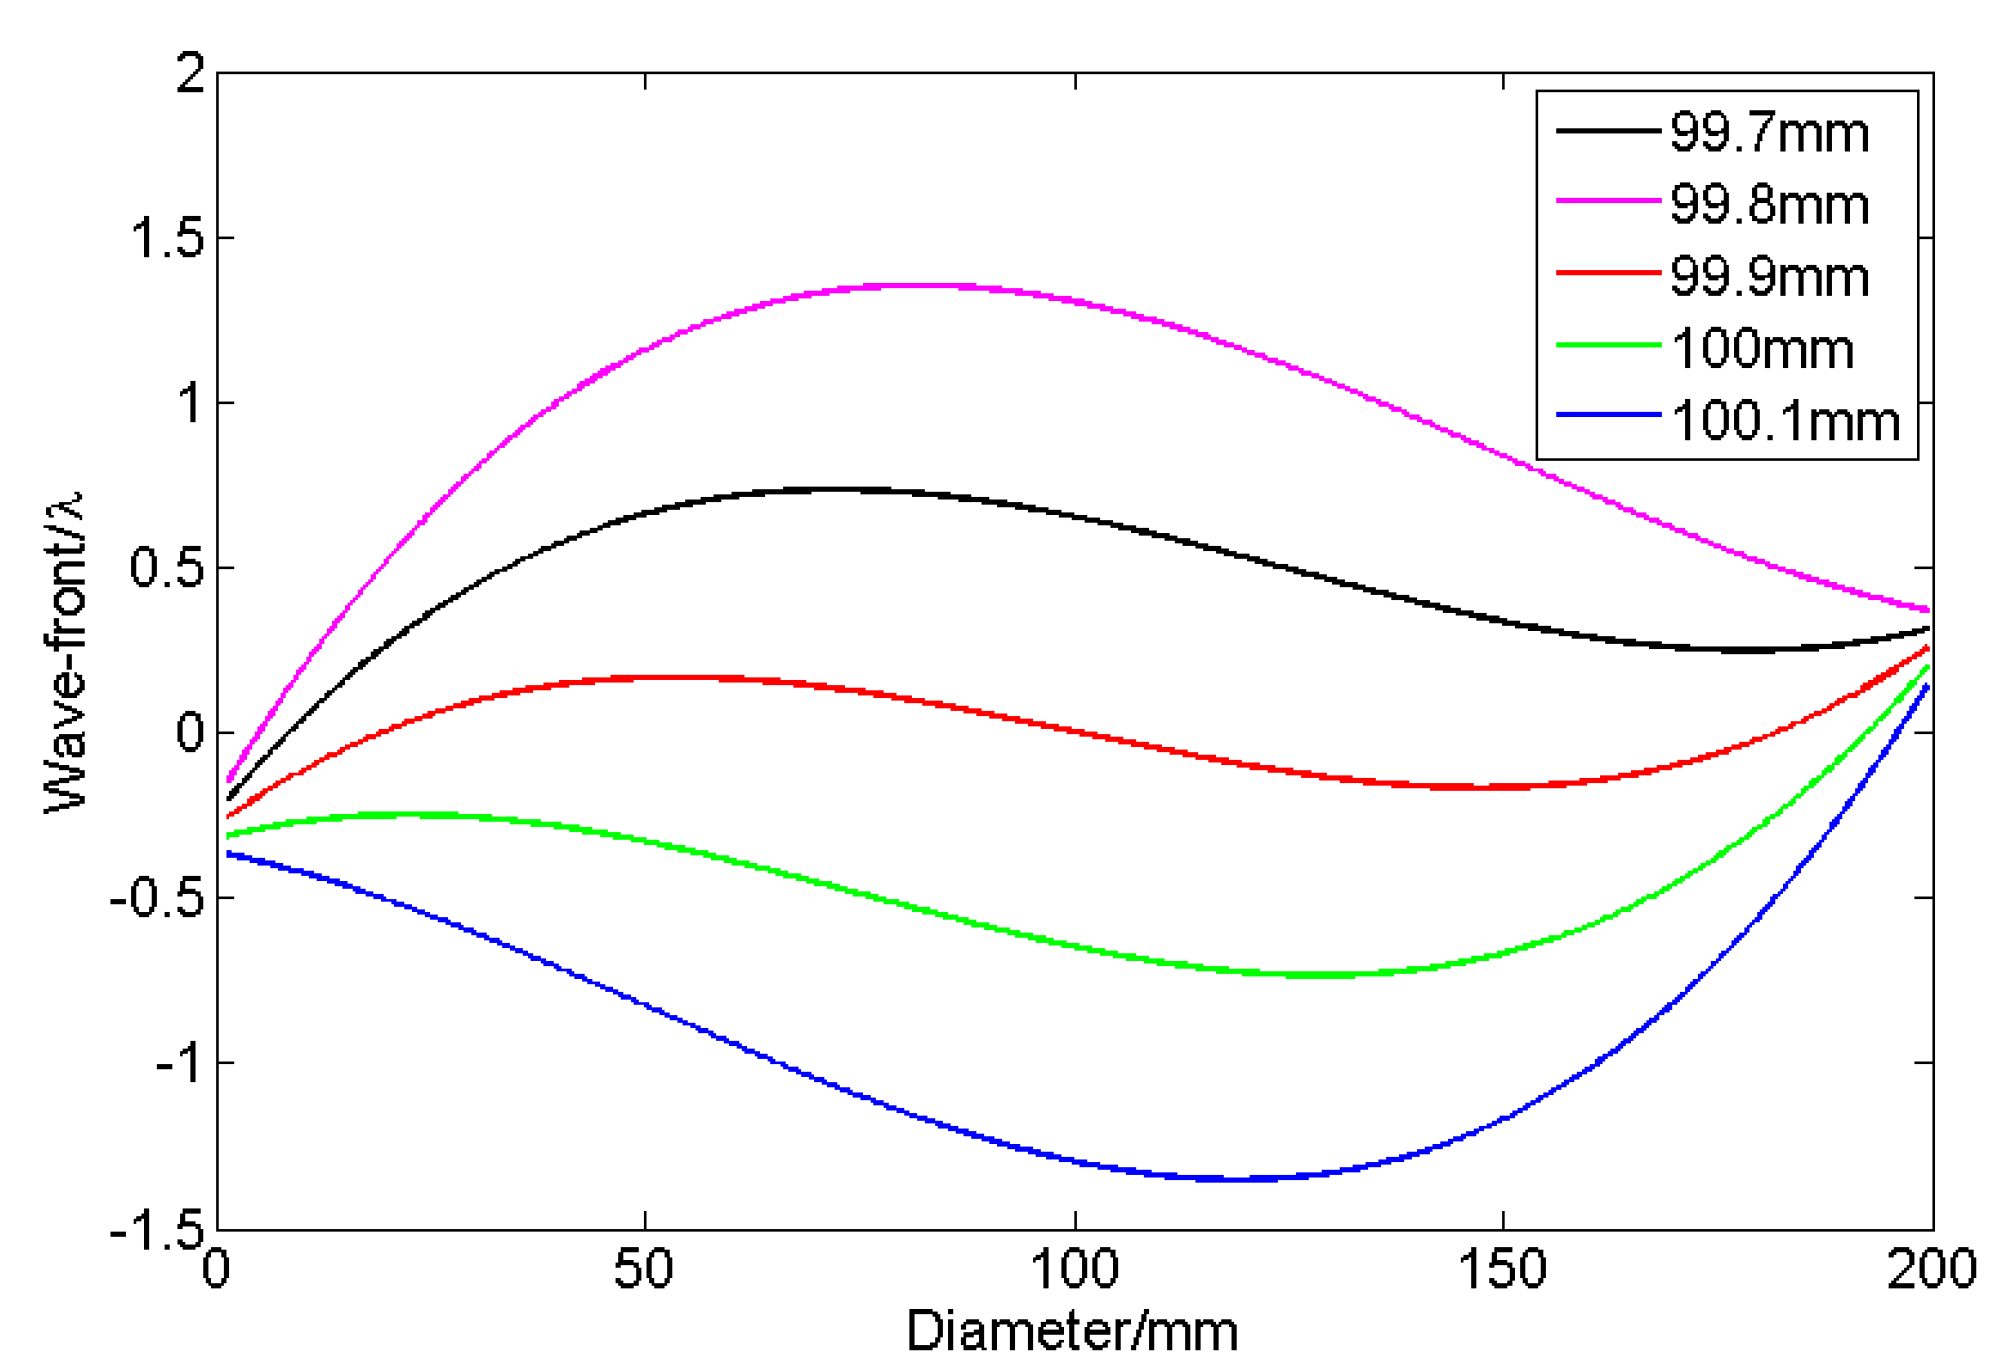
In the experiment, the effect of the CCD focusing accuracy could be adjusted by observing the sharpness of the spot image. However, there is always uncertainty inherent to a human observer. Therefore, a set of scanning experiments were designed in this study. In order to represent the test results of the measured wavefront under different defocusing conditions, a number of defocusing positions were generated near the ideal focus. One-dimensional scanning along the sagittal direction of the emergent wavefront was performed near the actual defocusing point with 0.1 mm as the minimum distance step. The data obtained are shown in
Figure 6, which correspond to the focal positions of 99.7 mm, 99.8 mm, 99.9 mm, 100 mm, 100.1 mm, 100.2 mm, and 100.3 mm. The results of the analysis indicated that when the lens focal length was 99.9 mm, the residual of the fitted curve for the emergent wavefront in the sagittal direction, as well as the residual for the actual wavefront, were the smallest, with a PV value of 0.512 λ and a residual of 0.072 λ, respectively. Significant defocusing errors occurred in several other focusing positions. Due to manufacturing-related errors of the optical components, experimental analysis can be performed by increasing the step resolution based on the desirable detection accuracy requirements.
Compared with the traditional pentaprism scanning method, the advantages of this method are: (1) The error compensation subsystem separates the measurement error caused by changes in the direction of the incident beam, which results from the pitch, yaw, and roll of the pentaprism, and (2) the method performs the compensation in real time, thereby avoiding the system error of the guide rail caused by manufacturing or assembly errors. The method is simple and provides high measurement accuracy. The measurement residual for the PV and RMS values was 0.072 λ and 0.041 λ, respectively.


