Article

Reconstruction of the Microstructure of Cyanate Ester Resin by Using Prepared Cyanate Ester Resin Nanoparticles and Analysis of the Curing Kinetics Using the Avrami Equation of Phase Change

Research Institute of Carbon Fiber and Composite Materials, Beijing University of Chemical Technology, Beijing 100029, China
*
Authors to whom correspondence should be addressed.
Appl. Sci. 2019, 9(11), 2365; https://doi.org/10.3390/app9112365
Submission received: 4 May 2019 / Revised: 4 June 2019 / Accepted: 5 June 2019 / Published: 10 June 2019
(This article belongs to the Special Issue Phase Transitions in Polymer and Polymer-Based (Nano)Composites)

Abstract

:

Featured Application

The addition of the BADCy resin nanoparticles can accelerate the formation of the microgels in the BADCy resin prepolymer. The kinetic paraments of systems with different BADCy resin nanoparticles contents were obtained using the Avrami equation and Arrhenius equation and explained the formation and growth of the microgels.

Abstract

Bisphenol A dicyanate (BADCy) resin nanoparticles were synthesized by precipitation polymerization and used to modulate the microstructure of the BADCy resin matrix. A microscopic mechanism model was used to characterize the curing process of BADCy resin systems with different contents of the prepared nanoparticles. Due to the curing process of the thermosetting resin being analogous to the crystallization process of the polymer, the Avrami equation was used to analyze the microscopic mechanism of the curing process. The reactive functional groups, structure, and size of the prepared BADCy resin nanoparticles were characterized by FT-IR, SEM, and TEM, respectively. The kinetic parameters of different systems were then obtained using the Avrami equation, and they adequately explained the microscopic mechanism of the curing process. The results showed that the Avrami equation effectively described the formation and growth of gel particles during the curing process of the BADCy resins. The addition of nanoparticles can affect the curing behavior and curing rate. Since the reaction between the BADCy resin nanoparticles and the matrix is dominant, the formation process of the gel particles was neglected. This phenomenon can be understood as the added BADCy resin nanoparticles replacing the formation of gel particles. The reasons for accelerated curing were analyzed from the perspective of thermodynamics and kinetics. Besides this, the Arrhenius equation for non-isothermal conditions correctly accounted for the change in the cross-linked mechanism in the late-stage curing process. A comparison of the theoretical prediction with the experimental data shows that the Avrami theory of phase change can simulate the curing kinetics of different BADCy resin systems well and explain the effects of BADCy resin nanoparticles on the formation of the microstructure.

Graphical Abstract

1. Introduction

Cyanate ester (CE) resins are novel high-performance thermosetting resins similar to epoxy (EP) and bimaleimide (BMI) that have been developed in recent decades [1]. CE monomers contain two or more -OCN functional groups which can form a highly symmetrical triazine ring structure after the curing reaction [2]. It is the chemical nature of the CE monomers and the unique structure of the cured resin that give rise to a series of properties, such as excellent mechanical properties, a high glass transition temperature, low contractibility rate, low water absorption, and ultralow dielectric constant and dielectric loss values [3,4,5,6]. Compared with other thermosetting resins, CEs have excellent overall performance. Therefore, CEs are a proven replacement for thermosets, such as epoxy or polyimide, in applications in the aerospace, electronics, and communications industries [4,7,8,9,10,11].
CE monomers polymerize via a ring-forming reaction under the conditions of heating or catalysts. Simmon first proposed the self-polymerization mechanism of CE resins in the absence of a catalyst [12]. The curing reaction of the CE resins was initiated and catalyzed by impurities in the monomer or moisture in the environment. However, this process proceeds with difficulty when the purity of the monomer is high [13]. Active hydrogen containing compounds, such as phenols, amines, and imidazole, in concert with metal ions can catalyze the curing of CE resins [14]. This reaction is depicted in Figure 1. A range of such metal ions has been reported, including chromium [15], manganese [16], iron [17], cobalt [18], tin [19], zinc [20], and copper [21]. However, the metal ion compounds have poor solubility in the CE resins and promote the hydrolysis reaction of the triazine ring as well; as a result, these metal salts are rarely used as a catalyst. Alternative catalytic systems have always been an important direction of research. At present, room temperature ionic liquids (RTILs) and organically modified layered silicate have been proved to accelerate CE resin curing [22,23,24].
Physical and structural changes affect the polymerization kinetics and the structure. Therefore, the identification of relevant kinetic models can provide insight into the curing process of thermosetting resin systems. In the curing process, identifying each step of the chemical reaction is very difficult. Especially, in the late curing stage, the diffusion factor plays a controlling role. Thus, the phenomenological model, rather than the mechanism model, is used [25]. The Kamal kinetic model considers both the autocatalytic behavior and the n-stage reaction, and it can be used to describe the curing process of thermosetting resins precisely [26]. However, these models are limited to describing the curing reaction process and do not give specific physical meaning to the parameters. Previous studies demonstrated that the Avrami equation considerably illustrated the isothermal and non-isothermal curing behavior of thermosetting resins [25,27,28,29].
The essence of thermosetting resin curing is the cross-linked chemical reaction of linear polymer chains. Meanwhile, this is accompanied by microphase separation, the shift of the glass transition, and other processes, eventually forming a three-dimensional network structure. It is generally believed that the crystallization process of the polymer includes two processes of nucleation and growth [30]. The first step is the formation of crystal nuclei. Due to local fluctuations in the parent phase, the local free energy increases, resulting in a small range of new phases (clusters). The clusters can continue to grow and become macroscopic crystals, which can also dissolve and disappear. When the cluster reaches a certain size—that is, a critical size—it becomes a crystal nucleus. The second step is the growth of the crystal nucleus, which is characterized by the diffusion and stacking of the polymer segment to the nucleus. In terms of the microscopic mechanism, the curing process of the thermosetting resins is quite similar to the crystallization of polymers. The curing process is a chemical cross-linked process, and crystallization can be seen as a physical cross-linked process. In the process of the cross-linking of linear polymers, there are many molecular aggregates or high-average-molecular-mass particles [31]. These microgel particles are stably dispersed in the low molecular oligomers. As the curing reaction progresses, the number of microgel particles increases, their volume becomes larger, and they collide with each other, resulting in the viscosity of the system increasing. Finally, the initial phase is wrapped by the new phase to undergo two-phase conversion, with the result being that the gel phase becomes a continuous phase. The formation of microgel particles can be analogized to the nucleation process, and the volume increase can be analogized to the growth of crystal nuclei. In summary, the Avrami equation based on phase transition theory can be applied to study the curing kinetics of thermosetting resins.
In this work, we prepared bisphenol A dicyanate (BADCy) resin nanoparticles using BADCy monomer by precipitation polymerization. The nanoparticles were dispersed in the prepolymer to study changes in the formation process of the microgels, in which the nanoparticles and matrix belonged to the same polymer family but had different chemical structure [32]. The BADCy prepolymer was synthesized in our laboratory. The added BADCy resin nanoparticles were equivalent to the microgels, and their function was to serve as a reaction site, inducing curing of the BADCy matrix. This process is shown in Figure 2. The dynamic curing behavior of the BADCy resin systems was studied and the kinetic parameters were obtained by using the modified Avrami equation.

2. Materials and Methods

2.1. Reagents and Materials

BADCy monomer (white crystalline powder, 99% purity) was purchased from Yangzhou Techia Material Co., Ltd. (Yangzhou, China). Zinc acetylacetonate hydrate (97% purity) and nonylphenol were purchased from Aladdin (Shanghai, China) and Macklin (Shanghai, China), respectively. Xylene was obtained from Beijing Chemical Co., Ltd. (Beijing, China). All were used as received.

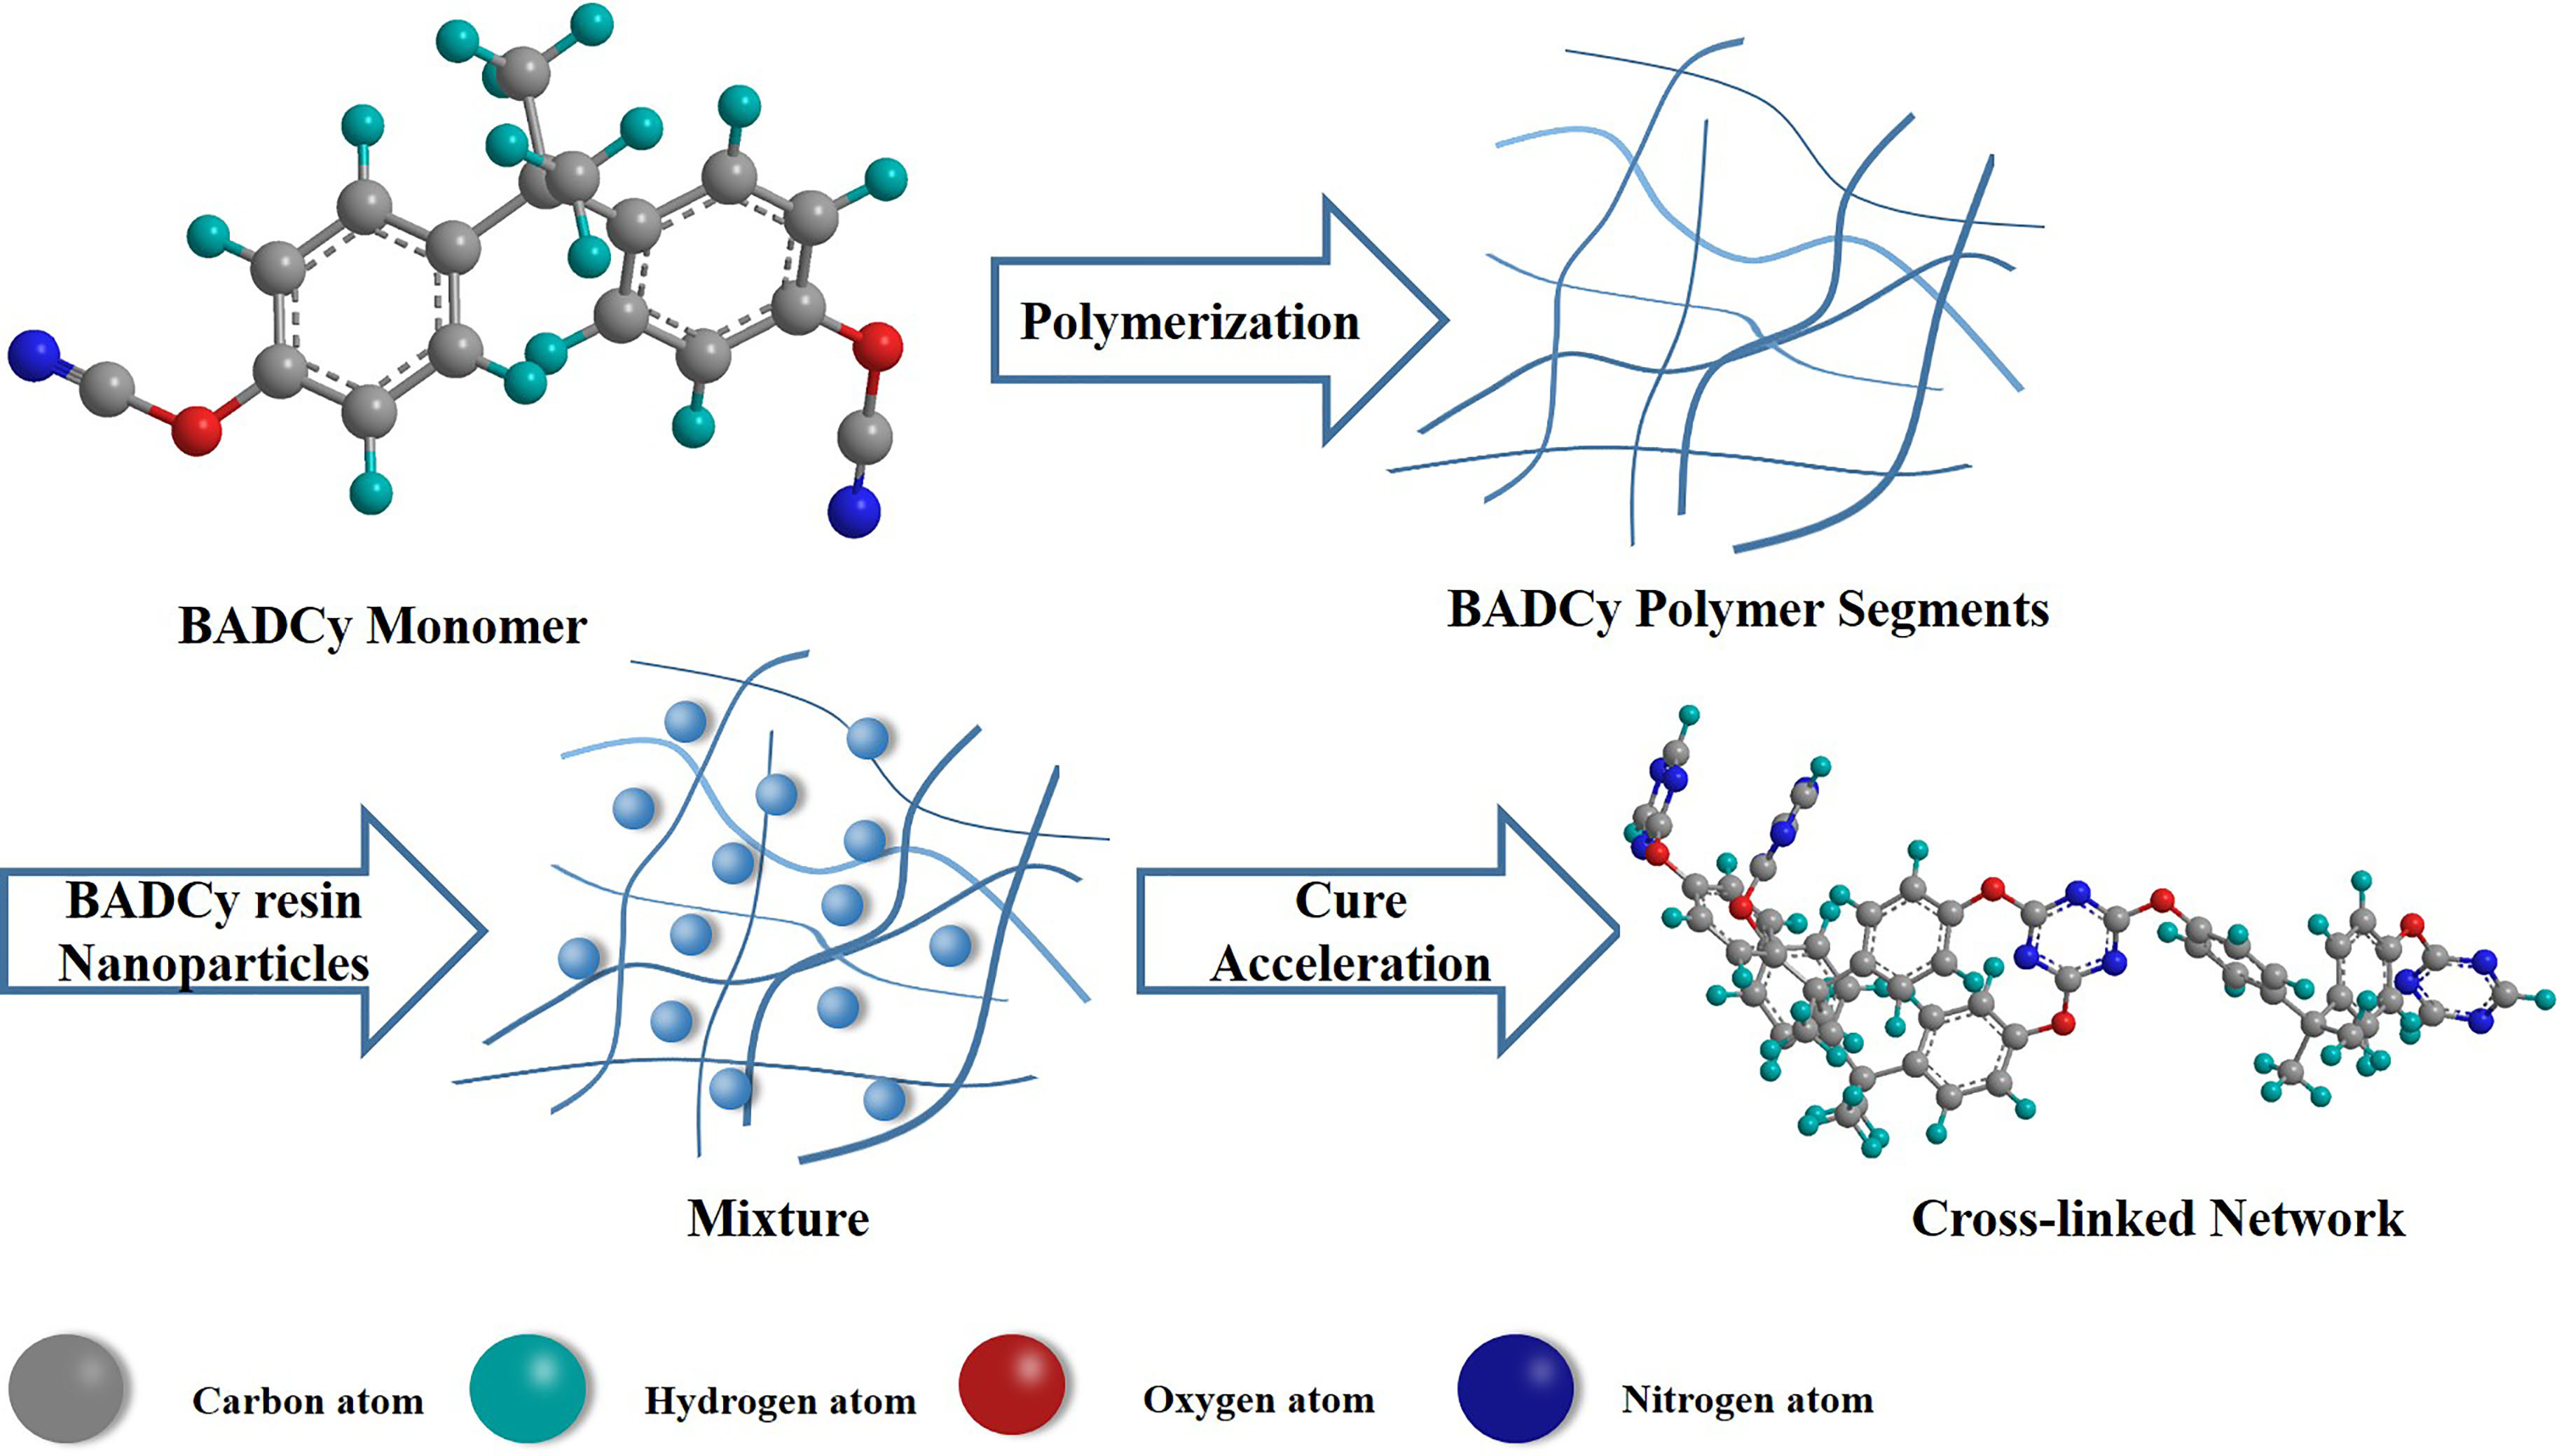
2.2. Preparation of BADCy Resin Nanoparticles

A certain mass ratio (5:100) of xylene and BADCy monomer was added to a three-mouth flask, and stirred at 100 °C until the BADCy monomer totally dissolved. Then, zinc acetylacetonate hydrate and nonylphenol (two thousandths of the mass of the monomer) as catalyst were dissolved in xylene and quickly added to the three-mouth flask. The mixture was heated at 100 °C, and stirred fast for 1 h. The temperature was raised to 130 °C and heating was continued for 3.5 h. The BADCy resin nanoparticles were obtained after centrifugation, washing, and decompression drying.

2.3. Preparation of BADCy Resin Prepolymer

First, the BADCy monomer was melted at 100 °C. Second, the moisture was removed under decompression at 80 °C. Finally, the liquid was heated at 200 °C for 2 h and the temperature was cooled to 180 °C and heating was continued for 8 h until a clear homogeneous melt was obtained. The viscous melt was defined as the BADCy resin prepolymer.

2.4. Characterization and Measurements

Fourier transform infrared (FT-IR) spectra were measured between 400 and 4000 cm−1 using a Nicolet 8700 FT-IR spectrometer (Thermo Fisher Scientific, Shanghai, China). For each spectrum, a resolution of 4 cm−1, 32 scanning times, and a KBr table was used. Sample measurements were recorded at room temperature.
Scanning electron microscopy (SEM) was carried out using an S-4700 cold-field scanning electron microscope (Hitachi, Japan). The accelerating voltage was 20 kV and the samples were coated with gold.
Transmission electron microscopy (TEM) was performed using an HT7700 biological transmission electron microscope (Hitachi, Japan).
Differential scanning calorimetry (DSC) was carried out using a TA Instruments DSC25 calorimeter (TA Instruments, New Castle, DE, USA). Each sample was tested at 5, 10, 15, and 20 °C/min, over a range of 50-380 °C and with a N2 flow of 50 mL/min.

3. Results and Discussion

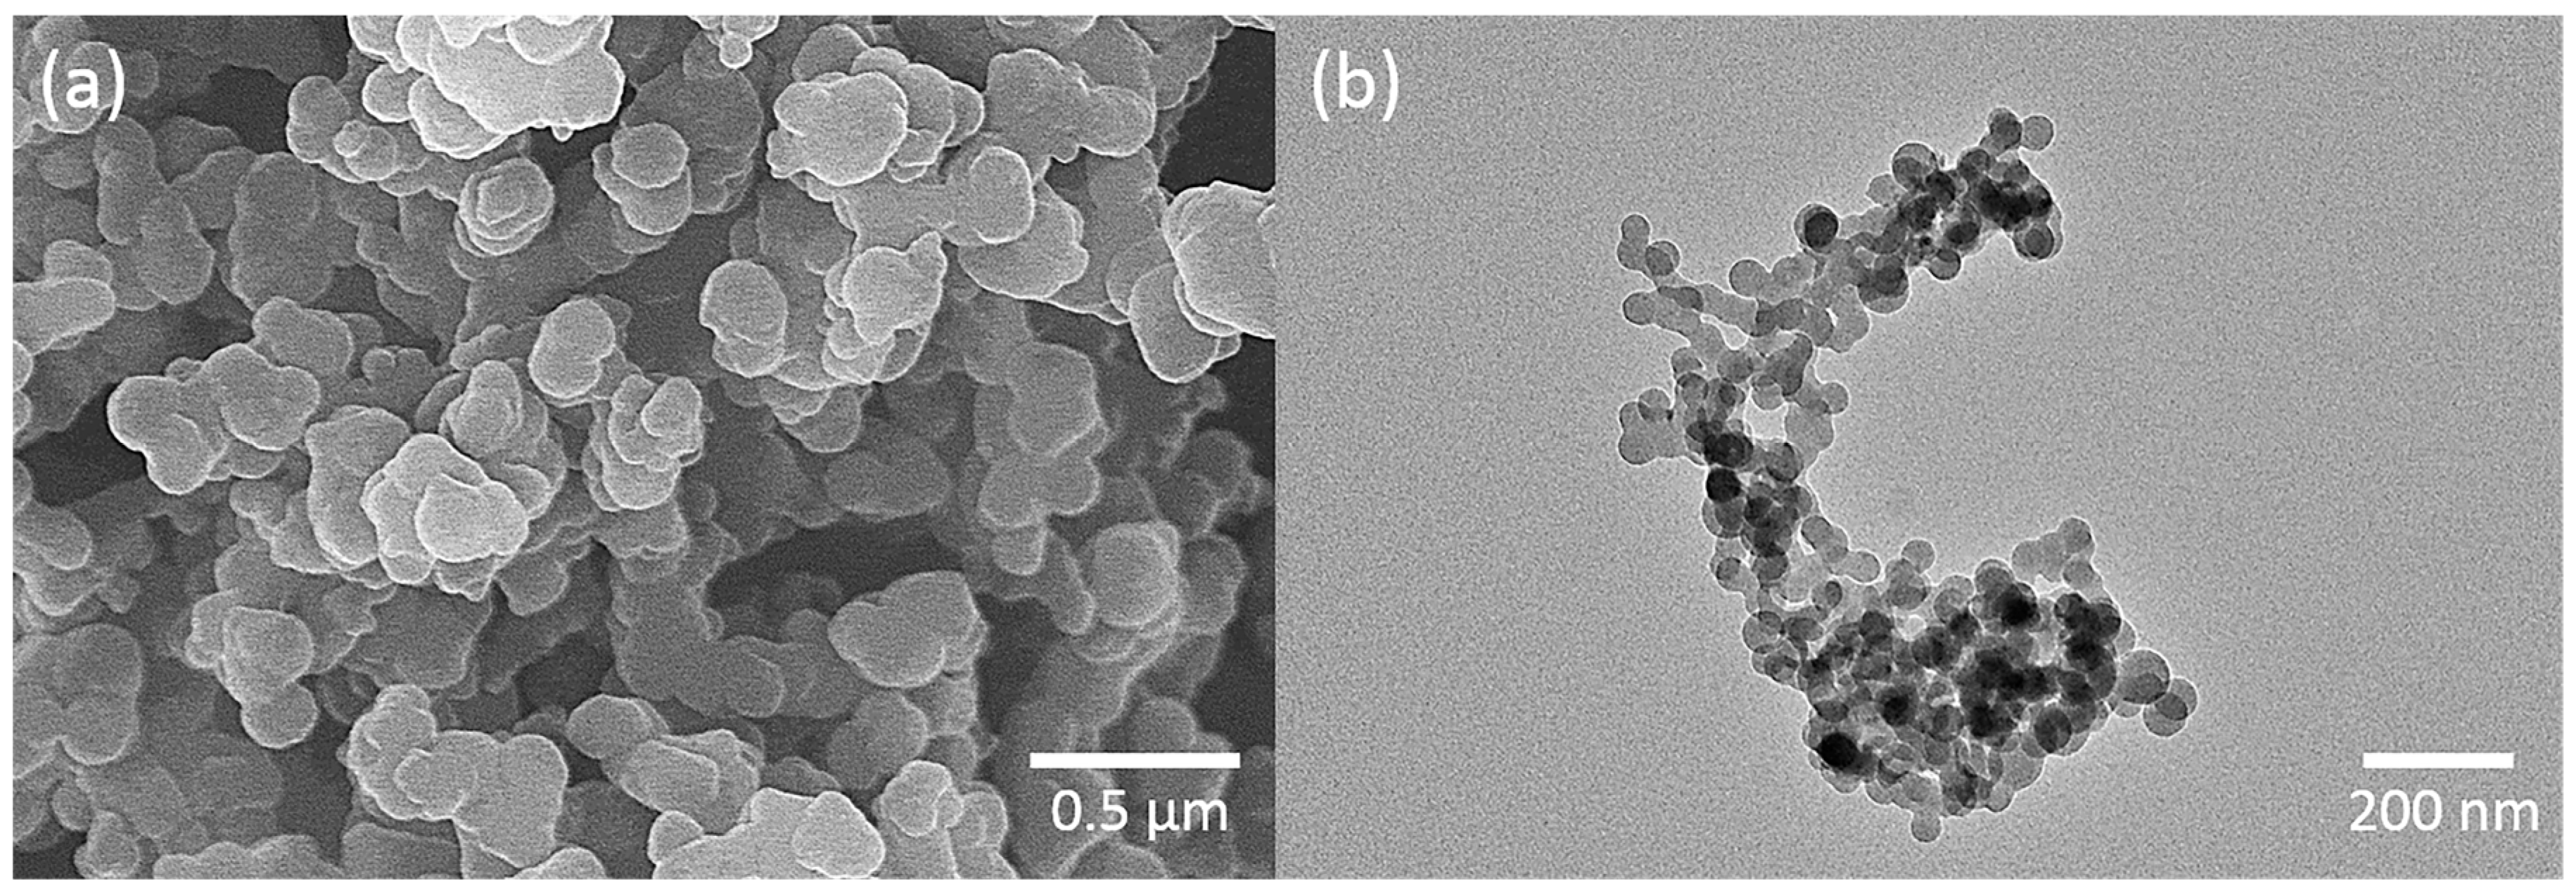
3.1. Characterization of the BADCy Resin Microparticles

The FT-IR spectra curves of the BADCy monomer and BADCy resin nanoparticles are shown in Figure 3, from which the molecular structure characteristics of the BADCy monomer and BADCy resin nanoparticle were ascertained. Compared with the BADCy monomer, the most apparent differences are the new peaks at 1568 and 1369 cm−1. These two new peaks are due to the triazine ring structure formed by the monomer under the conditions of catalysts and heating [33]. Besides this, the -OCN functional group of the BADCy resin nanoparticles at 2270 cm−1 is reduced compared with the monomer because the chemistry mechanism of the reaction is a trimerization of three -OCN groups into a triazine ring. According to the result of the FT-IR spectra, the -OCN functional group peak at 2270 cm−1 does not completely disappear. It can be seen that the prepared BADCy resin nanoparticles still have an active -OCN functional group and can continue to react. Figure 4 shows a dynamic DSC curve of the BADCy resin nanoparticles and the matrix, indicating that the nanoparticles are still exotherms during the dynamic heating process, but with less heat than the matrix. It can also be concluded that the prepared BADCy resin nanoparticles have reactivity.
The structure and size of the prepared BADCy resin nanoparticles were characterized by SEM (a) and TEM (b) as shown in Figure 5. After the reaction, the mixed solution was successively subjected to centrifugation, washing, and vacuum drying to obtain a pale yellow solid powder. The powders were subjected to SEM observation. From the SEM images of the BADCy resin nanoparticles, a large quantity of aggregates (micron-sized) was observed. A single aggregation particle ranged in size from 0.2 to 0.3 μm. The powder was then dispersed in an ethanol solvent via ultrasonic dispersion. A drop of stable dispersion was dropped on a copper grid, dried, and observed using the transmission electron microscope. It can be seen that the BADCy resin nanoparticles ranged in size from 40 to 60 nm and there was no aggregation.
From the above results, when the reaction solution was subjected to post-treatment, especially the drying process, the nanoparticles were aggregated and nano-sized particles became micro-sized. During the dying process, the nano-sized particles tended to aggregate as the solvent evaporated until a stable size was reached.

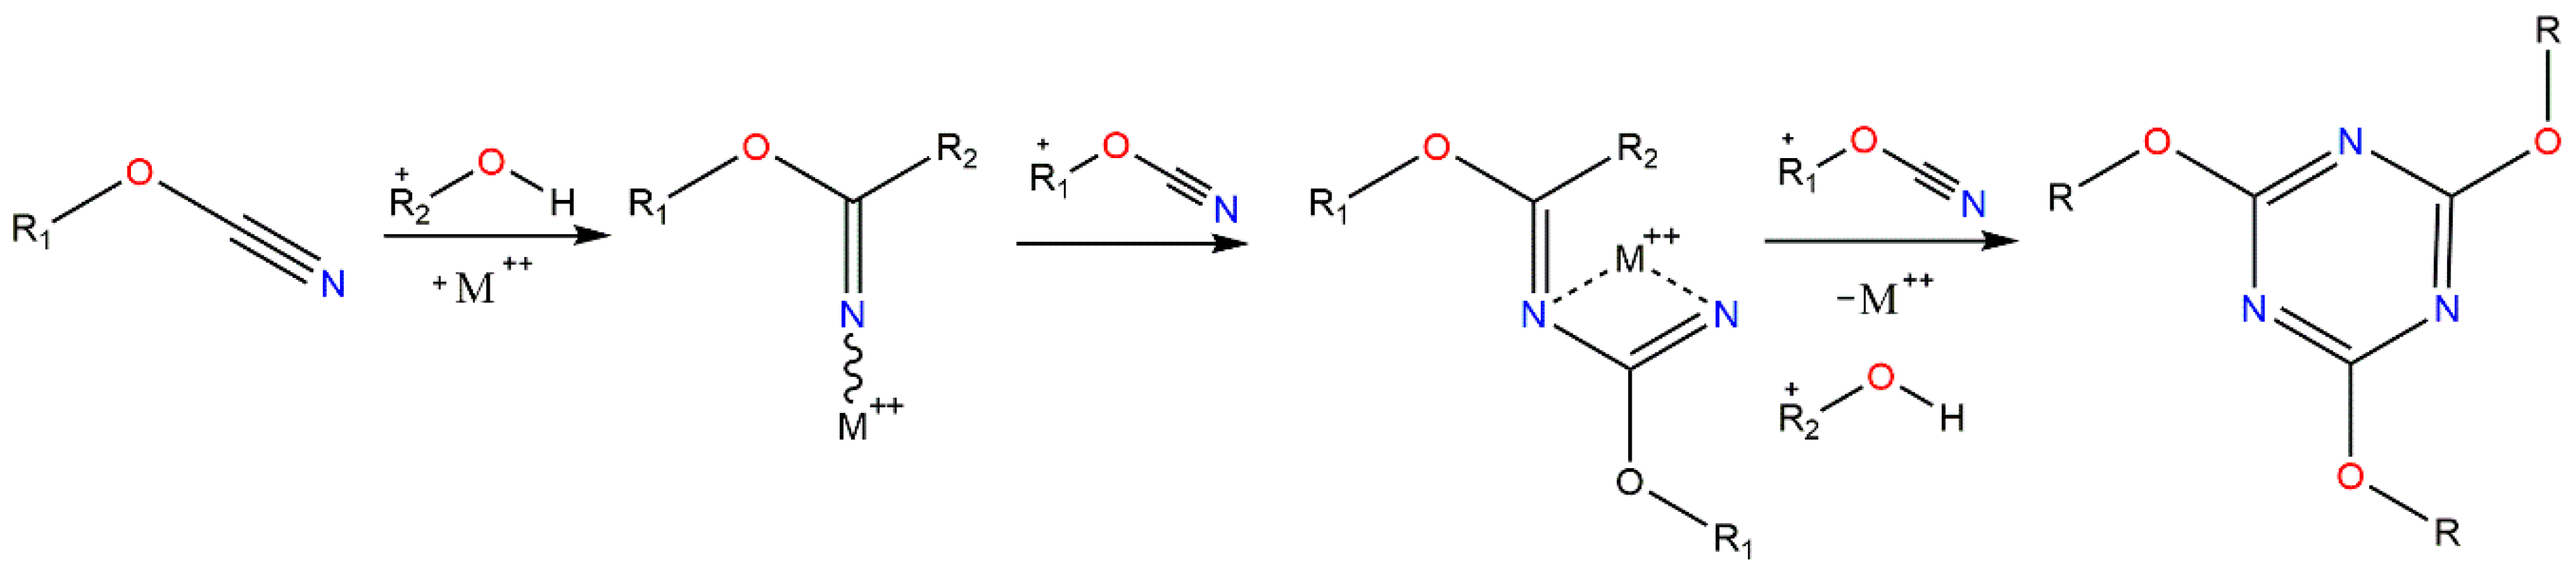
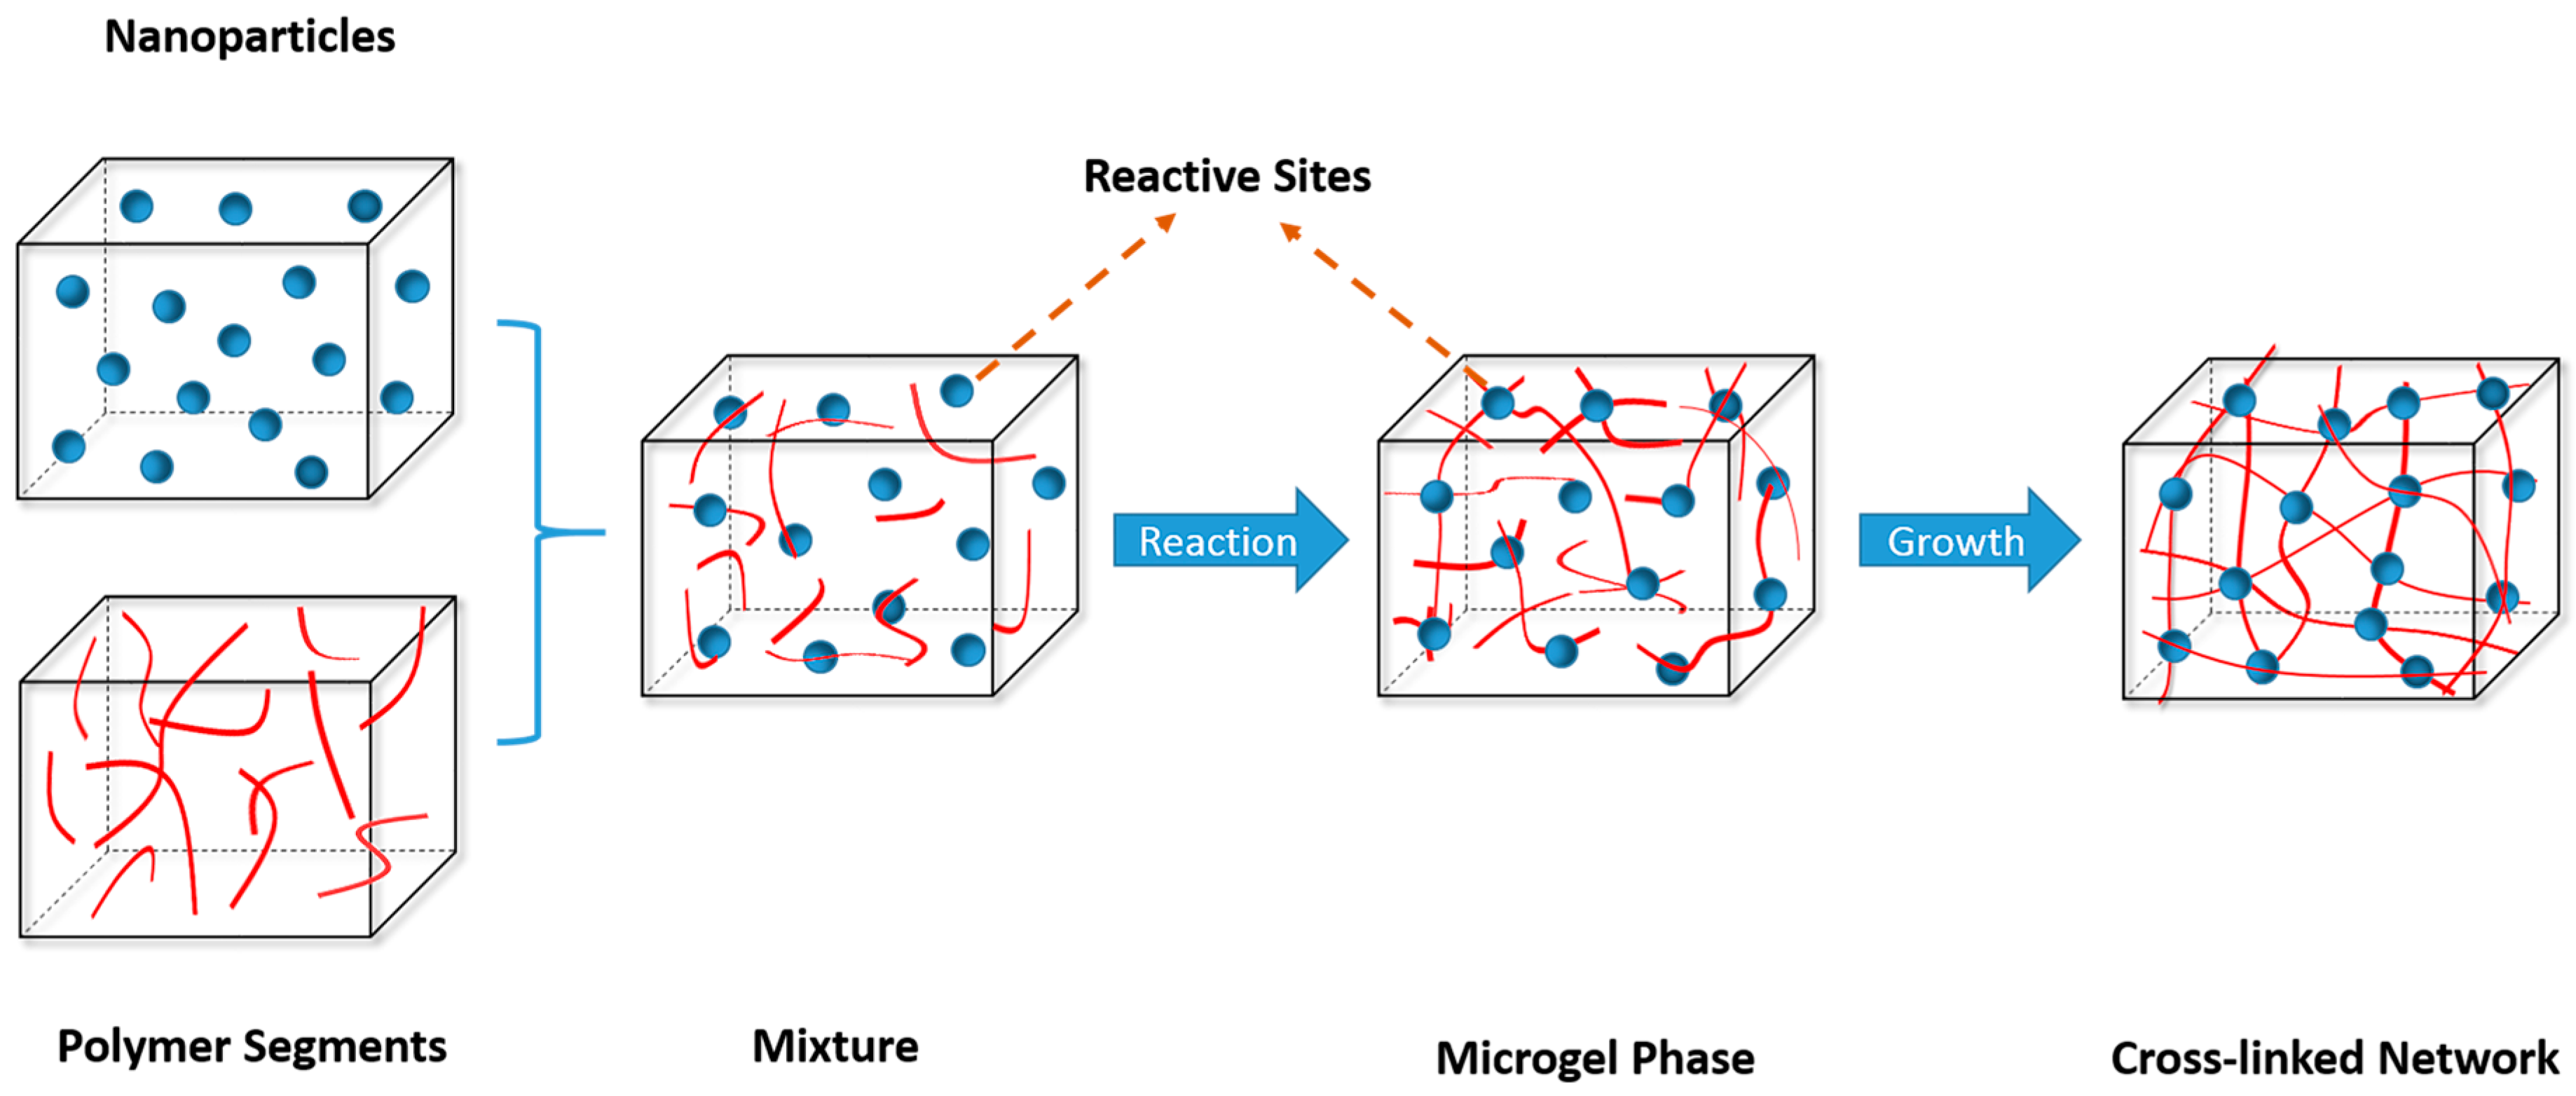
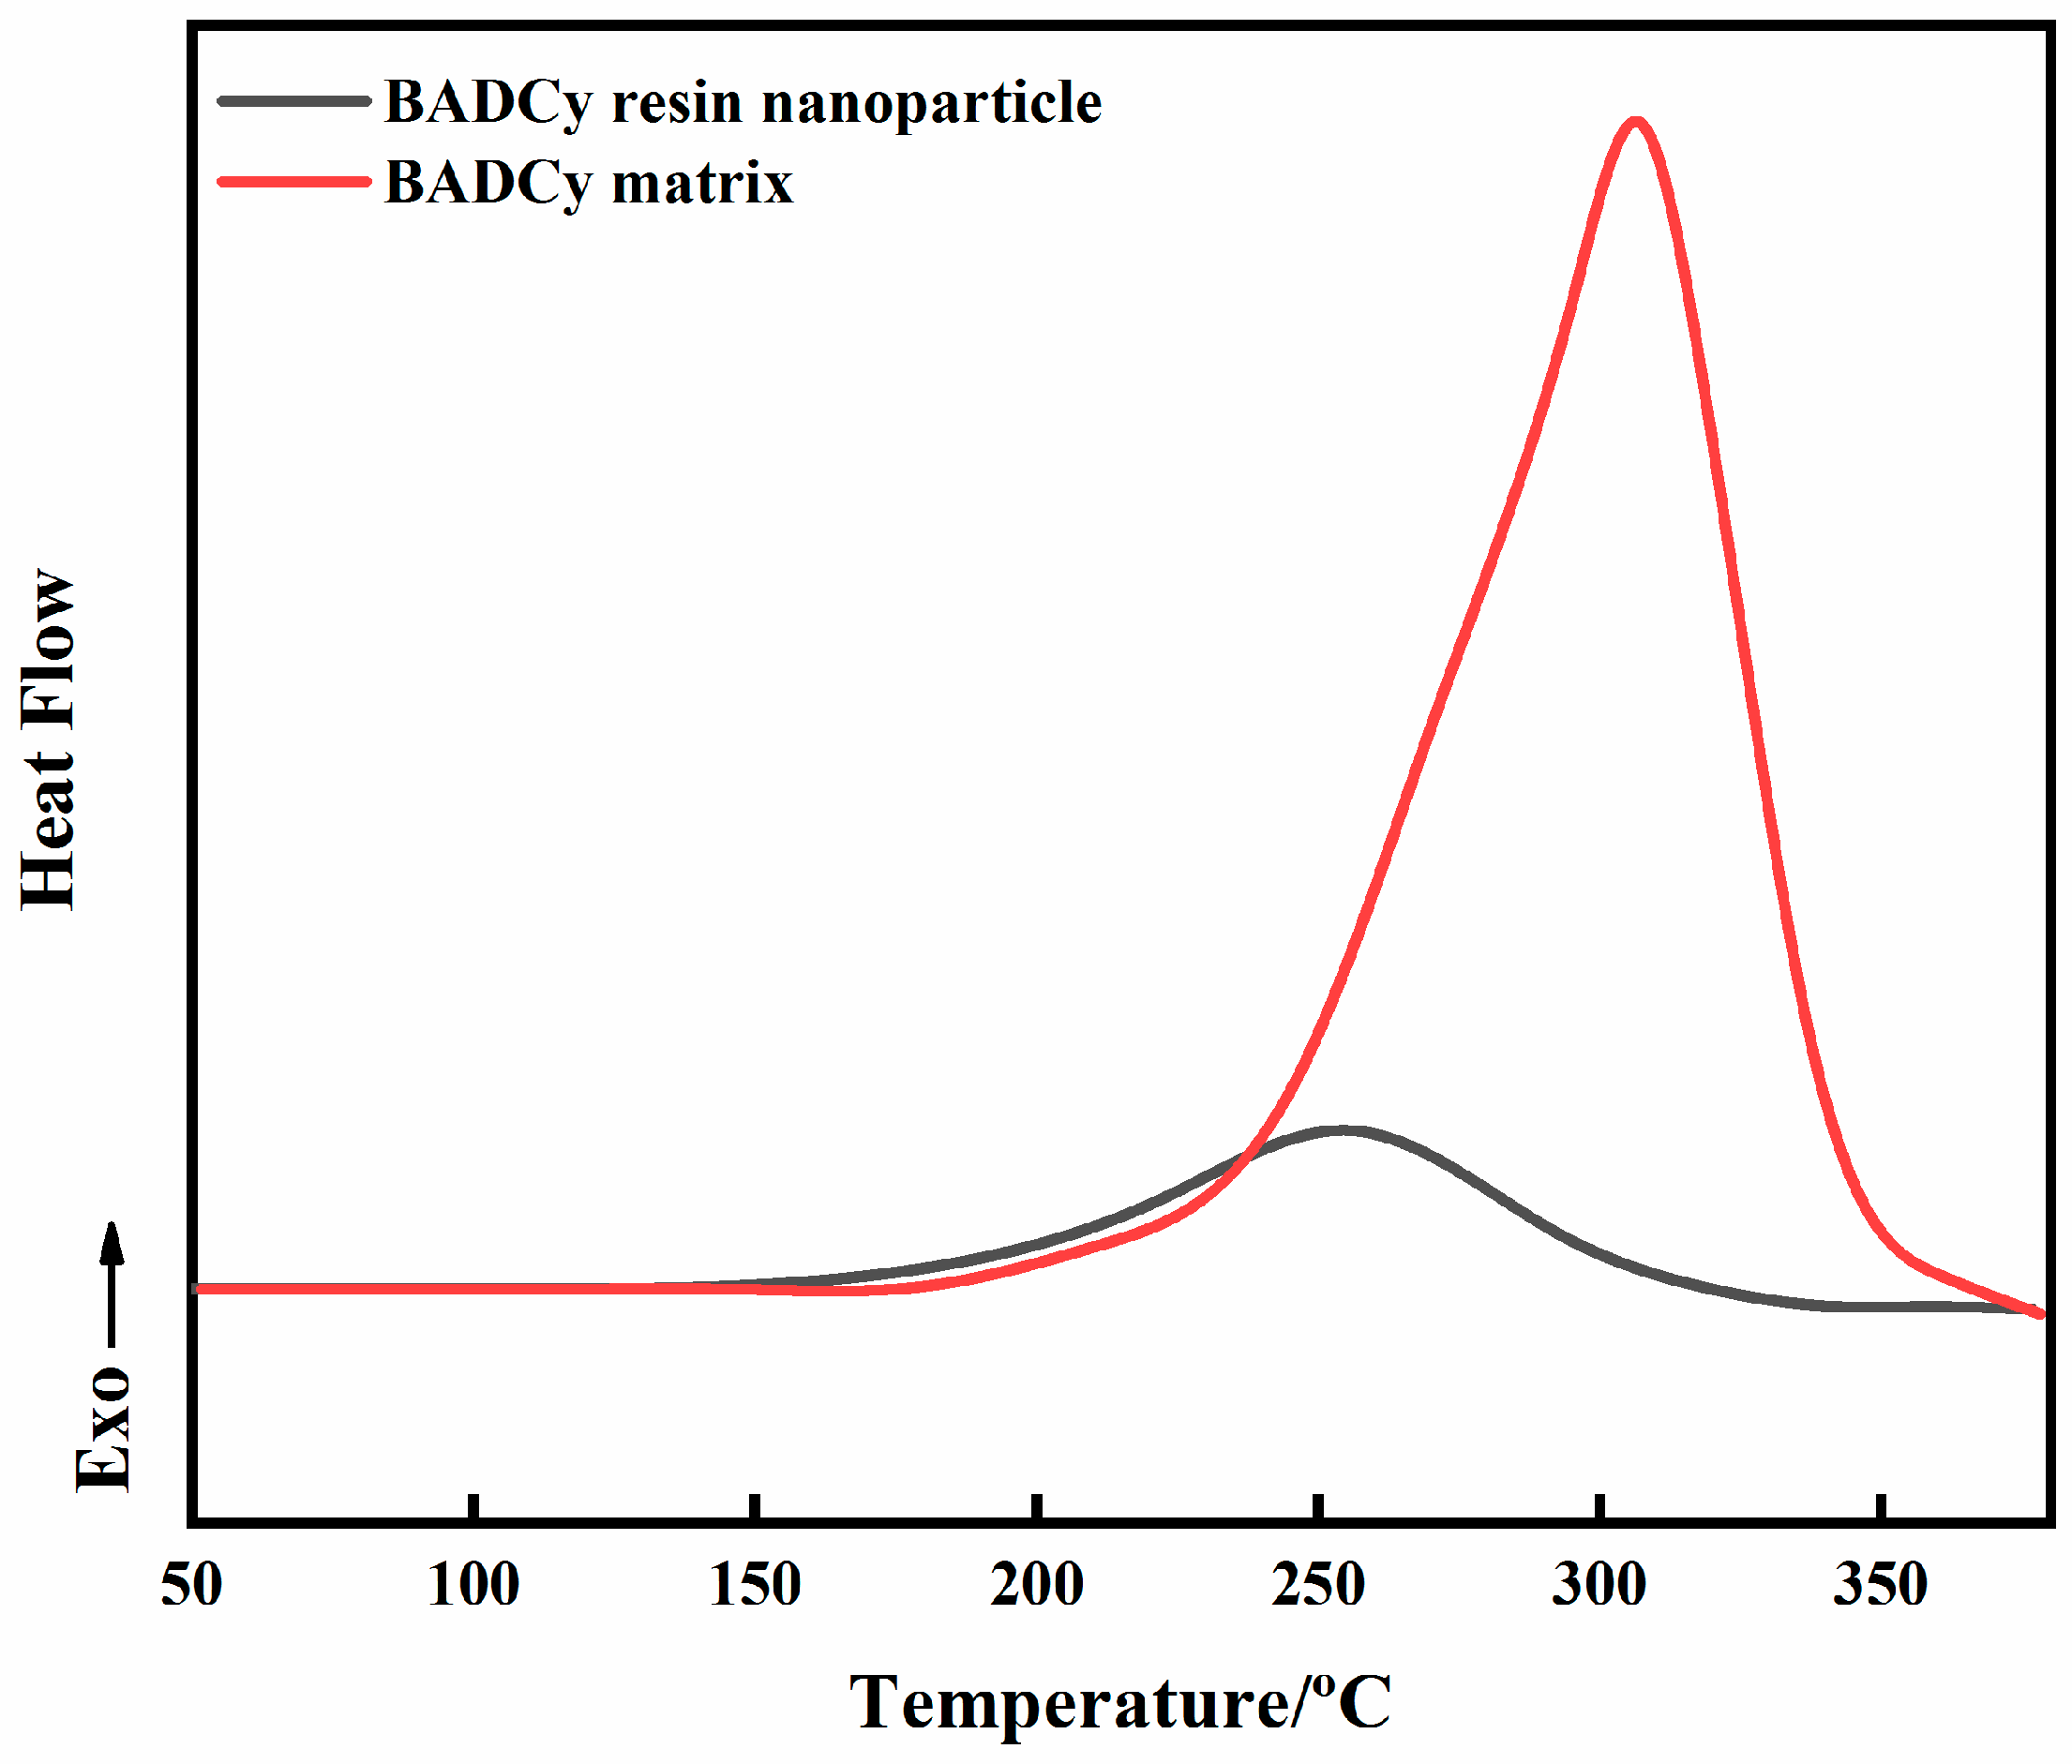
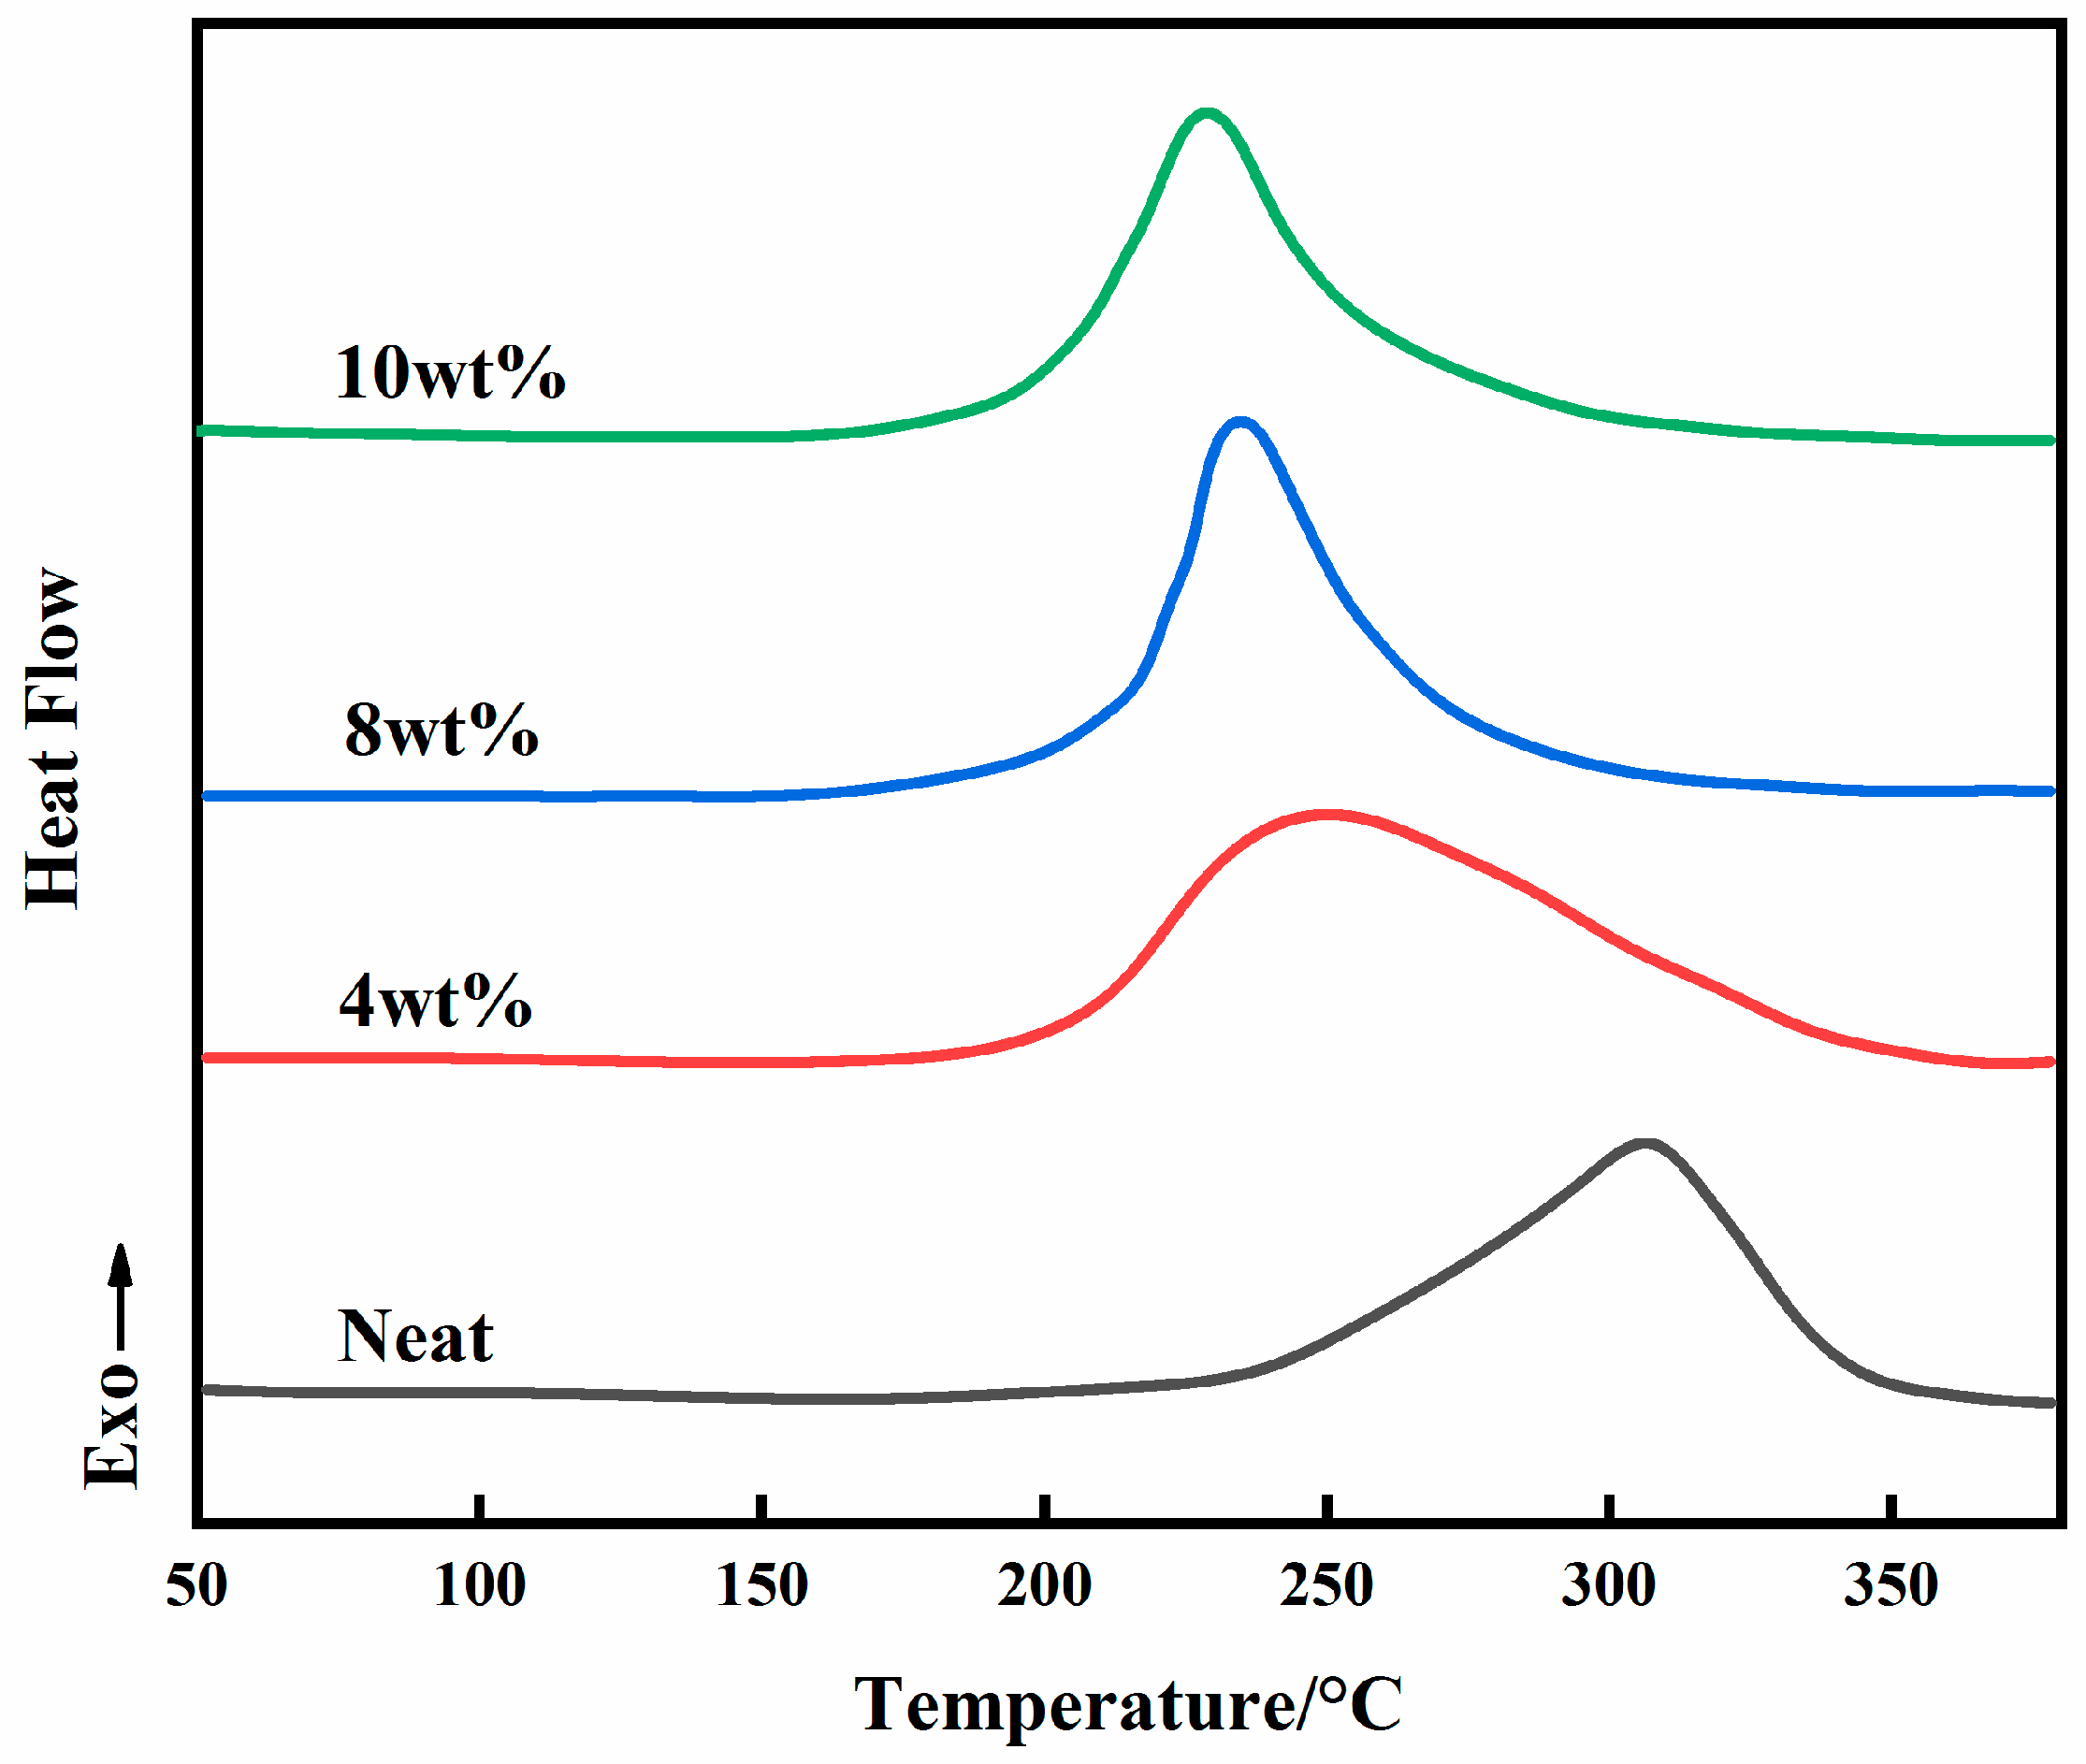
3.2. Cure Acceleration

Figure 6 shows the results of the 10 °C/min temperature ramp dynamic DSC experiments in which the prepared BADCy resin nanoparticles were added into the neat BADCy prepolymer at various contents (neat, 4, 8, and 10 wt%). It can be seen that the added BADCy resin nanoparticles had a strong effect on the curing temperature and enthalpy changes. The curves reveal a decrease in the curing peak temperature, Tp, as well as an increase in the curing enthalpy, ΔH, with the addition of BADCy resin nanoparticles (Table 1). This indicates that a range of BADCy resin nanoparticles can be used for accelerating curing and improving the degree of curing. This conclusion is consistent with the FT-IR spectra. The initially polymerized nanoparticles still have reactive functional groups, and can directly initiate the self-polymerization reaction. Compared with the 4 and 8 wt% systems, the curing enthalpy, ΔH, of the 10 wt% system is reduced. This is because the excessive quantity of nanoparticles results in the distance between the nanoparticles becoming small. The nanoparticles react with the matrix and also react with other nanoparticles. The heat of reaction between the nanoparticles themselves is less than that between the particles and the matrix. Therefore, the total exotherm is reduced.
The formation of microgel particles can occur from a thermodynamic point of view. Analogous to the thermodynamic equations of the crystallization process, the thermodynamic equations of the microgel particles can be expressed as:
Δ G = G c u r e G m e l t ,
where ΔG is the change in Gibbs free energy during the curing process and the curing reaction occurs when the ΔG is negative. At the beginning of the curing reaction, the gel particles have a small volume and a large specific surface area. If the surface effect is considered, the total free energy of the system can be accurately expressed as:
G c u r e = G b u l k + σ A ,
where Gbulk is the change in the matrix free energy without considering the surface effect, σ is the surface free energy coefficient, and A is the surface area of the gel particles. Therefore, the thermodynamic equation (Equation (1)) of the curing process can be rewritten as:
Δ G = Δ G c + σ A .
Here, ΔGc represents the free energy change of the matrix. ΔG is a negative value when the reaction temperature reaches curing conditions. Since the surface free energy coefficient, A, is a positive value, only at the condition of the curing temperature, ΔGc, is a negative value, making ΔG still less than zero. Therefore, curing of the resin system will proceed. Figure 7 is a schematic illustration of the free energy changes in the gel particle formation and growth stages.
During the heating process of the resin systems, ΔG is greater than zero before the formation of the thermodynamically stable gel particles, and ΔG has a maximum value. This stage is mainly a cross-linked reaction of polymer segments and is primarily controlled by kinetic factors. Once the gel particles are formed, the growth of the gel particles can reduce the free energy of the systems and the gel particles enable automatic growth. At this stage, the viscosity of the system increases due to the growth of the gel particles, and the movement of the molecular segments is limited, so it is mainly controlled by the diffusion factors. In our study, when nanoparticles were added into the matrix, there were two reaction processes. The first is that the matrix itself undergoes a curing reaction which includes the formation and growth of gel particles. The second is the reaction of the particles with the matrix, which only appears as the growth of the gel particles. These two reaction processes are carried out simultaneously. However, the first case requires overcoming a considerable surface energy barrier to nucleate. In the second case, since the matrix is heterogeneous, the surface energy barrier at the time of nucleation of the gel particles can be effectively reduced, resulting in preferential formation of the gel particle cores at these uneven places. These two cases are similar to homogeneous nucleation and heterogeneous nucleation.

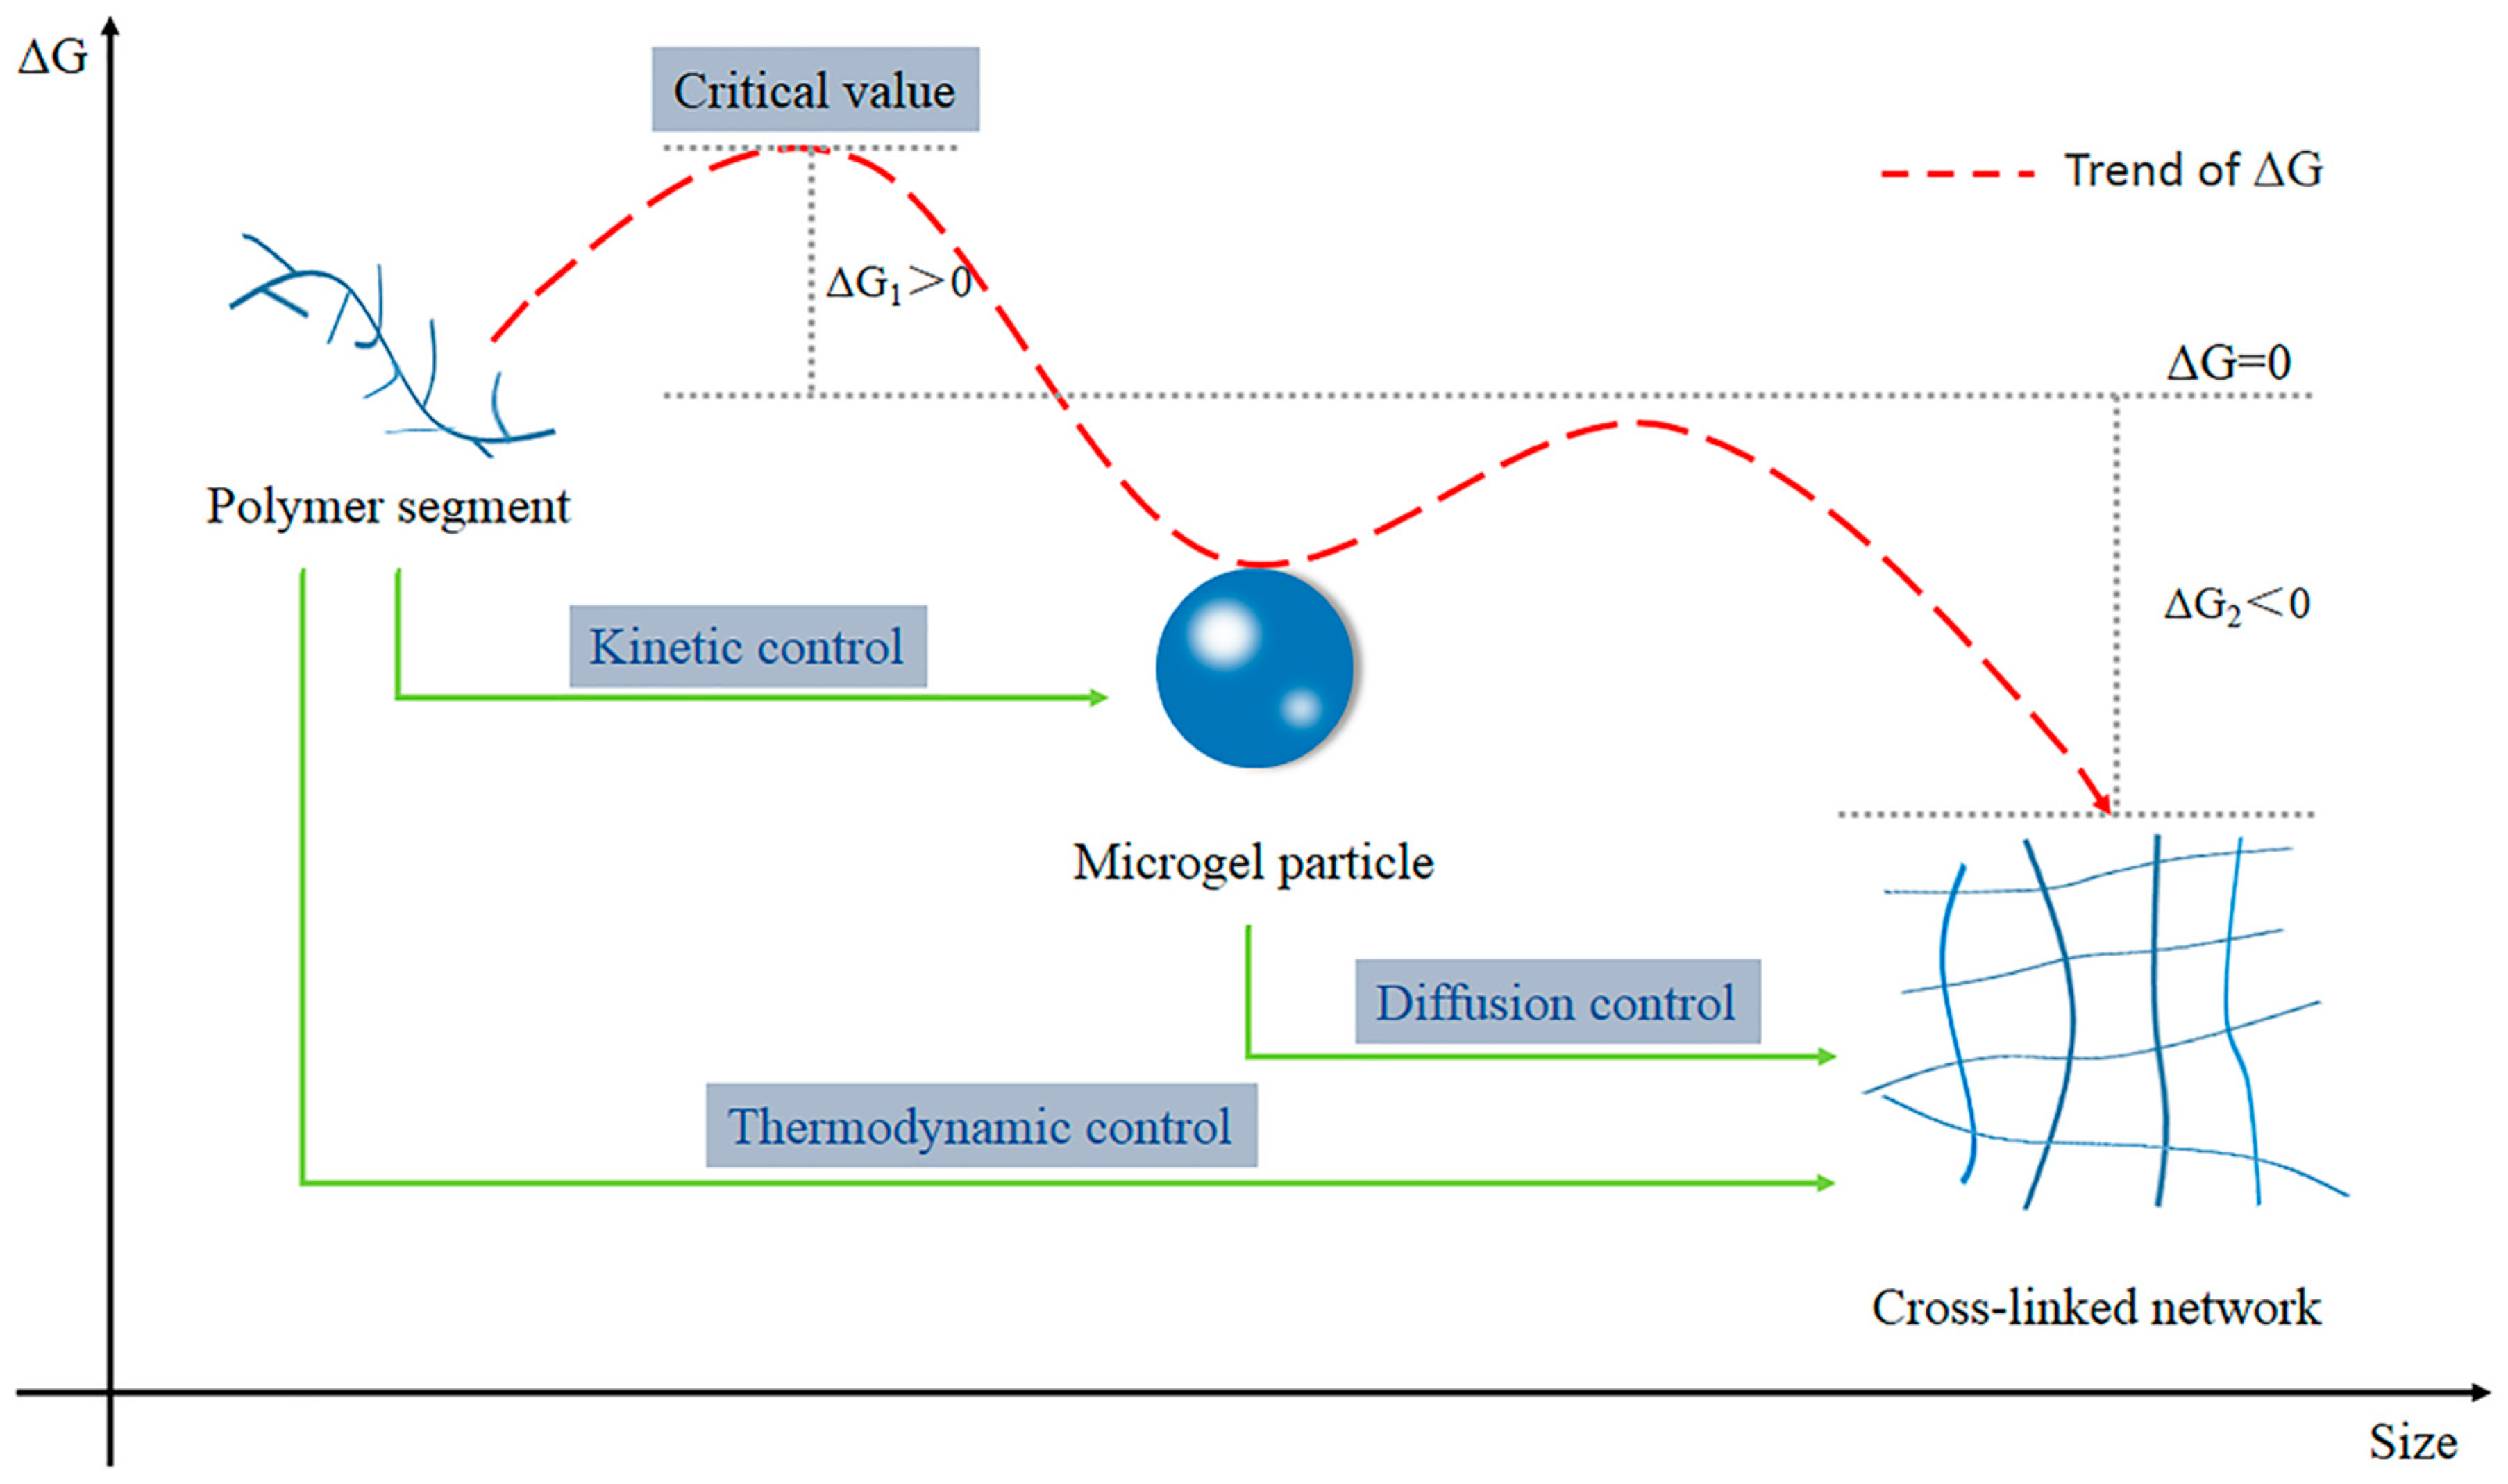
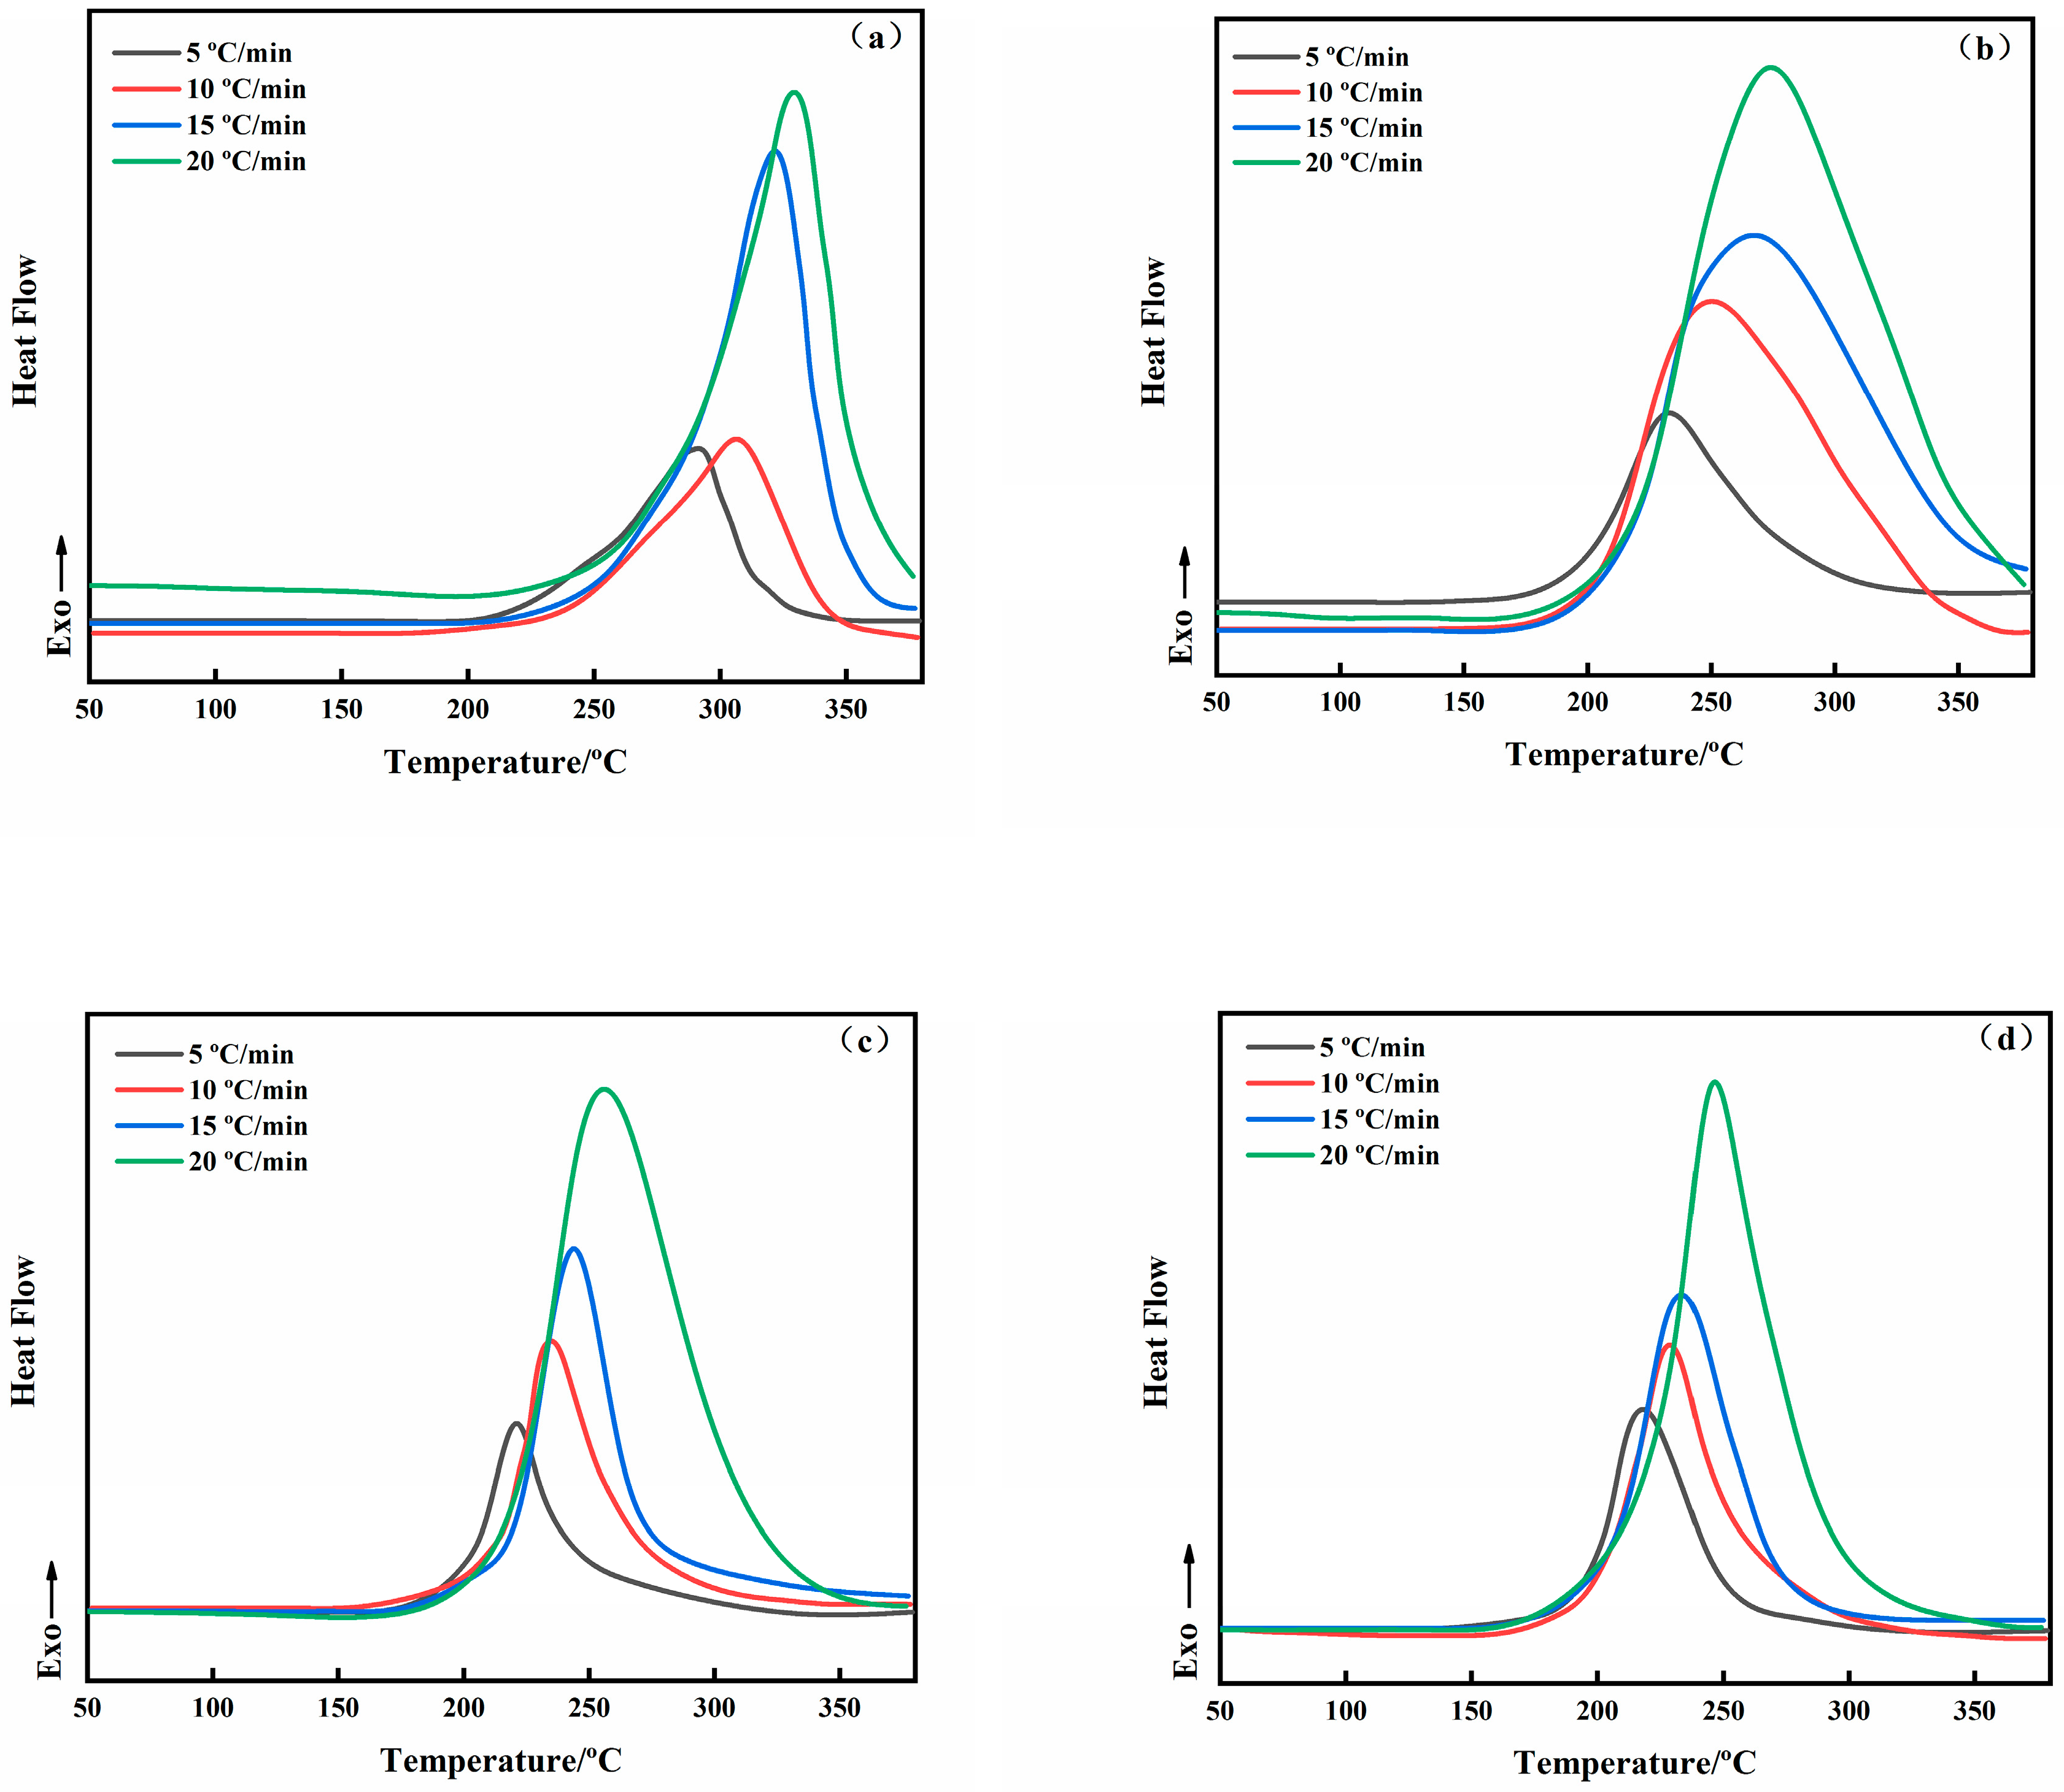
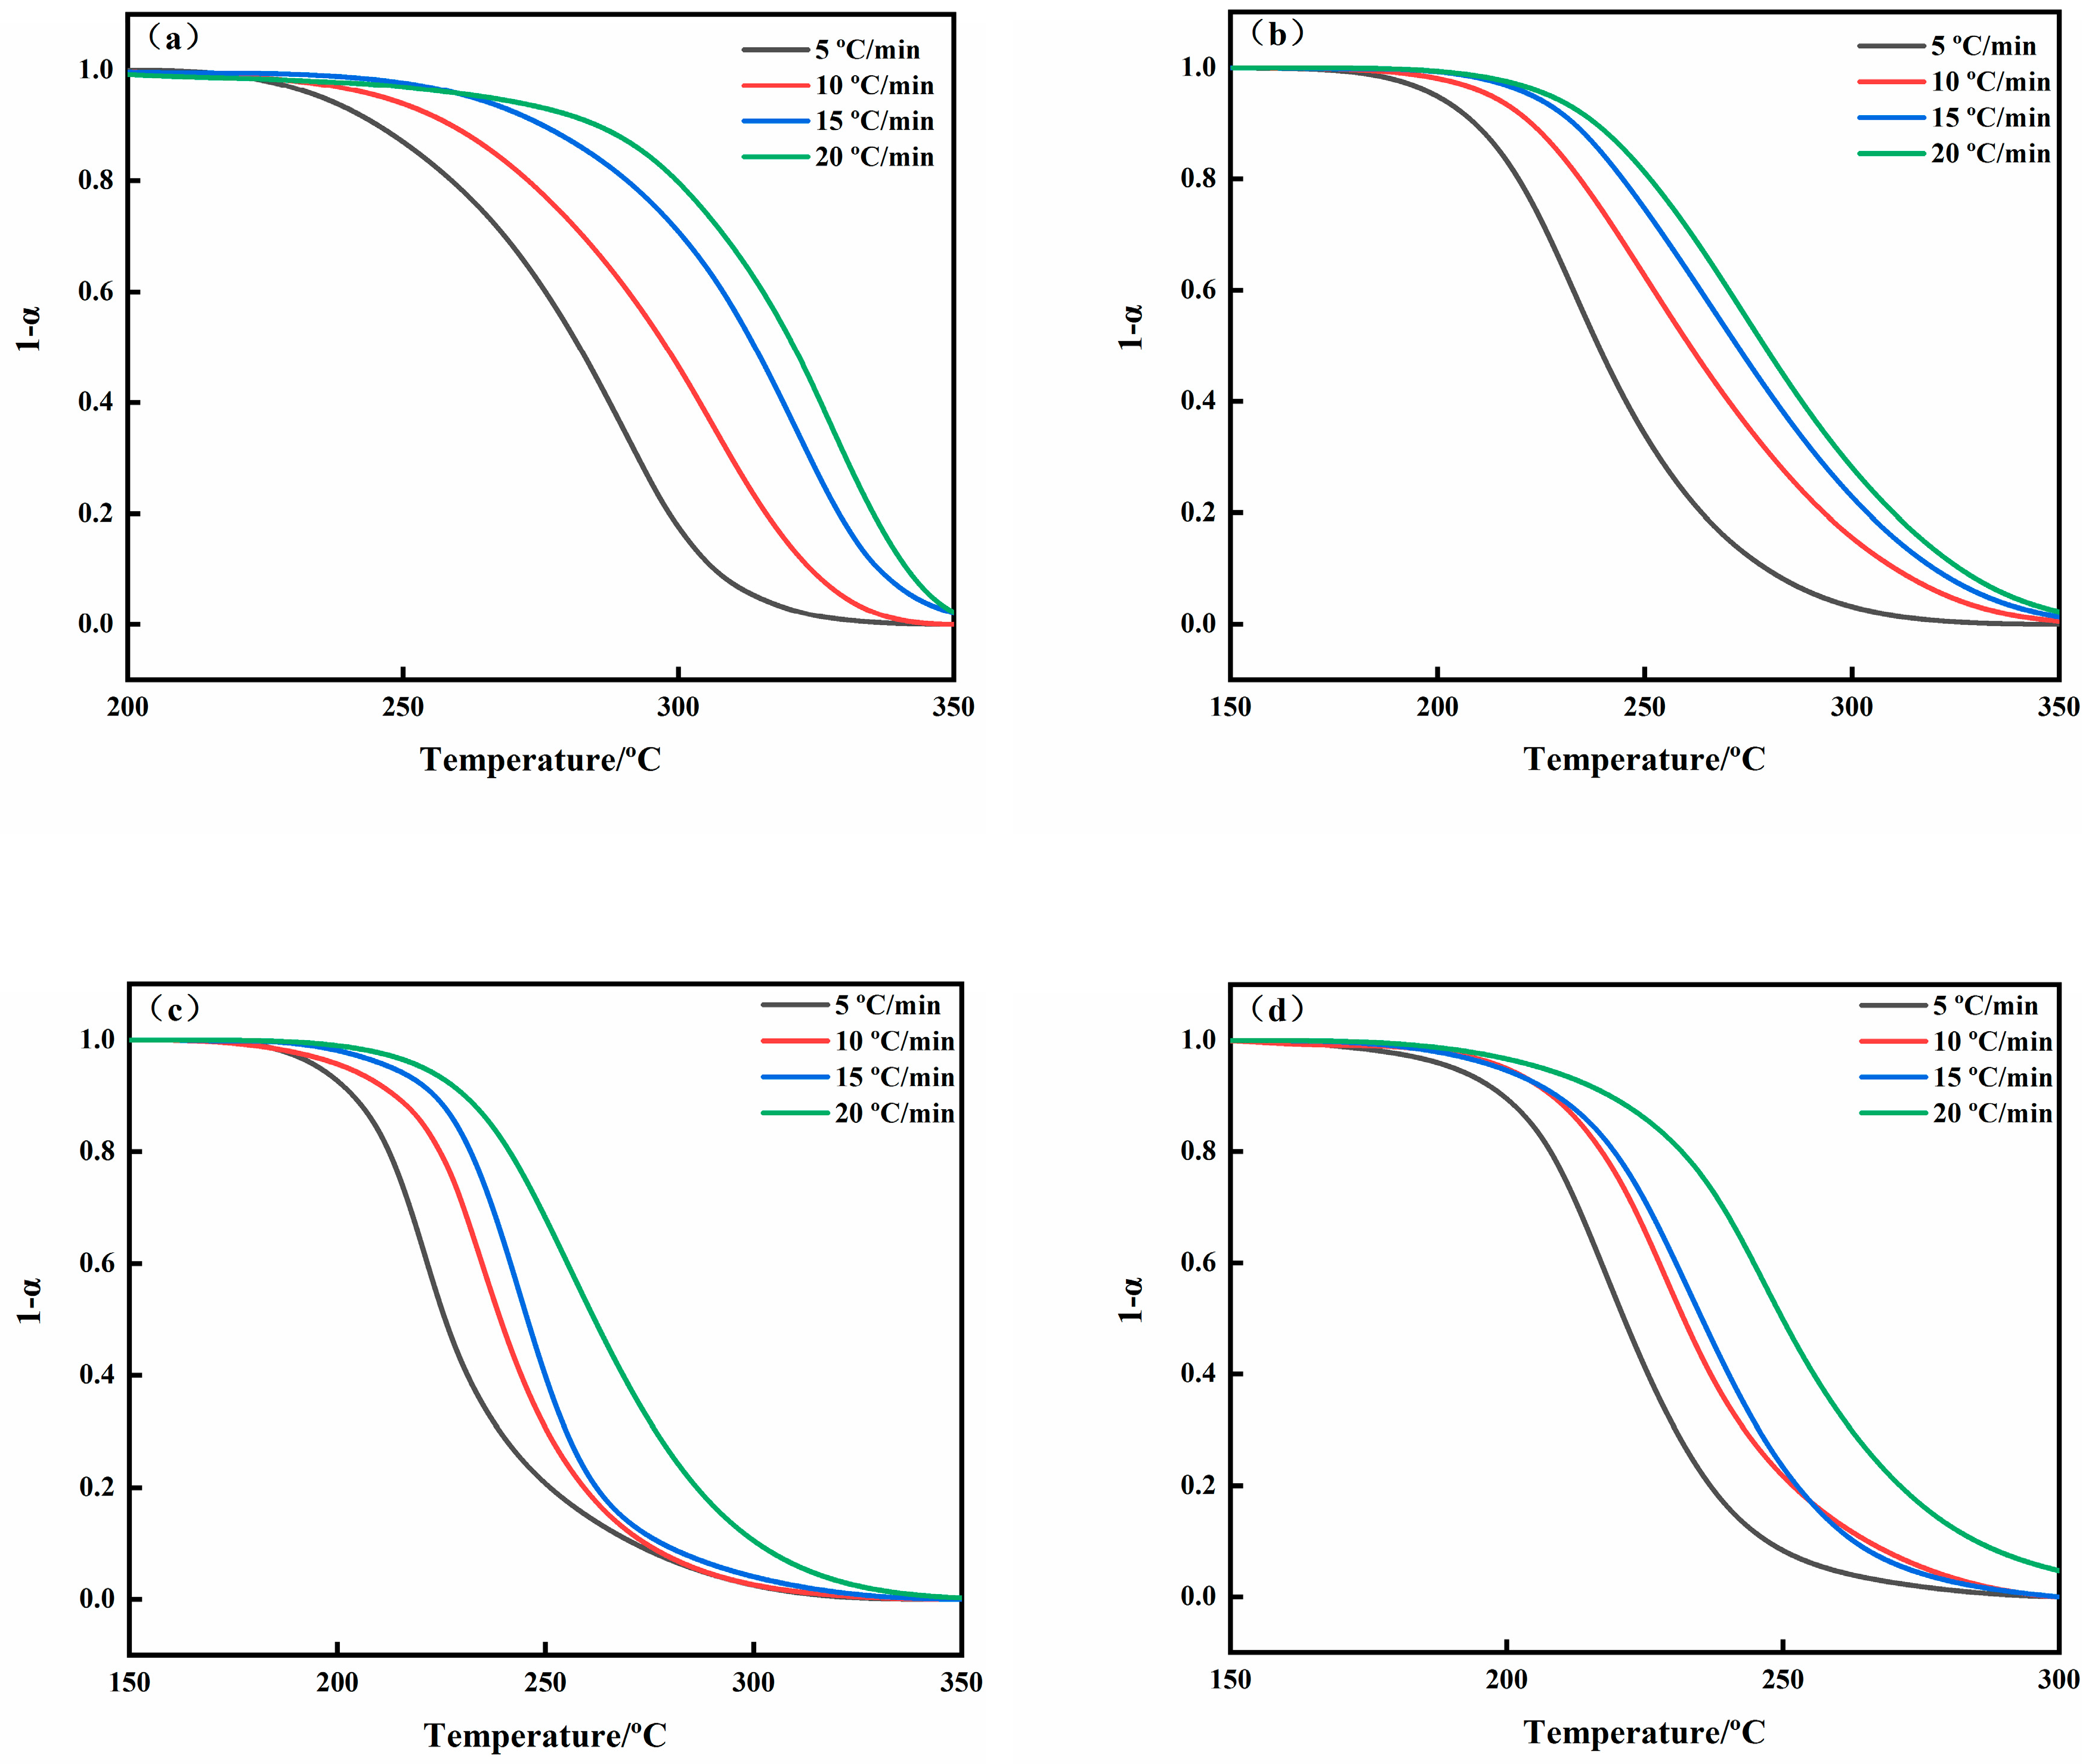
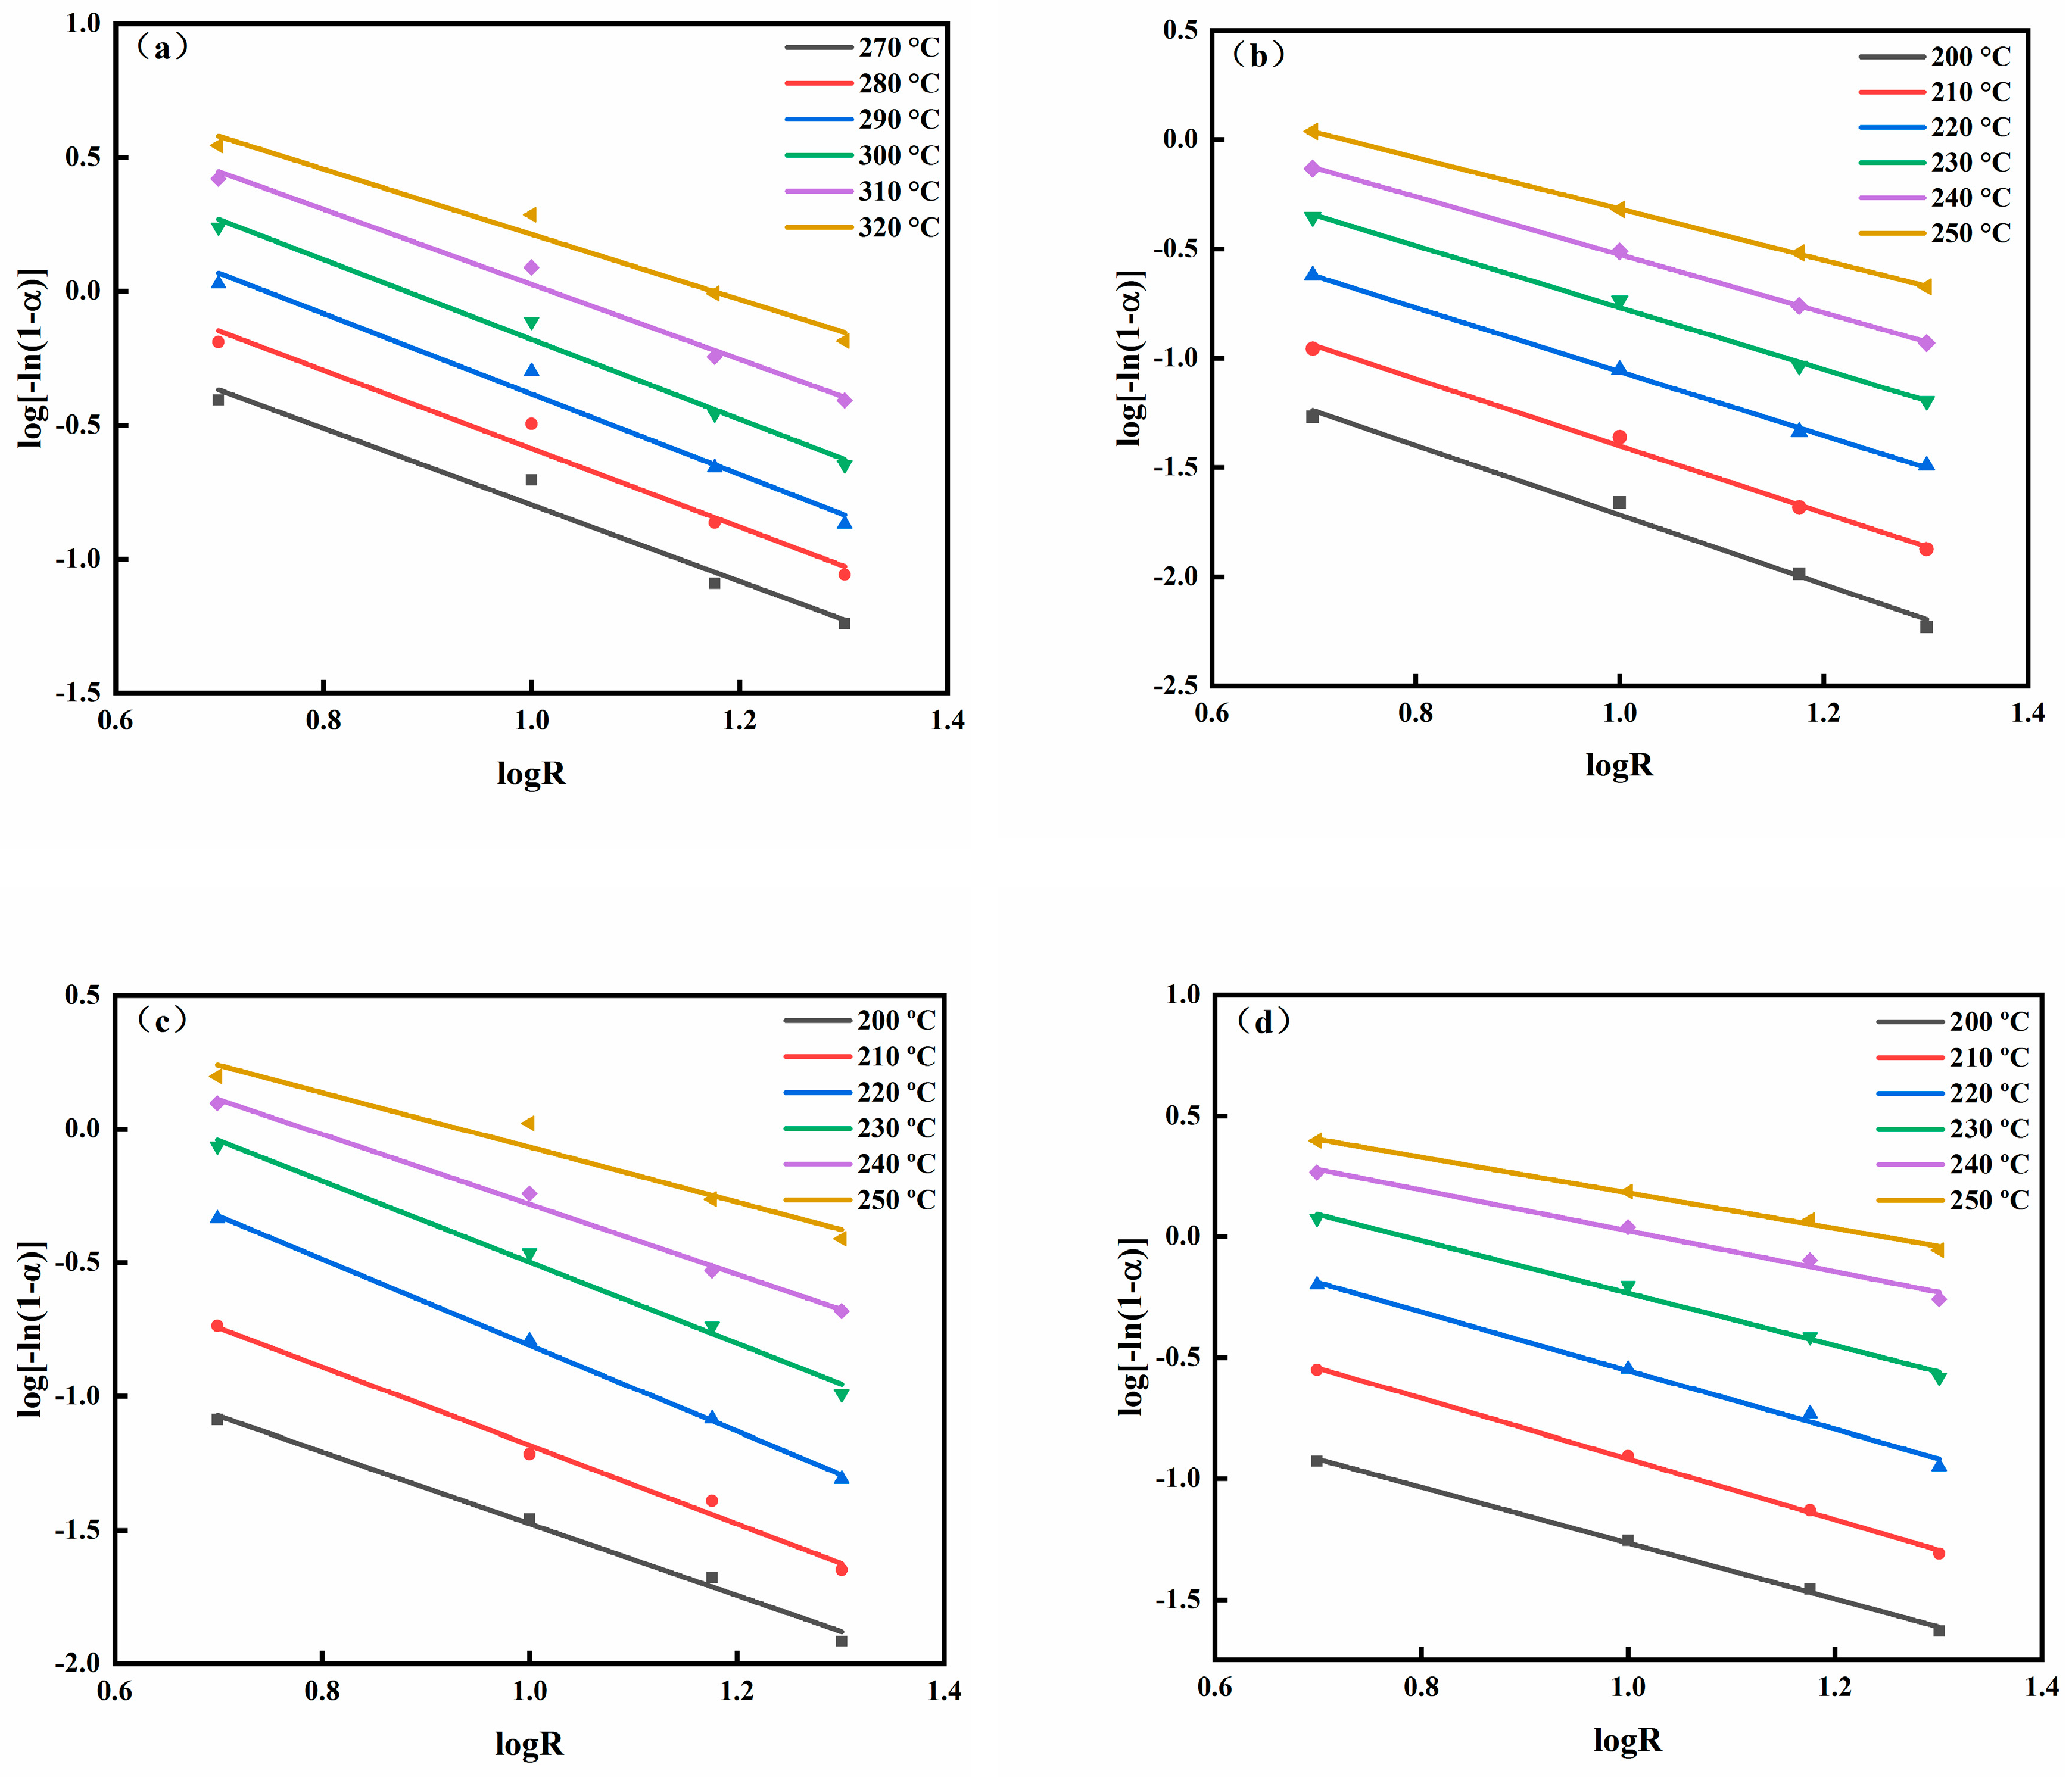
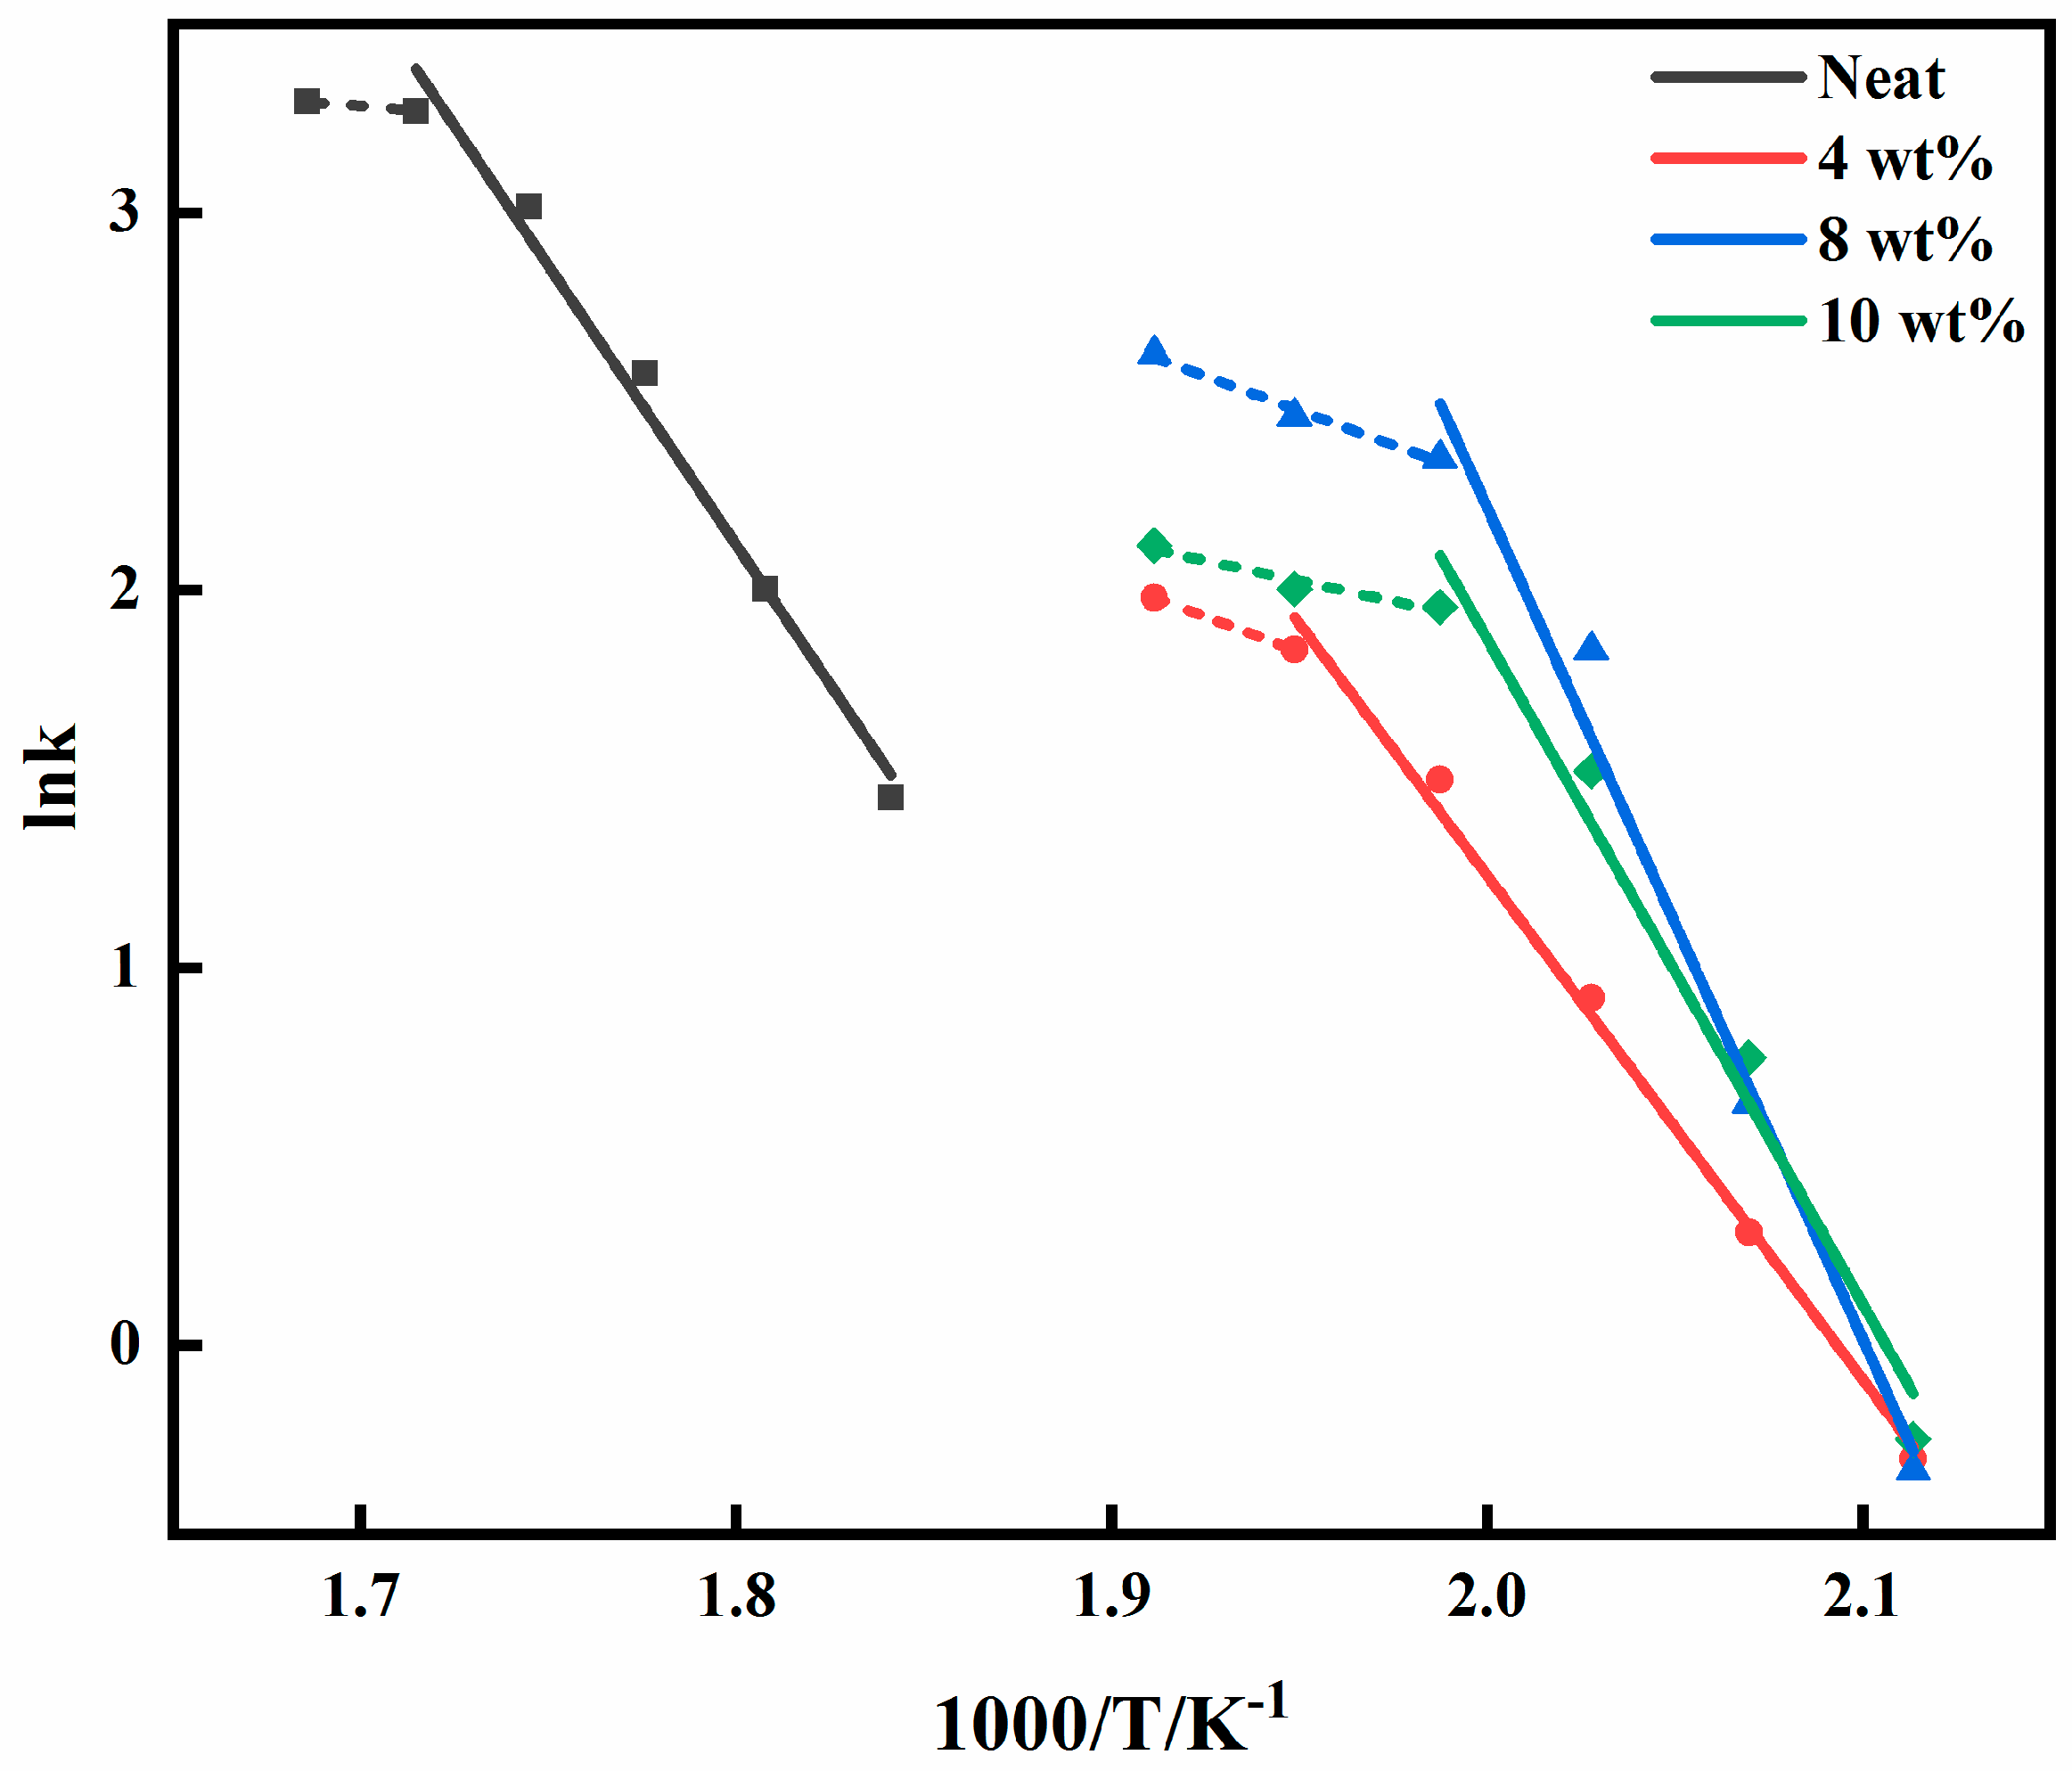
3.3. Kinetic Analysis Using the Avrami Equation

The prepared BADCy resin nanoparticles were added into the BADCy prepolymer at contents of neat, 4, 8, and 10 wt%. The nanoparticles were dispersed evenly in the matrix under high-sheer conditions. The DSC characterization was performed based on the following assumptions. First, the nanoparticles do not react with the matrix during the mixing. Second, the absolute area under the curve is proportional to the degree of cure, and α is defined as the degree of cure at any time, t:
α = Δ H Δ H 0 ,
where ΔH is the enthalpy changes at any points, and ΔH0 is the total enthalpy change during the heating process.
Representative DSC curves are shown in Figure 8, in which (a), (b), (c), and (d) represent the neat, 4, 8, and 10 wt% system, respectively. It can be seen that the curing temperature is proportional to the rate of temperature increase for the same system. Also, the onset curing temperature decreases as the BADCy resin nanoparticle content increases.
Figure 9 is obtained from the integration of Figure 8 and the curves of the degree of cure as a function of temperature can be obtained correspondingly in Figure 9. It shows that the degree of cure is inversely proportional to the rate of temperature increase for the same system. This is because a fast rate of temperature rise results in an incomplete curing reaction. At the same temperature, the degree of cure is proportional to the content of nanoparticles. This conclusion again demonstrates that the BADCy resin nanoparticles have a promoting effect on the matrix.
The Avrami equation is:
α = 1 exp ( k t n ) ,
where α is the relative crystallinity, n is the Avrami index reflecting the nucleation and growth mechanism, and k is the rate constant. Ozawa improved the Avrami equation to enable it to be used for non-isothermal crystallization kinetics [34]. Assuming that non-isothermal crystallization consists of innumerable tiny isothermal crystallization steps, the Avrami equation can be modified to:
α = 1 exp ( k ( T ) / ϕ m ) ,
or
ln [ ln ( 1 α ) ] = ln k ( T ) m ln ϕ ,
where the rate constant, k, is a function of T, ϕ is the heating rate, and m is the Ozawa index.
When Equation (7) is used to describe the curing process of thermosetting resins, α is the relative degree of cure, k is the curing rate constant, and n is the relative index describing the curing mechanism. At a given temperature, n is a constant. Equation (6) can be written as:
1 α = exp ( k R n ) ,
where α is a function of temperature, R is the heating rate, and k′ is a function of temperature.
Equation (8) also can be written as:
log [ ln ( 1 α ) ] = log k n log R .
Equation (9) shows that the curing kinetic parameters, k′ and n, can be determined according to the degrees of curing at different heating rates. At a given temperature, a plot of log[−ln(1−α)] on logR should be a straight line with a slope of −n and an intercept of logk′.
Figure 10 is a graph made according to Equation (9) and Figure 9. The curves show an excellent linear relationship over the curing temperature range, which is consistent with the conclusions obtained from Equation (9). The result indicates that the modified Avrami equation can be used to describe the non-isothermal curing process of the BADCy resin systems. A series of rate constants and indices are listed in Table 2 and Table 3.
The following conclusions can be drawn from the above-described fitting straight line and data. First, k′ is a function of the temperature and is proportional to the temperature. Second, as can be seen from Table 2 and Table 3, the n of all the systems shows a trend of increasing first and then decreasing. When the Avrami equation is used to study the curing of thermosetting resins, n is the scale for the formation and growth of microgel particles and will vary with the curing mechanism. An increase in the value of n represents the formation and initial growth of the microgel particles. However, in the late stage of curing, since the microgel particles are difficult to form and the growth of the gel particles is limited, the value of n is lowered.
When the prepared BADCy resin nanoparticles were added into the matrix for curing, there were two processes. First, the matrix still underwent the formation and growth of microgel particles. Second, the added nanoparticles reacted with the matrix and appeared to undergo continuous growth in size. According to the results of the curing acceleration, it can be concluded that the reaction between the BADCy resin nanoparticles and the matrix is dominant. It is worth noting that the temperature corresponding to the change in n is markedly different. The turning points of the neat, 4, 8, and 10 wt% systems are 300, 240, 230, and 220 °C, respectively. This trend indicates that the mass content of the added BADCy resin nanoparticles is inversely proportional to the gelation time. Therefore, the added BADCy resin nanoparticles are capable of reconstructing the microscopic cross-linked network of the BADCy resin matrix.
A difference in the trend of n means that the curing mechanism may change at the turning point. After all, curing and crystallization are not exactly the same. Although the formation and growth of the microgels during the curing process cannot give relatively clear qualitative information, like polymers’ crystallization, the slope of the line is the scale of the Avrami index, n, so it can be considered that this turning point explains the curing process with significant changes in the cross-linked mechanism. In the later stage of the curing process, the viscosity of the resin system shows an extreme increase, and the movement of the polymer segments is limited by the viscosity of the system. Therefore, the growth of microgels in the late curing process is probably affected by diffusion factors. To better illustrate this problem, a model of diffusion control was used for analysis.
We assumed that the relationship between the rate constant, k(T), and temperature, (1/T), is consistent with the Arrhenius equation:
k ( T ) = A exp E a R 0 T .
Equation (10) can be written as:
ln k = ln A E a R T ,
where Ea is the apparent activation energy, R is the molar gas constant, and A is a pre-exponential factor.
Figure 11 is a plot of lnk versus 1/T. It can be seen that the Arrhenius fitting plots of all the systems have an obvious turning point. The slope is a measure of the activation energy. It can be concluded that the activation energy in the low temperature stage is higher than that in the high-temperature stage. This indicates that the energy required for the formation and growth of the microgel particles has changed markedly. This phenomenon is common in heterogeneous reactions under diffusion-limited conditions [35,36]. It further indicates that the diffusion factor is dominant in the late stage of the curing reaction. During the curing process, the quantity of microgels increases, and when a higher temperature is reached, a mass transfer restriction mechanism is established, and the microgels aggregate with each other, so that phase inversion occurs. This point of change is the gel point. After gelation, the resin changes from the original viscous liquid to a semi-solid elastomeric gel and loses fluidity.

4. Conclusions

The BADCy resin nanoparticles prepared by precipitation polymerization can accelerate curing and reconstruct the microscopic network structure. From the results of dynamic DSC, the resin systems containing the BADCy resin nanoparticles had a markedly lower curing temperature than the neat system, indicating that the BADCy resin nanoparticles can accelerate the curing of the BADCy resin matrix. From a thermodynamic point of view, since the Gibbs free energy between the particles and the substrate is low, the reaction proceeds more easily, thereby accelerating the progress of the curing reaction. The kinetic parameters determined by the Avrami equation were used to analyze the evolution of the microgels and indicate that the micromechanism model can accurately describe the formation and growth of microgel particles during the curing process of BADCy resin.
The change in the curing mechanism was further confirmed by the Arrhenius equation. There was also a turning point in the fitting curve, and the activation energy in the low temperature stage was higher than that in the high temperature stage. This phenomenon indicates that the diffusion factor dominates in the late stage of the curing reaction.

Author Contributions

Conceptualization, H.C., Y.L., and P.L.; Methodology, H.C., Y.L., and P.L.; Validation, B.L. and Y.Y.; Writing—original draft, H.C.; Writing—review and editing, Y.L. and P.L.

Funding

This research received no external funding.

Acknowledgments

The authors thank the other members of the lab for their contributions to this experiment. The authors also thank the teachers in the testing center for their contribution in the experiment.

Conflicts of Interest

The authors declare no conflict of interest.

References

  1. Hamerton, I. Chemistry and Technology of Cyanate Ester Resins; Springer: Dordrecht, The Netherlands, 1994. [Google Scholar] [CrossRef]
  2. Wooster, T.J.; Abrol, S.; Hey, J.M.; MacFarlane, D.R. Thermal, mechanical, and conductivity properties of cyanate ester composites. Compos. Part A Appl. Sci. Manuf. 2004, 35, 75–82. [Google Scholar] [CrossRef]
  3. Gu, A. High performance bismaleimide/cyanate ester hybrid polymer networks with excellent dielectric properties. Compos. Sci. Technol. 2006, 66, 1749–1755. [Google Scholar] [CrossRef]
  4. Wang, Y.; Wu, G.; Kou, K.; Pan, C.; Feng, A. Mechanical, thermal conductive and dielectrical properties of organic montmorillonite reinforced benzoxazine/cyanate ester copolymer for electronic packaging. J. Mater. Sci. Mater. Electron. 2016, 27, 8279–8287. [Google Scholar] [CrossRef]
  5. Goertzen, W.K.; Kessler, M.R. Thermal and mechanical evaluation of cyanate ester composites with low-temperature processability. Compos. Part A Appl. Sci. Manuf. 2007, 38, 779–784. [Google Scholar] [CrossRef]
  6. Gu, J.; Dong, W.; Tang, Y.; Guo, Y.; Tang, L.; Kong, J.; Tadakamalla, S.; Wang, B.; Guo, Z. Ultralow dielectric, fluoride-containing cyanate ester resins with improved mechanical properties and high thermal and dimensional stabilities. J. Mater. Chem. C 2017, 5, 6929–6936. [Google Scholar] [CrossRef]
  7. Gu, X.; Zhang, Z.; Yuan, L.; Liang, G.; Gu, A. Developing high performance cyanate ester resin with significantly reduced postcuring temperature while improved toughness, rigidity, thermal and dielectric properties based on manganese-Schiff base hybridized graphene oxide. Chem. Eng. J. 2016, 298, 214–224. [Google Scholar] [CrossRef]
  8. Ye, Y.; Yuan, L.; Liang, G.; Gu, A. Simultaneously toughening and strengthening cyanate ester resin with better dielectric properties by building nanostructures in its crosslinked network using polyimide-block-polysiloxane rod-coil block copolymers. RSC Adv. 2016, 6, 49436–49447. [Google Scholar] [CrossRef]
  9. Ohashi, S.; Pandey, V.; Arza, C.R.; Froimowicz, P.; Ishida, H. Simple and low energy consuming synthesis of cyanate ester functional naphthoxazines and their properties. Polym. Chem. 2016, 7, 2245–2252. [Google Scholar] [CrossRef]
  10. Sun, Z.; Zhang, L.; Dang, F.; Liu, Y.; Fei, Z.; Shao, Q.; Lin, H.; Guo, J.; Xiang, L.; Yerra, N.; et al. Experimental and simulation-based understanding of morphology controlled barium titanate nanoparticles under co-adsorption of surfactants. CrystEngComm 2017, 19, 3288–3298. [Google Scholar] [CrossRef]
  11. Tang, Y.-S.; Kong, J.; Gu, J.-W.; Liang, G.-Z. Reinforced Cyanate Ester Resins with Carbon Nanotubes: Surface Modification, Reaction Activity and Mechanical Properties Analyses. Polym.-Plast. Tech. Eng. 2009, 48, 359–366. [Google Scholar] [CrossRef]
  12. Simon, S.L.; Gillham, J.K. Cure kinetics of a thermosetting liquid dicyanate ester monomer/high-Tg polycyanurate material. Appl. Polym. Sci. 1993, 47, 461–485. [Google Scholar] [CrossRef]
  13. Fang, T.; Shimp, D.A. Polycyanate esters: Science and applications. Prog. Polym. Sci. 1995, 20, 61–118. [Google Scholar] [CrossRef]
  14. Wang, H.; Yuan, L.; Liang, G.; Gu, A. Tough and thermally resistant cyanate ester resin with significantly reduced curing temperature and low dielectric loss based on developing an efficient graphene oxide/Mn ion metal–organic framework hybrid. RSC Adv. 2016, 6, 3290–3300. [Google Scholar] [CrossRef]
  15. Laskoski, M.; Dominguez, D.D.; Keller, T.M. Development of an oligomeric cyanate ester resin with enhanced processability. J. Chem. 2005, 15, 1611. [Google Scholar] [CrossRef]
  16. Pradhan, S.; Brahmbhatt, P.; Sudha, J.D.; Unnikrishnan, J. Influence of manganese acetyl acetonate on the cure-kinetic parameters of cyanate ester–epoxy blend systems in fusion relevant magnets winding packs. J. Therm. Anal. Calorim. 2011, 105, 301–311. [Google Scholar] [CrossRef]
  17. Mathew, D.; Nair, C.P.R.; Krishnan, K.; Ninan, K.N. Catalysis of the cure reaction of Bisphenol A dicyanate. A DSC study. J. Polym. Sci. Part A Polym. Chem. 2015, 37, 1103–1114. [Google Scholar] [CrossRef]
  18. Gusakova, K.; Saiter, J.-M.; Grigoryeva, O.; Gouanve, F.; Fainleib, A.; Starostenko, O.; Grande, D. Annealing behavior and thermal stability of nanoporous polymer films based on high-performance Cyanate Ester Resins. Polym. Degrad. Stab. 2015, 120, 402–409. [Google Scholar] [CrossRef]
  19. Li, W.; Liang, G.; Xin, W. Triazine reaction of cyanate ester resin systems catalyzed by organic tin compound: Kinetics and mechanism. Polym. Int. 2004, 53, 869–876. [Google Scholar] [CrossRef]
  20. Augustine, D.; Mathew, D.; Nair, C.P.R. Phthalonitrile resin bearing cyanate ester groups: Synthesis and characterization. RSC Adv. 2015, 5, 91254–91261. [Google Scholar] [CrossRef]
  21. Shah, S.S.A.; Nasir, H.; Ul-Haq, N. Synthesis of Cyanate Ester Based Thermoset Resin by Using Copper (II) Oxalate as Catalyst and its Application in Carbon Fiber Composites. Nano Hybrids Compos. 2018, 22, 1–9. [Google Scholar] [CrossRef]
  22. Throckmorton, J.; Palmese, G. Acceleration of cyanate ester trimerization by dicyanamide RTILs. Polymer 2016, 91, 7–13. [Google Scholar] [CrossRef]
  23. Wooster, T.J.; Abrol, S.; MacFarlane, D.R. Cyanate ester polymerization catalysis by layered-silicates. Polymer 2004, 45, 7845–7852. [Google Scholar] [CrossRef]
  24. Fainleib, A.; Bardash, L.; Boiteux, G. Catalytic effect of carbon nanotubes on polymerization of cyanate ester resins. Express Polym. Lett. 2009, 3, 477–482. [Google Scholar] [CrossRef]
  25. Kim, S.-W.; Lu, M.-G.; Shim, M.-J. The Isothermal Cure Kinetic of Epoxy/Amine System Analyzed by Phase Change Theory. Polym. J. 1998, 30, 90–94. [Google Scholar] [CrossRef]
  26. Domínguez, J.C.; Alonso, M.V.; Oliet, M.; Rojo, E.; Rodríguez, F. Kinetic study of a phenolic-novolac resin curing process by rheological and DSC analysis. Thermochim. Acta 2010, 498, 39–44. [Google Scholar] [CrossRef]
  27. Pollard, M.; Kardos, J.L. Analysis of epoxy resin curing kinetics using the Avrami theory of phase change. Polym. Eng. Sci. 1987, 27, 829–836. [Google Scholar] [CrossRef]
  28. Lu, M.G.; Shim, M.J.; Kim, S.W. Dynamic DSC Characterization of Epoxy Resin by Means of the Avrami Equation. J. Therm. Anal. Calorim. 1999, 58, 701–709. [Google Scholar] [CrossRef]
  29. Chen, D.Z.; He, P.S.; Pan, L.J. Cure kinetics of epoxy-based nanocomposites analyzed by Avrami theory of phase change. Polym. Test. 2003, 22, 689–697. [Google Scholar] [CrossRef]
  30. Lu, M.G.; Shim, M.J.; Kim, S.W. The macrokinetic model of thermosetting polymers by phase-change theory. Mater. Chem. Phys. 1998, 56, 193–197. [Google Scholar] [CrossRef]
  31. Peng, L.; Yang, X.; Yu, Y.; Yu, D. Cure kinetics, microheterogeneity, and mechanical properties of the high-temperature cure of vinyl ester resins. J. Appl. Polym. Sci. 2010, 92, 1124–1133. [Google Scholar]
  32. Kmetty, Á.; Bárány, T.; Karger-Kocsis, J. Self-reinforced polymeric materials: A review. Prog. Polym. Sci. 2010, 35, 1288–1310. [Google Scholar] [CrossRef]
  33. Ren, P.; Liang, G.; Zhang, Z.; Lu, T. ZnO whisker reinforced M40/BADCy composite. Compos. Part A Appl. Sci. Manuf. 2006, 37, 46–53. [Google Scholar] [CrossRef]
  34. Ozawa, T. Kinetics of non-isothermal crystallization. Polymer 1971, 12, 150–158. [Google Scholar] [CrossRef]
  35. Ortiz Vélez, A.; Siles Alvarado, S.; Avendaño-Gómez, J.R. Cure behavior and kinetic study of diglycidyl ether of bisphenol A with a tertiary amine salt by differential scanning calorimetry. Polym. Eng. Sci. 2018, 58, 784–792. [Google Scholar] [CrossRef]
  36. Desio, G.P.; Rebenfeld, L. Crystallization of fiber-reinforced poly (phenylene sulfide) composites. II. Modeling the crystallization kinetics. Appl. Polym. Sci. 1992, 45, 2005–2020. [Google Scholar] [CrossRef]
Figure 1. Self-polymerization mechanism of cyanate ester in the presence of catalysts.
Applsci 09 02365 g001
Figure 2. Schematic diagram of the bisphenol A dicyanate (BADCy) resin nanoparticles initiating matrix curing.
Applsci 09 02365 g002
Figure 3. FT-IR of the BADCy monomer and BADCy resin nanoparticle.
Applsci 09 02365 g003
Figure 4. Differential scanning calorimetry (DSC) curves of the BADCy prepolymer matrix and BADCy resin nanoparticles.
Applsci 09 02365 g004
Figure 5. Representative SEM (a) and TEM (b) images of the BADCy resin nanoparticles.
Applsci 09 02365 g005
Figure 6. DSC curves of the BADCy matrix with different BADCy resin nanoparticles contents.
Applsci 09 02365 g006
Figure 7. Schematic illustration of free energy changes with size in the gel particle formation and growth stages. Under thermodynamic control, the final structures are in the state of minimum free energy. If kinetic control intervenes, the structure can be trapped in a metastable state (gel).
Applsci 09 02365 g007
Figure 8. Dynamic DSC curves at different heating rates of neat (a), 4 (b), 8 (c), and 10 wt% (d).
Applsci 09 02365 g008
Figure 9. Degree of cure at different heating rates in the neat (a), 4 (b), 8 (c), and 10 wt% (d) systems.
Applsci 09 02365 g009
Figure 10. Avrami fitting plots of the non-isothermal curing at various temperatures in the neat (a), 4 (b), 8 (c), and 10 wt% (d) systems.
Applsci 09 02365 g010
Figure 11. Temperature dependence of the rate constants for the different BADCy systems.
Applsci 09 02365 g011
Table 1. Thermal characteristics of samples. BADCy: Bisphenol A dicyanate.
BADCy Resin Nanoparticles
wt%
Tonset
°C
Tpeak
°C
ΔH
J/g
0248308303.19
4209238423.16
8212235441.15
10201229370.60
Table 2. Kinetic parameters obtained from Equation (9) at different temperatures under dynamic conditions for the neat system.
Temperature/°Ck′/minn·K−nn
2704.26 ± 1.511.42 ± 0.17
2807.41 ± 1.471.46 ± 0.17
29013.18 ± 1.451.50 ± 0.11
30020.42 ± 1.351.48 ± 0.12
31026.30 ± 1.321.40 ± 0.11
32026.92 ± 1.381.22 ± 0.14
Table 3. Kinetic parameters obtained from Equation (9) at different temperatures under dynamic conditions for the 4, 8, and 10 wt% systems.
T/°C4 wt%8 wt%10 wt%
k′/minn·K−nnk′/minn·K−nnk′/minn·K−nn
2000.74 ± 1.311.46 ± 0.030.72 ± 1.231.34 ± 0.090.78 ± 2.141.15 ± 0.04
2101.35 ± 1.171.50 ± 0.071.90 ± 1.261.46 ± 0.102.14 ± 1.101.25 ± 0.03
2202.51 ± 1.101.55 ± 0.116.31 ± 1.101.61 ± 0.044.57 ± 1.201.21 ± 0.08
2304.47 ± 1.151.59 ± 0.0610.47 ± 1.261.52 ± 0.107.07 ± 1.171.08 ± 0.07
2406.31 ± 1.071.41 ± 0.0311.71 ± 1.201.31 ± 0.077.41 ± 1.170.84 ± 0.07
2507.24 ± 1.021.17 ± 0.0113.08 ± 1.511.03 ± 0.168.32 ± 1.090.74 ± 0.04

