Review

Recent Development of Aptamer Sensors for the Quantification of Aflatoxin B1

School of Chemistry and Chemical Engineering, Research Institute of Resource Chemical Industry, Lingnan Normal University, Zhanjiang 524048, China
*
Author to whom correspondence should be addressed.
Appl. Sci. 2019, 9(11), 2364; https://doi.org/10.3390/app9112364
Submission received: 29 April 2019 / Revised: 29 May 2019 / Accepted: 31 May 2019 / Published: 10 June 2019
(This article belongs to the Section Chemical and Molecular Sciences)

Abstract

:
Aflatoxin B1 (AFB1) is one of the most frequently-found mycotoxins in contaminated food. As the content of mycotoxins is particularly low in food, the development of probes to detect AFB1 in foods with high sensitivity and selectivity is an urgent social need for the evaluation of food quality. Numerous techniques have been developed to monitor AFB1. Nevertheless, most of them require cumbersome, labor-consuming, and sophisticated instruments, which have limited their application. An aptamer is a single, short nucleic acid sequence that is capable of recognizing different targets. Owing to their unique properties, aptamers have been considered as alternatives to antibodies. Aptasensors are considered to be an emerging strategy for the quantification of aflatoxin B1 with high selectivity and sensitivity. In this review, we summarize recent developments in colormetric, electrochemical, SERS, and fluorescent aptasensors for the quantification of AFB1. Finally, the perspectives and current challenges of aptasensors for AFB1 are outlined.

1. Introduction

Mycotoxins are a class of secondary metabolites produced by molds that are widely distributed in nature and are highly common in food contamination [1]. When humans and animals take in mycotoxins through food, they can cause a decline in body function, which can lead to illness or death [2]. Common mycotoxins are ochratoxins, fumonisins, aflatoxins, citrinin (CTN), and zeallenone (ZEN) [3]. Among them, aflatoxin (AF) is a kind of highly-toxic secondary metabolite produced by the fungi Aspergillus flavus, as well as Aspergillus parasiticus. It has been reported that aflatoxin is a highly stable natural mycotoxin [4]. Aflatoxins show strong heap-toxicity after entering human or animal bodies, which can cause liver hemorrhage, steatosis, bile duct hyperplasia, and liver cancer [5]. People and animals mainly ingest aflatoxins through dietary channels. With the occurrence of aflatoxin contamination, the pollution of aflatoxin in food has gained attention in countries all over the world. The detection of aflatoxin in food has become a hot subject for scholars at home and abroad. Among various aflatoxins, AFB1 is the most common and toxic, owing to its capacity to forbid the RNA synthesis of cells, which can largely increase the risk of liver cirrhosis, necrosis, and carcinoma in human beings and animals. The cancer research organization of the World Health Organization has classified it as a Class I carcinogen.
A large number of technologies have been developed for the quantification of AFB1, such as high-performance liquid chromatography [6,7], liquid chromatography-mass spectrometry [8,9], and thin-layer chromatography [10]. Although these methods are very mature, they are hindered by cumbersome operations, long detection cycles, complicated sample pre-processing, rapid screening for large numbers of samples, expensive instruments, and inconvenient portability, which limit their detection ability in practical applications [11]. In recent years, methods for detecting aflatoxins based on antibody-linked immunosorbent assays have been developed, to some extent. However, these methods, which use antibodies as recognition molecules, are expensive, unstable, and prone to false-positive detection results [12]. Therefore, it is particularly urgent and important to develop low-cost, high-sensitivity methods for the detection of aflatoxins in actual samples, such as foods and related products.
With the recent developments in biotechnology, a biomolecule—called a nucleic acid aptamer (aptamer)—has been widely used in biosensors. Aptamer is a nucleic acid ligand and, furthermore, it is an index-enriched ligand. Aptamer is a nucleic acid ligand that was exponentially enriched by the phylogenetic technique. The phylogenetic technique SELEX screens a single-stranded oligonucleotide in vitro to specifically bind small molecules, proteins, bacteria, viruses, cells, and the like [12,13]. In the field of analysis and diagnosis, nucleic acid aptamers have many advantages (compared with traditional antibodies), including convenient preparation, specificity, stability, ease of modification, strong affinity, and wide range of target molecules [14,15]. As an emerging biomarker probe and recognition molecule, it is widely used in the construction of biosensors, and its application in disease diagnosis and treatment, proteomics research, biosensing and toxin sensing, microbial detection, and other fields [16,17]. With the continuous improvement and combination of nucleic acid aptamers, rapid biotoxin detection technologies will be more portable, more stable, and more efficient, giving great advantages.
As an oligonucleotide fragment, a nucleic acid aptamer does not have a signal transduction function. Its recognition and binding process, specific to a target molecule, does not produce a detectable physicochemical signal. Therefore, there is a need for a process to convert the specific recognition-binding process of a nucleic acid aptamer to a target substance into a readily-detectable optical signal change. As shown in Figure 1, this review focuses on the application of nucleic acid aptamer sensors in AFB1 detection, based on colorimetric, electrochemical, fluorescent, and surface-enhanced Raman scattering aptamer sensors, in recent decades.

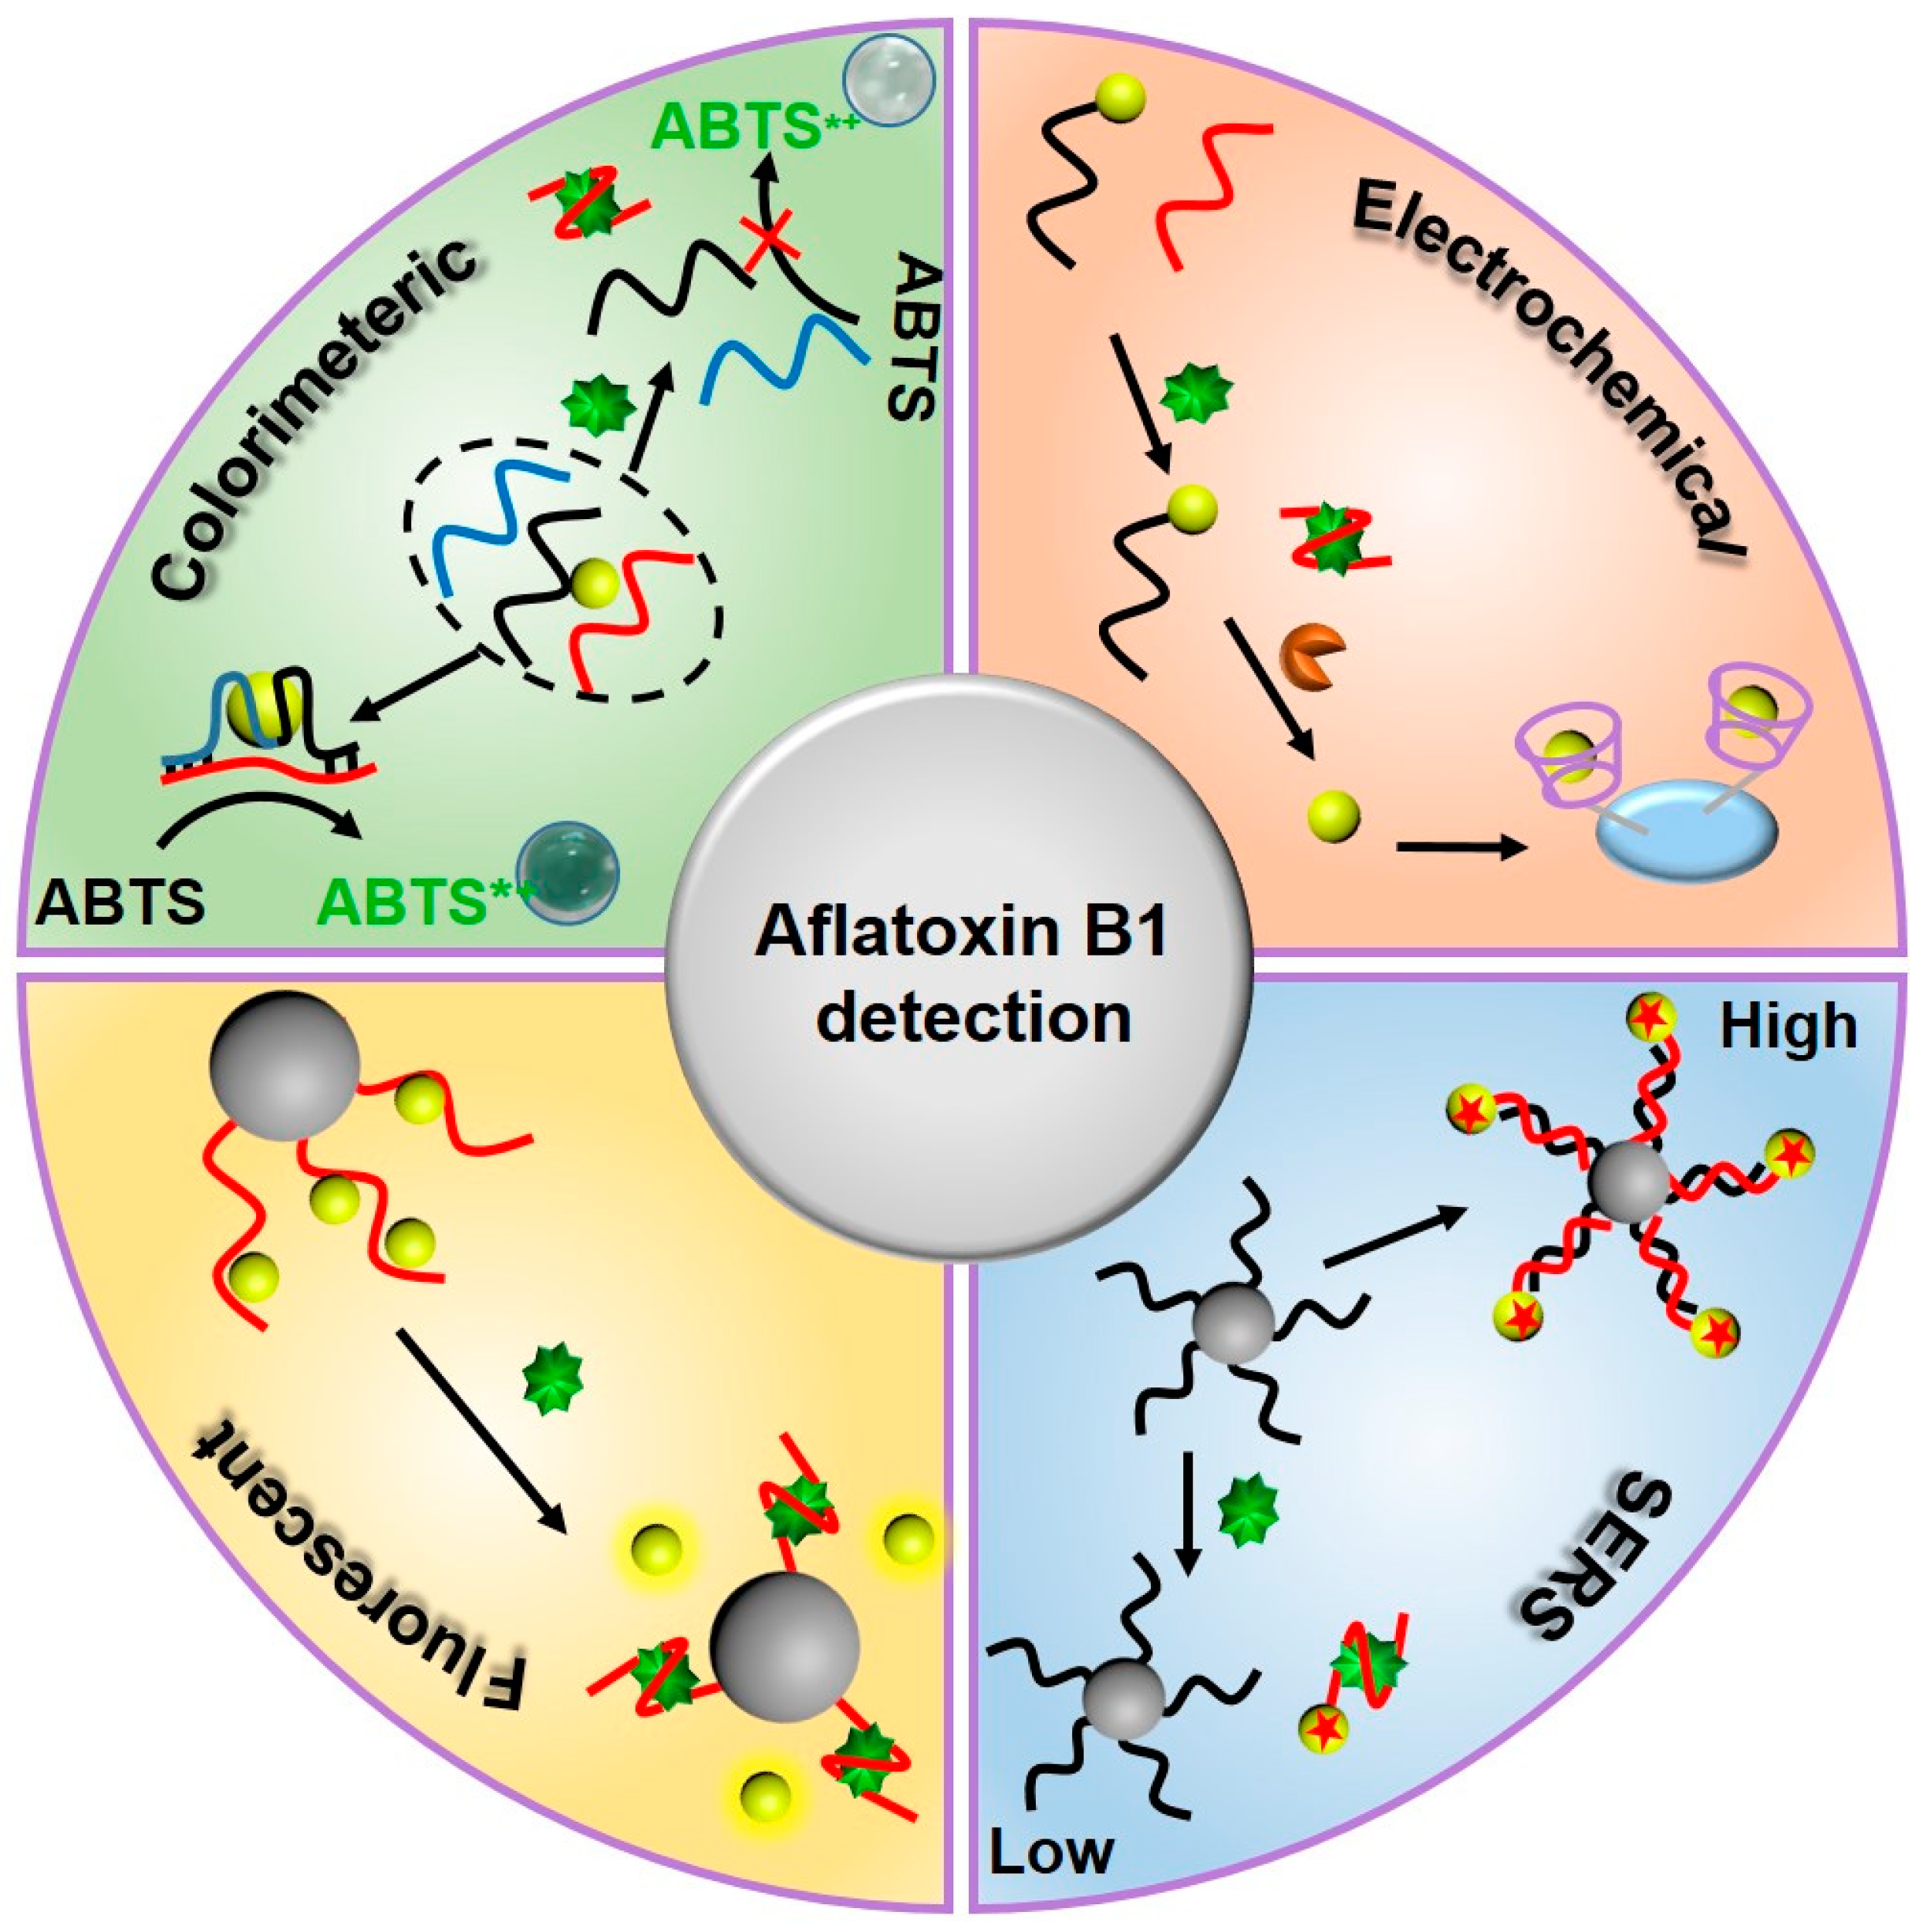
2. Colorimetric, Electrochemical, and Fluorescent Aptamer Sensors to Monitor AFB1

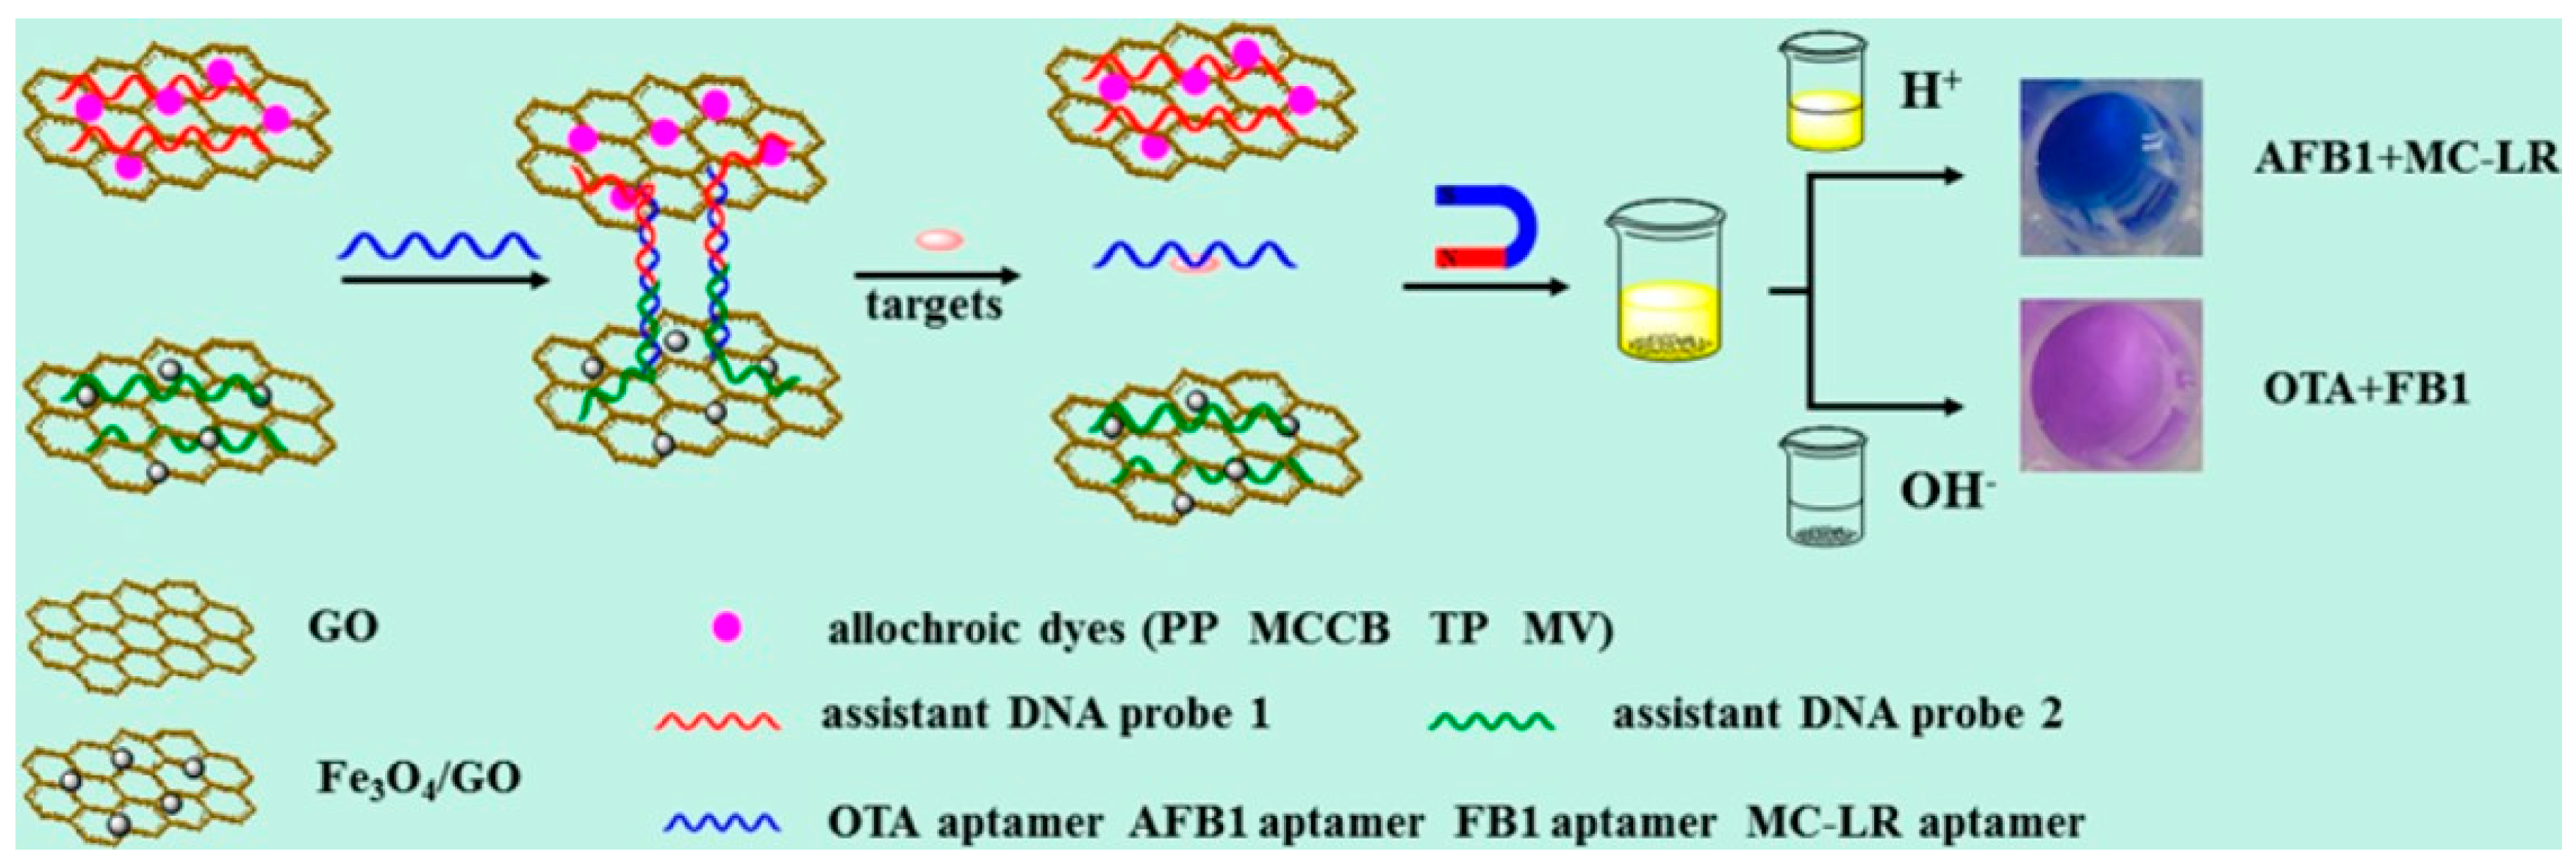
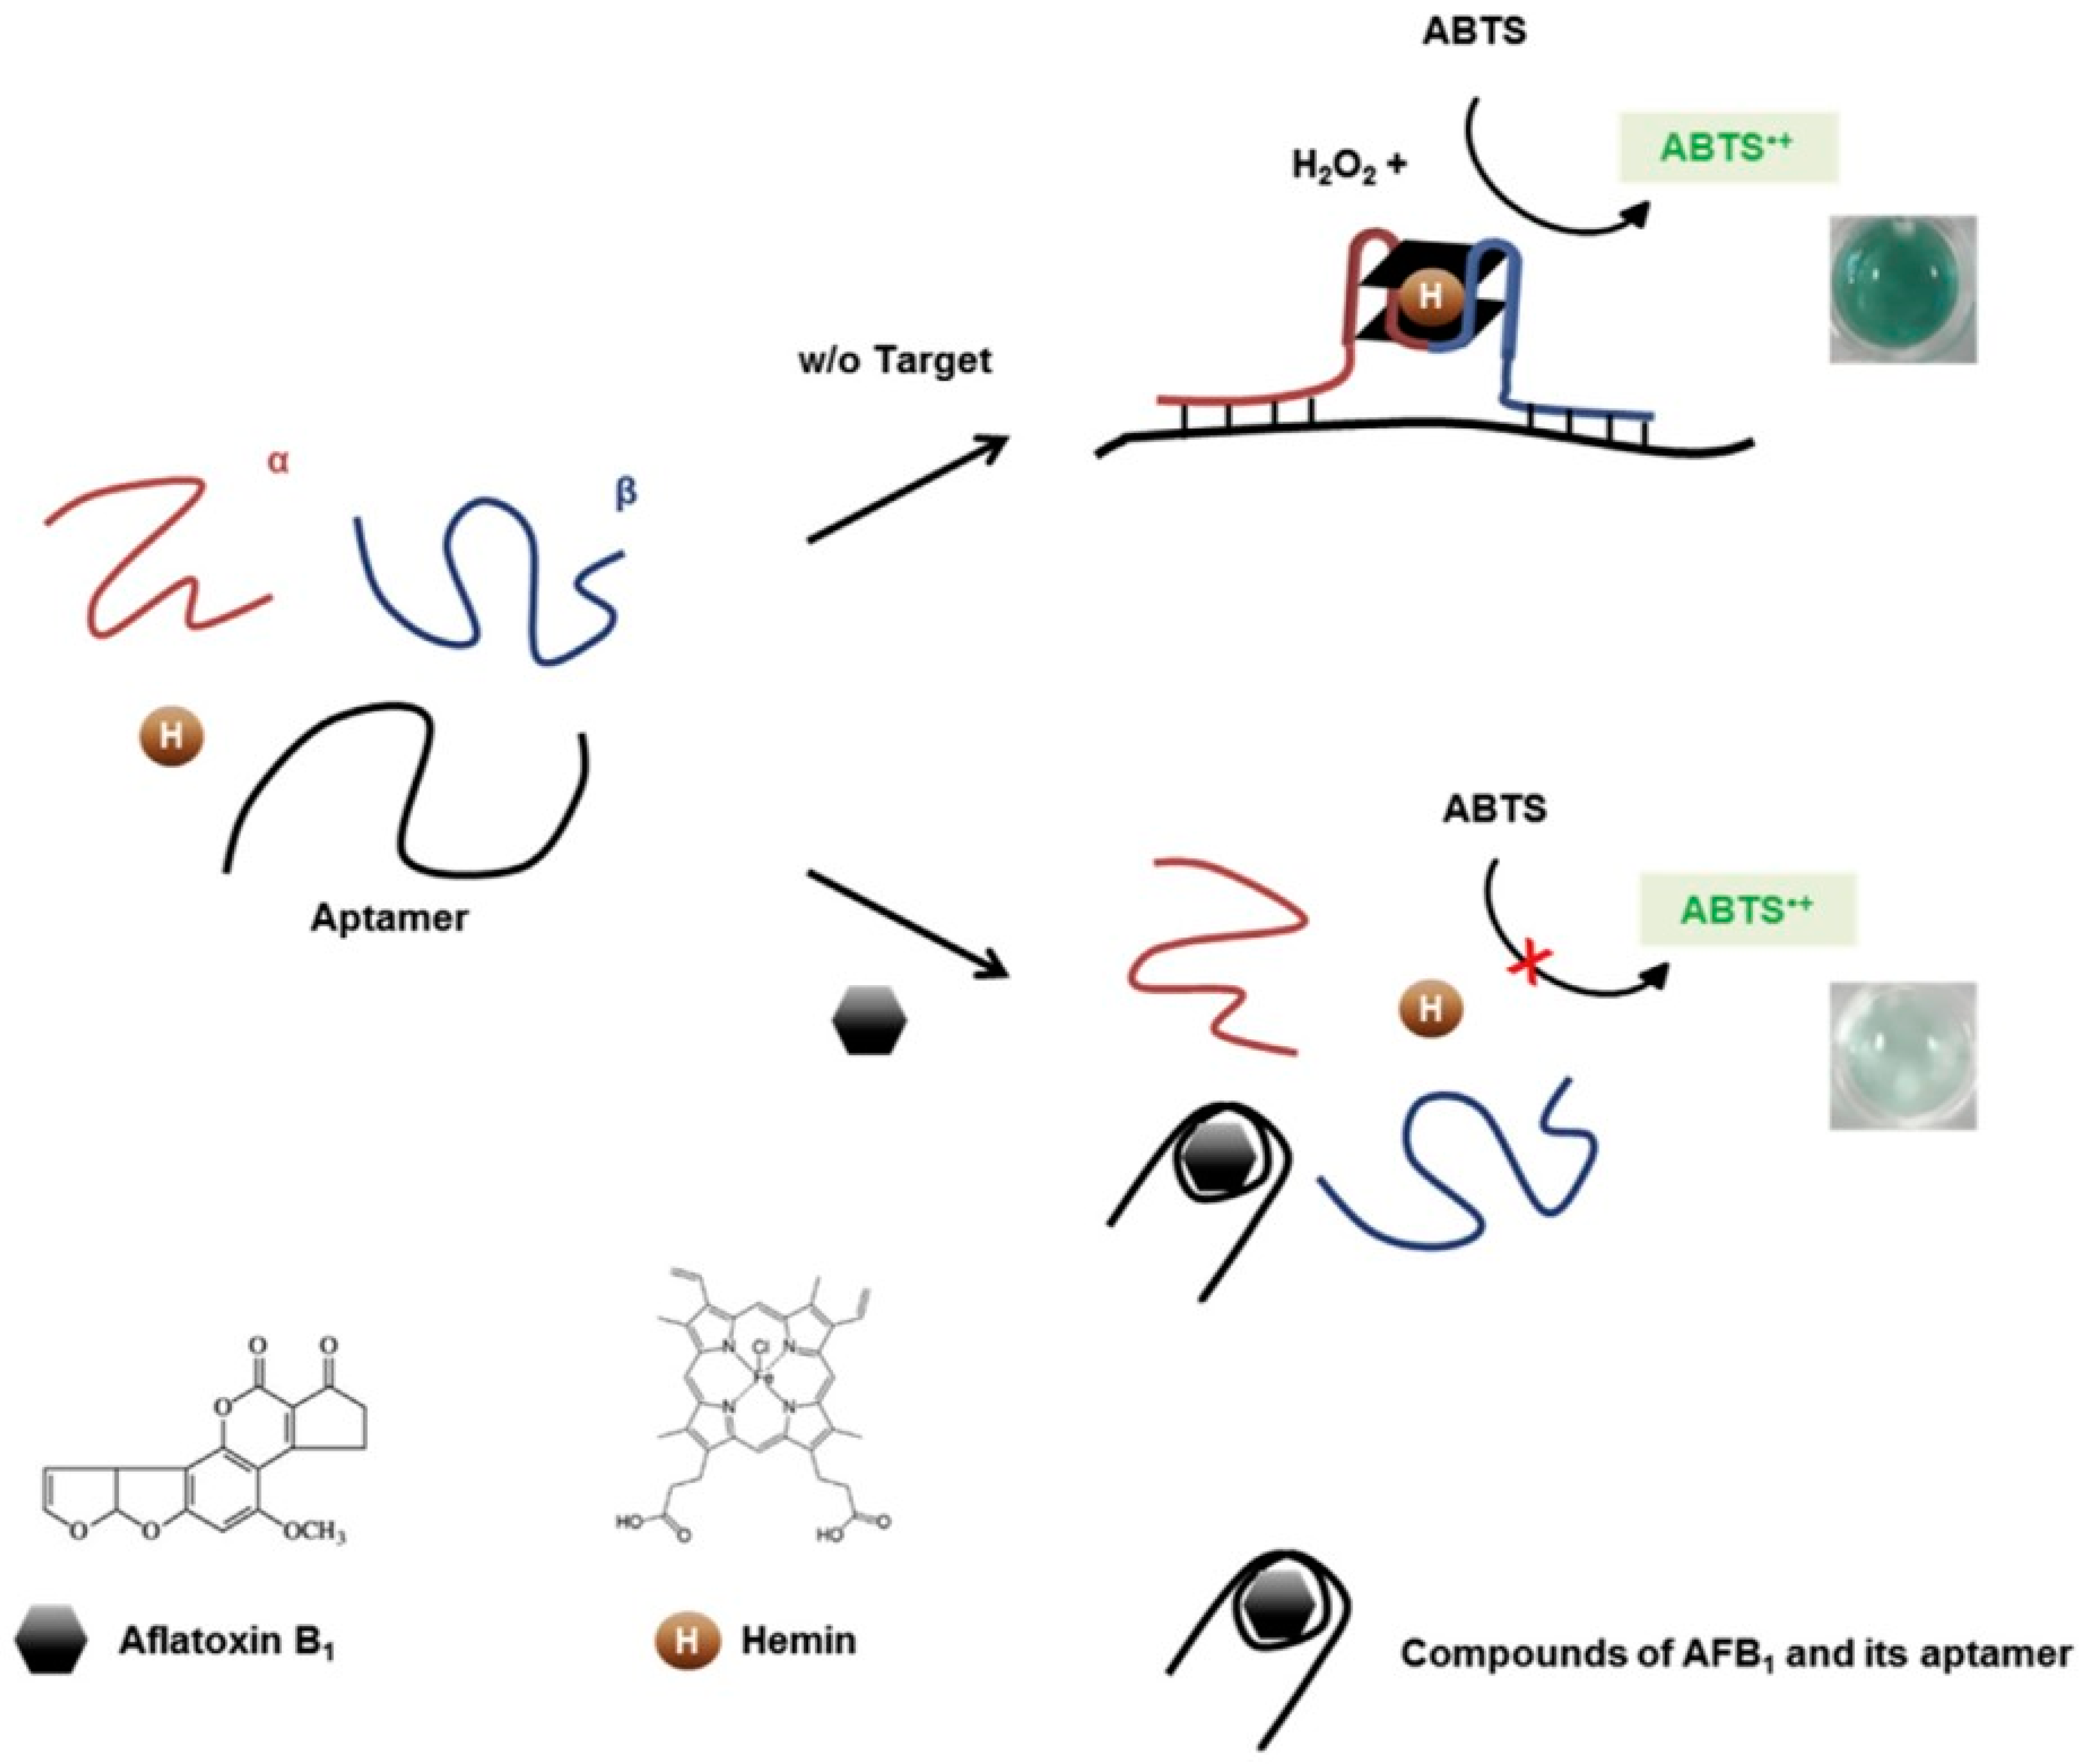
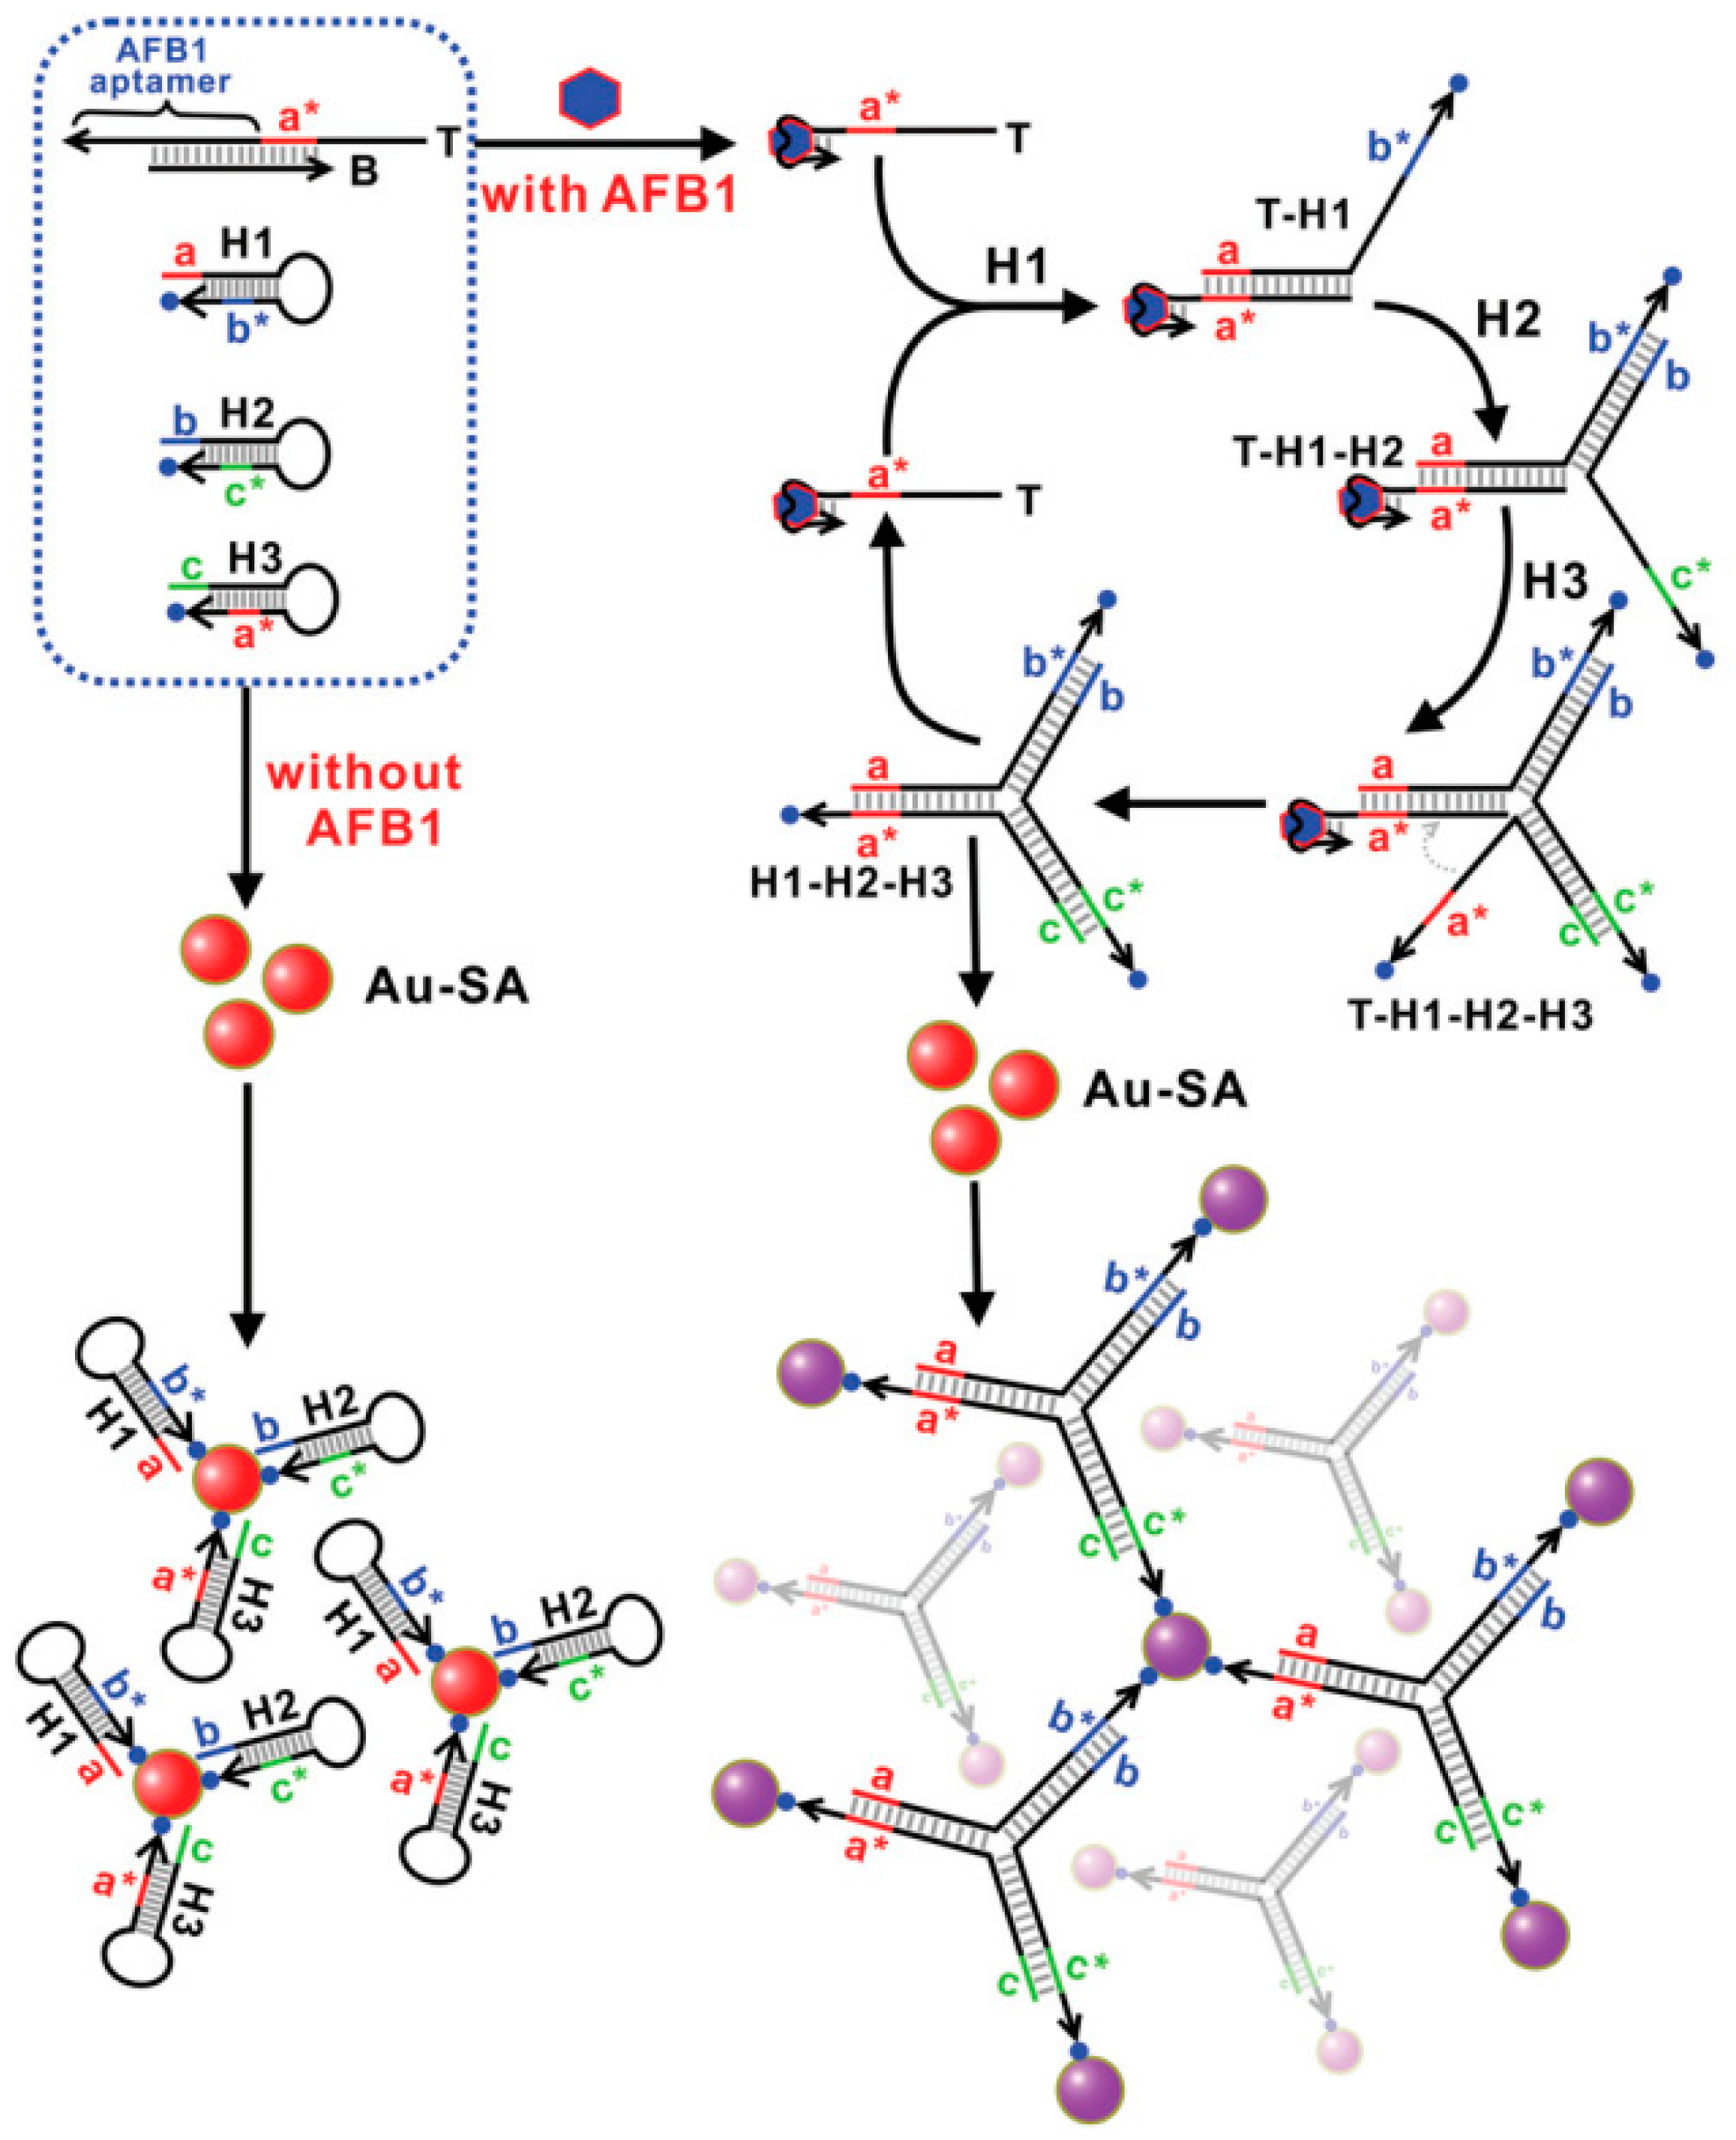
2.1. Colorimetric Aptamer Sensor for AFB1

Hao and coworkers developed a low-cost, as well as sensitive, probe for the colorimetric determination of microcystin-LR (MC-LR), fumonisin B1, aflatoxin B1, as well asochratoxin A via DNA-induced graphene oxide (GO) self-assembly and magnetic separation [18]. As shown in Figure 2, the probe consisted of two platforms, where one was comprised of four allochroic dyes, which included methyl violet (MV), thymolphthalein (TP), malachite green carbinol base (MGCB), and phenolphthalein (PP) for four different analytes, as well as assistant DNA probe 1 adsorbed on the GO. The other platform was comprised of assistant DNA probe 2 adsorbed on the surface of the GO, which was modified with Fe3O4. Assistant DNA probes 1 and 2 were partially hybridized to the aptamer, upon mixing the aptamer with the two platforms in aqueous media. Subsequently, the two GO assemblies formed immediately in the presence of the aptamer. The assembly was easy to separate, by magnet, in the absence of the target. After the recognition of various targets, the reaction system was subjected to magnetic separation. Subsequently, pH value was employed to control the order of release of the dyes from the GO. Upon addition of acidic water into the supernatant, the MGCB, as well as the MV, molecules, which were adsorbed on the surface of the GO, were released as the allochroic dyes had changed to hydrophilic. A mixture of green (MGCB) and purple (MV) was observed in the supernatant. On account of good linearity between the analyte and the dye, the color signals attributed to MGCB and MV were related to the contents of AFB1 and MC-LR, respectively. The PP, as well as TP, which were adsorbed on the GO, were released with the addition of basic water into the precipitate. A mixture of pink and blue was observed in the color of the precipitate. This probe can be used to rapidly detect target through simple magnetic separation, as well as the adjustment of the pH of the aqueous media. By using a similar strategy, different targets could be detected simultaneously, by using various respective dyes and different ssDNAs.
Seok et al. designed an ultra-sensitive colorimetric probe which was capable of detecting aflatoxin B1. The probe consisted of two split DNAzyme halves, as well as an aptamer (see Figure 3) [19]. When AFB1 was absent, the split probes had a capability for peroxidase-mimicking activity, accompanied by a change of color in the catalytic reaction. AFB1 was specifically recognized by the aptamer, enabling the dissociation of the aptamer–DNAzyme complex. Therefore, the catalytic ability of DNAzyme was reduced, owing to the splitting of the DNAzyme halves. The color of the solution containing ABTS changed from colorless to green. However, the AFB1 aptamer was capable of binding to AFB1 when AFB1 was present, which led to the splitting of a hemin, which then could not bind to the DNAzymes. Therefore, the color of the solution was colorless and did not change. As a consequence, the colorimetric signal decreased as the concentration increased from 1.0 × 10⁻⁷ to 1.0 × 10⁻² g·L−1. The oxide ABTS decreased when AFB1 was present. The detection limit of the probe was as low as 1.0 × 10⁻⁷ g·L−1. The novel probe exhibited good performance for distinguishing AFB1 from other mycotoxins and could be used for the quantification of AFB1 in ground corn samples.
Chen et al. developed an enzyme-free sensor for the determination of aflatoxin B1 by utilizing a catalytic DNA circuit to amplify the colorimetric signal (Figure 4) [20], where the colorimetric signal can be visualized without any other equipment. The sensor consisted of two components: Gold nanoparticles, which were modified with streptavidin, acted as the signal indicators; and three hairpin DNA probes, which were biotinylated, were employed for the specific recognition of AFB1. When AFB1 was present, toehold-mediated strand displacement reactions occurred. Subsequently, the hairpins opened and induced recycling. Consequently, the color of the solution changed to red due to the formation of aggregates of nanoparticles through biotin–streptavidin coupling. The colorimetric signal was linear with respect to AFB1 in the range from 3.1 × 10⁻⁹ to 3.1 × 10⁻⁴ g·L−1. Due to the high sensitivity of the sensor, AFB1 was able to be detected at concentrations as low as 6.2 × 10⁻¹⁰ g·L−1. The sensor was capable of detecting AFB1 in complex sample matrices, including rice samples, due to the robustness of the sensor. The proposed method was simple and convenient in operation. The visible signal was observed after several solutions were mixed at room temperature, and provided a reliable, as well as ultra-sensitive, method for monitoring AFB1 in real environments.
Various strategies have been designed for highly rapid and selective determination of AFB1 in aqueous media. For instance, an AFB1-reponsive hydrogel was prepared by Ma et al. for the colorimetric determination of AFB1 with high sensitivity [21]. The hydrogel was composed of an AFB1 aptamer, as the recognition unit, and a pair of complementary DNA chains, which served as cross-links. In order to visually determine AFB1, gold nanoparticles were added into the hydrogel. In the presence of the analyte, an AFB1–aptamer complex formed, resulting in the destruction of the hydrogel. Meanwhile, the gold nanoparticles were subsequently released, resulting in a transition from colorless to red. Platinum nanoparticles (PtNPs) were added into the hydrogel in advance and, thereafter, the hydrogel was integrated with a distance-readout volumetric bar chart chip, in order to decrease the limit of detection as well as expand the approach toward quantitative analysis. Upon addition to AFB1, the hydrogel was subjected to disruption, the and PtNPs were then released. As a consequence, O2 was generated, which pulled the ink bar in the chip as H2O2 was decomposed in the presence of the PtNPs. A good linear relationship was found to exist between the distance the ink was moved and the H2O2 concentration. The limit of detection of AFB1 was estimated to be as low as 5.5 × 10⁻¹⁰ g·L−1. Furthermore, the strategy was applied to monitoring AFB1 in beer through colorimetric detection.

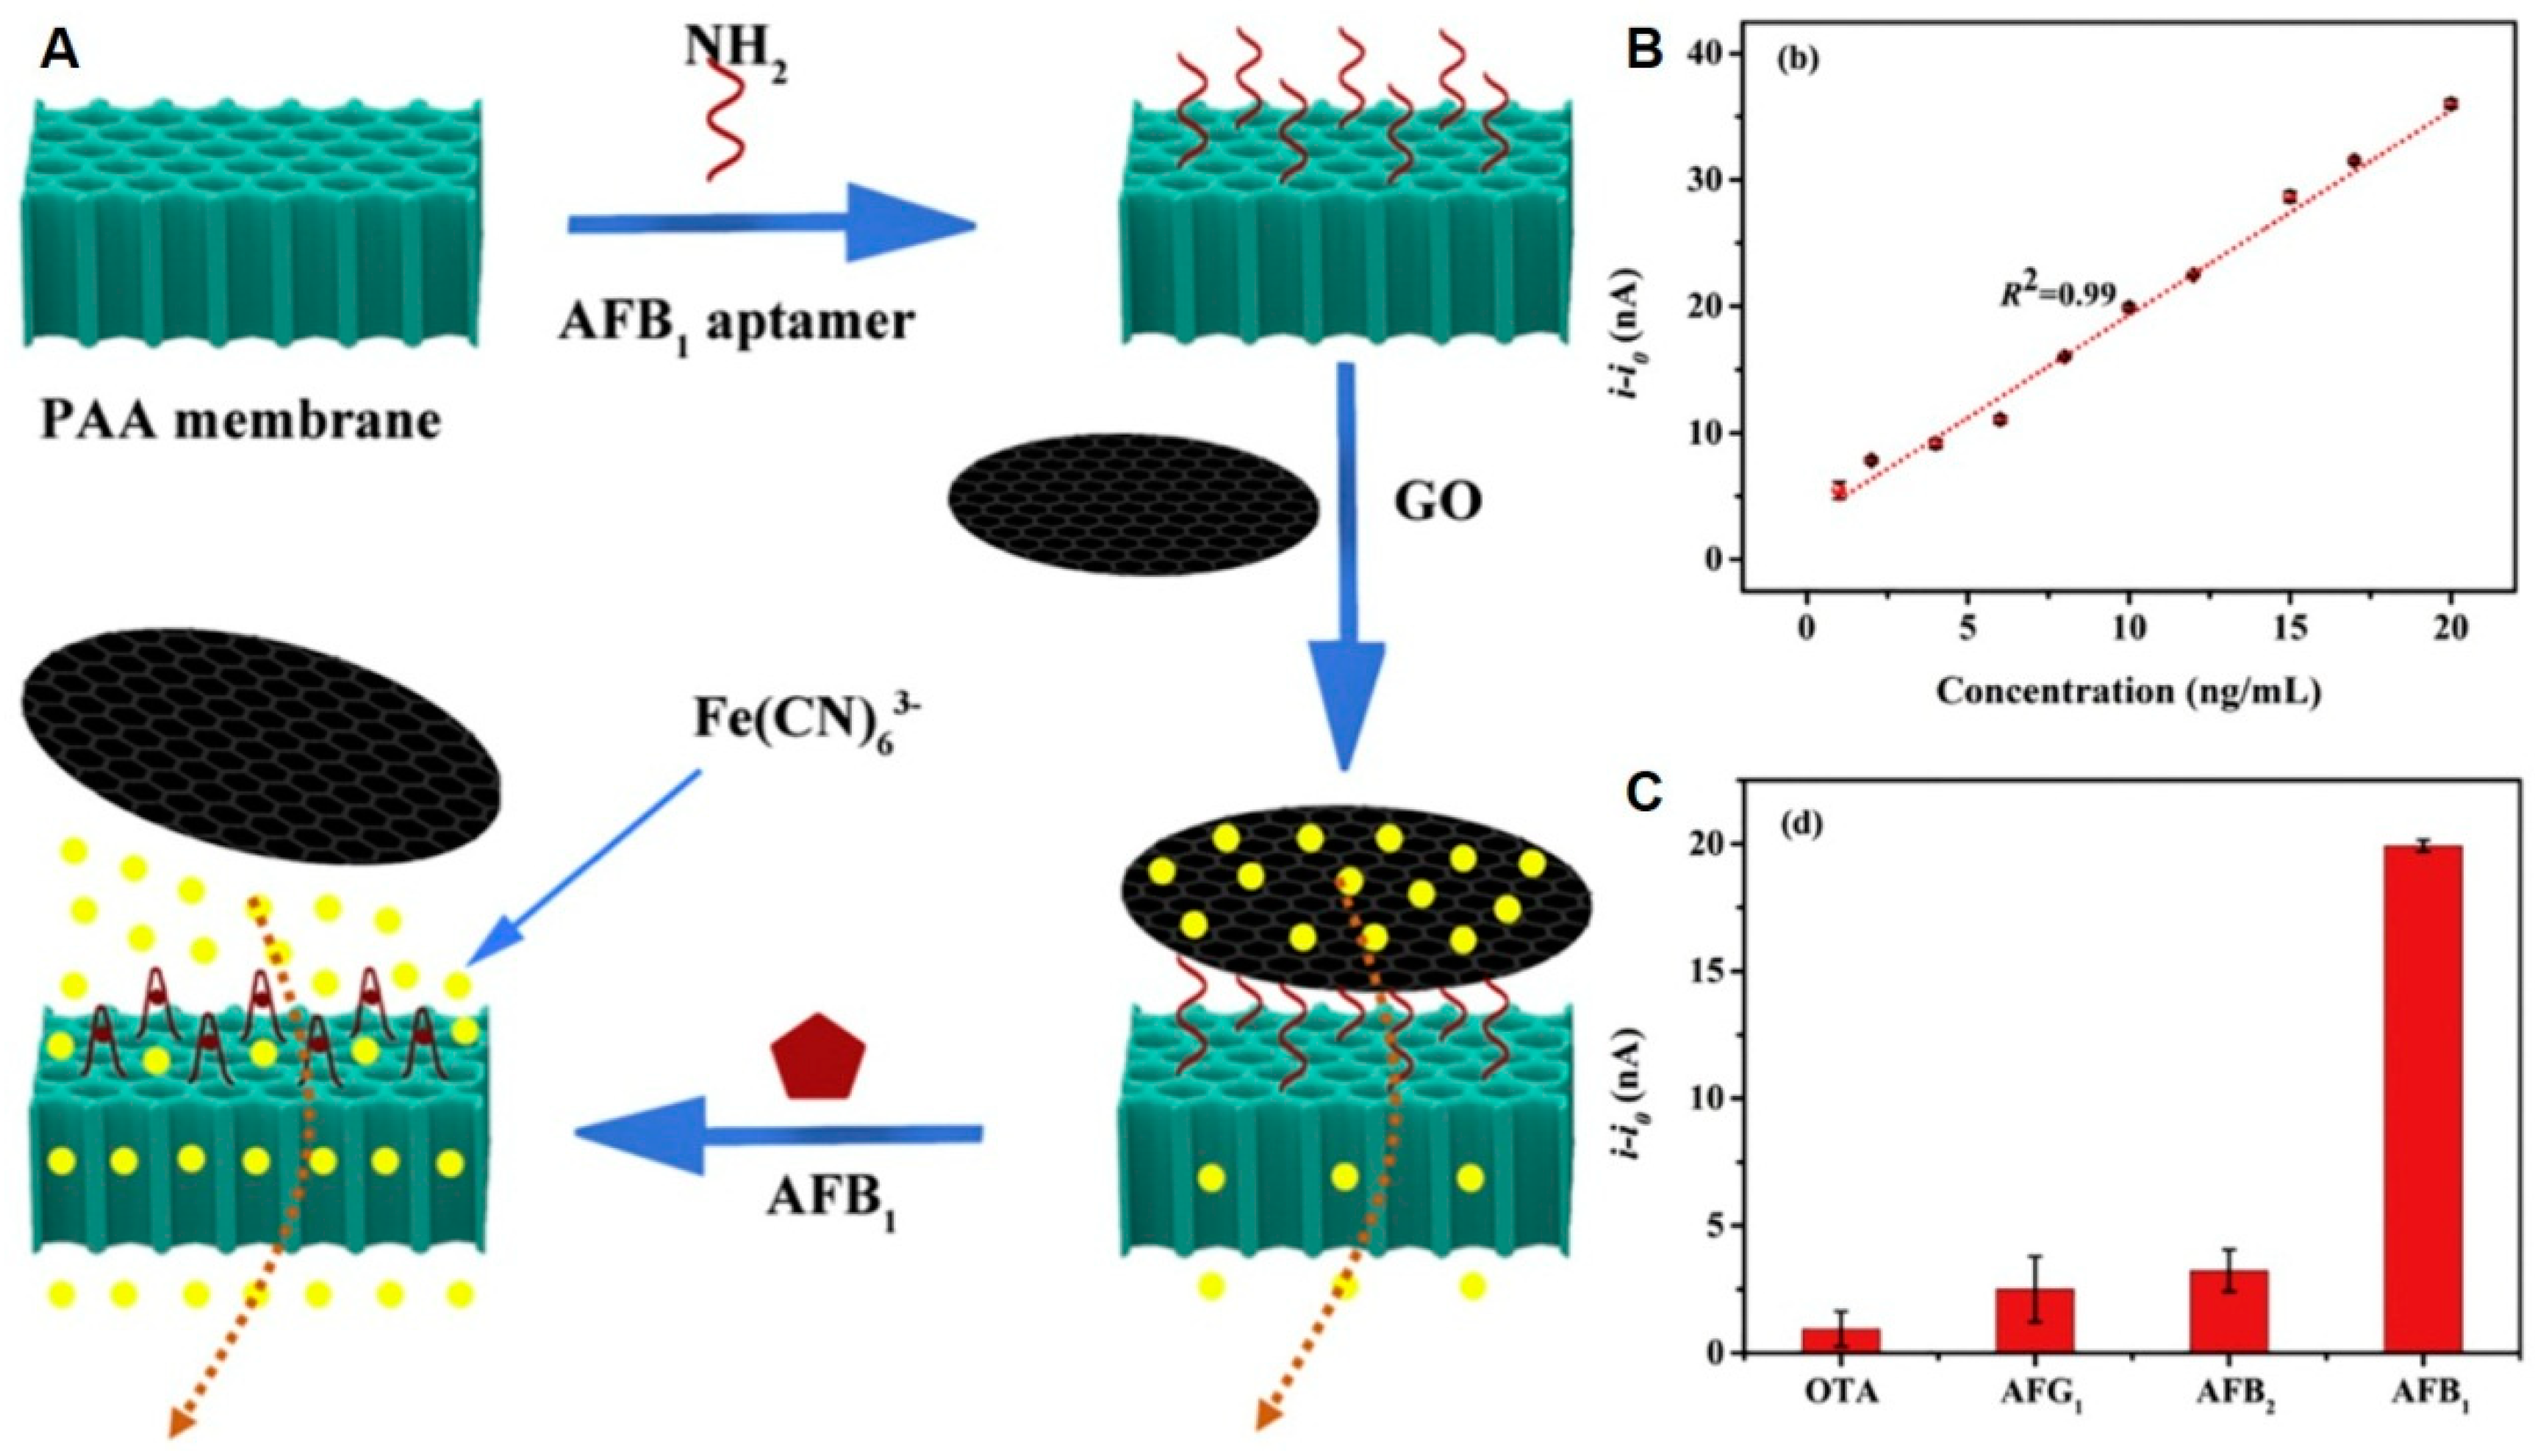
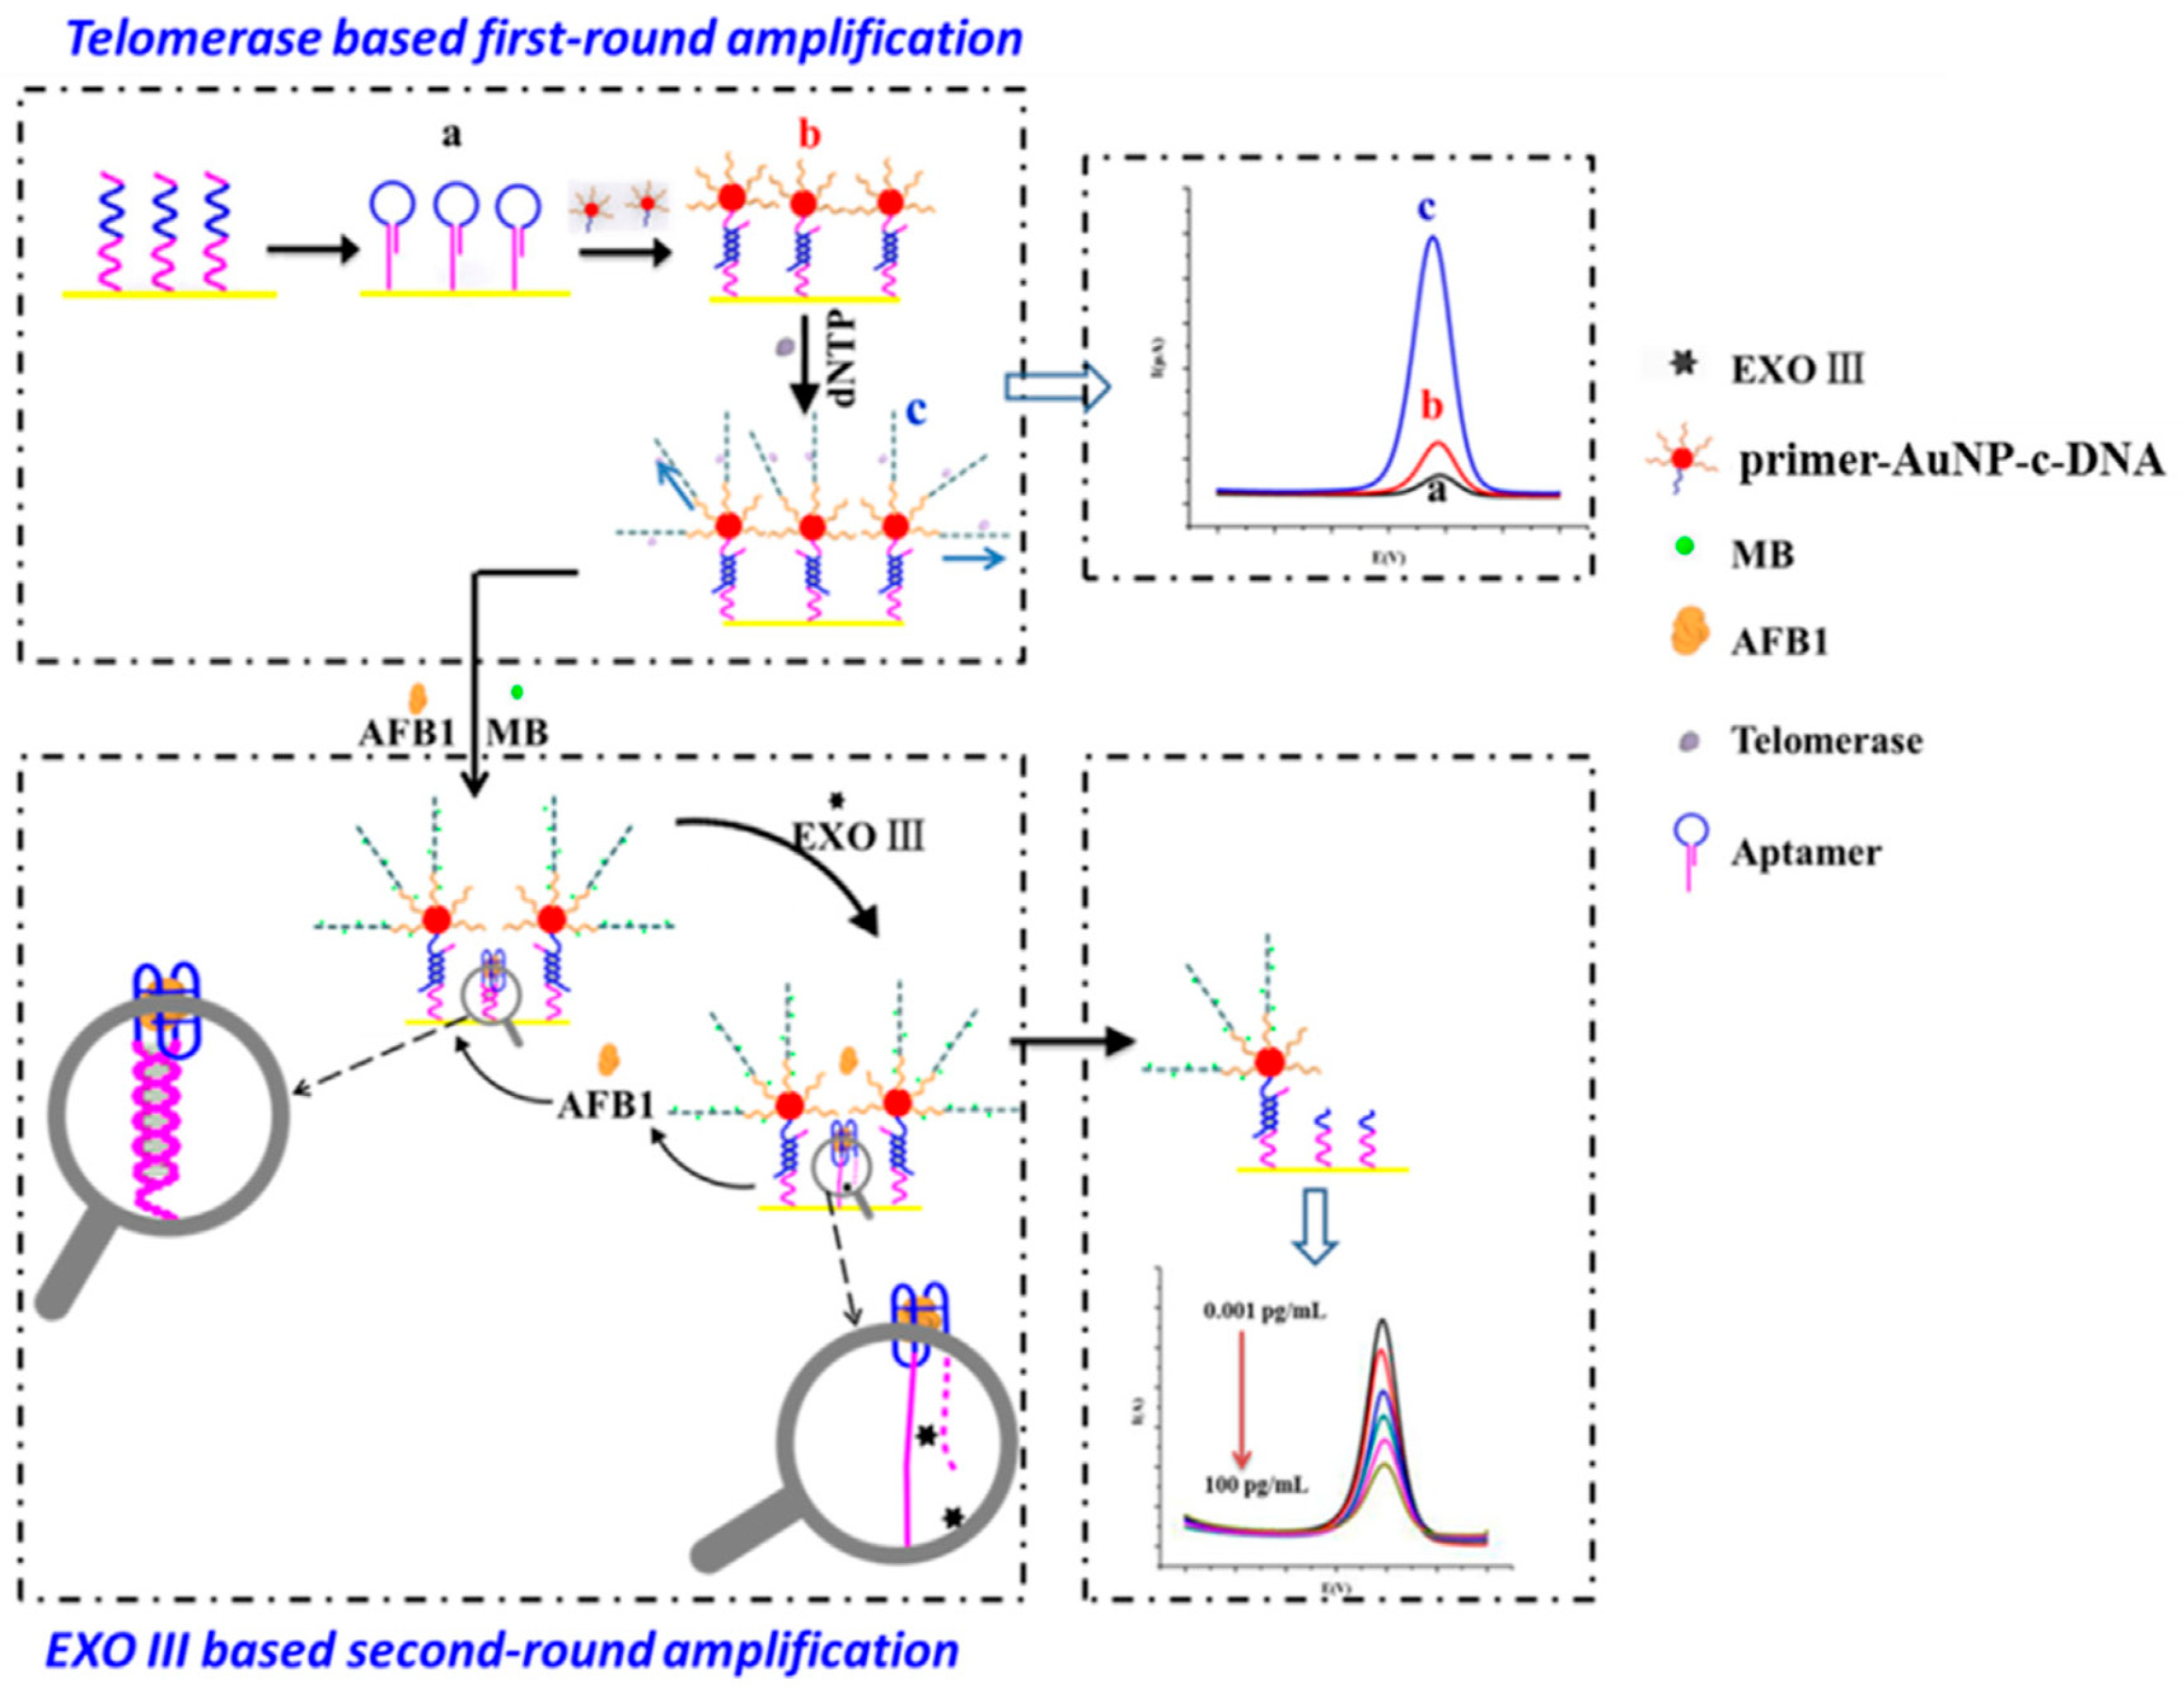
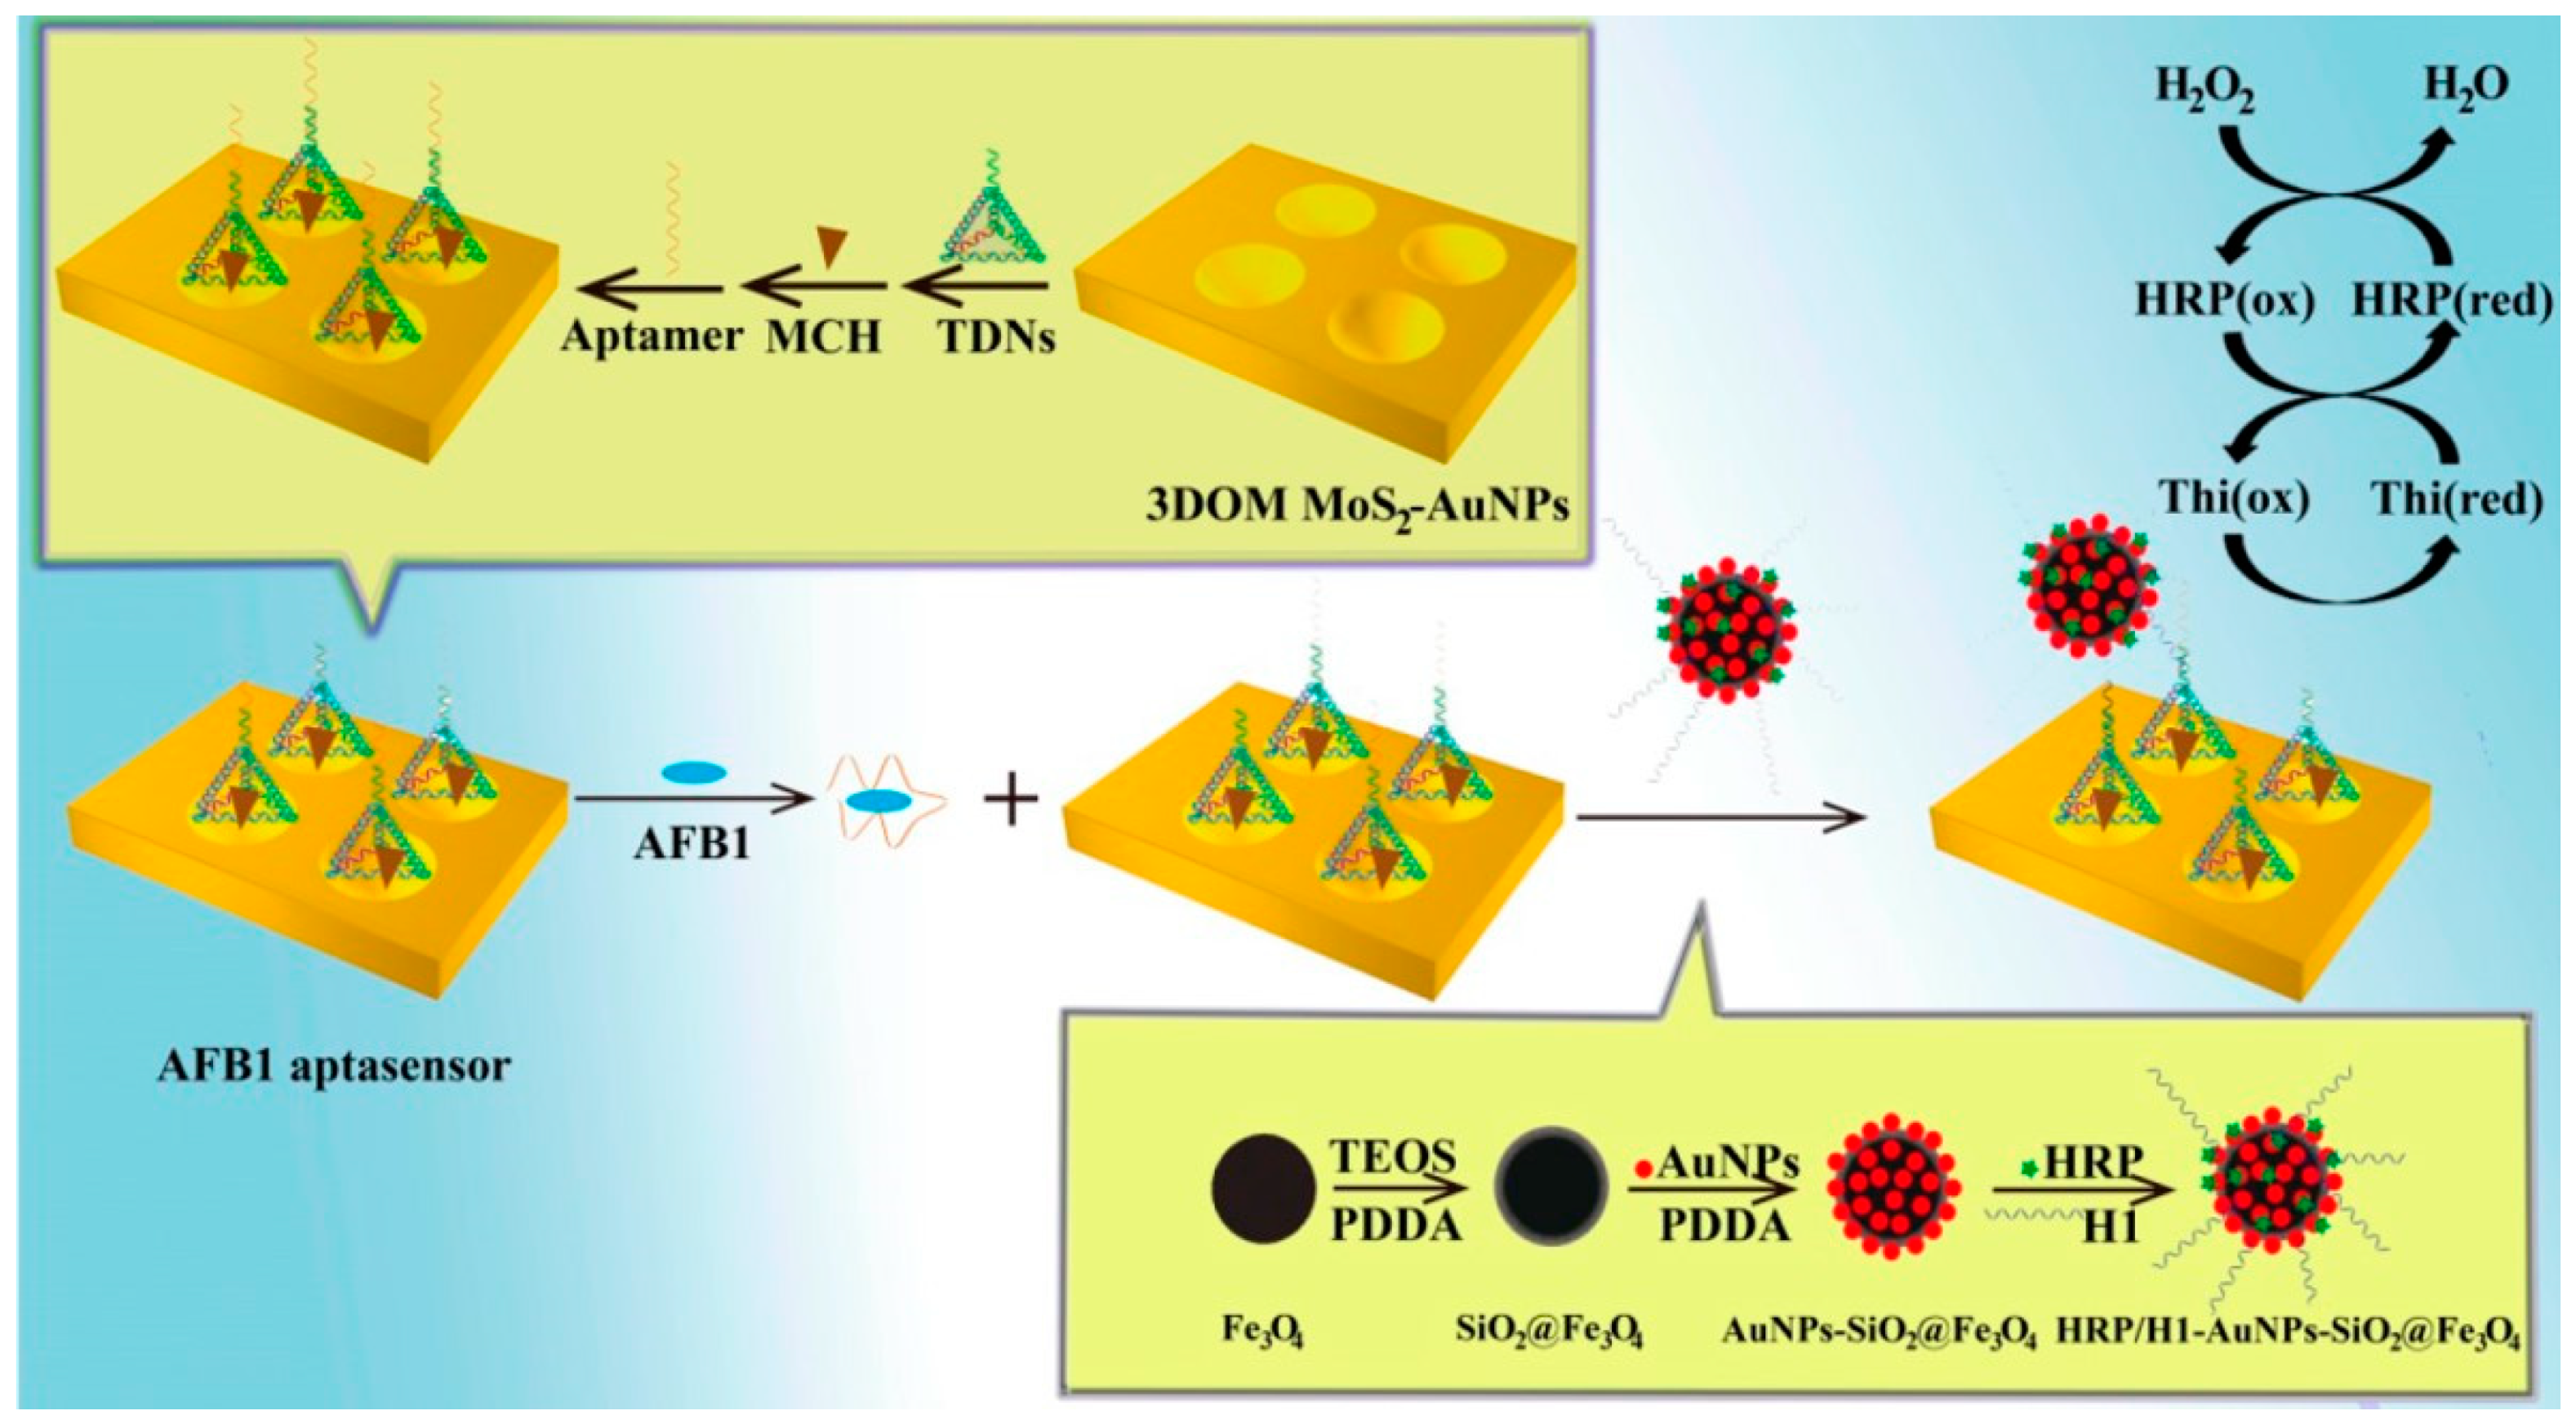
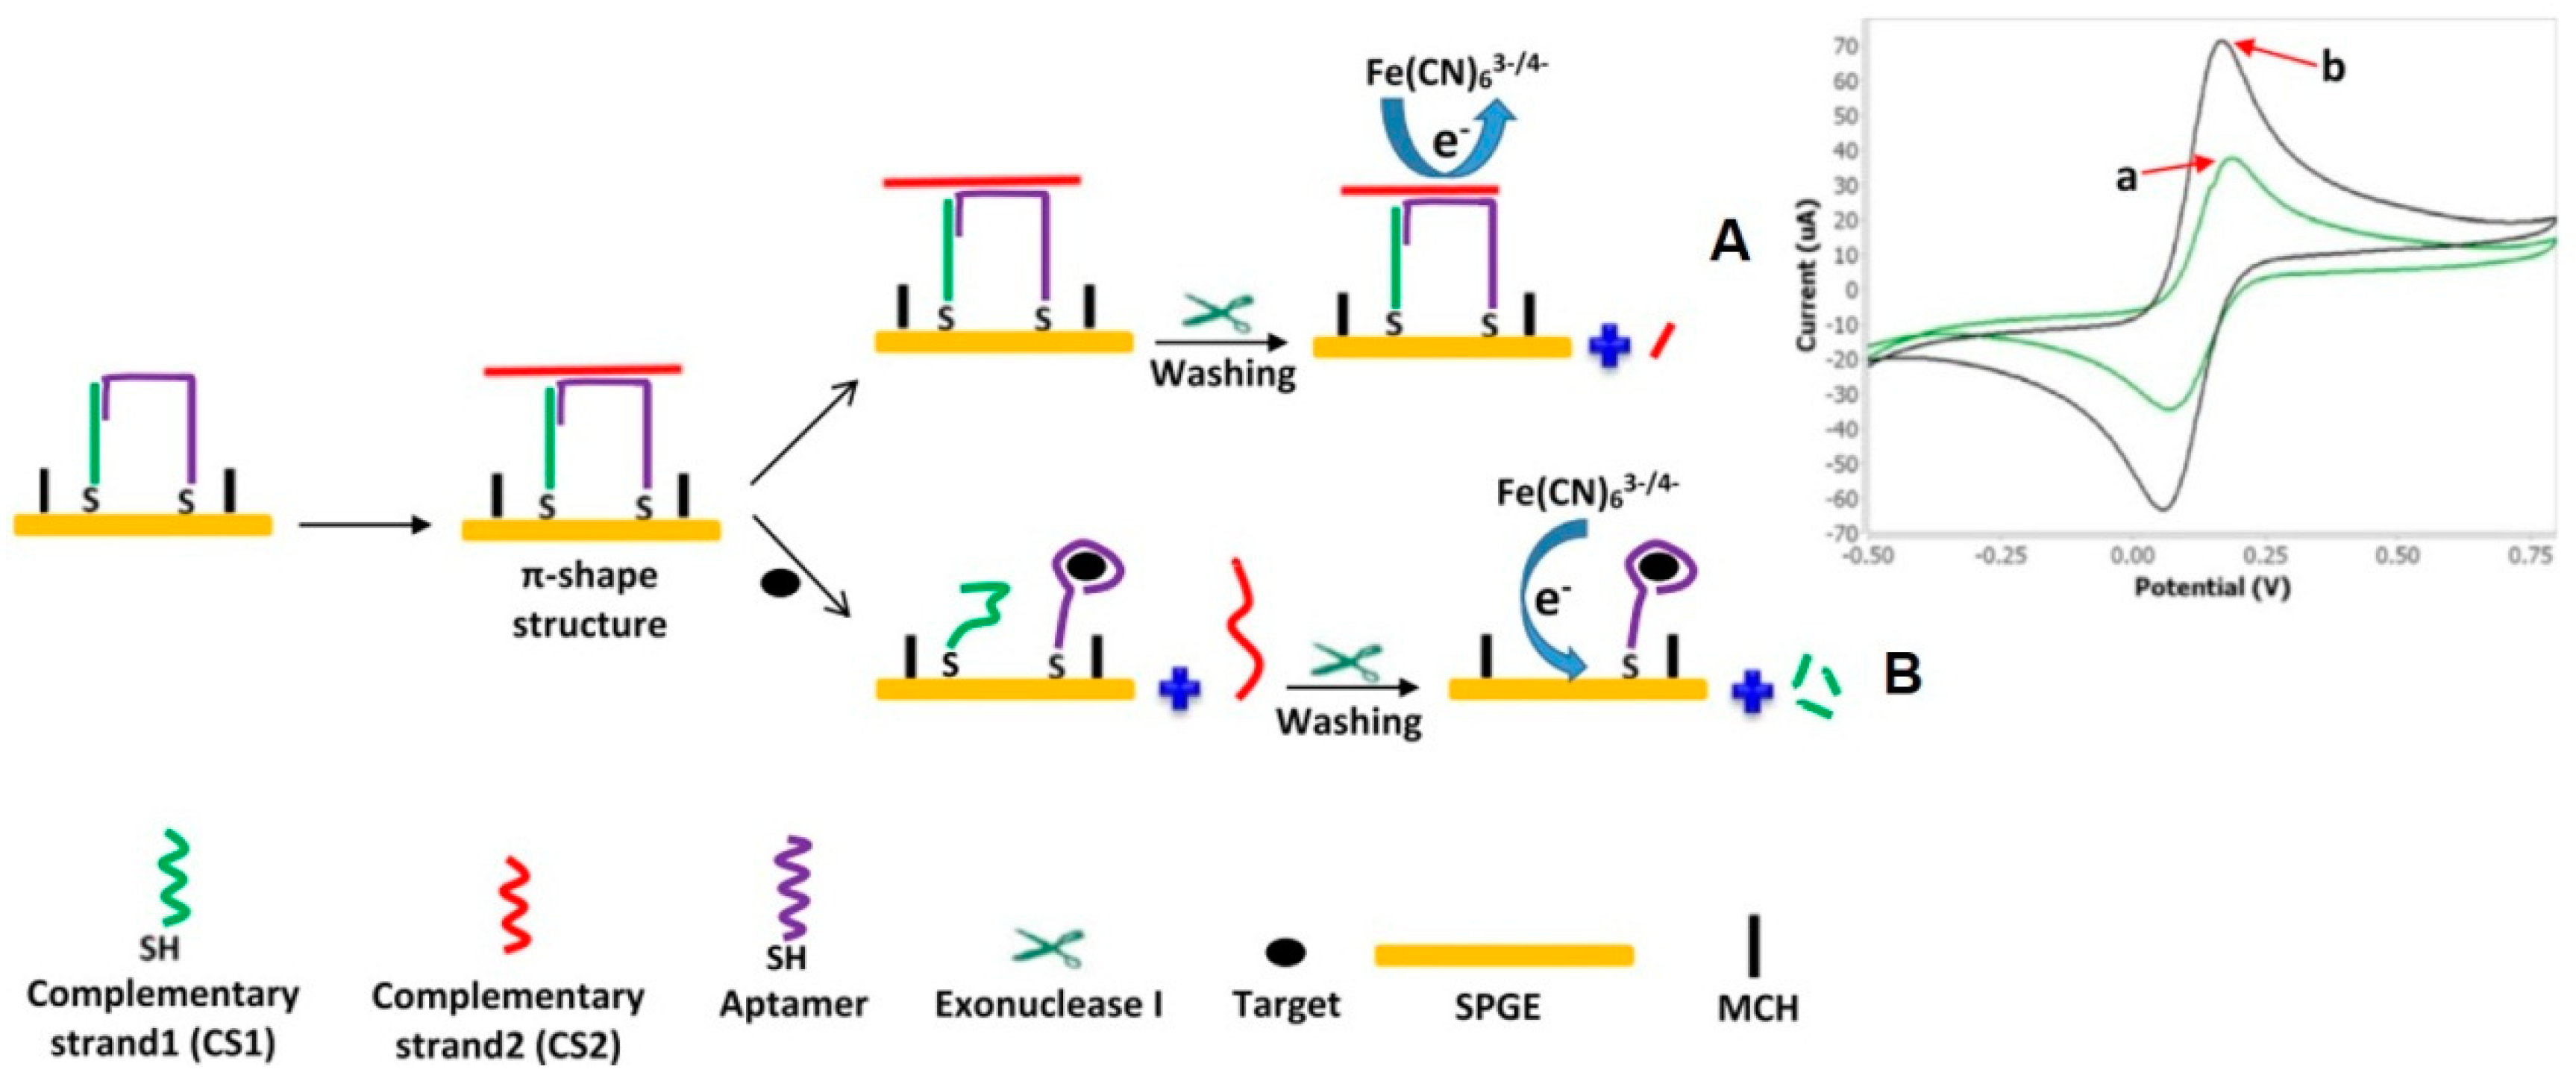
2.2. Electrochemical Aptamer Sensor for AFB1

Mo and colleagues have prepared a probe for the detection of aflatoxin B1, which used graphene oxide and an aflatoxin B1 aptamer-modified multi-anodized anodized aluminum (Figure 5) [22]. First, the aptamer was attached onto porous anodized aluminum nanopores through covalent attachment. Subsequently, GO was supported on the surface of the porous anodized aluminum through the π–π stacking interaction between the aptamer and GO. By introducing negatively charged graphene oxide, as well as the aptamers, the nanochannels became more negatively charged. Meanwhile, the increase of negative charge of the nanochannels resulted in an increase of steric hindrance. These two effects led to a decrease in Fe(CN)63− through the nanochannel. When aflatoxin B1 was present, the aptamer formed a complex with aflatoxin B1, and the graphene oxide was then pulled away from the surface of the nanochannel. A decrease of the charge density and steric hindrance were, thus, observed leading to an increase in Fe(CN)63− in the nanochannel. Consequently, an increase in the current signal was observed. As shown in Figure 6B, the increased current signal had a good linear relationship with the concentration of aflatoxin B1 in the range of 1.0 × 10⁻⁶ –2.0 × 10⁻⁵ g·L−1. The probe had an excellent detection limit for aflatoxin B1, as low as 1.3 × 10⁻⁷ g·L−1. It can be seen from Figure 6C that the probe had good selectivity for aflatoxin B1. Therefore, the probe offers potential possibilities for simple, efficient, and highly sensitive detection of mycotoxins.
Zheng et al. developed a probe for the quantitation of AFB1, which employed aptamers as the recognition element, where telomerase and Exo III were used as signal enhancement elements [23]. Single-strand DNA, on the surface of gold nanoparticles, extended in the presence of telomerase. As a consequence, telomerase amplification expanded the signal response range of the electrochemical aptamer probes, which were used in the signal-off mode. The aptamer formed double-strand DNA upon the presence of AFB1. Subsequently, the DNA duplexes were cleaved by Exo III, through recycling digestion, and released, resulting in an enhanced signal. With two rounds of signal amplification, the electrochemical aptamer probe could be successfully applied to detect trace amounts of AFB1. The detection limit of this probe was as low as 6.0 × 10⁻¹⁵ g·L−1. Furthermore, the probe had excellent selectivity, due to its excellent binding ability with AFB1. The design-based dual-cycle amplification strategy greatly improved not only the detection range, but also the sensitivity of the probe. Compared to traditional methods, the probe exhibited a good sensitivity to AFB1. On the basis of dual-signal amplification strategies, the ultrasensitive detection of AFB, as well as other mycotoxins, can be achieved by changing the sequence of the aptamer.
An electrochemical aptasensor combined with horseradish peroxidase for sensing AFB1 was described by Peng et al. [24]. As shown in Figure 7, the aptasensor was comprised of two parts: A DNA tetrahedron, which was immobilized to the three-dimensional mesoporous structure of MoS2-AuNPs, as a recognition moiety; and horseradish peroxidase-modified Fe3O4, which was used as a signal amplification unit. The sensitivity, stability, and recognition efficiency of the probe could be improved through loading the DNA tetrahedron (containing the aptamer) onto the surface of 3DOM MoS2-AuNPs. When AFB1 was added, the aptamer on the DNA tetrahedron bound to AFB1 and detached from the electrode surface. DNA tetrahedra can hybridize to DNA helper strands (H1), which were modified on an HRP-modified AuNPs-SiO2@Fe3O4 nanospheres. A gradual increase of the current signal took place as the concentration of AFB1 increased. Under optimal conditions, the aptamer had excellent selectivity for AFB1. The current signal exhibited an excellent linear relationship with AFB1 concentration, ranging from 1.0 × 10⁻¹⁴ to 1.0 × 10⁻⁴ g·L−1. The detection limit for AFB1 was estimated to be 1.0 × 10⁻¹⁴ g·L−1. In addition, the aptasensor was utilized to detect AFB1 in not only rice, but also wheat powder, and the experimental results obtained were consistent with the results obtained by the standard HPLC–MS method.
Abnous et al. developed an electrochemical aptasensor and demonstrated that it could be applied to the detection of AFB1 (Figure 8) [25]. The probe consisted of a π-shape structure of aptamer–complementary strands complexes, which was used as double-layer physical barrier for the access of [Fe(CN)6]3−/4− to the surface of a gold electrode; furthermore, Exo I was used as a signal amplifier. The sensitivity of the probe was improved by the π-shape structure. The π-shape structure was intact in the absence of AFB1, and a weak current signal was observed. When AFB1 was present, the π-shape structure was disassembled and, therefore, a distinctive current signal was observed in the presence of Exo I. The current signal increased with increases in the AFB1 concentration, ranging from 7.0 × 10⁻⁹ to 5 × 10⁻⁷ g·L−1. The detection limit was estimated to be 2.0 × 10⁻⁹ g·L−1. The probe was successfully applied to detect AFB1 in spiked human serum, as well as in grape juice samples.
A large number of materials have been employed for electrochemical determination of AFB1, with high sensitivity as well as selectivity. For instance, Goud et al. devised an electrochemical aptasensor [26], which was composed of an aptamer labeled with methylene blue (MB), serving as a signal moiety, and functional grapheme oxide (FGO), acting as a signal amplifier. The FGO was not only used as a platform for the attachment of the aptamer, but was also employed as a signal amplifier, due to its catalytic property for MB. The plot of current signal versus analyte concentration showed excellent linearity, ranging from 5.0 × 10⁻⁸ to 6.0 × 10⁻⁶ g·L−1. The detection limit of the aptasensor was found to be 5.0 × 10⁻⁸ g·L−1. Significantly, the aptasensor was applied to detect the levels of AFB1 in alcoholic beverages.

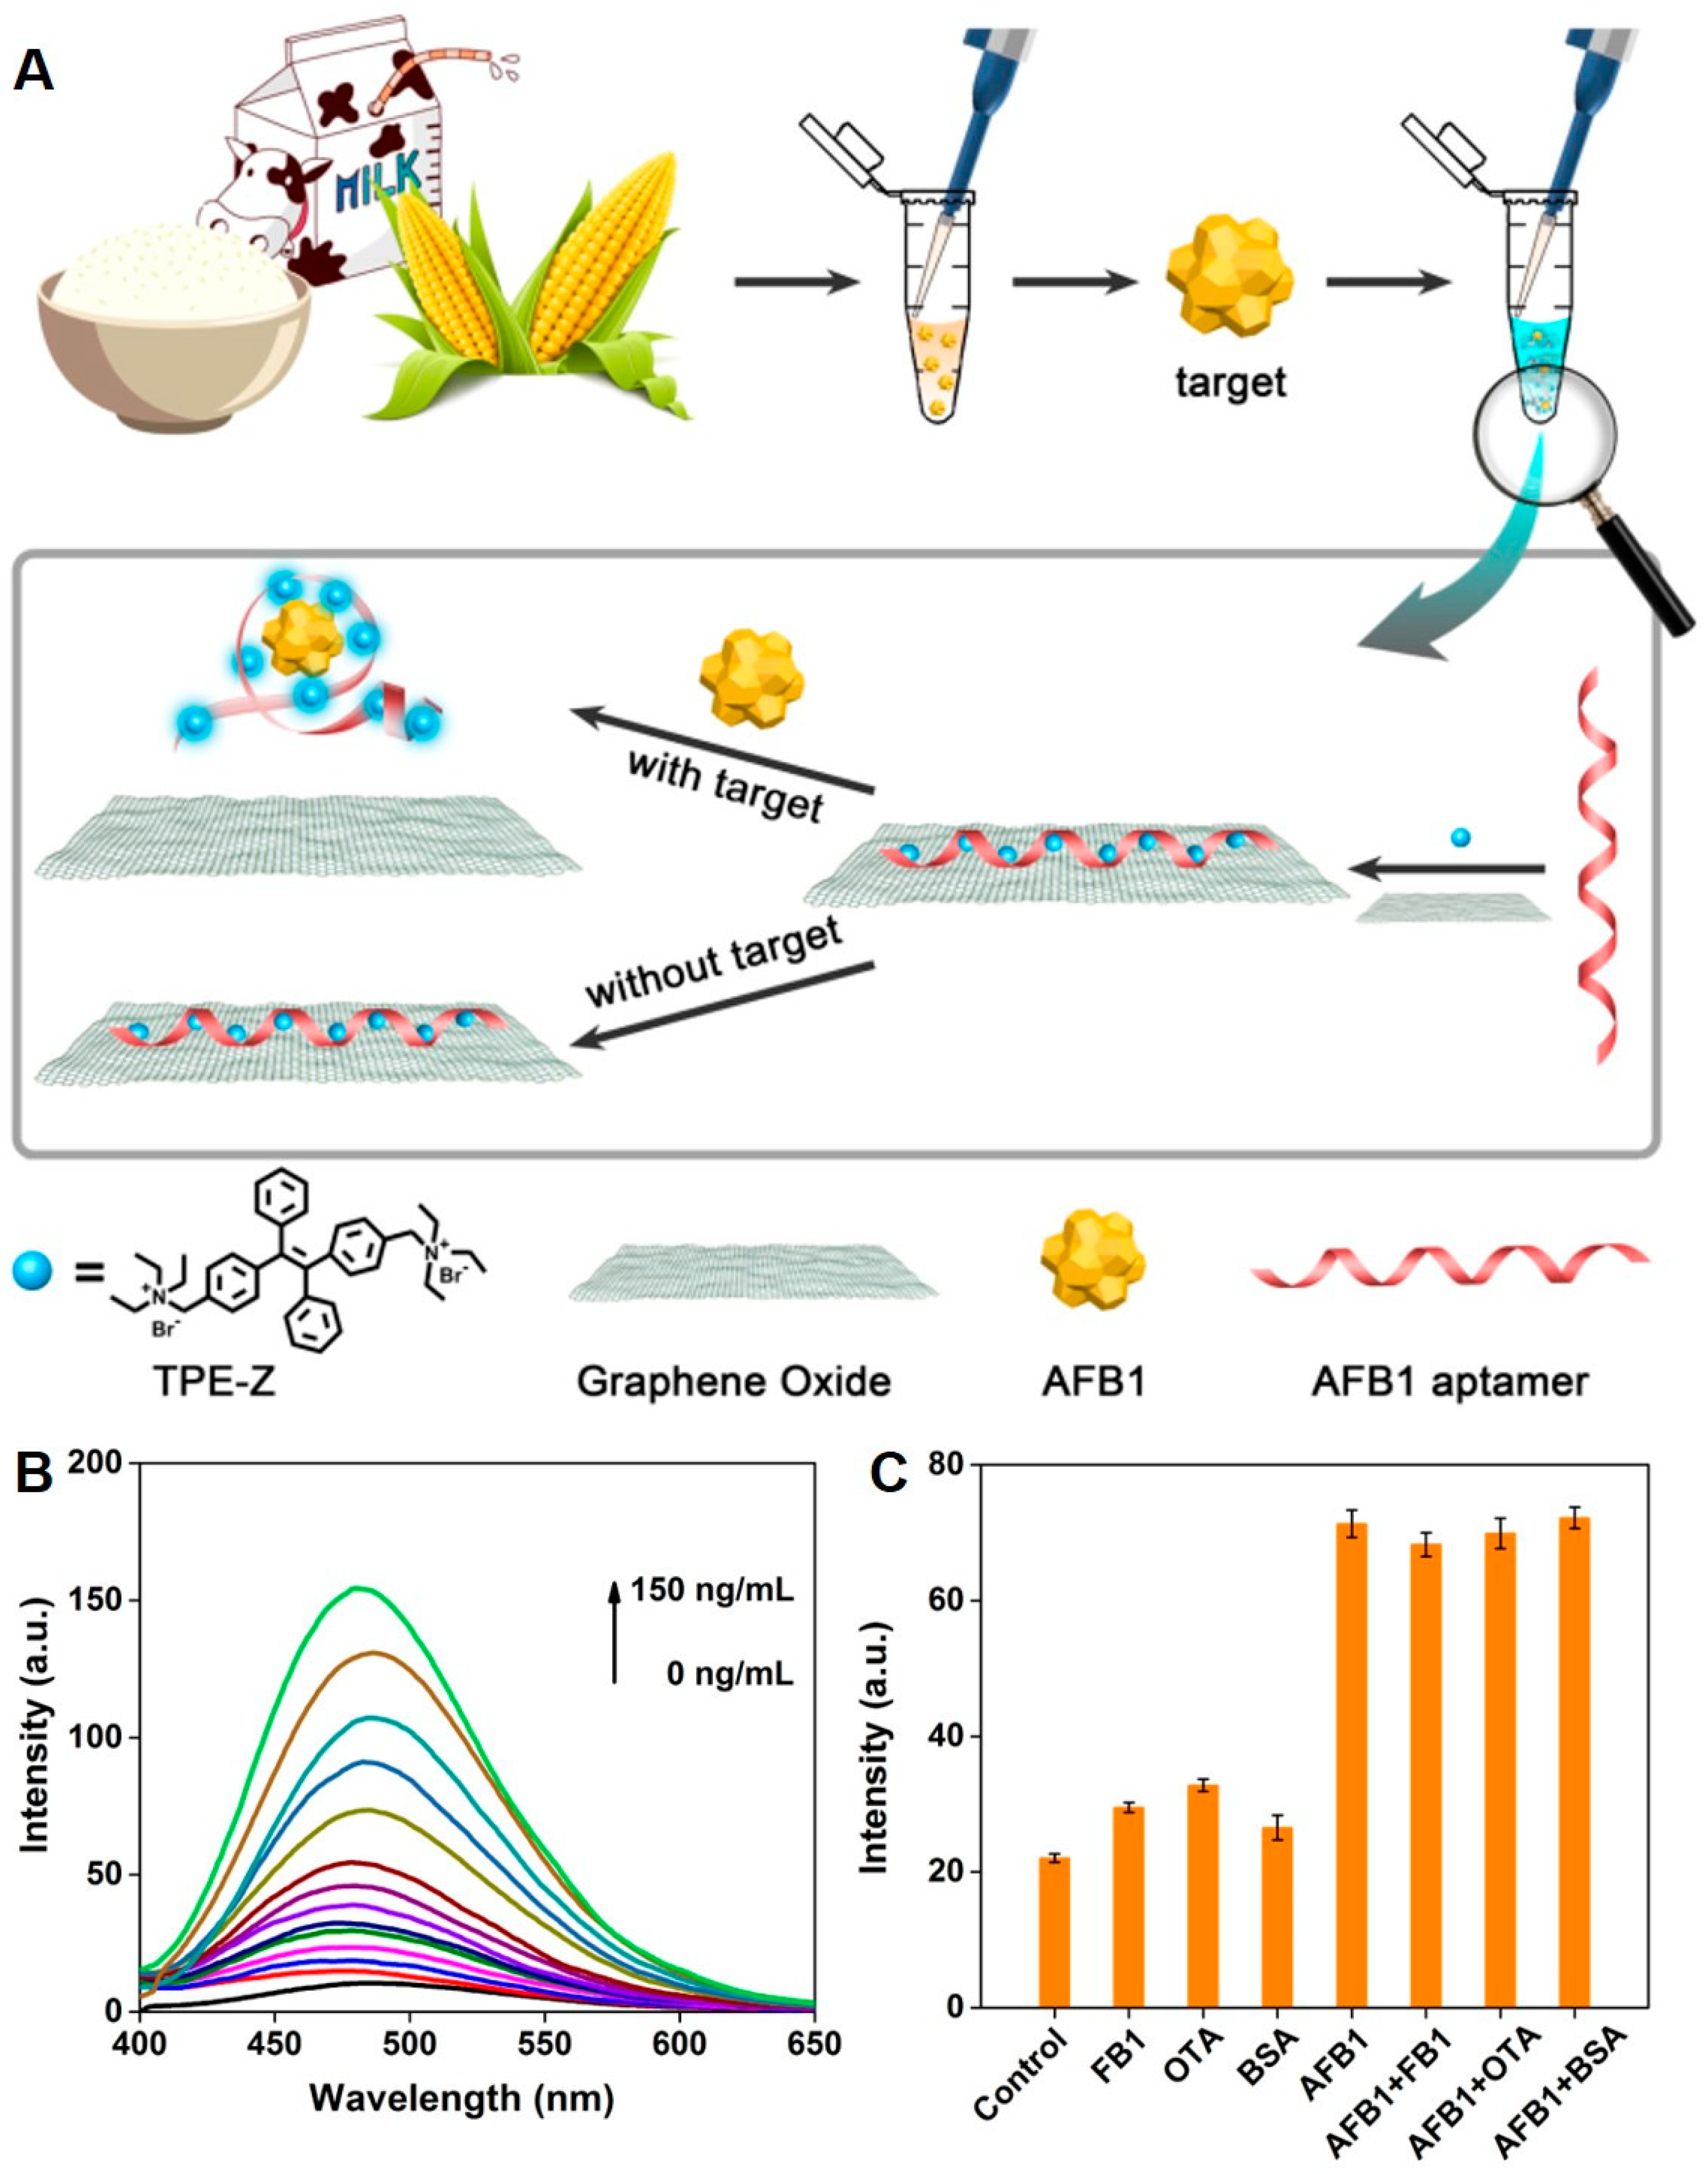
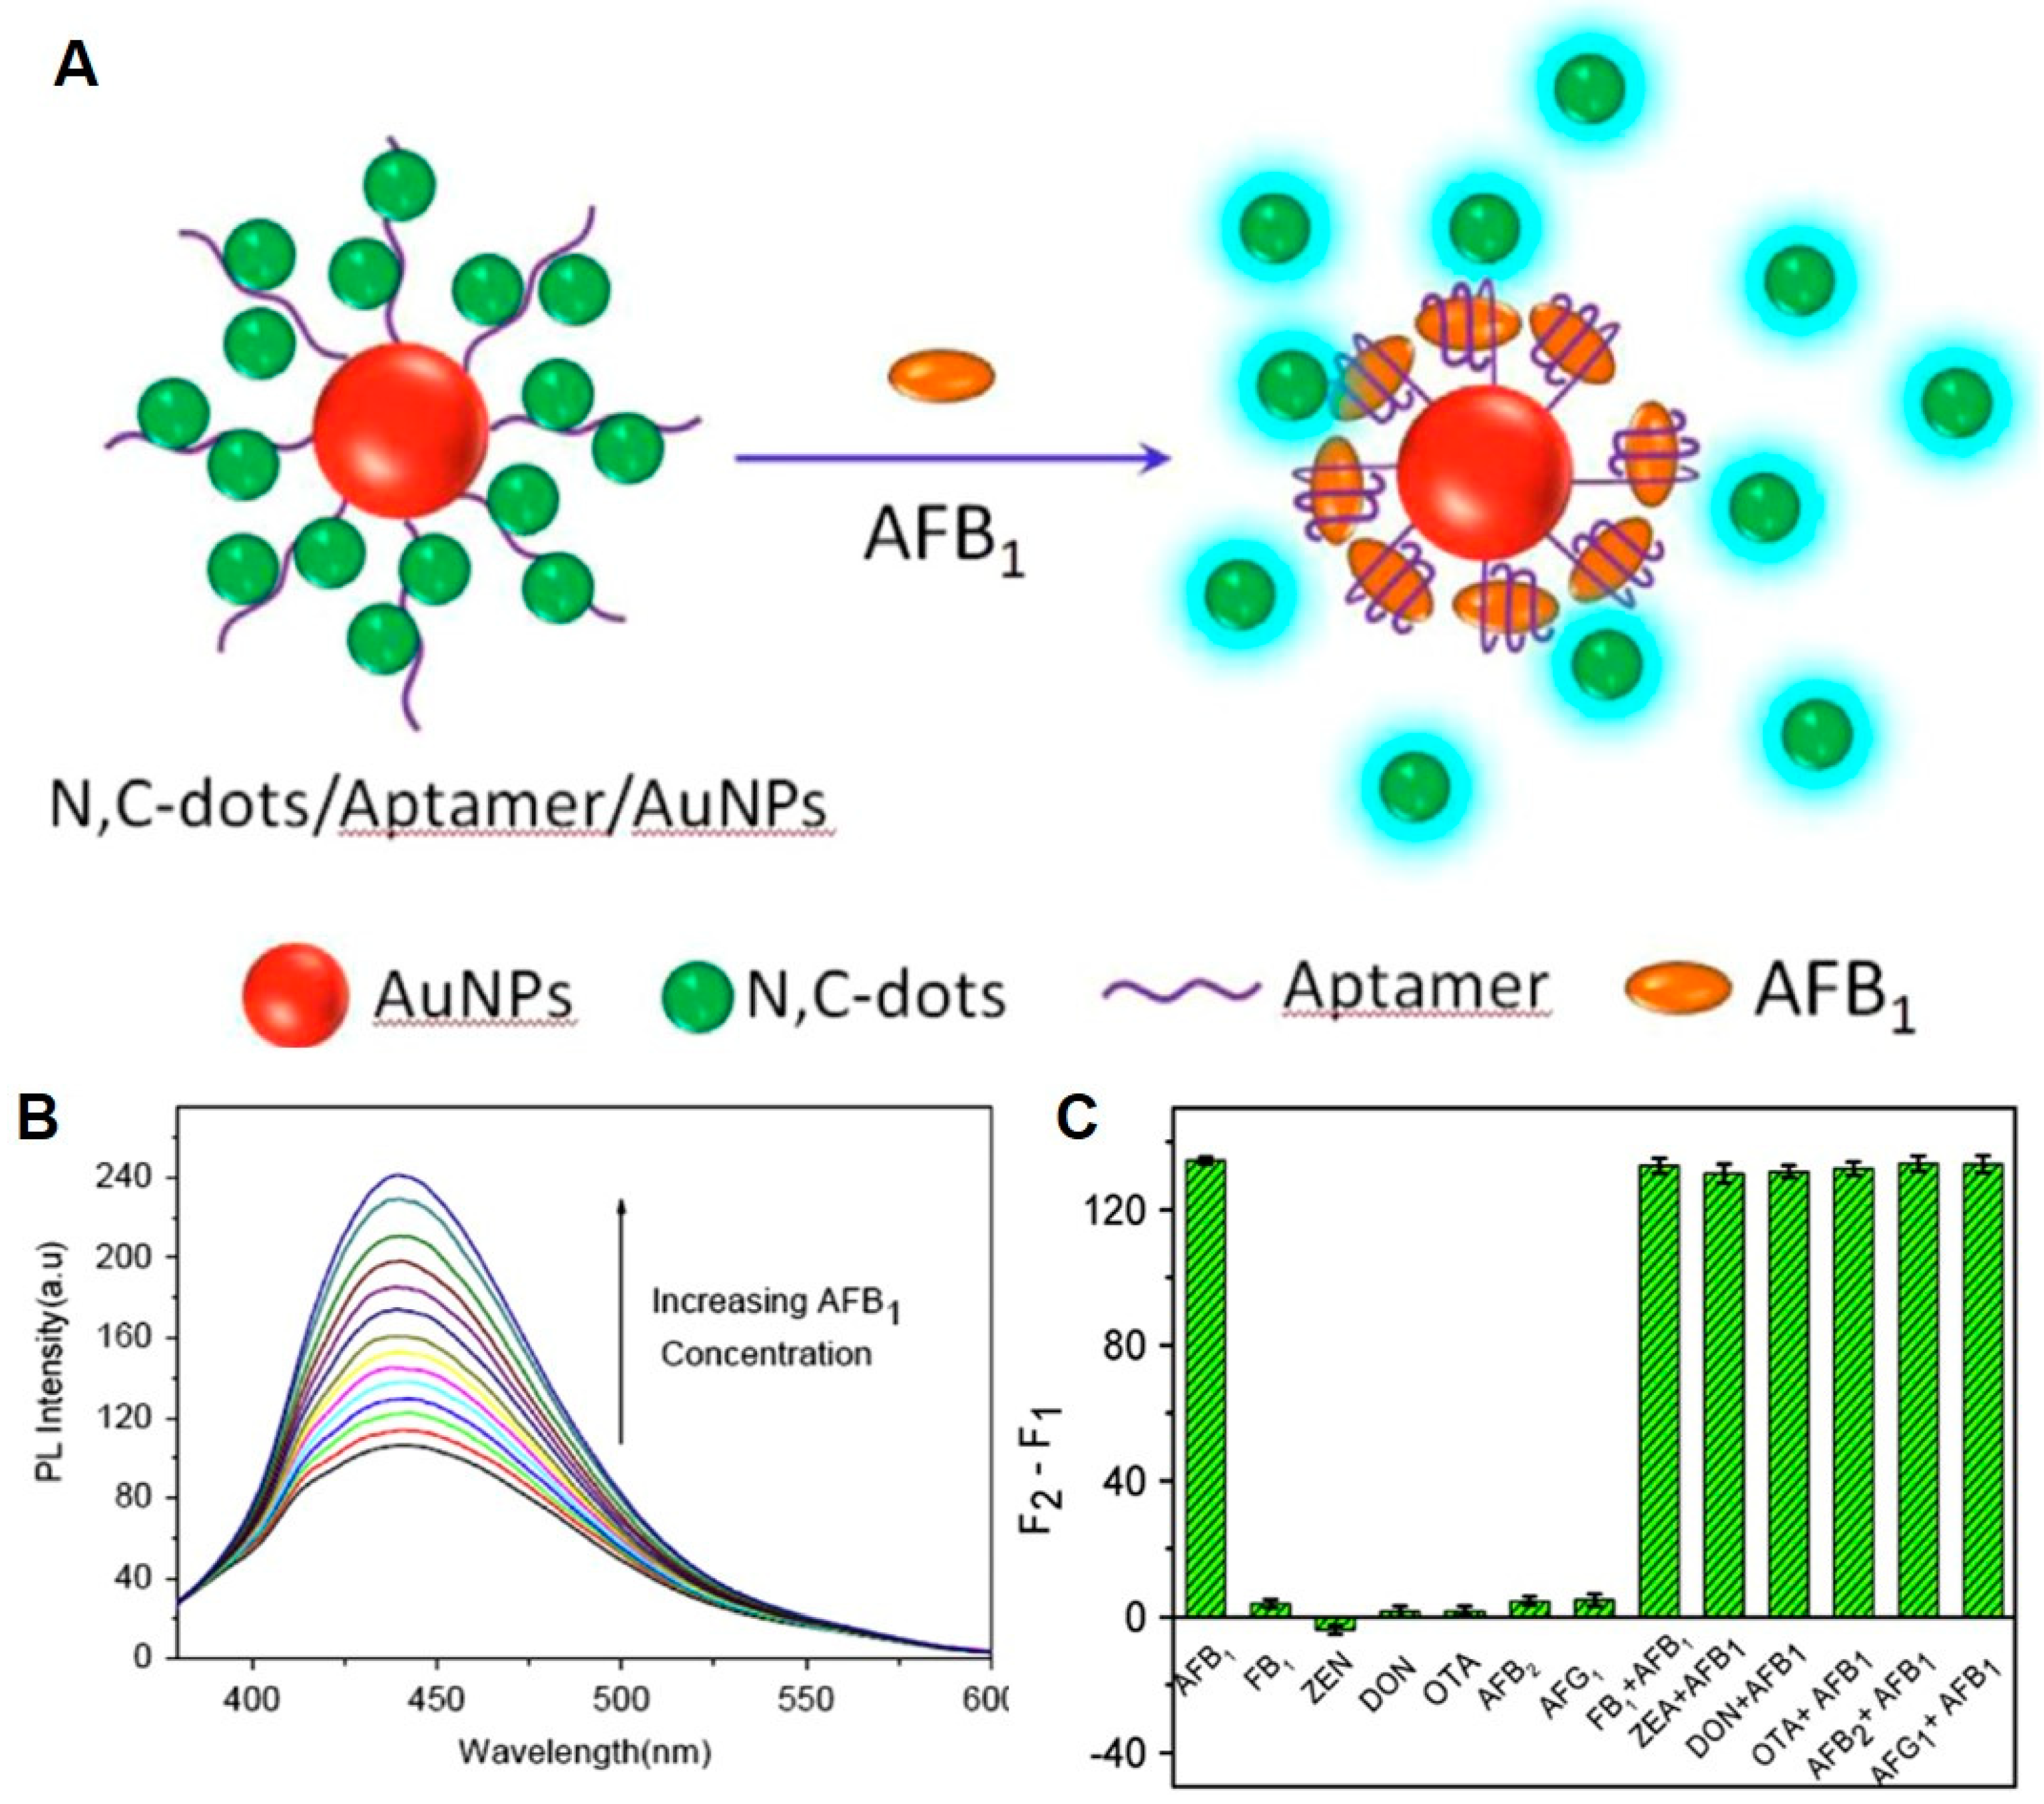
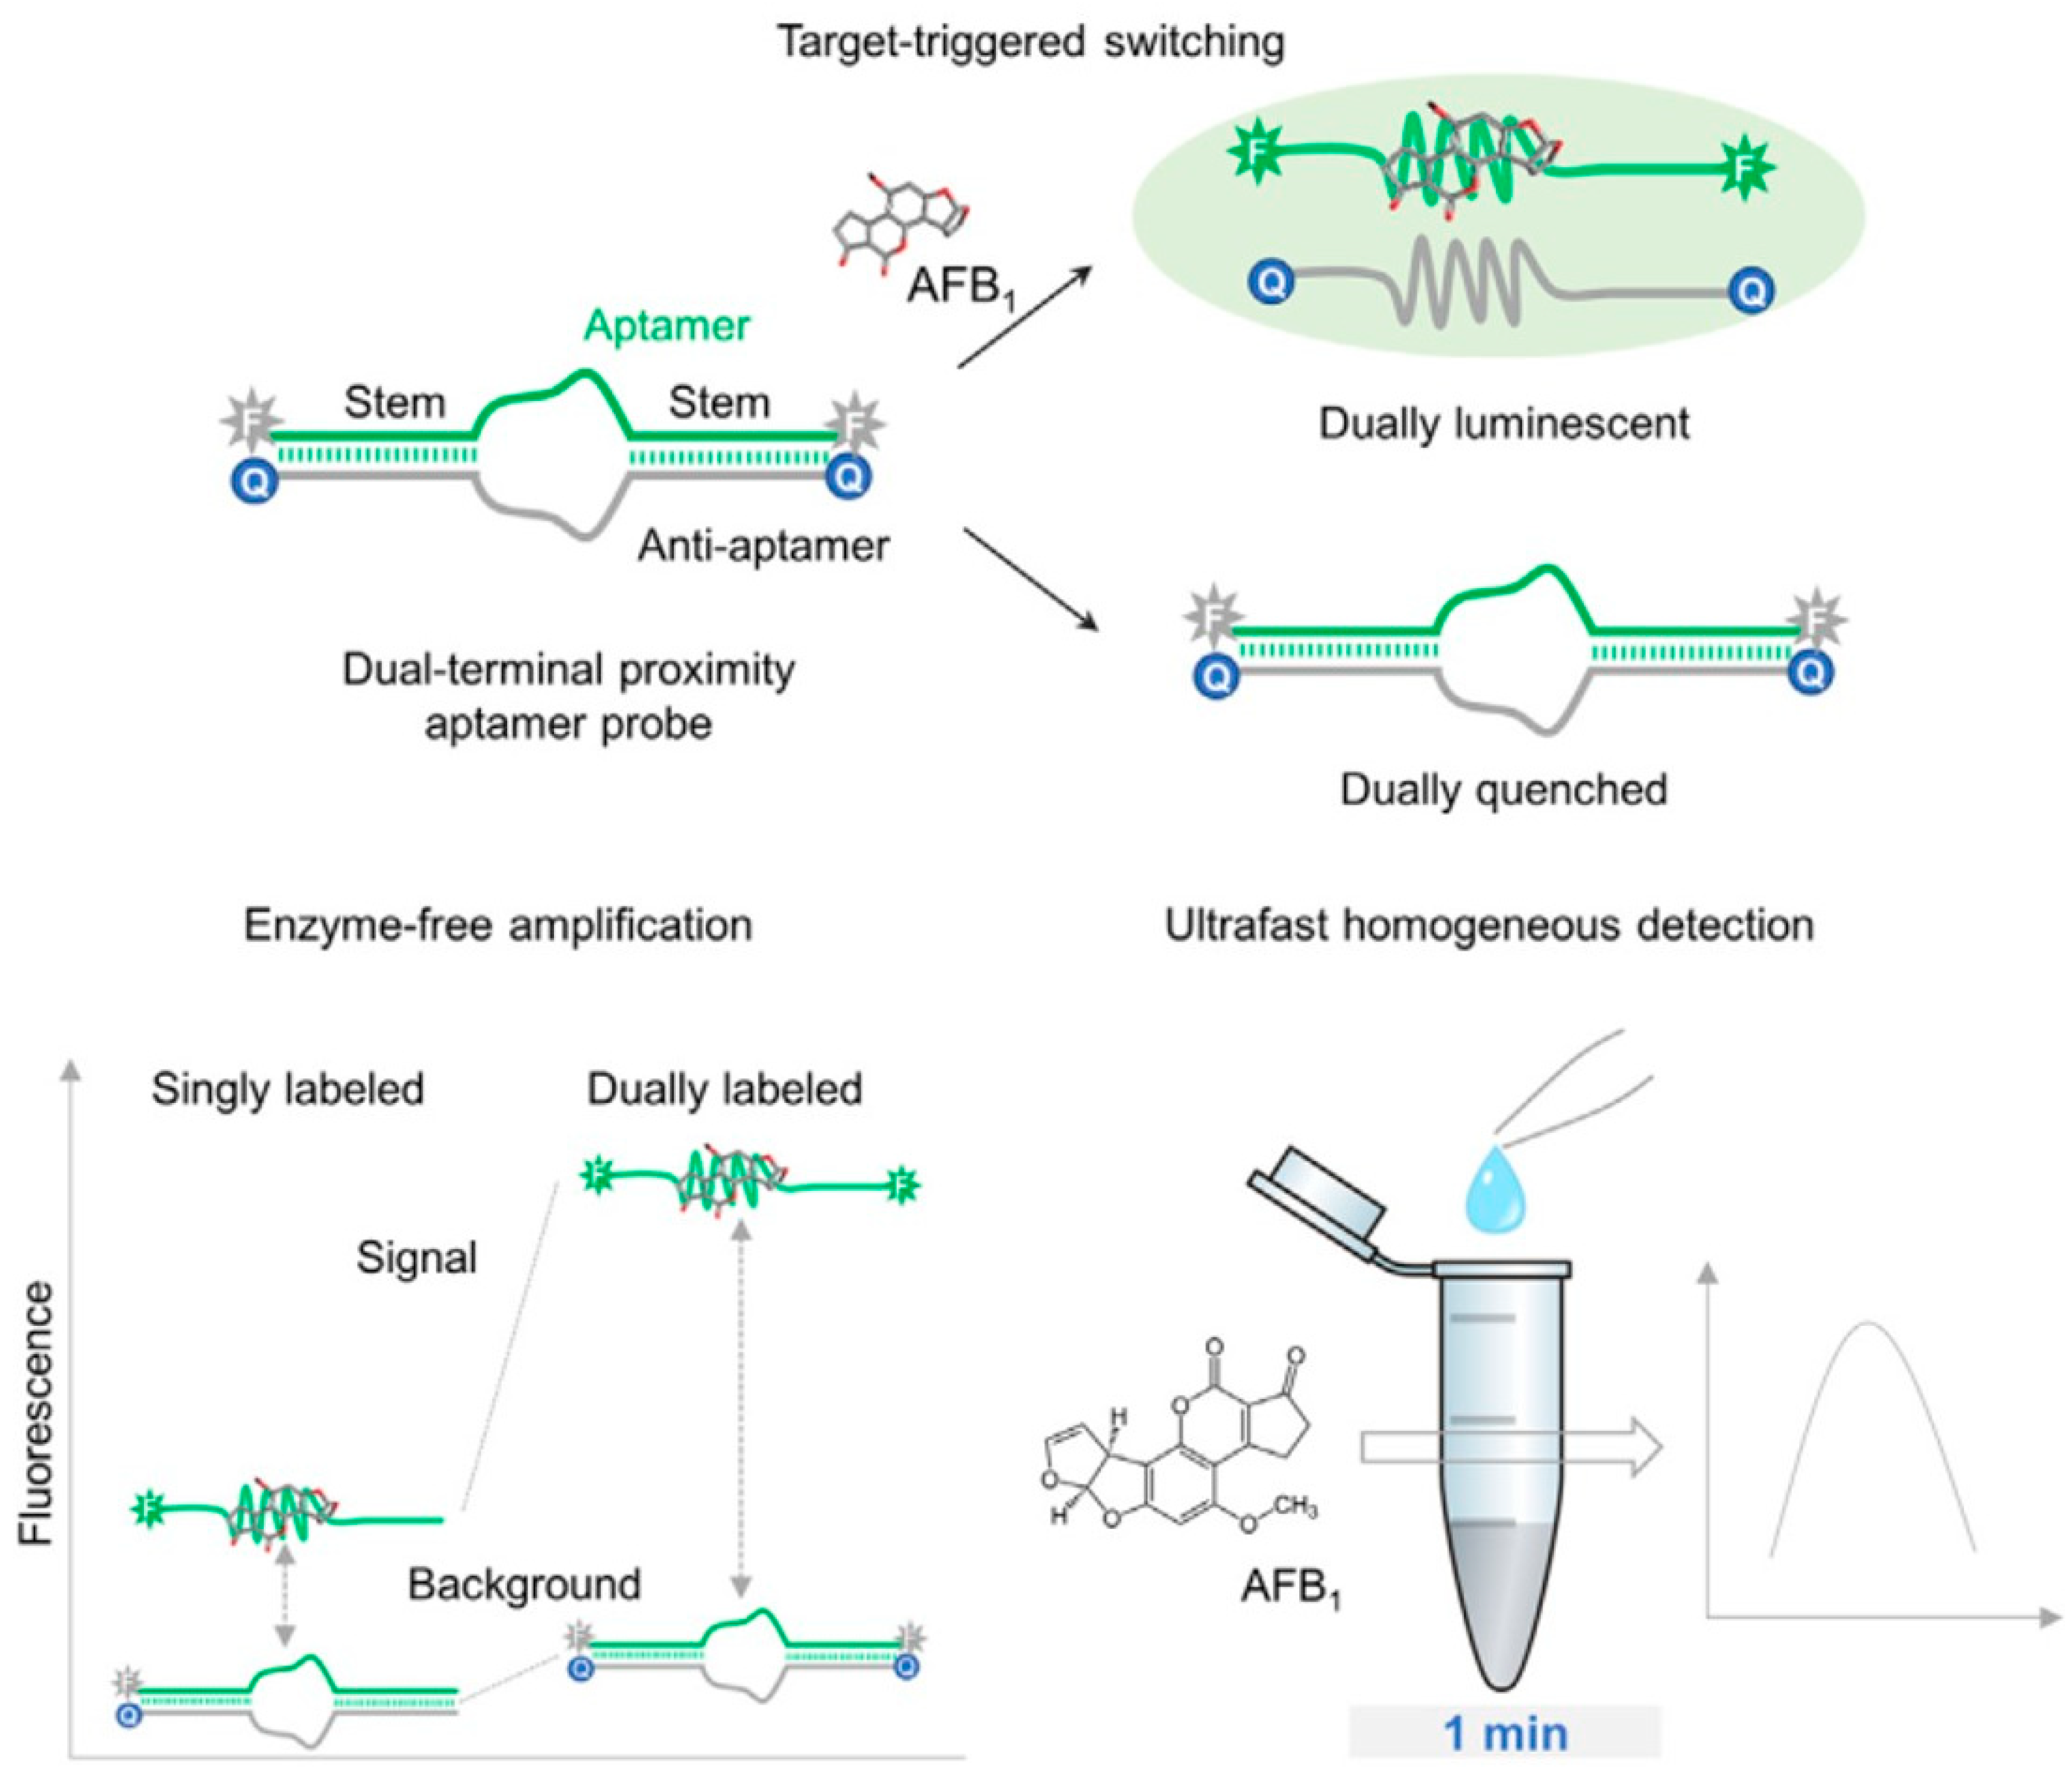
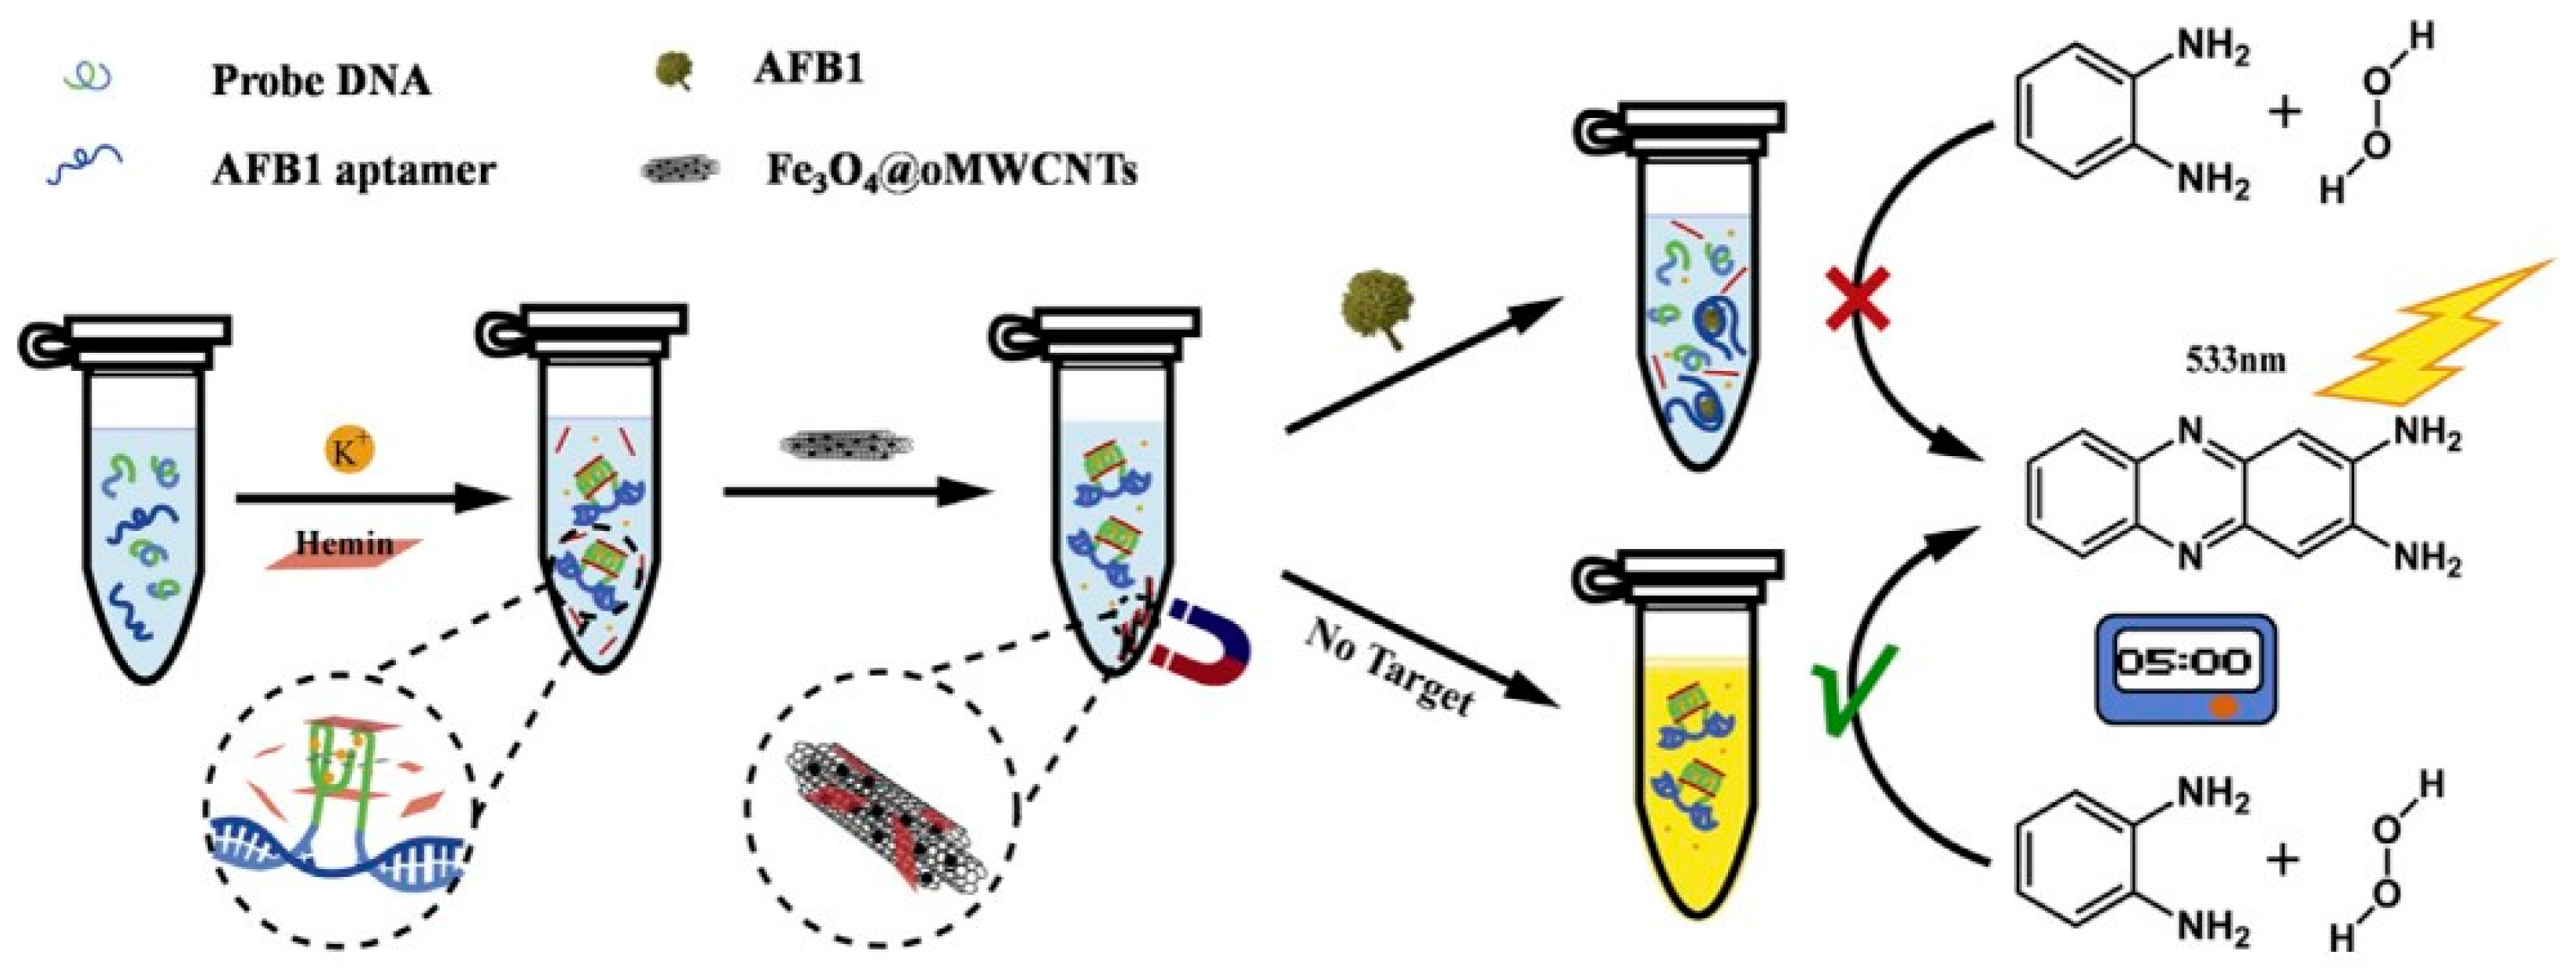
2.3. Fluorescent Aptamer Sensor for AFB1

Recently, we have developed a simple, rapid, and label-free method for the quantification of AFB1, by utilizing TPE-Z, graphene, and aptamers. Graphene oxide (GO) with high water resolvability served as a quencher and was employed to quench TPE-Z fluorescence (see Figure 9A) [27]. Additionally, GO could adsorb positively-charged TPE-Z molecules and aptamers by electrostatic and π–π interactions. As TPE-Z was positively charged, it had great dispersibility in aqueous media. Therefore, negligible fluorescence was observed, due to the dispersibility. In addition, graphene oxide could also quench the fluorescence of TPE-Z, minimizing the fluorescent background. Upon addition of AFB1, the aptamer bound to AFB1, rather than interacting with the graphene, resulting in the detachment of the aptamer and TPE-Z from the GO. As the positively charged TPE-Z could bind to the negatively charged aptamer through electrostatic interaction, the TPE-Z fluorescence was enhanced, due to the activation of an RIM process (Figure 9B). The approach simply mixed TPE-Z, GO, and the AFB1 aptamer for quantification of the analyte. The limit of detection for AFB1 was found to be 2.5 × 10⁻⁷ g·L−1, and a high selectivity toward AFB1 was shown (Figure 9C). This probe monitored AFB1 in actual samples, including corn, milk, and rice, with good selectivity.
Wang et al. fabricated a fluorescent light-up probe for the ultra-sensitive determination of AFB1. Carbon dots were prepared and an AFB1 aptamer was decorated onto gold nanoparticles (see Figure 10A) [28]. As the carbon dots were positively charged and the AFB1 aptamer-decorated gold nanoparticles were negatively charged, the carbon dots tended to assemble onto the gold nanoparticles through electrostatic interactions, forming a nanocomposite. As the gold nanoparticles were an excellent quencher, they could be used to quench the fluorescence of the carbon dots. When AFB1 was present, AFB1 bound to the aptamer on the gold nanoparticle, causing the carbon dots to be released. As shown in Figure 10B, a gradual increase of fluorescence intensity was observed as the concentration of the target increased. Furthermore, on account of the good selectivity of the aptamer toward AFB1, the probe, thus, had the advantage of high selectivity (Figure 10C). The probe displayed a good linear relationship from 5.0 × 10⁻⁹ to 2.0 × 10⁻⁶ g·L−1. The detection limit of the probe was 5.0 × 10⁻⁹ g·L−1.
An enzyme-free, amplified, and ultra-fast aptasentor capable of one-test-tube homogeneous determination of aflatoxin B1 (AFB1) has been developed by Xia et al. (see Figure 11) [29]. As the aptasensor was designed with a dual-terminal proximity structure, one molecule was capable of switching up to two fluorophores. As a consequence, the signal was amplified without using enzymes. Additionally, the signal–noise ratio and sensitivity toward AFB1 were improved by taking advantage of the above strategy. The aptasensor could be applied for rapidly testing for the presence of AFB1, concluding within 1 min. On account of the universality and simplicity of the aptasensor, it demonstrated great potential for AFB1 determination in food safety.
Wang et al. reported a fluorescent aptasensor to monitor the level of AFB1 by taking advantage of the peroxidase-like properties of DNAzymes (Figure 12) [30]. When hemin and K+ were present, two probe DNAs partially hybridized with the aptamer to form a G-quadruplex. This complex was capable of catalyzing the formation of fluorescent 2, 3-diaminophenazine (DAP) from phenylenediamine. Free hemin in the aqueous media could be adsorbed and then magnetically separated through magnetic multiwall carbon nanotubes. When AFB1 was present, the aptamer bound to the AFB1, causing the separation of the two probe DNAs. With the decrease of the catalytic ability of the DNAzymes, the fluorescence of DAP decreased. The aptasensor achieved a limit of detection of 2.0 × 10⁻⁸ g·L−1, indicating high sensitivity toward AFB1. Compared with other strategies, the aptasensor was more selective for the determination of AFB1 and could be applied to detecting AFB1 in food.
Combination of other fluoregens with aptamers has been considered to be an effective strategy for detection of AFB1. For instance, Lu and Wang devised an aptasensor on the basis of aptamer-functionalized CdZnTe QDs and complementary strand-modified Au nanoparticles (AuNPs) [31]. The performance of the aptasensor for detecting AFB1 was observed to be linear, ranging from 5.0 × 10⁻⁸ to 1.0 × 10⁻⁴ g·L−1, with a low detection limit of 2.0 × 10⁻⁸ g·L−1.

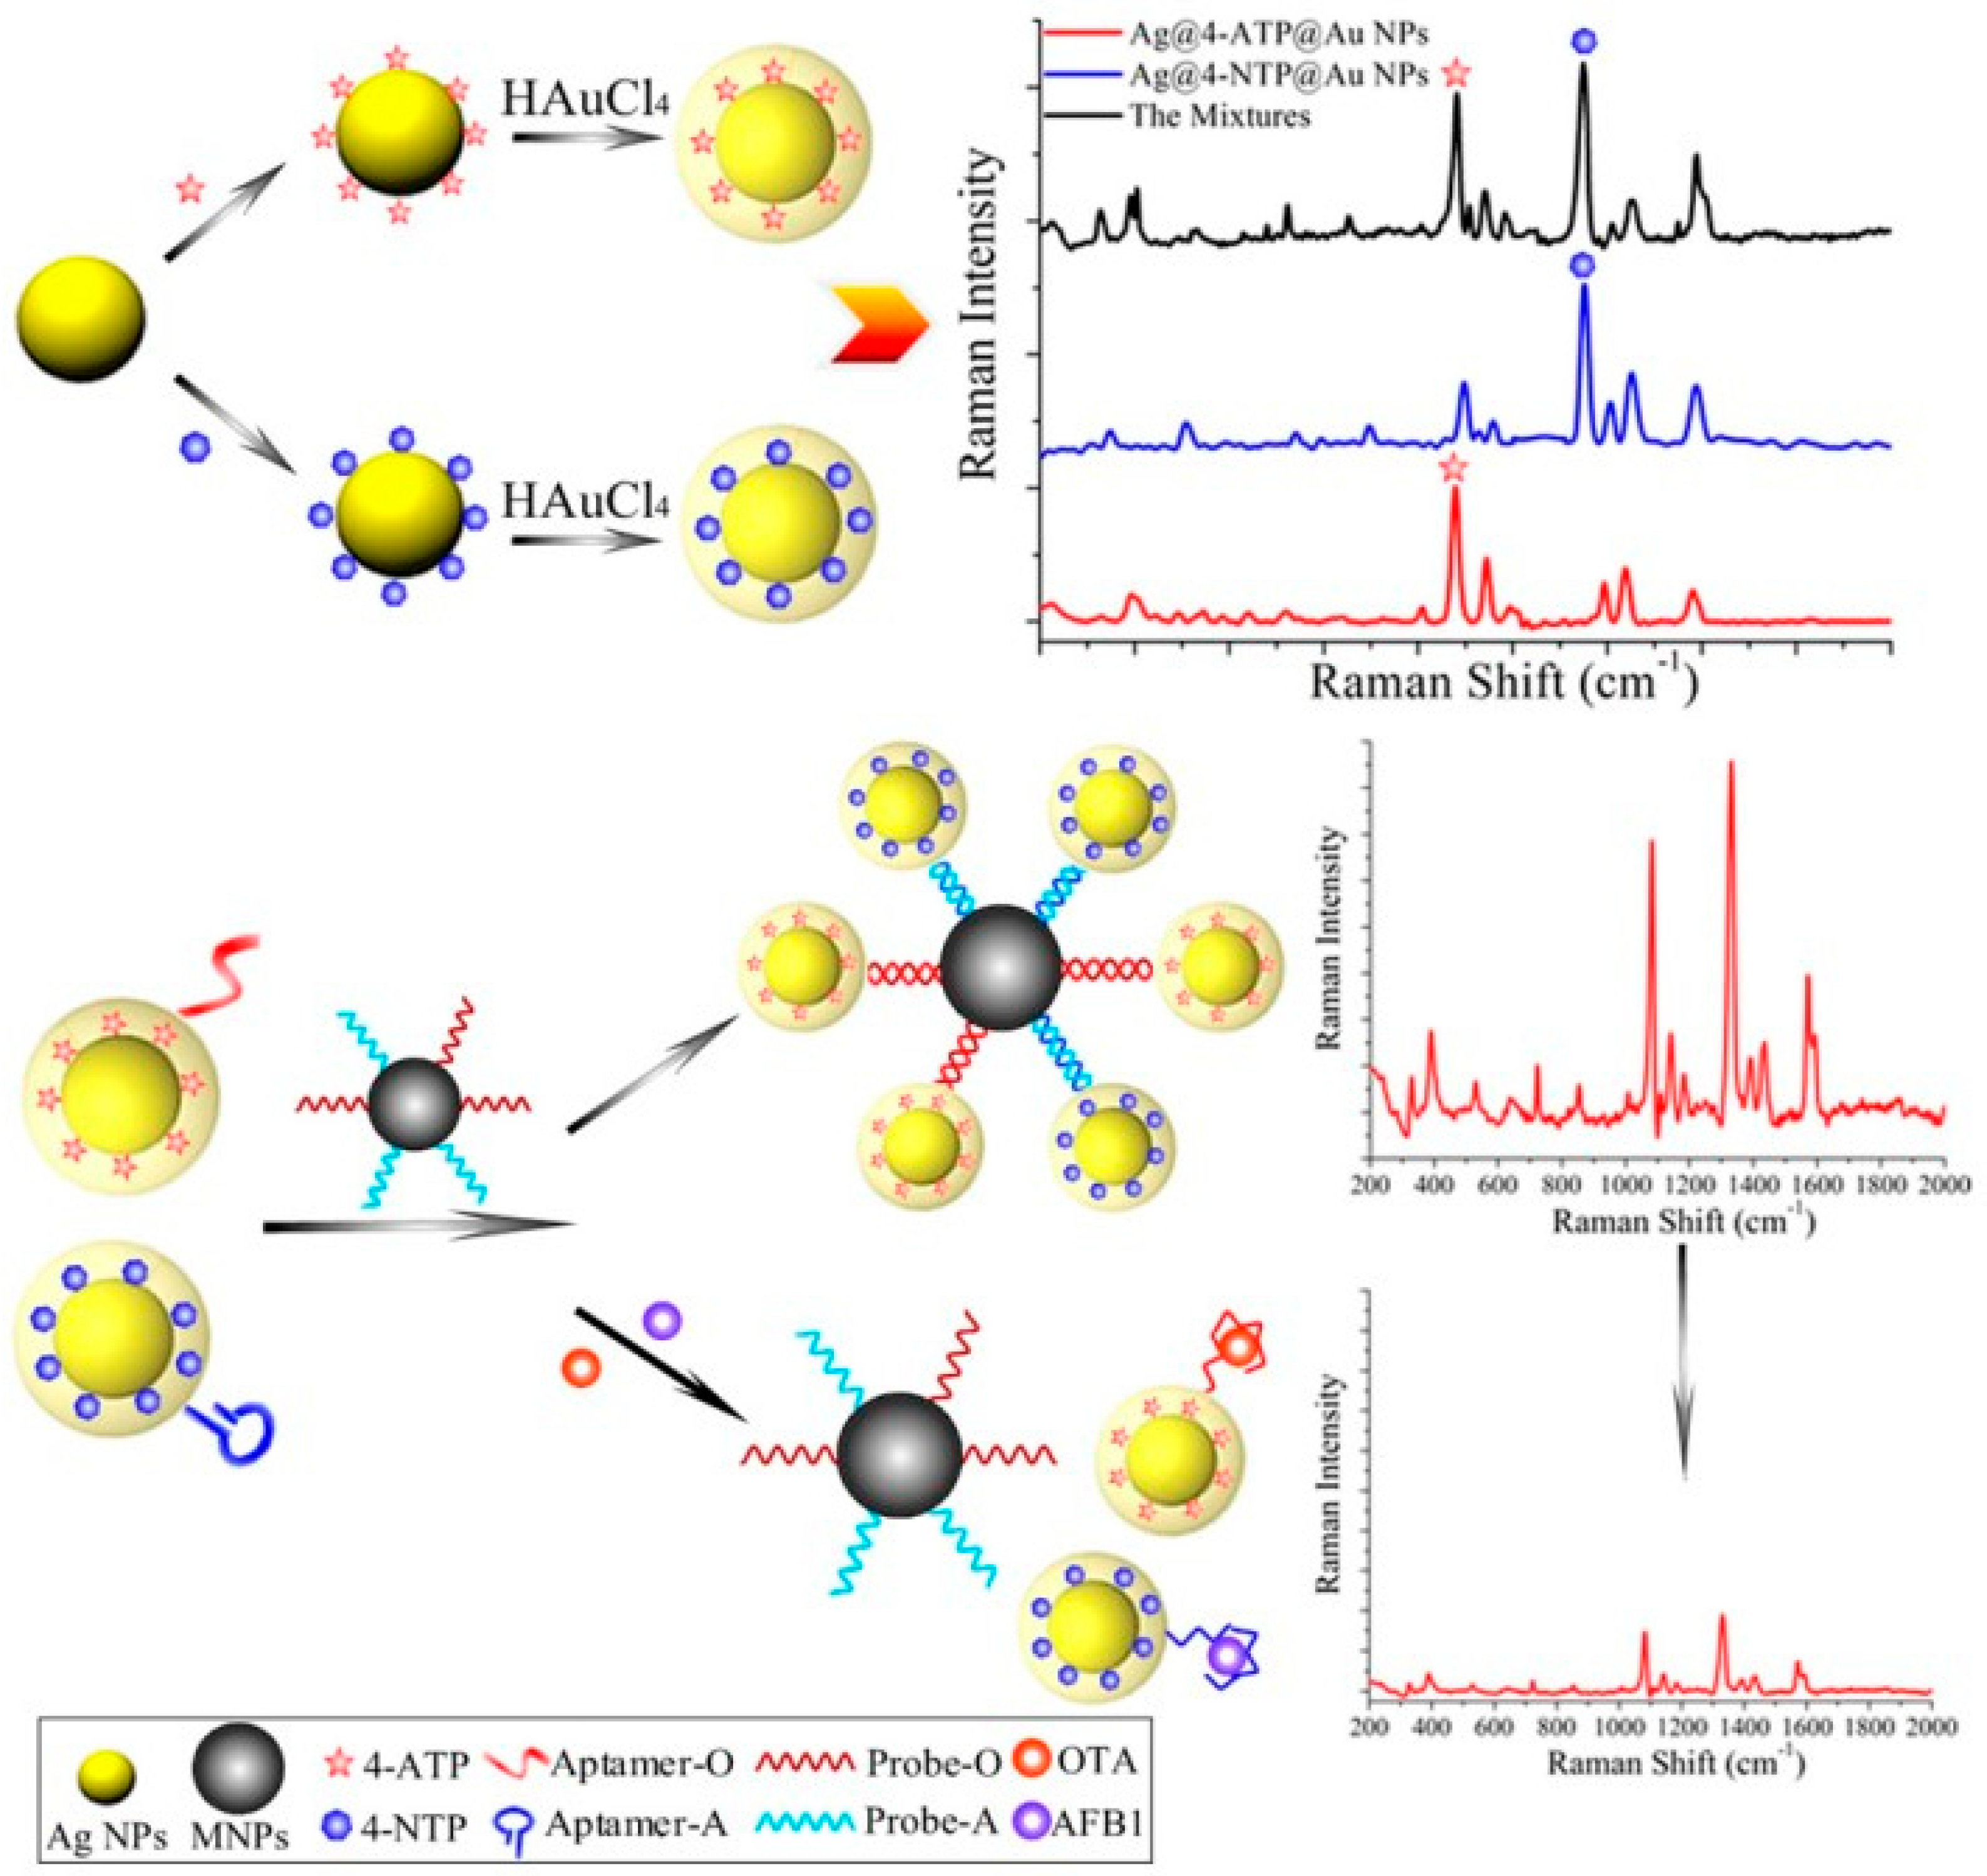
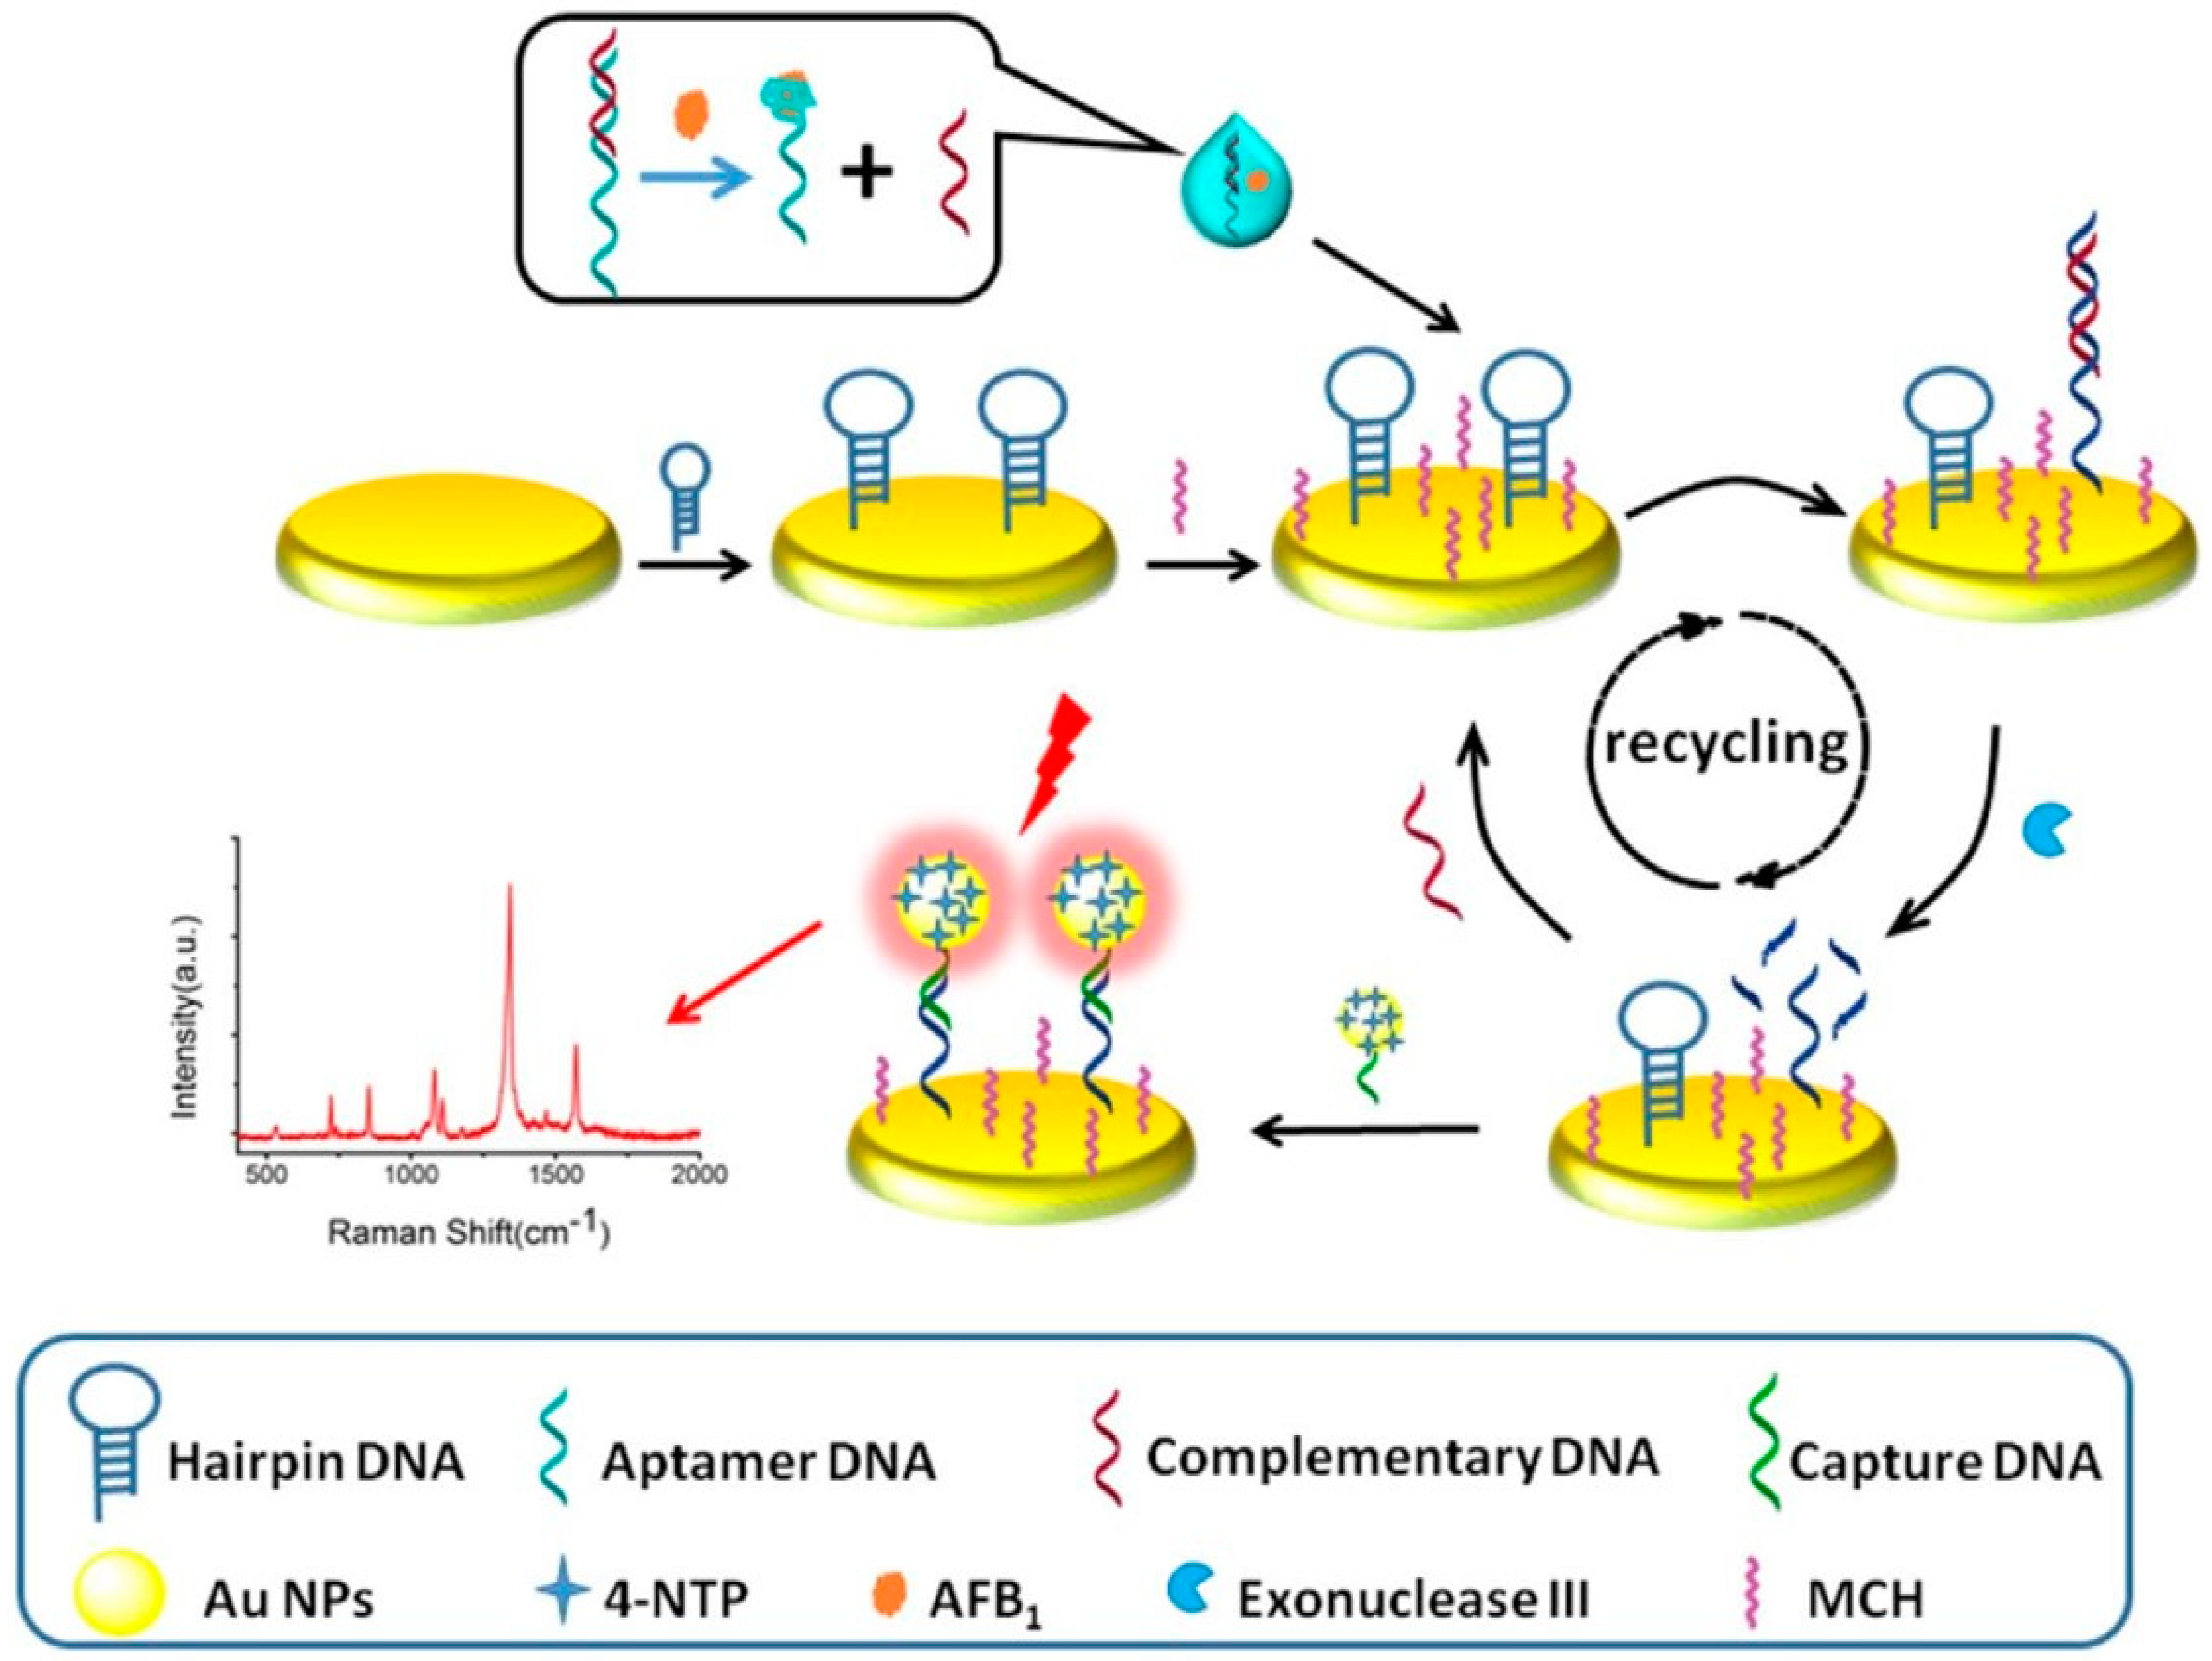
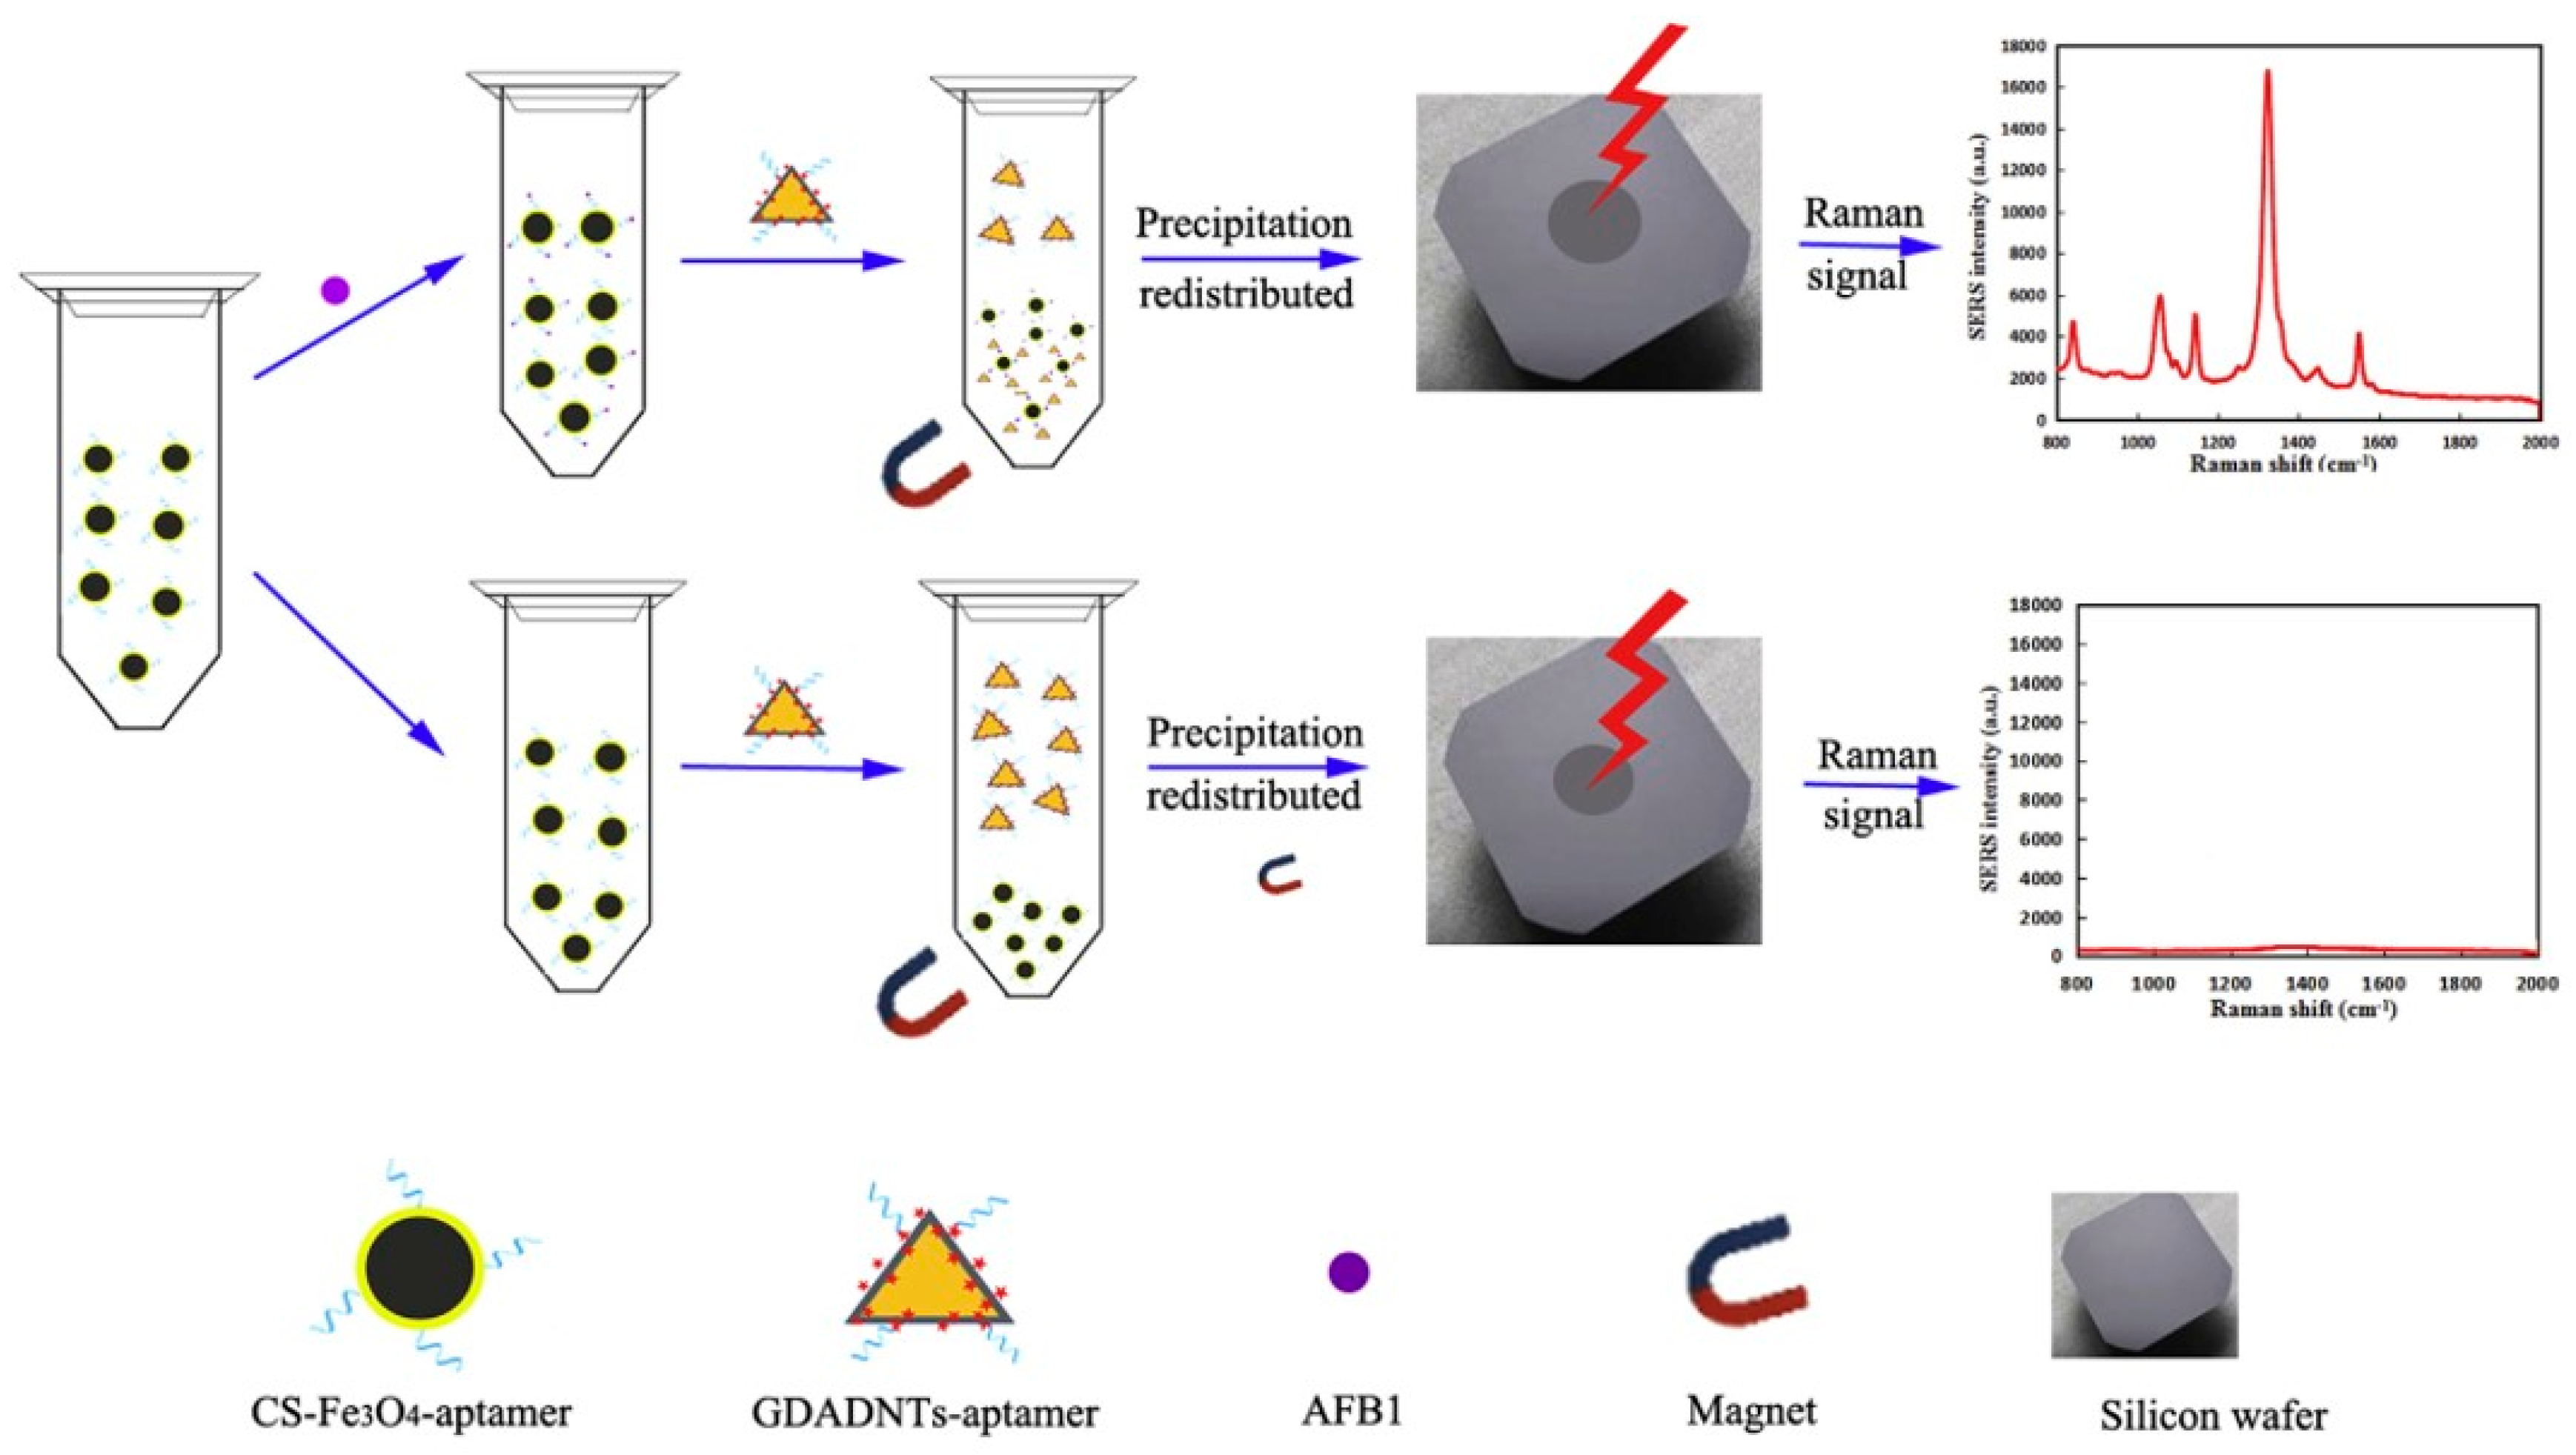
2.4. SERS Aptamer Sensor for AFB1

A SERS aptamer sensor with high sensitivity was devised by Zhao et al. for the simultaneous determination of AFB1, as well as ochratoxin [32]. As shown in Figure 13, Ag@Au core-shell (CS) nanoparticles (NPs), which were used as signal reporters, were fabricated by the embedding of 4-NTP or 4-ATP. Subsequently, Ag@4-NTP@Au NPs, as well as Ag@4-ATP@Au CS NPs, were modified with aptamer AFB1 and aptamer OTA, respectively. In the absence of the analytes, several SERS aptasensors could be captured by MNPs, which were modified with complementary strands of the aptamers, leading to the formation of SERS-active MNP-Ag@Au CS-NP core-satellite assemblies. When the analytes were present, not only AFB1, but also OTA, could bind to the aptamer, leading to the separation of Ag@Au CS-NPs from the MNPs. Consequently, the SERS signal gradually decreased with an increase in concentration of the targets. The SERS aptasensor could be used to detect double mycotoxins, including OTA and AFB1, in maize meal. A good linearity was found to exist in the plot of SERS signal versus AFB1 and OTA concentrations. The limits of detection toward AFB1 and OTA were found to be 3.0 × 10⁻⁸ g·L−1 as well as 6 × 10⁻¹⁰ g·L−1 and 6 pg·mL−1, respectively. The proposed strategy could be extended to various SERS tags for the determination of multiple targets with various lengths of aptamers.
Li et al. developed a SERS aptasensor for the detection of AFB1, on the basis of exonuclease-aided recycling amplification (Figure 14) [33]. A hairpin was attached onto the surface of a gold film. Upon addition to AFB1, the aptamer was capable of binding to AFB1, resulting in the release of DNA which was partially complementary to the AFB1 aptamer. The released DNA could hybridize with the hairpin to form a DNA duplex. The DNA duplex could be degraded in the presence of Exo III, resulting in the presence of single-strand DNA, which was employed to capture Raman tags. Furthermore, many single-strand DNA were generated using the Exo III-aided target amplification strategy. Subsequently, many Raman probes were able to immobilize on the surface of gold film. The SERS signal was observed to be linear, ranging from 1.0 × 10⁻¹² to 1.0 × 10⁻⁶ g·L−1, and the detection limit was as low as 4.0 × 10⁻¹³ g·L−1. The rapid, simple, and low-cost strategy was applied for the detection of AFB1 in spiked peanut samples.
Li et al. devised a SERS probe on the basis of gold nano-star (Au NS) core–silver nanoparticle (Ag NP) satellites for the determination of AFB1 [34]. The probe was comprised of AFB1-functionalized Ag satellites, as well as a complementary DNA-functionalized Au NS core. The intensity of SERS increased when the satellite was bound to the Au NS core. In the presence of AFB1, the AFB1 aptamer on the surface of the Ag satellites was capable of binding to the target. Subsequently, the Ag satellites moved away from the Au NS core, leading to a decrease of the SERS signal. A good linear relationship was found to exist in the range of 1.0 × 10⁻⁹ to 1.0×10⁻⁶ g·L−1. The detection limit of the SERS probe was found to be 4.8 × 10⁻¹⁰ g·L−1. The SERS probe was used to detect AFB1 in food.
Yang et al. constructed a SERS aptasensor for the determination of AFB1 by utilizing gold nano-triangles (GNTs) and DTNB@Ag-DTNB nano-triangles (GDADNTs) acting as the SERS substrate (Figure 15) [35]. The AFB1 aptamer was modified on the surface of a magnetic bead, which served as the capture sensor. The GDADNTs were modified with the aptamer, which was employed as the signal reporter. In the absence of AFB1, the GDADNTs were not able to assemble with the capture sensor, leading to no SERS signal in the precipitate after magnetic separation. Nevertheless, the signal reporter, as well as the capture sensor, were capable of assembling in the presence of AFB1, resulting in an increase of the SERS signal in the precipitate. An excellent linearity toward AFB1 was found in the range from 1.0 × 10⁻⁹ to 1.0×10⁻⁵ g·L−1. The limit of detection of the SERS aptasensor was estimated to be 5.4 × 10⁻¹⁰ g L−1, indicating excellent sensitivity of the sensor for AFB1. Therefore, the proposed aptasensor provided great potential for the quantification of other mycotoxins.

3. Conclusions

A variety of classical strategies have been employed for the detection of AFB1; however, their drawbacks, including time consumption, expensive equipment, and low portability, have limited their further use. On account of the high selectivity of aptamers toward specific targets, aptamers can be used to replace antibodies for the quantification of analytes. In this review, we described various aptamer probes for the detection of AFB1. As listed in Table 1, the probes consist of colorimetric, electrochemical, and fluorescent methods. The probes utilize colorimetric, electrochemical, and fluorescent methods. Although great breakthroughs have been made, the stability of aptamer probes should be improved by the modification of DNA. Moreover, aptamer probes associated with signal amplification strategies can be employed to improve the sensitivity of the probe.

Author Contributions

Conceptualization, Y.J. and G.Z.; methodology, P.L.; writing—original draft preparation, Y.J. and Z.L.; writing—review and editing, Y.J.; visualization, B.Y.

Funding

This research was funded by the National Natural Science Foundation of China (21705071, 21605074, 21805125), the Natural Science Foundation of Guangdong province of China (2016A030310362, 2014A030310274, 2017A030310604, 2018A030313101), the Initiatory Financial Support from Lingnan Normal University (ZL1611) and the Research Group of Rare Earth Resource Exploiting and Luminescent Materials (2017KCXTD022).

Acknowledgments

The authors gratefully acknowledge the support of Zongcai Feng during the preparation of the literature.

Conflicts of Interest

The authors declare no conflict of interest.

References

  1. Robbins, C.A.; Swenson, L.J.; Nealley, M.L.; Kelman, B.J.; Gots, R.E. Health effects of mycotoxins in indoor air: A critical review. Appl. Occup. Environ. Hyg. 2000, 15, 773–784. [Google Scholar] [CrossRef] [PubMed]
  2. Hussein, H.S.; Brasel, J.M. Toxicity, metabolism, and impact of mycotoxins on humans and animals. Toxicology 2001, 167, 101–134. [Google Scholar] [CrossRef]
  3. Chauhan, R.; Singh, J.; Sachdev, T.; Basu, T.; Malhotra, B. Recent advances in mycotoxins detection. Biosens. Bioelectron. 2016, 81, 532–545. [Google Scholar] [CrossRef] [PubMed]
  4. Pietri, A.; Fortunati, P.; Mulazzi, A.; Bertuzzi, T. Enzyme-assisted extraction for the HPLC determination of aflatoxin M1 in cheese. Food Chem. 2016, 192, 235–241. [Google Scholar] [CrossRef] [PubMed]
  5. Mishra, N.; TandonnVL, D.K.; Khandia, R.; Munjal, A. Does Bougainvillea spectabilis protect swiss albino mice from aflatoxin-induced hepa-totoxicity. Adv. Anim. Vet. Sci. 2016, 4, 250–257. [Google Scholar] [CrossRef]
  6. Huertas-Pérez, J.F.; Arroyo-Manzanares, N.; Hitzler, D.; Castro-Guerrero, F.G.; Gámiz-Gracia, L.; García-Campaña, A.M. Simple determination of aflatoxins in rice by ultra-high performance liquid chromatography coupled to chemical post-column derivatization and fluorescence detection. Food Chem. 2018, 245, 189–195. [Google Scholar] [CrossRef] [PubMed]
  7. Zhao, J.; Zhu, Y.; Jiao, Y.; Ning, J.; Yang, Y. Ionic-liquid-based dispersive liquid–liquid microextraction combined with magnetic solid-phase extraction for the determination of aflatoxins B1, B2, G1, and G2 in animal feeds by high-performance liquid chromatography with fluorescence detection. J. Sep. Sci. 2016, 39, 3789–3797. [Google Scholar] [CrossRef]
  8. Di Gregorio, M.C.; Jager, A.V.; Costa, A.A.; Bordin, K.; Rottinhghaus, G.E.; Petta, T.; Souto, P.C.; Budiño, F.E.; Oliveira, C.A. Determination of aflatoxin B1-lysine in pig serum and plasma by liquid chromatography–tandem mass spectrometry. J. Anal. Toxicol. 2017, 41, 236–241. [Google Scholar] [CrossRef]
  9. Miró-Abella, E.; Herrero, P.; Canela, N.; Arola, L.; Borrull, F.; Ras, R.; Fontanals, N. Determination of mycotoxins in plant-based beverages using QuEChERS and liquid chromatography–tandem mass spectrometry. Food Chem. 2017, 229, 366–372. [Google Scholar] [CrossRef]
  10. Qu, L.-L.; Jia, Q.; Liu, C.; Wang, W.; Duan, L.; Yang, G.; Han, C.-Q.; Li, H. Thin layer chromatography combined with surface-enhanced raman spectroscopy for rapid sensing aflatoxins. J. Chromatogr. A 2018, 1579, 115–120. [Google Scholar] [CrossRef]
  11. Raeisossadati, M.J.; Danesh, N.M.; Borna, F.; Gholamzad, M.; Ramezani, M.; Abnous, K.; Taghdisi, S.M. Lateral flow based immunobiosensors for detection of food contaminants. Biosens. Bioelectron. 2016, 86, 235–246. [Google Scholar] [CrossRef] [PubMed]
  12. Tuerk, C.; Gold, L. Systematic evolution of ligands by exponential enrichment: RNA ligands to bacteriophage T4 DNA polymerase. Science 1990, 249, 505–510. [Google Scholar] [CrossRef] [PubMed]
  13. Ellington, A.D.; Szostak, J.W. Invitro selection of RNA molecules that bind specific ligands I. Nature 1990, 346, 818–822. [Google Scholar] [CrossRef] [PubMed]
  14. Sefah, K.; Phillips, J.A.; Xiong, X.; Meng, L.; Van Simaeys, D.; Chen, H.; Martin, J.; Tan, W. Nucleic acid aptamers for biosensors and bio-analytical applications. Analyst 2009, 134, 1765–1775. [Google Scholar] [CrossRef] [PubMed]
  15. Qiu, L.; Wimmers, F.; Weiden, J.; Heus, H.A.; Tel, J.; Figdor, C.G. A membrane-anchored aptamer sensor for probing IFNγ secretion by single cells. Chem. Commun. 2017, 53, 8066–8069. [Google Scholar] [CrossRef] [PubMed]
  16. Kikuchi, N.; Reed, A.; Gerasimova, Y.V.; Kolpashchikov, D.M. Split Dapoxyl Aptamer for Sequence-Selective Analysis of Nucleic Acid Sequence Based Amplification Amplicons. Anal. Chem. 2019, 91, 2667–2671. [Google Scholar] [CrossRef] [PubMed]
  17. Niu, J.X.; Hu, X.M.; Ouyang, W.; Chen, Y.; Liu, S.W.; Han, J.; Liu, L.H. Femtomolar detection of lipopolysaccharide in injectables and serum samples using aptamer-coupled reduced graphene oxide in a continuous injection-electrostacking biochip. Anal. Chem. 2019, 91, 2360–2367. [Google Scholar] [CrossRef]
  18. Hao, N.; Lu, J.; Zhou, Z.; Hua, R.; Wang, K. A pH-resolved colorimetric biosensor for simultaneous multiple target detection. ACS Sens. 2018, 3, 2159–2165. [Google Scholar] [CrossRef]
  19. Seok, Y.; Byun, J.-Y.; Shim, W.-B.; Kim, M.-G. A structure-switchable aptasensor for aflatoxin B1 detection based on assembly of an aptamer/split DNAzyme. Anal. Chim. Acta 2015, 886, 182–187. [Google Scholar] [CrossRef]
  20. Chen, J.; Wen, J.; Zhuang, L.; Zhou, S. An enzyme-free catalytic DNA circuit for amplified detection of aflatoxin B1 using gold nanoparticles as colorimetric indicators. Nanoscale 2016, 8, 9791–9797. [Google Scholar] [CrossRef]
  21. Ma, Y.; Mao, Y.; Huang, D.; He, Z.; Yan, J.; Tian, T.; Shi, Y.; Song, Y.; Li, X.; Zhu, Z.; et al. Portable visual quantitative detection of aflatoxin B-1 using a target-responsive hydrogel and a distance-readout microfluidic chip. Lab Chip 2016, 16, 3097–3104. [Google Scholar] [CrossRef] [PubMed]
  22. Mo, R.; He, L.; Yan, X.; Su, T.; Zhou, C.; Wang, Z.; Hong, P.; Sun, S.; Li, C. A novel aflatoxin B1 biosensor based on a porous anodized alumina membrane modified with graphene oxide and an aflatoxin B1 aptamer. Electrochem. Commun. 2018, 95, 9–13. [Google Scholar] [CrossRef]
  23. Zheng, W.; Teng, J.; Cheng, L.; Ye, Y.; Pan, D.; Wu, J.; Xue, F.; Liu, G.; Chen, W. Hetero-enzyme-based two-round signal amplification strategy for trace detection of aflatoxin B1 using an electrochemical aptasensor. Biosens. Bioelectron. 2016, 80, 574–581. [Google Scholar] [CrossRef] [PubMed]
  24. Peng, G.; Li, X.; Cui, F.; Qiu, Q.; Chen, X.; Huang, H. Aflatoxin B1 electrochemical aptasensor based on tetrahedral DNA nanostructures functionalized three dimensionally ordered macroporous MoS2–AuNPs film. ACS Appl. Mater. Interfaces 2018, 10, 17551–17559. [Google Scholar] [CrossRef] [PubMed]
  25. Abnous, K.; Danesh, N.M.; Alibolandi, M.; Ramezani, M.; Emrani, A.S.; Zolfaghari, R.; Taghdisi, S.M. A new amplified π-shape electrochemical aptasensor for ultrasensitive detection of aflatoxin B1. Biosens. Bioelectron. 2017, 94, 374–379. [Google Scholar] [CrossRef] [PubMed]
  26. Goud, K.Y.; Hayat, A.; Catanante, G.; Satyanarayana, M.; Gobi, K.V.; Marty, J.L. An electrochemical aptasensor based on functionalized graphene oxide assisted electrocatalytic signal amplification of methylene blue for aflatoxin B1 detection. Electrochim. Acta 2017, 244, 96–103. [Google Scholar] [CrossRef]
  27. Jia, Y.; Wu, F.; Liu, P.; Zhou, G.; Yu, B.; Lou, X.; Xia, F. A label-free fluorescent aptasensor for the detection of Aflatoxin B1 in food samples using AIEgens and graphene oxide. Talanta 2019, 198, 71–77. [Google Scholar] [CrossRef] [PubMed]
  28. Wang, B.; Chen, Y.; Wu, Y.; Weng, B.; Liu, Y.; Lu, Z.; Li, C.M.; Yu, C. Aptamer induced assembly of fluorescent nitrogen-doped carbon dots on gold nanoparticles for sensitive detection of AFB1. Biosens. Bioelectron. 2016, 78, 23–30. [Google Scholar] [CrossRef]
  29. Xia, X.; Wang, Y.; Yang, H.; Dong, Y.; Zhang, K.; Lu, Y.; Deng, R.; He, Q. Enzyme-free amplified and ultrafast detection of aflatoxin B1 using dual-terminal proximity aptamer probes. Food Chem. 2019, 283, 32–38. [Google Scholar] [CrossRef]
  30. Wang, L.; Zhu, F.; Chen, M.; Zhu, Y.; Xiao, J.; Yang, H.; Chen, X. Rapid and visual detection of aflatoxin B1 in foodstuffs using aptamer/G-quadruplex DNAzyme probe with low background noise. Food Chem. 2019, 271, 581–587. [Google Scholar] [CrossRef]
  31. Lu, X.; Wang, C.; Qian, J.; Ren, C.; An, K.; Wang, K. Target-driven switch-on fluorescence aptasensor for trace aflatoxin B1 determination based on highly fluorescent ternary CdZnTe quantum dots. Anal. Chim. Acta 2019, 1047, 163–171. [Google Scholar] [CrossRef] [PubMed]
  32. Zhao, Y.; Yang, Y.; Luo, Y.; Yang, X.; Li, M.; Song, Q. Double detection of mycotoxins based on SERS labels embedded Ag@ Au core–shell nanoparticles. ACS Appl. Mater. Interface 2015, 7, 21780–21786. [Google Scholar] [CrossRef] [PubMed]
  33. Li, Q.; Lu, Z.; Tan, X.; Xiao, X.; Wang, P.; Wu, L.; Shao, K.; Yin, W.; Han, H. Ultrasensitive detection of aflatoxin B1 by SERS aptasensor based on exonuclease-assisted recycling amplification. Biosens. Bioelectron. 2017, 97, 59–64. [Google Scholar] [CrossRef] [PubMed]
  34. Li, A.; Tang, L.; Song, D.; Song, S.; Ma, W.; Xu, L.; Kuang, H.; Wu, X.; Liu, L.; Chen, X. A SERS-active sensor based on heterogeneous gold nanostar core–silver nanoparticle satellite assemblies for ultrasensitive detection of aflatoxinB1. Nanoscale 2016, 8, 1873–1878. [Google Scholar] [CrossRef] [PubMed]
  35. Yang, M.; Liu, G.; Mehedi, H.M.; Ouyang, Q.; Chen, Q. A universal sers aptasensor based on DTNB labeled GNTs/Ag core-shell nanotriangle and CS-Fe3O4 magnetic-bead trace detection of Aflatoxin B1. Anal. Chim. Acta 2017, 986, 122–130. [Google Scholar] [CrossRef] [PubMed]
Figure 1. Schematic illustration of detection strategies for aflatoxin B1 (AFB1) by utilizing AFB1 aptamer sensors.
Applsci 09 02364 g001
Figure 2. Schematic representation of the detection mechanism of the probe for monitoring microcystin-LR, fumonisin B1, aflatoxins B1, and ochratoxin A using a colorimetric assay. Reproduced from [18]. Copyright 2018, American Chemical Society.
Applsci 09 02364 g002
Figure 3. Schematic illustration for the colorimetric quantification of AFB1 using the colorimetric signal facilitated by peroxidase-mimicking split DNAzyme. Reproduced from [19]. Copyright 2015, Elsevier.
Applsci 09 02364 g003
Figure 4. Illustration of the strategy for detecting AFB1 based on a catalytic DNA circuit and gold nanoparticles. Reproduced from [20]. Copyright 2016, Royal Society of Chemistry.
Applsci 09 02364 g004
Figure 5. (A) Schematic representation of the strategy for the detection of AFB1. (B) Linear plot of current change versus the concentration of AFB1. (C) The current change of other toxins and AFB1. Reproduced from [22]. Copyright 2018, Elsevier.
Applsci 09 02364 g005
Figure 6. Schematic representation of the detection of AFB1 by an electrochemical aptasensor using a telomerase- and Exo III-assisted amplification strategy. Reproduced from [23]. Copyright 2016, Elsevier.
Applsci 09 02364 g006
Figure 7. Schematic representation of the detection mechanism of the AFB1 aptasensor based on DNA tetrahedrons and horseradish peroxidase-modified Fe3O4. Reproduced from [24]. Copyright 2018, American Chemical Society.
Applsci 09 02364 g007
Figure 8. Scheme illustration of the fabrication process of an aptasensor and detection mechanism for the detection of AFB1. Reproduced from [25]. Copyright 2017, Elsevier.
Applsci 09 02364 g008
Figure 9. (A) Scheme representation of the label-free aptasensor for AFB1 determination in food samples. (B) Fluorescence spectra of the proposed probe for AFB1 with various concentrations. (C) Selectivity of the proposed probe toward AFB1. Reproduced from [27]. Copyright 2019, Elsevier.
Applsci 09 02364 g009
Figure 10. (A) Sensing mechanism of fluorescent aptasensor for determining the presence of AFB1. (B) Fluorescence spectra of the carbon dots/aptamer/AuNPs with the addition of AFB1. (C) The relative fluorescence intensities of the fluorescent aptasensor in presence of various relevant species. Reproduced from [28]. Copyright 2016, Elsevier.
Applsci 09 02364 g010
Figure 11. Schematic representation of the dual-terminal proximity aptamer probe for detecting AFB1. Reproduced from [29]. Copyright 2019, Elsevier.
Applsci 09 02364 g011
Figure 12. Schematic illustration of AFB1 determination using an aptamer/G-quadruplex DNAzyme probe. Reproduced from [30]. Copyright 2019, Elsevier.
Applsci 09 02364 g012
Figure 13. Schematic representation for the simultaneous determination of AFB1 and OTA by the utilization of SERS labels embedded in Ag@Au core-shell NPs. Reproduced from [32]. Copyright 2015, American Chemical Society.
Applsci 09 02364 g013
Figure 14. Scheme representation of a SERS aptasensor for detecting AFB1 using exonuclease-aided recycling amplification. Reproduced from [33]. Copyright 2017, Elsevier.
Applsci 09 02364 g014
Figure 15. Schematic representation of the SERS aptasensor for the determination of AFB1 based on gold nano-triangles. Reproduced from [35]. Copyright 2017, Elsevier.
Applsci 09 02364 g015
Table 1. Comparison of different strategies for AFB1 detection.
MethodProbeLOD (g·L−1)Linear (g·L−1)Practical SampleRef.
ColorimetryFe3O4/GO/1.0 × 10−5–2.0 × 10⁻⁴peanut18
ColorimetrySplit DNAzyme1.0 × 10−71.0 × 10⁻⁷–1.0 × 10⁻²corn19
ColorimetryCatalytic DNA circuit6.2 × 10−103.1 × 10⁻⁹–3.1 × 10⁻⁴rice20
ColorimetryResponsive hydrogel5.5 × 10−100–1.9 × 10⁻⁵Beer21
ElectrochemistryGO1.3 × 10−71.0 × 10⁻⁶–2.0 × 10⁻⁵/22
ElectrochemistryTelomerase and Exo III6.0 × 10−151.0 × 10⁻¹⁴–1.0 × 10⁻⁸/23
ElectrochemistryMoS2-AuNPs1.0 × 10−141.0 × 10⁻¹⁴–1.0 × 10⁻⁴rice and wheat powder24
Electrochemistry/2.0 × 10−97.0 × 10−9–5.0 × 10⁻⁷human serum and grape juice25
ElectrochemistryMB/FGO5.0 × 10−85.0 × 10⁻⁸–6.0 × 10⁻⁶alcoholic beverage26
FluorescenceTPE-Z/GO2.5 × 10−70–3.0 × 10⁻⁶corn, milk, and rice27
FluorescenceGold nanoparticles5.0 × 10−95.0 × 10⁻⁹–2.0 × 10⁻⁶peanut and corn28
FluorescenceDual-terminal proximity aptamer9.1 × 10−71.0 × 10⁻⁶–2.0 × 10⁻⁴peanut oil and broad bean paste29
FluorescenceFe3O4/DNAzyme2.0 × 10−85.0 × 10⁻⁷–1.5 × 10⁻⁵cereal30
FluorescenceQDs/gold nanoparticles2.0 × 10−85.0 × 10⁻⁸–1.0 × 10⁻⁴peanut31
SERSAg@Au CS NPs/MNPs3.0 × 10−85.0 × 10⁻⁸–1.0 × 10⁻⁴maize meal.32
SERSHairpin/Exo III4.0 × 10−131.0 × 10⁻¹²–1.0 × 10⁻⁶peanut33
SERSAu NS/Ag NP4.8 × 10−101.0 × 10⁻⁹–1.0 × 10⁻⁶peanut milk34
SERSGADNTs/CS-Fe3O45.4 × 10−101.0 × 10⁻⁹–1.0 × 10⁻⁵peanut oil35

