Article

Application of Deep Convolutional Neural Networks and Smartphone Sensors for Indoor Localization

Department of Information & Communication Engineering Yeungnam University, Gyeongsan, Gyeongbuk 38541, Korea
*
Author to whom correspondence should be addressed.
Appl. Sci. 2019, 9(11), 2337; https://doi.org/10.3390/app9112337
Submission received: 20 April 2019 / Revised: 28 May 2019 / Accepted: 4 June 2019 / Published: 6 June 2019
(This article belongs to the Special Issue Advanced Intelligent Imaging Technology)

Abstract

:
Indoor localization systems are susceptible to higher errors and do not meet the current standards of indoor localization. Moreover, the performance of such approaches is limited by device dependence. The use of Wi-Fi makes the localization process vulnerable to dynamic factors and energy hungry. A multi-sensor fusion based indoor localization approach is proposed to overcome these issues. The proposed approach predicts pedestrians’ current location with smartphone sensors data alone. The proposed approach aims at mitigating the impact of device dependency on the localization accuracy and lowering the localization error in the magnetic field based localization systems. We trained a deep learning based convolutional neural network to recognize the indoor scene which helps to lower the localization error. The recognized scene is used to identify a specific floor and narrow the search space. The database built of magnetic field patterns helps to lower the device dependence. A modified K nearest neighbor (mKNN) is presented to calculate the pedestrian’s current location. The data from pedestrian dead reckoning further refines this location and an extended Kalman filter is implemented to this end. The performance of the proposed approach is tested with experiments on Galaxy S8 and LG G6 smartphones. The experimental results demonstrate that the proposed approach can achieve an accuracy of 1.04 m at 50 percent, regardless of the smartphone used for localization. The proposed mKNN outperforms K nearest neighbor approach, and mean, variance, and maximum errors are lower than those of KNN. Moreover, the proposed approach does not use Wi-Fi for localization and is more energy efficient than those of Wi-Fi based approaches. Experiments reveal that localization without scene recognition leads to higher errors.

Graphical Abstract

1. Introduction

The proliferation of modern smartphones and their wide usage in the everyday life makes them a perfect tool for localization, especially indoors. The high definition camera-equipped phones carry other sensors as well which can be employed to locate a person. Studies [1,2,3] indicate that the images from a smartphone camera can be used for very accurate scene recognition both outdoor, as well as, indoor. We aim to use deep convolutional neural networks (CNNs) to identify the specific scenes in the indoor environment to assist the accurate location estimation. Radio signal strength fingerprinting based indoor localization has been widely utilized as it makes the use of already deployed access points (AP). However, its performance is severely degraded due to the dynamic factors of shadowing and multipath effects. On the contrary, geomagnetic field (referred to as “magnetic field” in the rest of the paper) based indoor localization has emerged as a potential technology which can overcome the issues related to radio signal based localization. At the same time, it is pervasive, less prone to changes in indoor infrastructure and does not require additional sensors to perform localization. However, infrastructural changes involving ferromagnetic materials like iron, nickle, etc., make changes to the magnetic field. For example, installing an elevator in a building would cause a huge magnetic change in the proximity of the elevator [4].
Many works [5,6,7,8,9,10] focusing on the use of the magnetic data have been presented. However, they are limited by two factors. First, they work in single floor environments which limits their wide applicability. Second, they do not meet the accuracy requirements for emergency response actions as either the localization errors are high in these works or they make the use of radio signals. The use of radio signals makes them vulnerable, whereas they need the deployed APs to work properly. This research aims to overcome the limitations of the traditional magnetic field based localization and devises an approach which works in a multi-floor environment. The images from the smartphone camera are used to identify indoor scenes.
Scene recognition is one of the challenging but important tasks in computer vision which has many applications including object detection [11], place identification [12], localization [13,14], robotics [15], etc. Scene recognition also plays an important role in objects tracking [16,17,18], computer engineering tasks including the modeling of resident recognition and monitoring in modern smart home applications [19,20]. Similarly, research [21] has shown that scene recognition can significantly improve the health care services by monitoring the patients. Security applications have also been improved by utilizing scene recognition [22].
Scene recognition is broadly divided into two categories: Outdoor scene recognition and indoor scene recognition. Research works on outdoor scene recognition involve camera pose estimation [23], semantic scene classification [24], motion detection [25], satellite image based tasks [26], localization [27], etc. A variety of sensors have been utilized for indoor scene recognition based tasks. For example [28,29], used RBG-D camera for object detection and human pose estimation. Similarly research works [17,30,31] have utilized depth images for human activity recognition and monitoring the individuals in smart homes. The use of digital camera to extract image features for classification and segmentation has also been done in [32]. Scene recognition involves the use of both low-level features including color, Local Binary Pattern (LBP), Scale-invariant Feature Transform (SIFT), etc., as well as high level features like semantic modeling including bag-of-visual-features, and attributes and object-based approaches. However, such approaches require a large amount of manned effort to label the captured images.
Recently, deep CNN have been utilized for a variety of computer vision problems. The introduction of large datasets like ImageNet and Places paved the way for many object and scene classification tasks [33]. Many works [34,35] have been presenetd which are devoted to scene and place recognition using deep learning. Scene recognition using the smartphone camera can play an important role to refine the indoor localization accuracy. Indoor localization is an important problem today for a variety of applications including but not limited to geotagging, asset tracking, augmented reality, and emergency response activities. In addition, the emergence of location-based services (LBS) necessitated the robustness and preciseness of indoor location. Apart from this, accurate location information serves as the backbone for LBS. Unlike the global positioning system (GPS) which serves as the chief outdoor localization technology, there is no standard technology which does the same for indoor localization. A number of technologies have been proposed so far, including optical [36], radio, acoustics, and magnetic [37,38] to perform indoor localization, yet, none of them serves without its demerits.
A major limitation of using the magnetic field data is its device dependence. Ssmartphones of different brands are embedded with magnetometers designed from various companies. The magnetic data collected from these smartphones fluctuate significantly depending upon the sensitivity of the installed magnetometer. Another challenge is to increase the localization accuracy in large places, as the magnetic intensity can be very similar at multiple locations. Scene recognition can play an important role to increase the localization accuracy. We aim to use scene recognition for two purposes. First, it is utilized to identify a specific floor and then the identified scene is employed to narrow down the search space in the database. A scene is identified with the help of a deep CNN model. The training data for each scene is collected using the smartphone rea camera. The identified scene is then used to assist magnetic field based localization. In the end, the estimated location is refined with the help of pedestrian dead reckoning (PDR) data. An extended Kalman filter (EKF) is used to fuse the results from magnetic field localization and PDR data.
The following contributions have been made in this research:
  • A scene recognition model based on deep convolutional neural network is trained for indoor scene recognition in varying light conditions. The model is used to identify different floors and refines indoor localization accuracy. Tensorflow 1.12.0 is used to build and train the model. The accuracy of CNN is compared with support vector machines.
  • An indoor localization approach is presented which utilizes the magnetic data from smartphone magnetic sensor to localize a pedestrian.
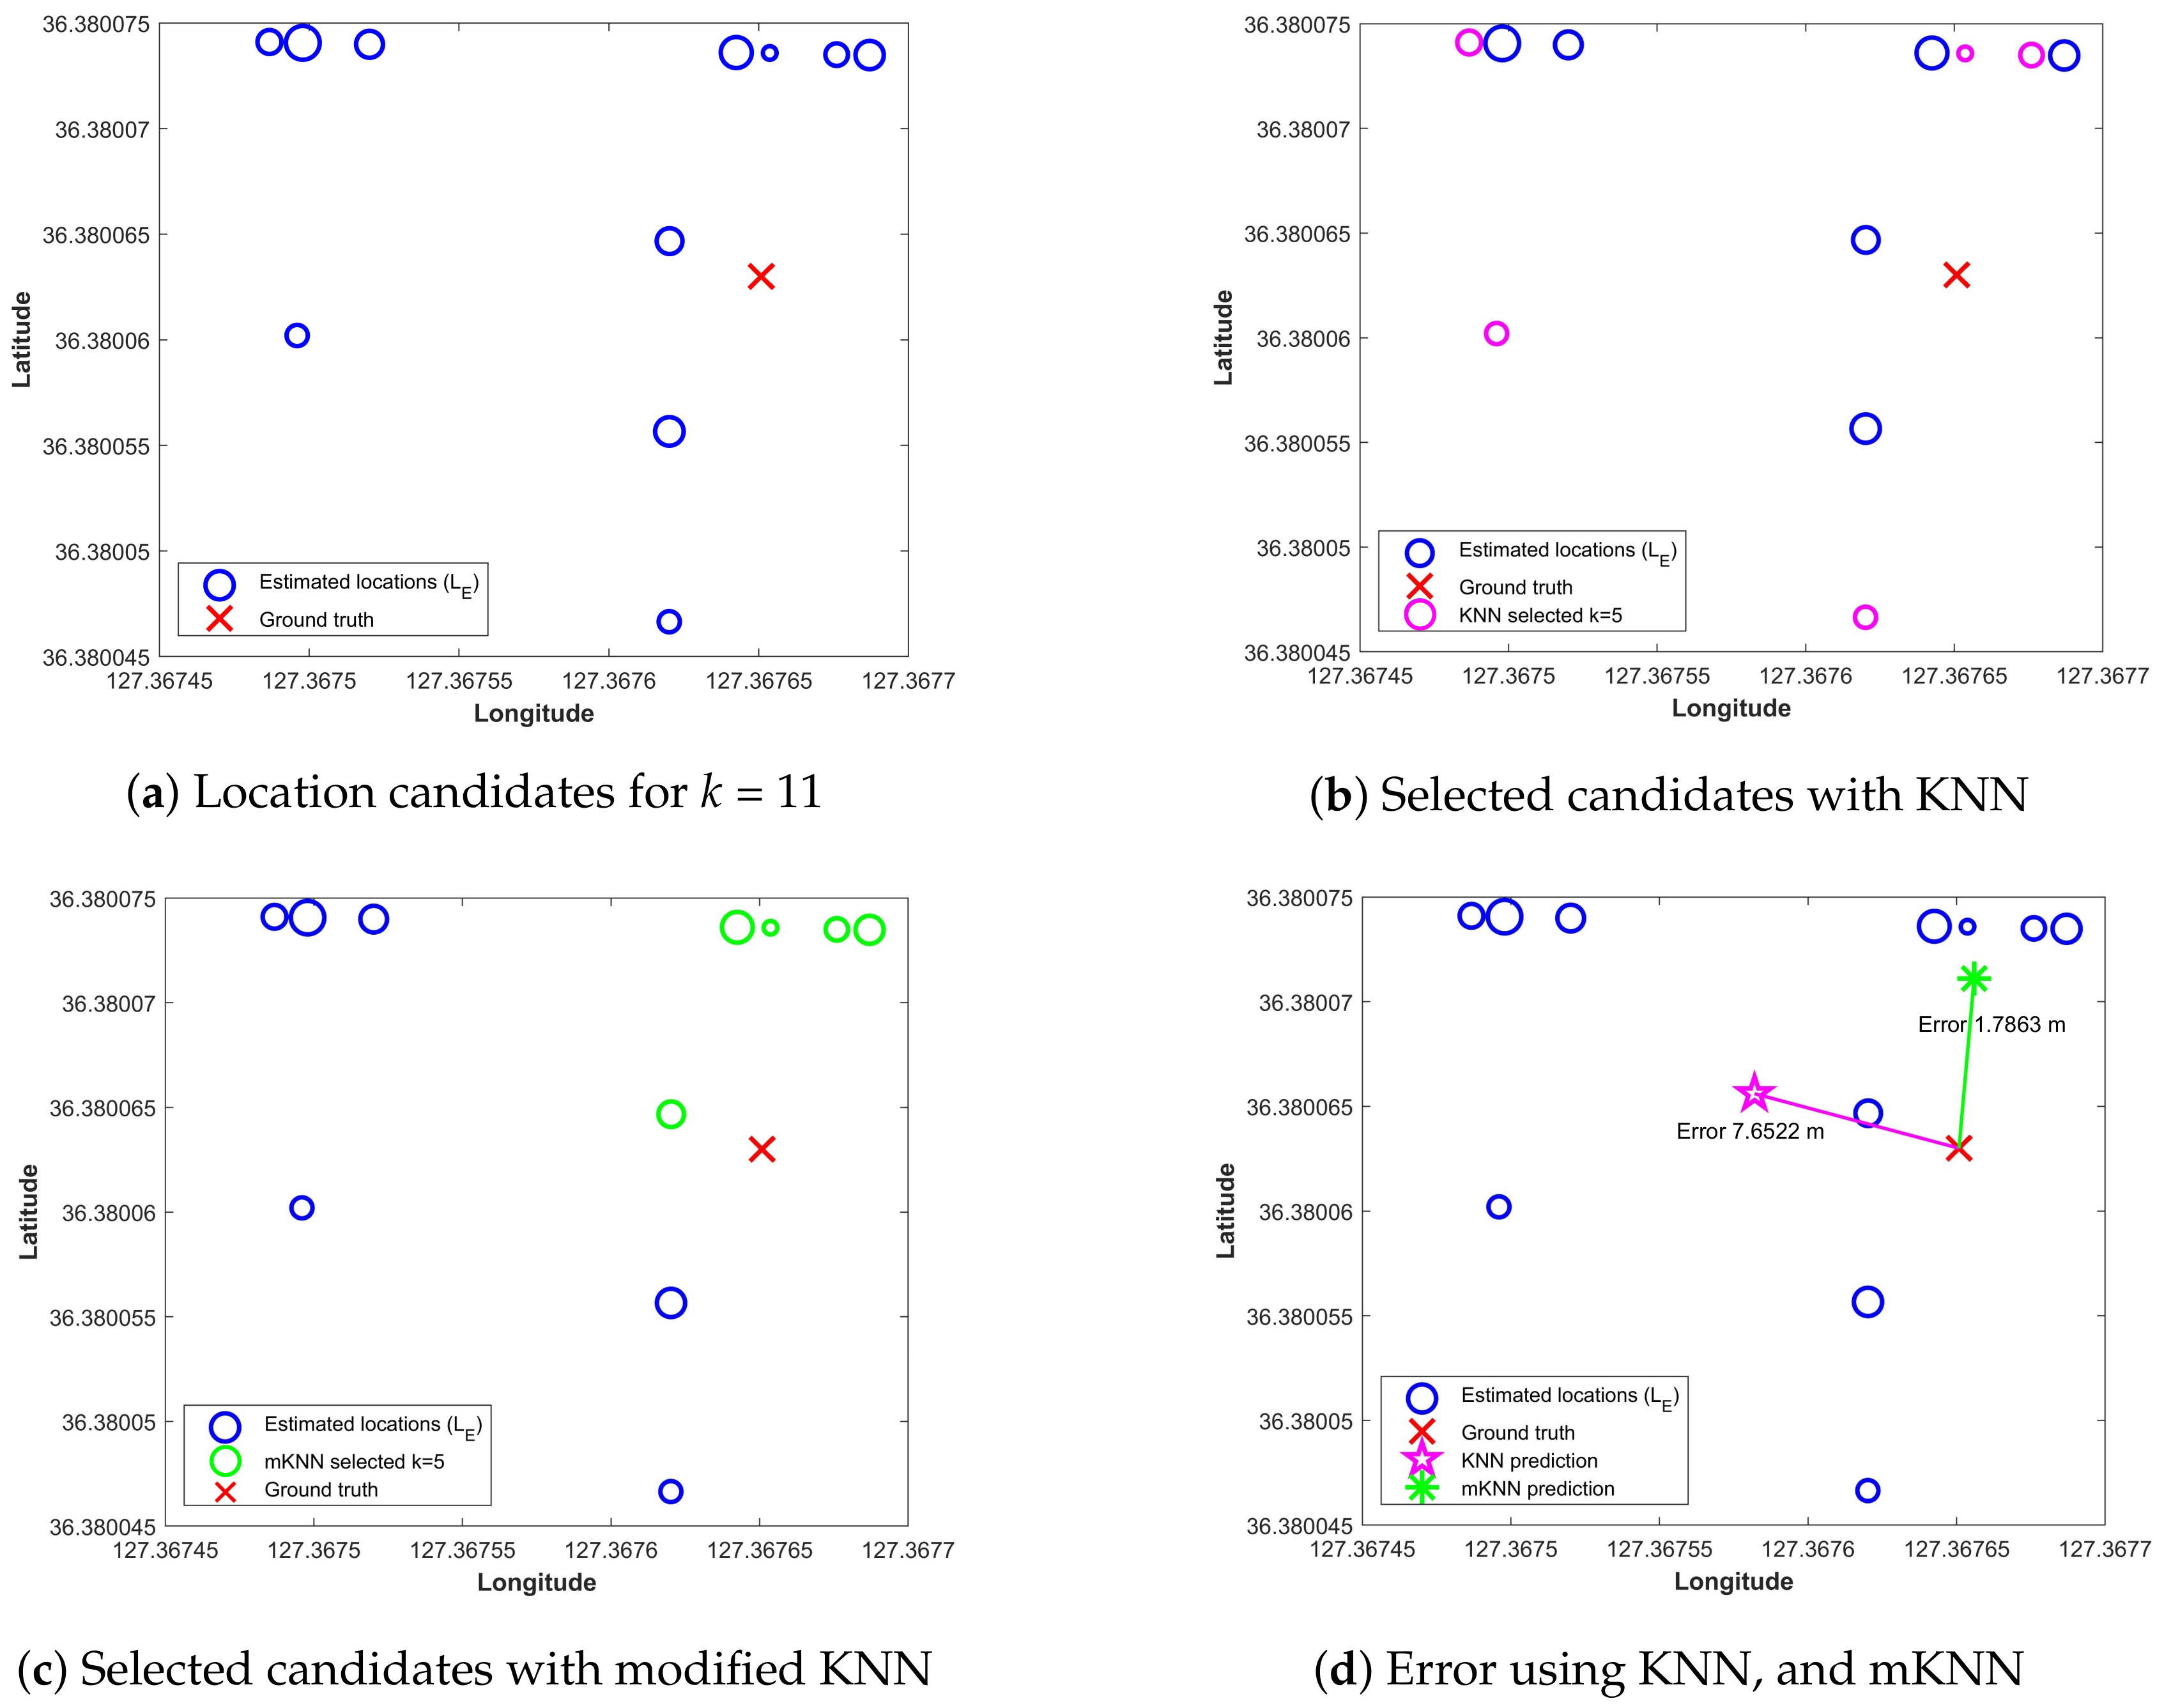
  • Spatial proximity is considered to modify K nearest neighbor (KNN) which removes the distant neighbors and refines the current location of the pedestrian using the magnetic data.
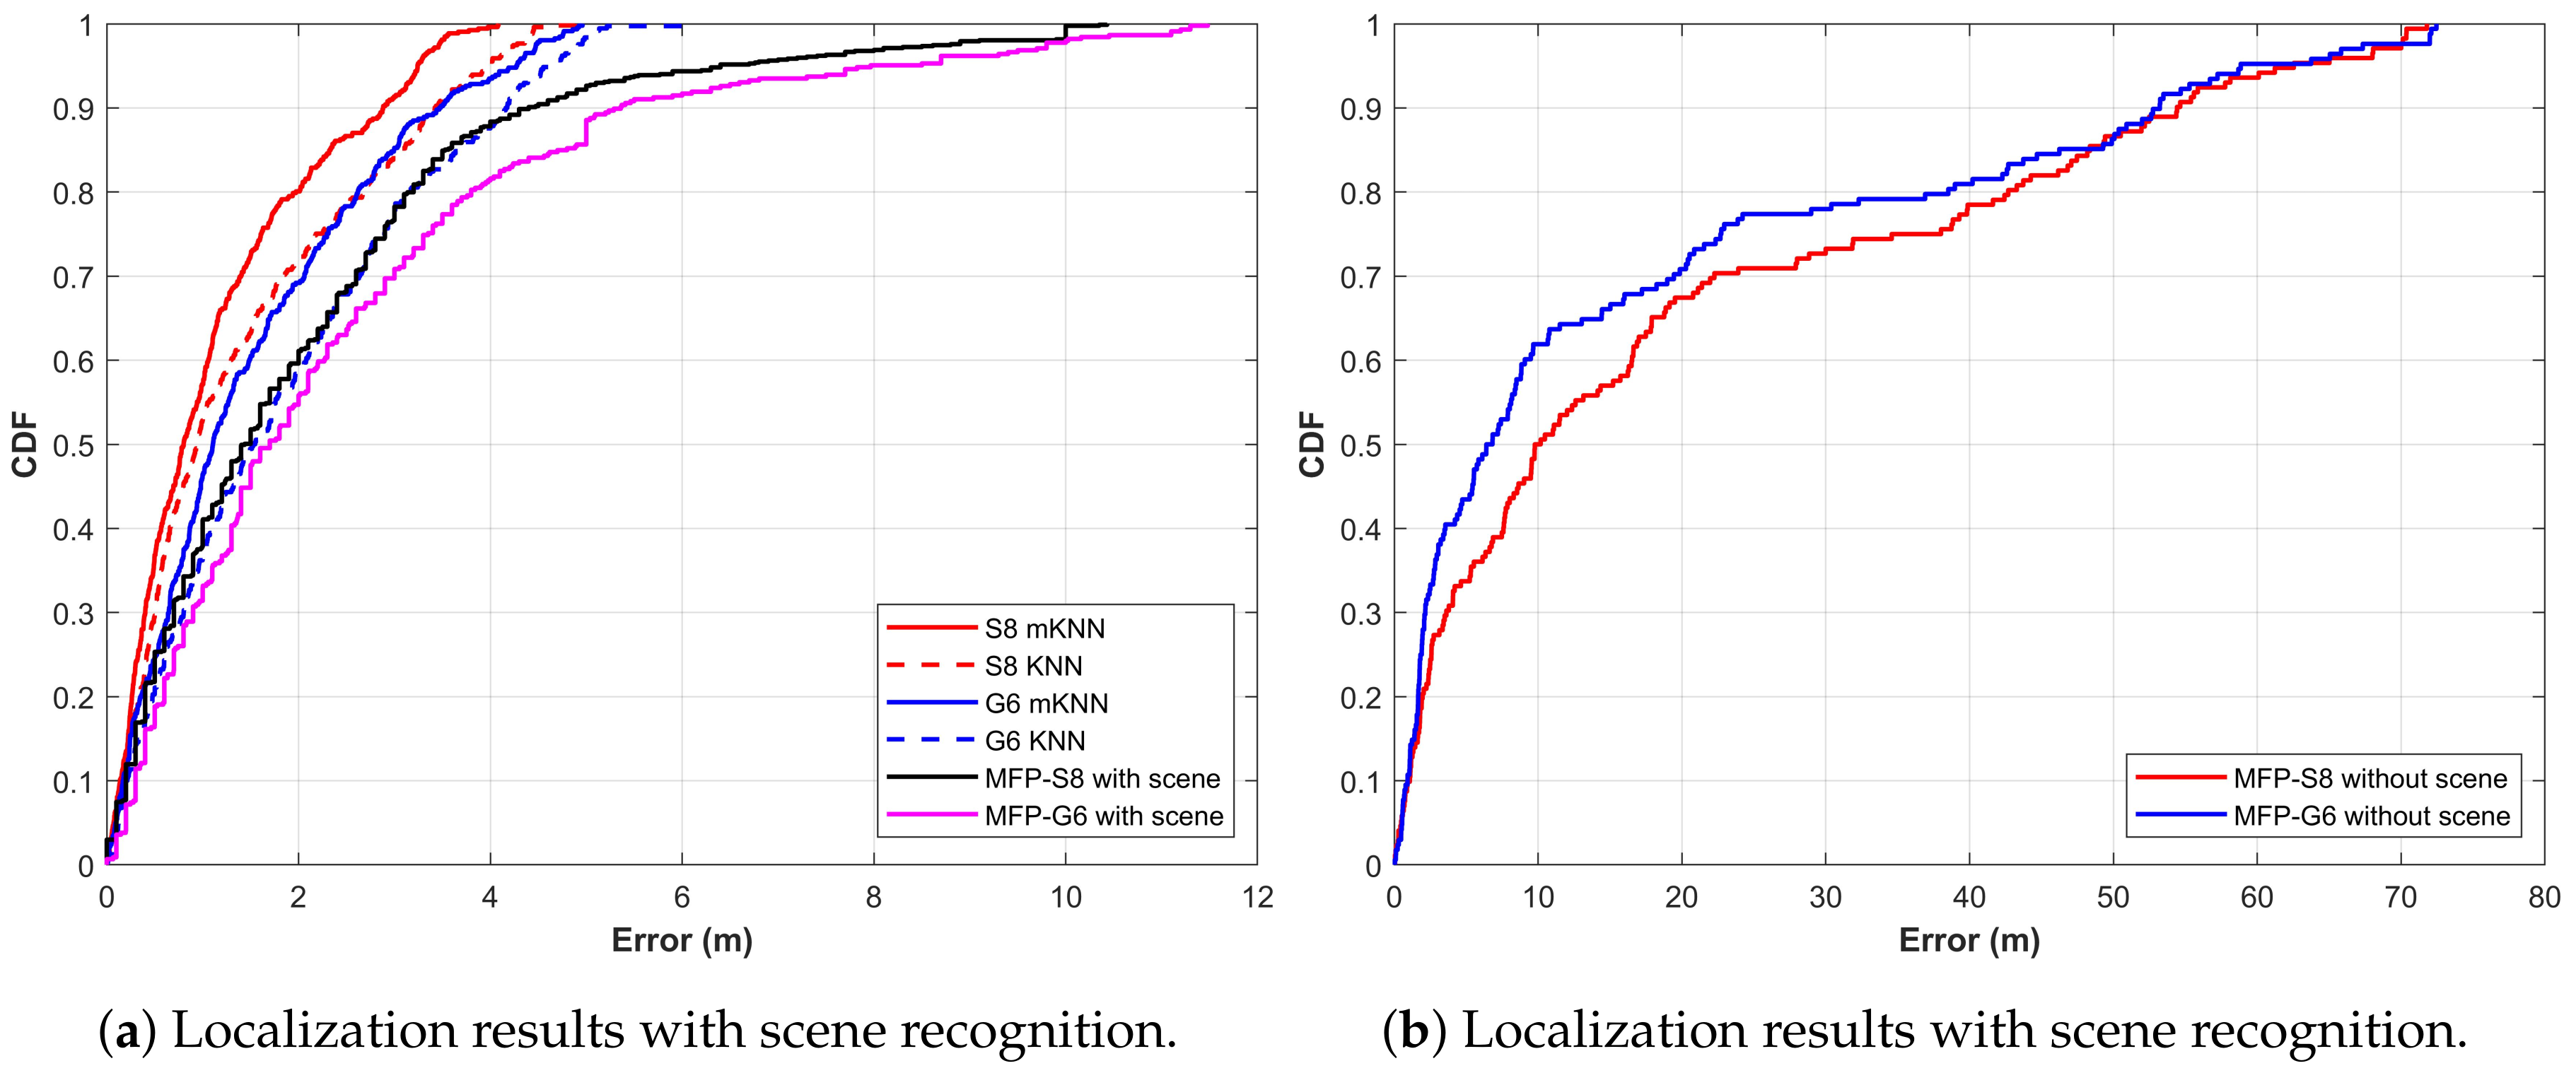
  • The proposed approach is tested on different smartphones and results are compared against other localization techniques to evaluate the impact of device dependence.
The rest of the paper is organized in the following manner. Section 2 describes the research works related to the current study. The proposed approach and its architecture are discussed in Section 3. Section 4 is about the experiment and performance evaluation. Discussions and conclusion are given in Section 5 and Section 6, respectively.

2. Related Work

A large body of work has been presented which uses dee plearning with using Wi-Fi, magnetic field, video, and scene recognition to perform indoor localization [1,39,40]. However, we will limit our discussion to only the most recent and relevant contributions which use deep learning and scene recognition for localization.
Authors in [41] utilize smartphone camera to locate a person in narrow corridors. The proposed technique first builds the image database and then matches the user taken images to the database. Speeded-up Robust Features (SURF) are used for the matching process. Later, the actual location is calculated with the help of epipolar geometry. The localization results are compared with wireless local area localization results to evaluate the accuracy of the proposed method. While the proposed method achieves slightly better accuracy than that of wireless local area results, it lacks robustness. Time involved in feature extraction from captured images and their matching increases the latency. Additionally, the localization accuracy can be improved by a fusion of multiple localization technologies. For example, authors in [42] present an approach called Wi-Vi to improve the localization accuracy. The proposed approach is based on the use of Wi-Fi and visual images fingerprinting. First step involves a coarse location estimation using the Wi-Fi fingerprint database. During the second step, the calculated location is refined with the help of captured images. The images are matched using ORB which is the combination of oFAST (FAST with orientation), and rBRIEF (rotated BRIEF). The ORB feature of the captured image is matched against the ORB feature of the fingerprint image using Hamming distance as the metric of similarity. The approach shows good accuracy and average localization error is under 1 m at 96%. The major limitation of the approach is that the localization is performed only at special places called landmarks, which include all places with EXIT signs indoors. It means that any change in the location of such landmarks requires potential changes in the images fingerprint databases.
A variety of feature extraction techniques have been proposed as well which are useful for scene recognition. For example, research [43,44] works with dense depth images from depth camera. The features of spatial/temporal continuity, constraints of human motion information and centroids of each activity are used. Research [45] uses eigenfaces vector reduction by texture and shape vector phenomenon to remove complexity and density matching score with face boundary fixation extracted the most likelihood characteristics. Authors in [46] use multiple cameras to find the centroids of the blobs to calculate the 3D position of cues. Research [47] uses local descriptors for image description to classify images. The problems of low resolution, occlusion and pose and illumination change are tackled. Research [48] employs vertex-modeling structure for feature detection.
Authors in [49] devise an approach which utilizes the received signal strength (RSS) of wireless signals and images to locate a person. Initial estimation of location search space shrinking is achieved using Wi-Fi signals. Results show that image assisted technique achieves an average error of 1 m at 50 percent. The localization error is increased due to random noise, path loss, multipath interference, etc., in Wi-Fi techniques. Authors in [50] work to overcome such limitations using the similarity of AP sets during offline and online phases. Similarly, channel state information (CSI) based fingerprinting can reduce these effects [51]. Recently, research [52] has used DNNs on RSS of Wi-Fi APs to perform floor detection and coarse localization. The fingerprinting process involves a substantial amount of time and one potential alternative to overcome this limitation is crowdsourcing. So, authors in [53] investigate the feasibility of using crowdsourced image data and develop a system called iMoon. The proposed system works on 3D models and supports indoor localization from photo-based 3D models. The reported accuracy is under 4 m for iMoon. Authors in [54] build a system called WAIPO. The system takes advantage of Wi-Fi and magnetic fingerprints, as well as, the image matching and people co-occurrence. Initial estimation is made using Wi-Fi fingerprints which is further refined by image matching and Bluetooth beacons. The final position is then calibrated using the magnetic data. The accuracy of WAIPO is under 2 m at 98 percent.
The discussed research works which are based on the fusion of technologies use Wi-Fi as a module in the system. Wi-Fi is either used to make the initial location estimation or refine the location. Wi-Fi based localization is limited by a number of factors. The scanning for available APs requires increased time as compared to other smartphone sensors including accelerometer, gyroscope, and camera, etc. Our experiments reveal that Wi-Fi AP’s scanning requires 3 to 4 s on average. This raises latency concerns in real time localization systems and reduces the robustness. Additionally, the received signal strength indicator (RSSI) is prone to error and may indicate different locations based on similar RSSI. The dynamic factors including the presence of obstacles and people may cause huge fluctuations in the collected RSSI during the localization process which increases the error [55,56]. Similarly, Wi-Fi based localization is highly sensitive to the wall separations, and floor plans and so they are vulnerable to random noise, path loss, multipath interference, shadowing, and so on [57]. Wi-Fi based systems have a dependence on the location of the installed APs as well and any change in their position requires the recalibration of the fingerprinting database [58]. One important point to consider is that approximately 75.39% of total smartphones operate on Android while other 22.35% on iOS operating systems, respectively [59]. The iOS does not provide Wi-Fi information which implies that the Wi-Fi localization systems cannot work on iOS-based phones.
The limitations of Wi-Fi based localization urged researchers to find alternative technologies which are less prone to infrastructural changes and provide more accurate location estimations. The magnetic field has proven a reliable localization technology and has been a potential area of research during the last decade [8]. For example, authors in [60] present an approach which utilizes magnetic landmarks to perform indoor localization. Landmarks are the points where local minima/maxima exist in magnetic samples of eight-connected neighborhoods. The features of ’recurrence plot’, ’trend’ of the peaks, and peak-to-peak ’length’ from the magnetic data are used to train DNNs. The proposed approach achieves the best classification accuracy of 80.8% where the accuracy is the correct classification of magnetic landmarks. The proposed approach does not perform meter level localization, rather it focuses on specific landmarks classification which in some cases are several meters apart. For example, the length of magnetic data is set as seven meters to extract features which is a long data. In any case, the magnetic data collection is done using a smartphone placed on the robot. For pedestrian tracking, the results may vary significantly with the proposed approach as the pedestrian’s holding the smartphone causes slight movements which affect the magnetic data.
Authors in [61] present a system which utilizes the magnetic field data for localization using a smartphone. The proposed method is based on the smartphone sensors and utilizes the Wi-Fi and magnetic fingerprinting for localization. The fingerprint collection also involves image capturing at each step. The captured images are later used for scene recognition which is done using a Caffe trained CNN model. The smartphone camera is utilized for the initial estimation of the scene. The initial location helps Wi-Fi and magnetic positioning. A particle filter is implemented to refine the location from Wi-Fi and magnetic fingerprints. The proposed method achieves a localization accuracy of 1.32 m at 95%.
The research [61], however, is limited due to many factors. First of all, it involves taking images at each step, which utilizes a substantial amount of phone battery. Secondly, after the initial scene recognition, it uses Wi-Fi to improve the localization accuracy. The user is supposed to stop at each transition point to collect Wi-Fi signals for at least 30 samples. Wi-Fi scanning takes both time and phone battery which increases latency and consumes more battery. Third, it is mentioned that the magnetic data is distinguishable in a five-step range. Traveling at a medium velocity of 1 m/s, a pedestrian can travel 5 m distance which is regarded as a long distance, considering the fact that a large number of sensors are utilized for localization. The magnetic data can be distinguishable depending upon the indoor structure, as well as, the data collection frequency. Last but foremost, the system is tested with a single device and hence device dependence is not analyzed. Research [8,37] point out that different smartphones exhibit very different magnetic data depending on the sensitivity and accuracy of the magnetometer used in the smartphones.
We, thereby, aim to mitigate such limitations by using only the data collected by magnetometer, accelerometer, and gyroscope and do not rely on Wi-Fi localization. The details of the proposed approach are described in the following section.

3. Materials and Methods

This section describes an overview of the proposed approach. The details of data collection, fingerprint database creation, training CNN, and localization process are explained.

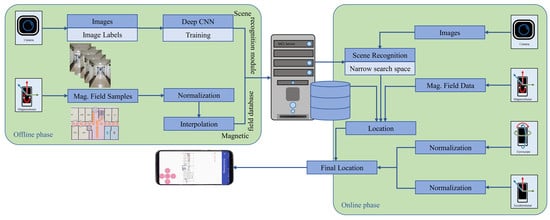
3.1. Overview of Proposed Approach

The architecture of the proposed approach is shown in Figure 1. It incorporates two phases including an offline phase which involves the fingerprint database making from the magnetic field data. Camera images are also collected which are then used for CNN model training. Online phase, on the other hand, involves the utilization of camera images from a smartphone to recognize the scenes. The identified scenes serves two purposes in our approach: Floor identification as well as constraining the search space for the magnetic fingerprint database. The magnetic data are used for localization and a modified k nearest neighbor (mKNN) is proposed for this purpose. Accelerometer and gyroscope data are utilized to find the heading estimation and distance traveled by the pedestrian in order to use the extended Kalman filter (EKF) to refine the estimated location.

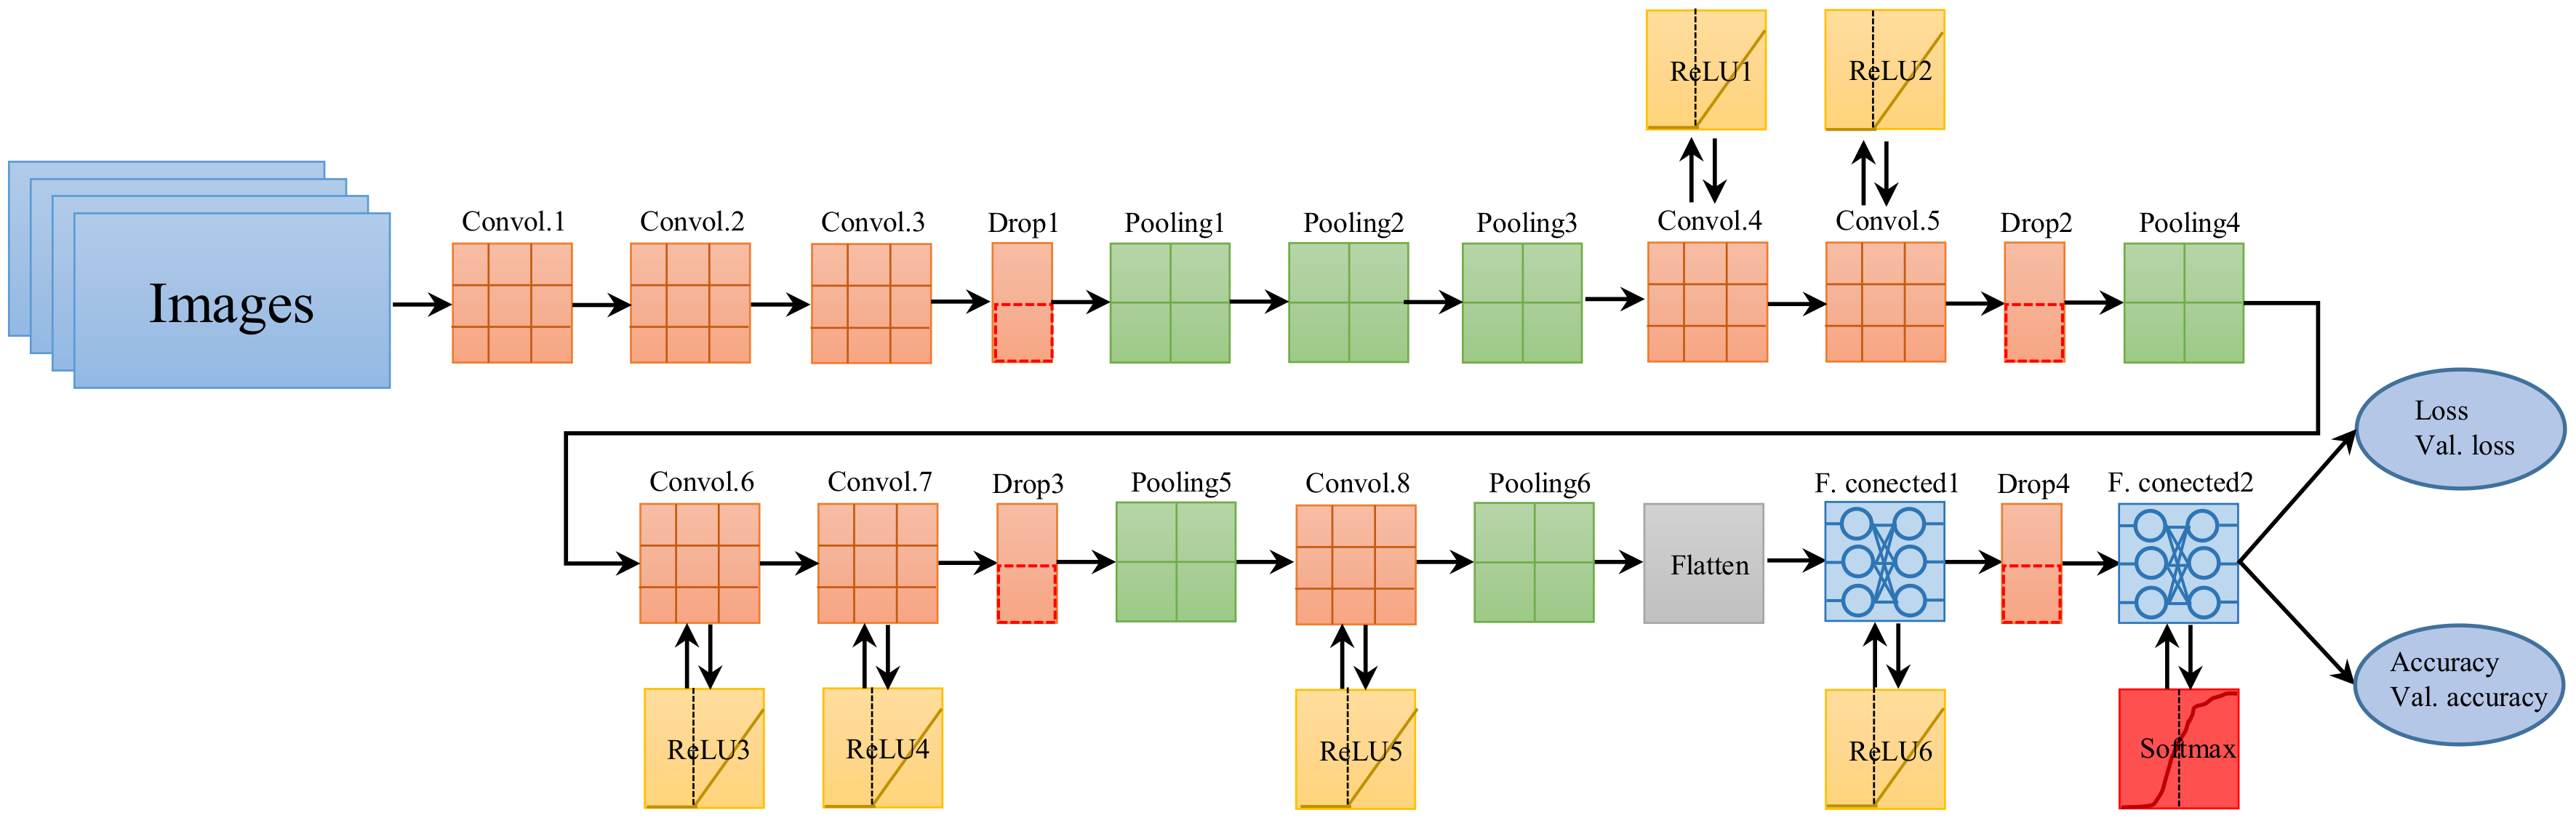
3.2. Deep Convolutional Neural Network

Deep learning based neural networks have proven their significance and attracted a considerable attention during recent years. Especially, CNN have been utilized to solve many computer vision issues, for instance, image classification, object detection, and scene recognition, etc. CNNs are based on a large number of convolutional layers, pooling and fully connected layers. The convolutional layer aims at extracting the local features from the input image. The essential role of a pooling layer is to subsample the convolutional layer to reduce the size and dimensionality of each feature map. Pooling layer computes some function on features map and two commonly used functions are ’maximum’ and ’average’. Pooling layers do not incorporate activation functions; instead, they use rectified linear unit (ReLU) function. The pooling average for each convolutional layer can be calculated by [62]:
X i j l = 1 M N m M n N X i M + m , j N + n l 1
where i and j show the positions of the output map, while M and N are the pooling sample sizes.
A fully connected layer is related to a neural network and serves the purpose of classification. Figure 2 shows the architecture of CNN model used for scene recognition. The network consists of eight convolutional layers and six pooling layers. ReLU is used as activation with convolutional layers four to eight. Pooling layers are used with a stride of 2. Four dropout layers are utilized as well for regularization. Dropout layers are used to prevent complex co-adaptations on the training data and avoid overfitting of the model. Research [63] suggested the use of dropout layers on fully connected layers with a rate of 0.5. It randomly omits each hidden unit with a probability of 50% on each training case for each presentation. The output of fully connected layer two is the number of classes for which classification is to be made. We have selected different points on each floor of a three-floor building to capture camera images which makes it a 15 classes prediction network. Adam optimizer is used to train the CNN. The last layer uses the softmax function to normalize it into the probability distribution of K probabilities which is equal to 15. It normalizes the network output to a probability distribution over predicted classes. The standard softmax function [64] is denoted by:
σ ( z ) i = e z i j = 1 K e z j

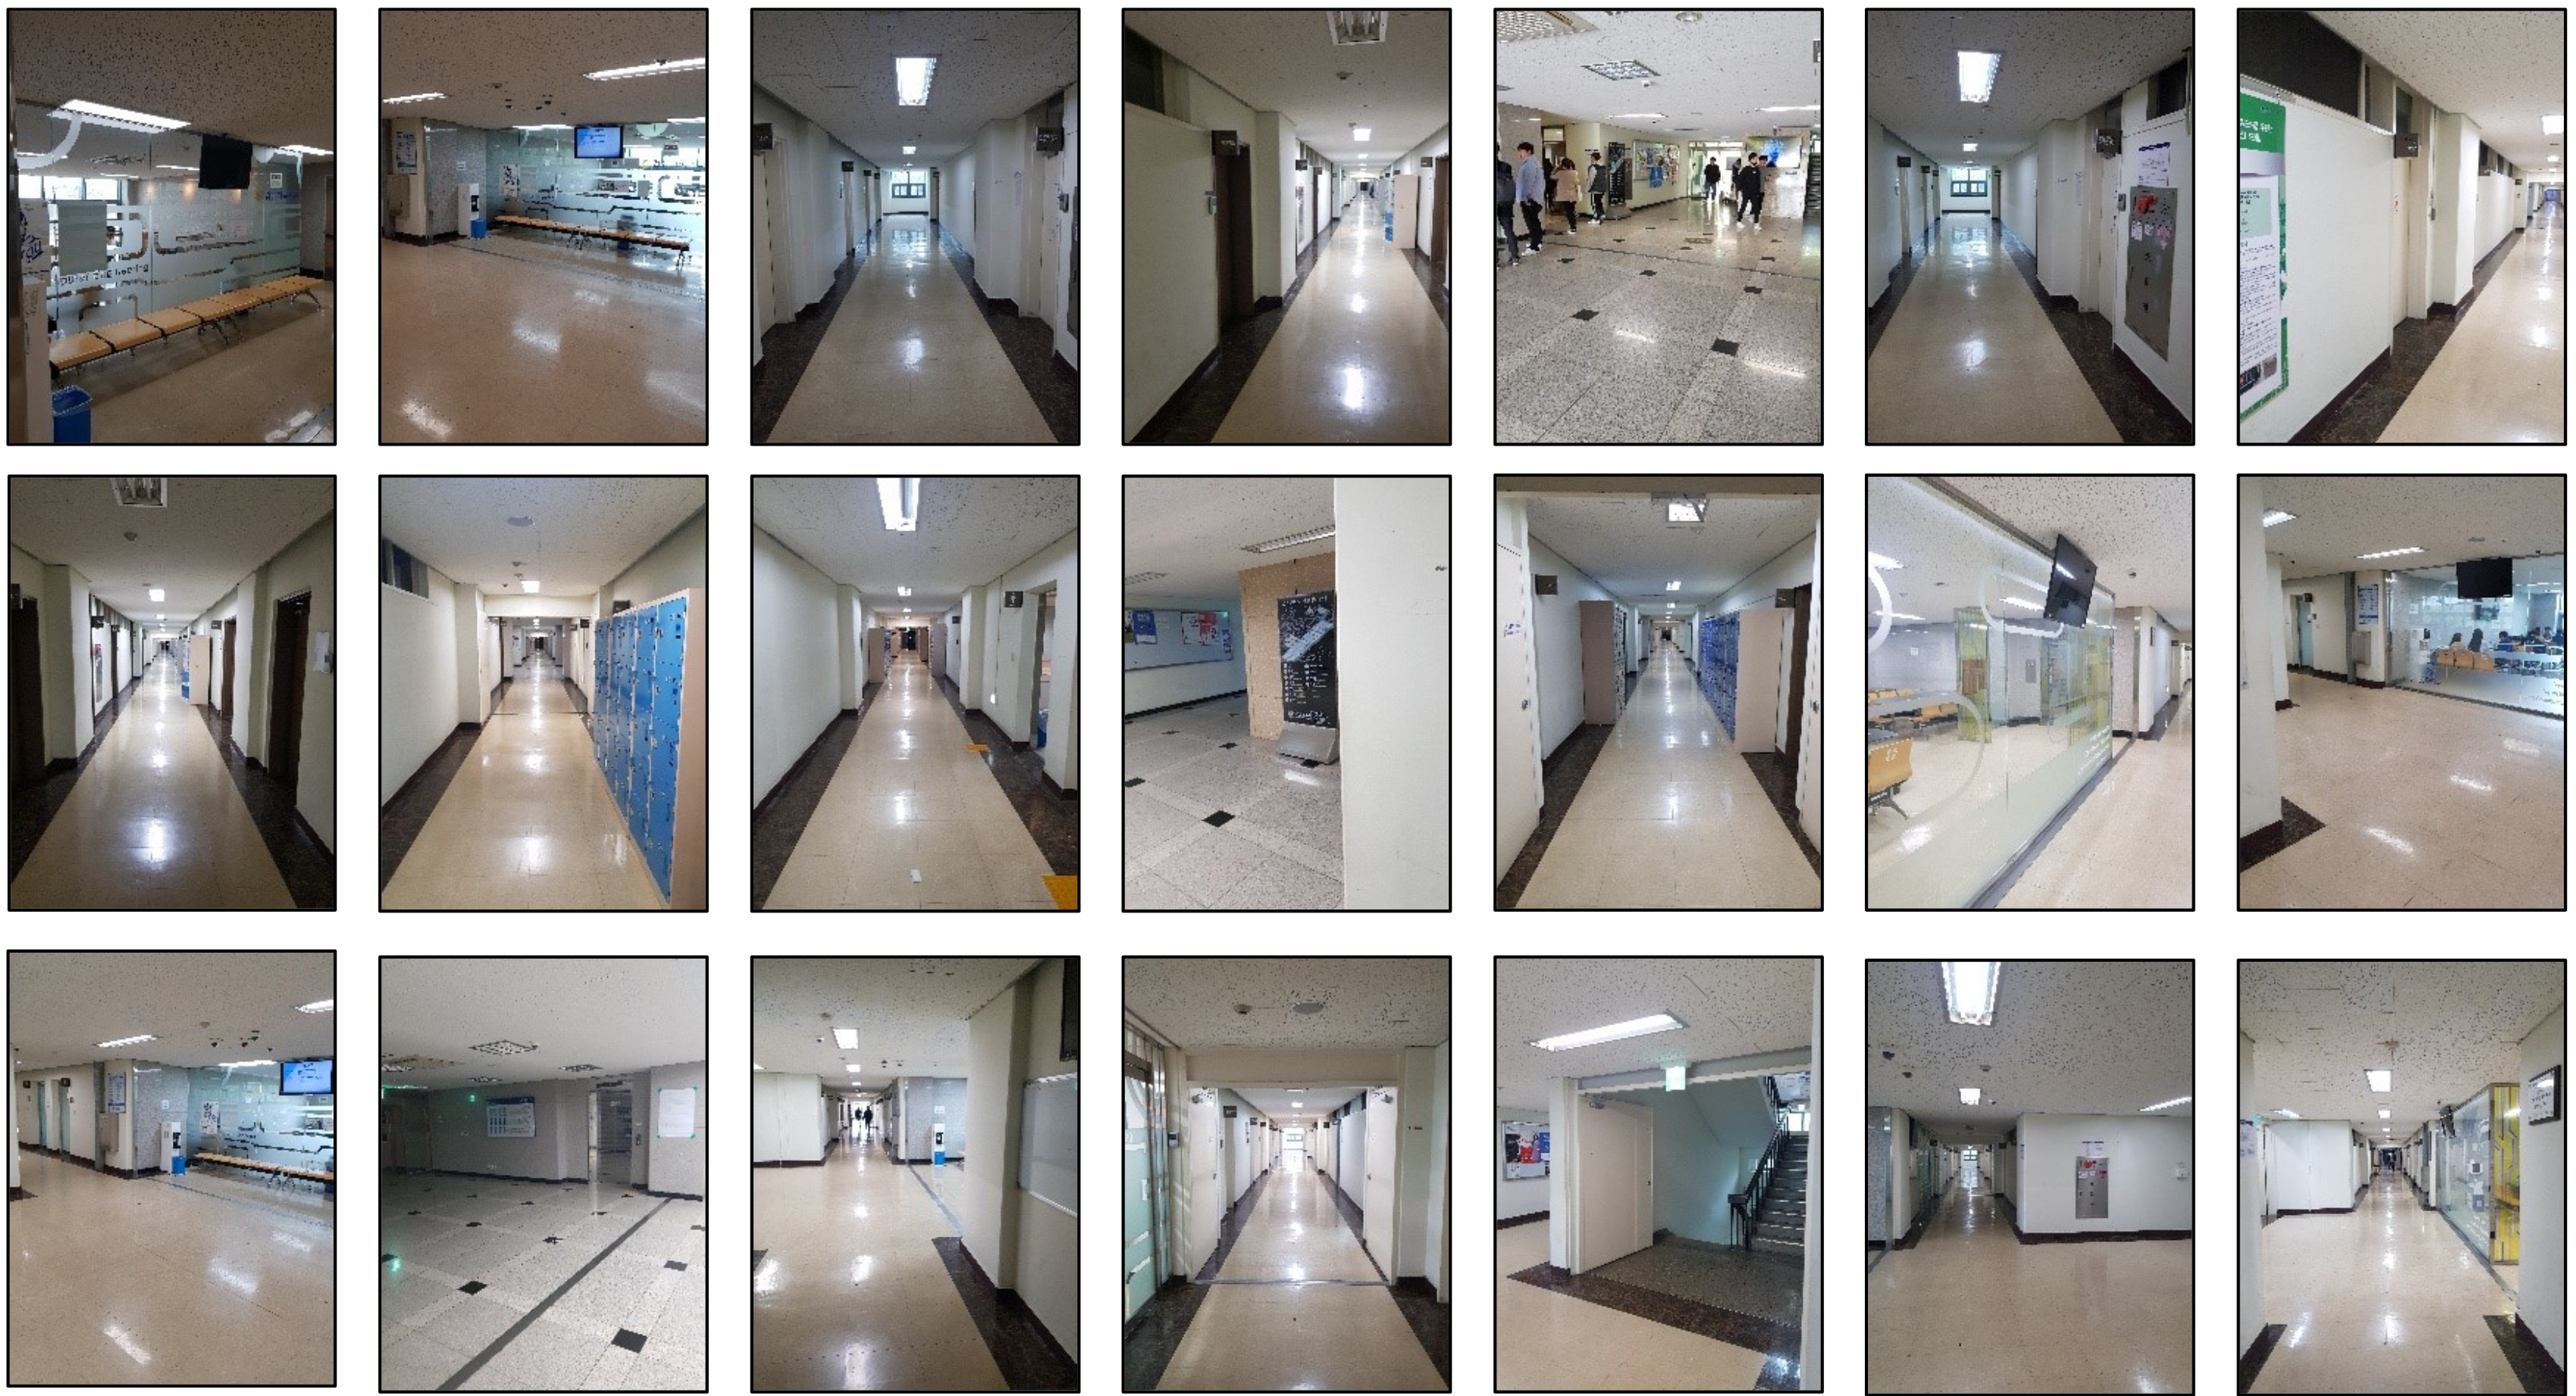
3.3. Data Collection

The data collection phase involves image capturing as well as magnetic field samples collection. Figure 3 shows the points where the camera images are captured. In addition, the scenes at different collection points are also shown. The images are captured using Samsung Galaxy S8 rear camera for this purpose. It is a 12 mega pixel Dual Pixel, F-1.7 aperture, 1.4-micron pixels optical image stabilization (OSI). Since Smartphone camera utilizes a potential amount of battery, hence camera images are used rather than the video. The images are labeled programmatically. A subroutine is defined wherein we feed the images of a collection point and its label. All images are labeled according to the given label. Since we have used our own model for training and CNN networks require a large amount of data for training purposes, 500 images at each collection point are captured. We use a total of 7500 images for all collection points. Owing to the fact that the user can hold the phone in different directions arbitrarily, the images are captured from slightly different angles. It is important to point out that the images are captured with slightly varying light conditions so that the trained network can predict in different light conditions. Each collection point index along with the floor number is used as its class to make labels, e.g., the first point to the left on floor 3 map will be labeled as P 310 for the training purpose. It will serve two purposes: The predicted label is first used to identify the floor the user is currently at, in order to load the respective magnetic fingerprint database. Secondly, it will be used to narrow the search space for the magnetic field based localization. The training requires a large amount of time depending on the volume of data used. We performed the training using Nvidia Titan X on an Intel i7 machine running with 16.0 GB random access memory. It takes approximately 3 to 4 h to finish the training process with the collected images.
The magnetic fingerprint database is also built during the data collection phase. Magnetic data is collected at specific points separated by a distance of 1 m. Magnetic samples are collected using Samsung Galaxy S8 and 100 samples are collected at each point. Later the collected data is normalized and spline interpolation is used to generate the intermediate values. We make the magnetic fingerprint database of the patterns formed by the magnetic values. As already pointed out that the magnetic value can be very different for different devices, so it is not possible to make one magnetic fingerprint database which can be used for various devices. However, research [8,37] pointed out as well as our experiments reveal that the patterns formed from magnetic values are very similar, so we use magnetic patterns instead of magnetic values. Figure 4 shows the magnetic data collection process to prepare the fingerprint database. The magnetic values are transformed into magnetic patterns using the algorithm proposed in [38]. For more details, readers are referred to [38].

3.4. Location Estimation

Location estimation is the online phase where the data from the user smartphone is utilized to predict his current location. It involves the phases of scene recognition using the trained CNN model and narrowing the database search space to calculate the final location of the user with the magnetic patterns database. The location estimation process is shown in Figure 5.

3.4.1. Scene Recognition

Scene recognition is done using the trained CNN classifier. The image from the user phone is captured and sent to the server for scene recognition. The captured image is pre-processed before scene recognition can be done. Preprocessing is an important task to improve the accuracy of an approach and various preprocessing techniques have been used in research [65] with hidden Markov model, support vector machines, etc. For example, research [66,67,68] uses silhouette preprocessing before generating features to produce body skeleton models. The produced models are then used for human tracking [69]. Similarly [70,71] have used depth silhouette from depth camera images for motion tracking. Preprocessing in our model involves changing the size of the image and color normalization. The size of the image is changed to 200 × 256 while the color is normalized for color range of [0 256]. We need only one image to identify the scene. It will save the phone battery which is substantially consumed while capturing images. During the training process, the images are captured at points as shown in Figure 3. The trained classifier presents the probability distribution for the scene images used during the training phase. We take the higher probability scene and use it for search space narrowing.
The recognized scene during the scene recognition phase is used to load the magnetic database of a specific floor. Since each scene is labeled with respect to its floor as well as a specific place, so, it can be used to identify which floor the user is at. Then the recognized scene is utilized to narrow down the search space in the magnetic database of that floor. The magnetic data can be very similar at different places on a floor which causes higher localization errors. Scene recognition helps in narrowing down the search space which will reduce the localization error.

3.4.2. Magnetic Localization

Localization is done using the proposed mKNN approach. Algorithm 1 is proposed which takes the recognized scene information and magnetic samples from user phone and estimates the user’s current location. The process followed in mKNN is described as well in Algorithm 1. We conduct the experiment in a three-story building, so the first task is to identify the floor of the user. This task is achieved with the recognized scene S r using CNN classifier. Once a specific floor is identified, the magnetic database M F l d b is loaded for the localization process. The second task of the recognized scene is to narrow down the search space. The recognized scene is employed to set the starting ( d b S ), and ending ( d b E ) of the magnetic database to match user magnetic samples ( M F S ) against the database. Magnetic samples occasionally contain random noise and slight fluctuations which are removed using a low pass filter. Euclidean distance is calculated between the processed magnetic sample and magnetic database using:
d E = 1 n i = 1 n ( M F S i M F i d b ) 2
where d E represents Euclidean distance between magnetic samples M F S 1 , , n and magnetic database M F 1 , , n d b . Later, K 1 number of location estimates ( L E ) are selected with the lowest d E , where K 1 is set to 11. The selected location estimates L E have two parameters: Calculated Euclidean distance and location in longitude and latitude dimension and are denoted as L E l o c , d i s . Initially selected location estimates are shown in Figure 6a, where the x and the y axis represent longitude and latitude, respectively, while the size of displayed locations shows the distance(error). The normal procedure of using KNN is to consider K neighbors and then calculate their centroid which serves as the predicted location. The neighbors are considered based on their distance(error) from the user sample. However, the neighbors can be very distant which increases the localization error. For example, if we look at Figure 6b we can see that the selected candidates based on distance do not form a spatial group and are separated distantly. The calculated centroid will be far away from the ground truth in this case.
Algorithm 1: Find user location
Input: Recognized scene information ( S R ) & magnetic samples ( M F S )
Output: User’s estimated location ( L p )
 1: identify floor using S r
 2: load magnetic database M F l d b
 3: set d b S , and d b E                 // Set the search space for database
 4: for h 1   t o   2 do
 5: for i d b S   t o   d b E do
 6:   d E c a l E u c D i s ( M F S , M F l d b ;
 7: end for
 8:  ( L E l o c , d i s ) f i n d C a n d i d a t e s ( K 1 , d E )    // K 1 denotes number of neighbors
 9: for j 1   t o   l e n g t h ( k 1 ) do
 10:   W L E c a l W e i g h t ( L E l o c , d i s ) ;
 11: end for
 12:  f L E f i l L o c E s t ( K 2 , W L E ) ;
 13:  L p m e a n ( f L E ) ;
 14: end for
We follow a different approach and calculate weights ( W L E ) for each L E which has initially been selected based on the distance(error) alone. The weight W L E is calculated using:
W L E i = 0.5 d E i + 0.5 m i n ( d S i )
where:
d S i = | | L E i L E i + 1 , , n 1 | |
The term d S i denotes the spatial distance of L E i to all other L E which are initially selected. Equation (4) shows that the inverse proportional of d S i is taken which implies that the closer the two location candidates are the higher the weight is and vice versa. So, we consider the Euclidean distance of location candidates from the user sample, as well as, the spatial closeness of location candidates. The intuition is that the spatially closer the location candidates are, the higher the probability is to find the accurate user location as shown in Figure 6c. Then K 2 number of filtered location candidates are selected where K 2 is set to 7. The value for K 1 is set higher so that we can initially get location estimates and later filter them to select the best among them using the calculated weight W L E . We follow the same procedure and Figure 6d shows the results for KNN and mKNN. The results show that mKNN can estimate a more accurate location of the user than that of KNN.
We use two consecutive frames to calculate user current location following the same procedure. So, the location calculated from the first frame serves as the starting point for the pedestrian dead reckoning (PDR). After that EKF is applied to the locations that we get from PDR and the magnetic database. PDR involves the distance calculation traveled by the user and the heading estimation h. The distance calculation is done using step count S c in a particular frame and step length S l estimation. Step detection and heading estimation are calculated using the algorithm proposed in [38] which is based on peak detection in accelerometer data. Before peak detection, the data is preprocessed with a low pass filter to remove noise. Once step detection has been performed, step length of ith step S l i is measured using Weinberg model [72]:
S l i = a m a x i a m i n i c
where a m a x i , and a m i n i represent the maximum and minimum acceleration of ith step, respectively, while c is the step constant. Step constant c is calculated in the calibration process and depends upon the height and step length of a user. Once the step count S c , step length S l , and heading h are found, current location is calculated:
x i = x i 1 + S c S l i c o s ( h )
y i = y i 1 + S c S l i s i n ( h )

3.5. Evaulation

The accuracy evaluation of scene recognitioin involves the comparison of results from the proposed approach to other approaches. For this purpose a variety of techniques can be exploited, e.g., hidden markov model (HMM), embedded HMM, support vector machines (SVM), etc. [65,73,74,75,76]. SVM, developed by Cortes and Vapnik [77] is one of the powerful machine learning techniques to perform classification. It divides the hyper-plane optimally so that to maximize the distance between the classes [78]. Various kernel types can be used with SVM including radial, polynomial, neural, etc. We used radial basis function as kernel to train SVM. Gamma is set to 0.0001 which is the parameter of a Gaussian Kernel for non-linear SVM classification.
The evaluation of localization approach is performed using multiple techniques. KNN is the most widely used technique in localization systems. We evaluate the accuracy of our localization module by comparing it with KNN results. Since we have modified KNN approach, so it is more logical to compare it to KNN than any other technique. However, we are using magnetic fingerprint (MFP) with scene information and without scene information to analyze the impact of scene recognition on localization accuracy. MFP involves taking the user sent magnetic sample and match it against the magnetic fingerprint database to calculate the Euclidean distance. Minimum Euclidean distance represents the user’s current location. Using scene information, MFP technique loads only the narrowed magnetic database; however, full magnetic database is used as search space when scene information is not available.

4. Experiment and Results

This section contains the description of the setup and experiments conducted to evaluate the accuracy of the proposed approach. The results from CNN classifier and localization process are discussed separately.

4.1. Experiment Setup

The experiments are conducted in a three-story building of Yeungnam University whose dimensions are 90 × 36 m2 for each floor. Figure 7 shows the area used to conduct the experiments. The localization path is different for each floor and so do the image collection points. The area contains three types of spaces: Area surrounded by walls at a distance of roughly 2 m, the area having a glass at the boundaries, and the wide area where walls are at a distance of 5 to 6 m on each side. Figure 8 contains a few indoor scenes from the building where the experiment is performed. The ground truths are manually marked on the ground and measured by both lasers as well as the measuring tape.
The camera images are captured during different time of the day and lighting conditions may vary slightly. The smartphone is held in front of the user to collect the data. The magnetic data are collected with Samsung smartphone SM-G950N (Galaxy S8) to make the fingerprint database. Galaxy S8 contains a 3-axis magnetometer (AK09916C) which provides the magnetic M x , M y , and M z values [79]. Total magnetic field intensity is calculated as:
F = M x 2 + M y 2 + M z 2
Galaxy S8 contains 3-axis accelerometer (LSM6DSL) and gyroscope sensors (LSM6DSL) [80]. The magnetic database is built using three components of magnetic field including M x , M y , and M z . While magnetic field has a total of seven components but not all of them are suitable to make a fingerprint. For example, declination (D), and inclination (I) of the magnetic field are angles which are vulnerable to sudden abrupt movements of the smartphone. The data are collected over a sampling rate of 10 Hz from magnetometer, accelerometer, and gyroscope. The magnetic database is built using Galaxy S8 while the testing is performed using two devices: Galaxy S8 and LG G6 (LGM-G600L).

4.2. CNN Classifier Performance

The trained CNN classifier is used to recognize the indoor scene during the evaluation process. During the training process, we used accuracy and validation accuracy to evaluate the model. The model achieved a 99.13% training accuracy while the validation accuracy is 96.22%. Figure 9 shows the loss and accuracy of CNN model during the training process. For each scene, 200 images are tested to evaluate the performance of CNN classifier. Images are re-sized to 200 × 266 dimension and normalized for color range of [0 255]. Testing images are collected using Galaxy S8 and LG G6 to perform the evaluation. Images are captured from different angles and during different time of the day. So the collected images may vary slightly with respect to the lighting conditions of the environment. The reported testing accuracy of CNN classifier is 91.04%.
Accuracy of CNN is compared with the accuracy of SVM for scene recognition. SVM achieve a testing accuracy of 83.17% for scene recognition. Table 1 shows the statistics for each class.

4.3. Performance of Indoor Localization

This section contains the results for indoor localization using the proposed mKNN approach. The performance of mKNN is compared with KNN for localization. The localization process involves three steps: Indoor scene recognition, magnetic database search space narrowing, and localization. Indoor scene recognition is performed with the trained CNN classifier as described in Section 4.2. The recognized scene is then used to load the magnetic database of the recognized floor and narrow down the search space. It divides the magnetic database into a sub-database where only the recognized scene area is searched for the possible match(es) between the user magnetic sample and magnetic database.
KNN involves the matching of a sample against the database and finding K number of candidates which have the lowest error. The selected K candidates are later used to calculate the centroid which serves as the predicted location of the user. We followed the same process for our mKNN as explained in Algorithm 1; however, we used the concept of ‘weight’ which is calculated using the error of each candidate as well as its minimum spatial distance to its neighbors. It helps to mitigate higher errors.
We take user captured images from his smartphone and later same procedure is used to predict his location with KNN and mKNN. The value of K is same for KNN and mKNN which is 7. However, for mKNN, we initially set K to 11 and then select 7 candidates based on their calculated weights. The localization is performed on three floors and Figure 10 shows the results for KNN and mKNN. Table 2 displays the statistics for KNN and mKNN to show their localization performance.
The results shown in Figure 10 demonstrate that the proposed mKNN performs better than that of KNN to locate a person indoor. The results are better for both Galaxy S8 and LG G6. Another noteworthy point is the analogous performance by Galaxy S8 and LG G6. The use of magnetic patterns over magnetic intensity helps to mitigate the device dependence. While the magnetic database is built using Galaxy S8, yet, the localization performance of LG G6 is very similar to Galaxy S8. The lower errors are on account of scene recognition and magnetic pattern matching. We can see that the results for MFS-S8 with scene information are higher than those of pattern matching. When different smartphones are used the magnetic data intensity is different owing to the sensitivity of the installed magnetometer of the smartphone. However, the patterns formed by magnetic intensity of these smartphones are very much similar. Scene recognition shrinks the magnetic database and thus reduces the localization error. If the scene information is not used for localization, the errors are very high as shown in Figure 10b. Similarly the mean, 50% and 75% errors are very high when MFS is used without scene recognition using different devices. Additionally, since the database is built using Galaxy S8, the maximum as well mean errors are higher for LG G6 using MFP without scene information. Table 2 shows that the mean error with KNN is 1.86 m and 1.40 m for LG G6 and Galaxy S8 smartphones, respectively. However, the proposed modified technique outperforms KNN and the mean error is 1.46 m for LG G6 while Galaxy S8 mean error is 1.15 m. Even though the same localization process is followed for KNN and mKNN and the same value of K is used, yet the accuracy is improved with mKNN. The user can be located within 1.08 m at 50 percent with mKNN irrespective of the smartphone used for localization. Indoor scene recognition helps to achieve the low localization error, as, without scene recognition the magnetic database search space is large which results in higher error.

5. Discussion

In this research, We present an indoor localization approach which uses a smartphone based multi-sensor fusion to locate a pedestrian indoors. The proposed approach is tested on Galaxy S8 and LG G6 to show its device independence. We have presented a deep learning based convolutional neural network (CNN) to recognize the indoor scene. CNN achieves a prediction accuracy of 91.04% for scene recognition. The recognized scene is further used to narrow down the search space in a magnetic database which is used for localization. We introduced a modified K nearest neighbor (mKNN) approach for indoor localization as well. The KNN approach experiences higher errors when used with magnetic database due to the magnetic signature similarity at various locations. Contrary to KNN which utilizes only the similarity of user sample and magnetic database, mKNN takes into account both similarity as well as spatial closeness to perform the localization. The mKNN along with the scene recognition model helps to achieve a higher localization accuracy. A multi-sensor fusion approach is used to refine the localization accuracy. Pedestrian dead reckoning (PDR) data is used to this end. Location calculated from magnetic database is fused with PDR location using an extended Kalman filter (EKF). The proposed approach is able to achieve an accuracy of 1.08 m irrespective of the smartphone used for localization. The approach shows a similar performance using two different devices, i.e., Galaxy S8, and LG G6. Two important factors evaluated in this study are: Impact of using magnetic patterns rather than the magnetic intensity on heterogeneous devices and role of scene recognition to improve the localization accuracy. For first factor, we perform localization with magnetic patterns, and MFP technique and compare their performance. MFP is affected when different smartphones are used while magnetic patterns show very small change in localization accuracy when different smartphones are used. The impact of scene recognition is analyzed by performing localization without the scene information. Results demonstrate that without scene recognition the mean error increases by a factor of 10.03 and 10.62 for Galaxy S8 and LG G6, respectively. So both scene recognition and magnetic patterns play very important role to increase the localization accuracy. In any case, image based scene recognition is vulnerable to bad light conditions and camera image resolution which can limit its full functionality.
The proposed approach is energy efficient as well, as it does not use Wi-Fi data for localization, and relies on a single image to recognize the indoor scene. The labor survey can be reduced by adopting the crowdsourcing based data collection to build the magnetic database. The crowdsourcing can also help to increase the image training data for CNN classifier as well. Our future work includes the adoption of the proposed approach for localization in complicated environments including shopping malls, and train stations, etc. Scene recognition under varying light conditions is under research as well.

6. Conclusions

This work proposes a multi-sensor indoor localization approach which works on different smartphones in a similar fashion. The magnetic data from the smartphone magnetometer is utilized to make the database; however, instead of magnetic field values, magnetic patterns are used to achieve device dependence. Since the magnetic signature similarity in the indoor environment may lead to higher errors, the database search space is narrowed down using a scene recognition classifier. A deep learning based convolutional neural network (CNN) classifier is used for scene recognition. A modified K nearest neighbor (mKNN) is presented which considers magnetic signature similarity, as well as the spatial closeness of selected candidates. The results demonstrate that mKNN improves the localization accuracy and locates a person within 1.08 m at 50% irrespective of the smartphone used for localization. We aim to reduce the labor time by adopting the crowdsourcing-based data collection and extend the approach to test more complicated environments. Scene recognition is affected by camera image resolution and it is computationally complex. Similarly, varying light conditions, dark environments or scene recognition in low light conditions can severely limit its performance. We intend to research scene recognition under low light conditions in the future. The current study does not consider different orientations of smartphone and we intend to work with various orientations in the future.

Author Contributions

Conceptualization, I.A. and Y.P.; Data curation, S.H.; Funding acquisition, Y.P.; Methodology, I.A.; Software, S.H.; Writing—original draft, I.A.; Writing—review & editing, Y.P.

Funding

This research was supported by the SK Telecom, Korea. This work was supported by the Brain Korea 21 Plus Program (No. 22A20130012814) funded by the National Research Foundation of Korea (NRF). This research was supported by Basic Science Research Program through the National Research Foundation of Korea (NRF) funded by the Ministry of Science, ICT and Future Planning (2017R1E1A1A01074345).

Conflicts of Interest

The authors declare no conflict of interest. The funders had no role in the design of the study; in the collection, analyses, or interpretation of data; in the writing of the manuscript, or in the decision to publish the results.

References

  1. Yuan, Y.; Mou, L.; Lu, X. Scene recognition by manifold regularized deep learning architecture. IEEE Trans. Neural Netw. Learn. Syst. 2015, 26, 2222–2233. [Google Scholar] [CrossRef] [PubMed]
  2. Arandjelovic, R.; Gronat, P.; Torii, A.; Pajdla, T.; Sivic, J. NetVLAD: CNN architecture for weakly supervised place recognition. In Proceedings of the IEEE Conference on Computer Vision and Pattern Recognition, Las Vegas, NV, USA, 27–30 June 2016; pp. 5297–5307. [Google Scholar]
  3. Herranz, L.; Jiang, S.; Li, X. Scene recognition with CNNs: Objects, scales and dataset bias. In Proceedings of the IEEE Conference on Computer Vision and Pattern Recognition, Las Vegas, NV, USA, 27–30 June 2016; pp. 571–579. [Google Scholar]
  4. Shang, J.; Hu, X.; Gu, F.; Wang, D.; Yu, S. Improvement schemes for indoor mobile location estimation: A survey. Math. Probl. Eng. 2015, 2015, 32. [Google Scholar] [CrossRef]
  5. Ashraf, I.; Hur, S.; Park, Y. BLocate: A building identification scheme in GPS denied environments using smartphone sensors. Sensors 2018, 18, 3862. [Google Scholar] [CrossRef] [PubMed]
  6. Zhang, C.; Subbu, K.P.; Luo, J.; Wu, J. GROPING: Geomagnetism and crowdsensing powered indoor navigation. IEEE Trans. Mob. Comput. 2015, 14, 387–400. [Google Scholar] [CrossRef]
  7. Ashraf, I.; Hur, S.; Park, Y. Floor identification using magnetic field data with smartphone sensors. Sensors 2019, 19, 2538. [Google Scholar] [CrossRef]
  8. Shu, Y.; Bo, C.; Shen, G.; Zhao, C.; Li, L.; Zhao, F. Magicol: Indoor localization using pervasive magnetic field and opportunistic WiFi sensing. IEEE J. Sel. Areas Commun. 2015, 33, 1443–1457. [Google Scholar] [CrossRef]
  9. Ashraf, I.; Hur, S.; Park, Y. MDIRECT-Magnetic field strength and peDestrIan dead RECkoning based indoor localizaTion. In Proceedings of the 2018 International Conference on Indoor Positioning and Indoor Navigation (IPIN), Nantes, France, 24–27 September 2018; pp. 24–27. [Google Scholar]
  10. Ashraf, I.; Hur, S.; Shafiq, M.; Kumari, S.; Park, Y. GUIDE: Smartphone sensors based pedestrian indoor localization with heterogeneous devices. Int. J. Commun. Syst. 2019, 19, 4062. [Google Scholar] [CrossRef]
  11. Girshick, R.; Donahue, J.; Darrell, T.; Malik, J. Rich feature hierarchies for accurate object detection and semantic segmentation. In Proceedings of the IEEE Conference on Computer Vision and Pattern Recognition, Washington, DC, USA, 24–27 June 2014; pp. 580–587. [Google Scholar]
  12. Arandjelović, R.; Zisserman, A. DisLocation: Scalable descriptor distinctiveness for location recognition. In Asian Conference on Computer Vision; Springer: Berlin, Germany, 2014; pp. 188–204. [Google Scholar]
  13. Sattler, T.; Leibe, B.; Kobbelt, L. Fast image-based localization using direct 2d-to-3d matching. In Proceedings of the 2011 International Conference on Computer Vision, Barcelona, Spain, 6–13 November 2011; pp. 667–674. [Google Scholar]
  14. Sermanet, P.; Eigen, D.; Zhang, X.; Mathieu, M.; Fergus, R.; LeCun, Y. Overfeat: Integrated recognition, localization and detection using convolutional networks. arXiv 2013, arXiv:1312.6229. [Google Scholar]
  15. Sünderhauf, N.; Shirazi, S.; Jacobson, A.; Dayoub, F.; Pepperell, E.; Upcroft, B.; Milford, M. Place recognition with convnet landmarks: Viewpoint-robust, condition-robust, training-free. In Proceedings of the Robotics: Science and Systems XII, Berkeley, CA, USA, 13–17 July 2015. [Google Scholar]
  16. Uddin, M.T.; Uddiny, M.A. Human activity recognition from wearable sensors using extremely randomized trees. In Proceedings of the 2015 International Conference on Electrical Engineering and Information Communication Technology (ICEEICT), Jahangirnagar, Bengal, 21–23 May 2015; pp. 1–6. [Google Scholar]
  17. Jalal, A.; Kim, J.T.; Kim, T.S. Human activity recognition using the labeled depth body parts information of depth silhouettes. In Proceedings of the 6th International Symposium on Sustainable Healthy Buildings, Seoul, Korea, 10–13 August 2012; Volume 27. [Google Scholar]
  18. Jalal, A.; Uddin, M.Z.; Kim, J.T.; Kim, T.S. Daily Human Activity Recognition Using Depth Silhouettes and\mathcal {R} Transformation for Smart Home. In International Conference on Smart Homes and Health Telematics; Springer: Berlin, Germany, 2011; pp. 25–32. [Google Scholar]
  19. Ahad, M.A.R.; Kobashi, S.; Tavares, J.M.R. Advancements of image processing and vision in healthcare. J. Healthc. Eng. 2018, 2018, 3. [Google Scholar] [CrossRef]
  20. Jalal, A.; Sarif, N.; Kim, J.T.; Kim, T.S. Human activity recognition via recognized body parts of human depth silhouettes for residents monitoring services at smart home. Indoor Built Environ. 2013, 22, 271–279. [Google Scholar] [CrossRef]
  21. Jalal, A.; Quaid, M.A.K.; Hasan, A.S. Wearable Sensor-Based Human Behavior Understanding and Recognition in Daily Life for Smart Environments. In Proceedings of the 2018 International Conference on Frontiers of Information Technology (FIT), Islamabad, Pakistan, 17–19 December 2018; pp. 105–110. [Google Scholar]
  22. Jalal, A.; Uddin, I. Security architecture for third generation (3G) using GMHS cellular network. In Proceedings of the 2007 International Conference on Emerging Technologies, Islamabad, Pakistan, 12–13 November 2007; pp. 74–79. [Google Scholar]
  23. Kendall, A.; Grimes, M.; Cipolla, R. Posenet: A convolutional network for real-time 6-dof camera relocalization. In Proceedings of the IEEE International Conference on Computer Vision, Santiago, Chile, 7–13 December 2015; pp. 2938–2946. [Google Scholar]
  24. Boutell, M.; Luo, J. Bayesian fusion of camera metadata cues in semantic scene classification. In Proceedings of the 2004 IEEE Computer Society Conference on Computer Vision and Pattern Recognition, Washington, DC, USA, 27 June–2 July 2004; Volume 2. [Google Scholar]
  25. Wang, Y.; Jodoin, P.M.; Porikli, F.; Konrad, J.; Benezeth, Y.; Ishwar, P. CDnet 2014: An expanded change detection benchmark dataset. In Proceedings of the IEEE Conference on Computer Vision and Pattern Recognition Workshops, Boston, MA, USA, 7–12 June 2014; pp. 387–394. [Google Scholar]
  26. Procházka, A.; Kolinova, M.; Fiala, J.; Hampl, P.; Hlavaty, K. Satellite image processing and air pollution detection. In Proceedings of the 2000 IEEE International Conference on Acoustics, Speech, and Signal Processing, Istanbul, Turkey, 5–9 June 2000; Volume 4, pp. 2282–2285. [Google Scholar]
  27. Siagian, C.; Itti, L. Rapid biologically-inspired scene classification using features shared with visual attention. IEEE Trans. Pattern Anal. Mach. Intell. 2007, 29, 300–312. [Google Scholar] [CrossRef] [PubMed]
  28. Chen, I.K.; Chi, C.Y.; Hsu, S.L.; Chen, L.G. A real-time system for object detection and location reminding with rgb-d camera. In Proceedings of the 2014 IEEE International Conference on Consumer Electronics (ICCE), Las Vegas, NV, USA, 10–13 January 2014; pp. 412–413. [Google Scholar]
  29. Jalal, A.; Kim, Y.; Kim, D. Ridge body parts features for human pose estimation and recognition from RGB-D video data. In Proceedings of the Fifth International Conference on Computing, Communications and Networking Technologies (ICCCNT), Hefei, China, 11–13 July 2014; pp. 1–6. [Google Scholar]
  30. Kamal, S.; Jalal, A.; Kim, D. Depth images-based human detection, tracking and activity recognition using spatiotemporal features and modified HMM. J. Electr. Eng. Technol. 2016, 11, 1921–1926. [Google Scholar] [CrossRef]
  31. Jalal, A.; Kim, J.T.; Kim, T.S. Development of a life logging system via depth imaging-based human activity recognition for smart homes. In Proceedings of the International Symposium on Sustainable Healthy Buildings, Seoul, Korea, 10 February 2012; Volume 19. [Google Scholar]
  32. Fonseca, L.M.G.; Namikawa, L.M.; Castejon, E.F. Digital image processing in remote sensing. In Proceedings of the 2009 Tutorials of the XXII Brazilian Symposium on Computer Graphics and Image Processing, Rio de Janeiro, Brazil, 11–14 October 2009; pp. 59–71. [Google Scholar]
  33. Zhou, B.; Lapedriza, A.; Khosla, A.; Oliva, A.; Torralba, A. Places: A 10 million image database for scene recognition. IEEE Trans. Pattern Anal. Mach. Intell. 2018, 40, 1452–1464. [Google Scholar] [CrossRef] [PubMed]
  34. Han, M.; Li, S.; Wan, X.; Liu, G. Scene recognition with convolutional residual features via deep forest. In Proceedings of the 2018 IEEE 3rd International Conference on Image, Vision and Computing (ICIVC), Chongqing, China, 27–29 June 2018; pp. 178–182. [Google Scholar]
  35. Lacerda, A.; Nascimento, E.R. A Robust Indoor Scene Recognition Method Based on Sparse Representation. In Progress in Pattern Recognition, Image Analysis, Computer Vision, and Applications: 22nd Iberoamerican Congress, CIARP 2017, Valparaíso, Chile, 7–10 November 2017; Springer: Berlin, Germany, 2018; Volume 10657, p. 408. [Google Scholar]
  36. Li, L.; Hu, P.; Peng, C.; Shen, G.; Zhao, F. Epsilon: A visible light based positioning system. In Proceedings of the 11th {USENIX} Symposium on Networked Systems Design and Implementation ({NSDI} 14), Seattle, WA, USA, 2–4 April 2014; pp. 331–343. [Google Scholar]
  37. Subbu, K.P.; Gozick, B.; Dantu, R. LocateMe: Magnetic-fields-based indoor localization using smartphones. ACM Trans. Intell. Syst. Technol. (TIST) 2013, 4, 73. [Google Scholar] [CrossRef]
  38. Ashraf, I.; Hur, S.; Park, Y. mPILOT-magnetic field strength based pedestrian indoor localization. Sensors 2018, 18, 2283. [Google Scholar] [CrossRef] [PubMed]
  39. Sánchez, J.; Perronnin, F.; Mensink, T.; Verbeek, J. Image classification with the fisher vector: Theory and practice. Int. J. Comput. Vis. 2013, 105, 222–245. [Google Scholar] [CrossRef]
  40. Koskela, M.; Laaksonen, J. Convolutional network features for scene recognition. In Proceedings of the 22nd ACM International Conference on Multimedia; ACM: New York, NY, USA, 2014; pp. 1169–1172. [Google Scholar]
  41. Zhang, Y.; Ma, L.; Tan, X. Smart phone camera image localization method for narrow corridors based on epipolar geometry. In Proceedings of the 2016 International Wireless Communications and Mobile Computing Conference (IWCMC), Paphos, Cyprus, 5–9 September 2016; pp. 660–664. [Google Scholar]
  42. Hu, Z.; Huang, G.; Hu, Y.; Yang, Z. WI-VI fingerprint: WiFi and vision integrated fingerprint for smartphone-based indoor self-localization. In Proceedings of the 2017 IEEE International Conference on Image Processing (ICIP), Beijing, China, 17–20 September 2017; pp. 4402–4406. [Google Scholar]
  43. Farooq, A.; Jalal, A.; Kamal, S. Dense RGB-D map-based human tracking and activity recognition using skin joints features and self-organizing map. KSII Trans. Int. Inf. Syst. (TIIS) 2015, 9, 1856–1869. [Google Scholar]
  44. Kamal, S.; Jalal, A. A hybrid feature extraction approach for human detection, tracking and activity recognition using depth sensors. Arab. J. Sci. Eng. 2016, 41, 1043–1051. [Google Scholar] [CrossRef]
  45. Jalal, A.; Kim, S. Global security using human face understanding under vision ubiquitous architecture system. World Acad. Sci. Eng. Technol. 2006, 13, 7–11. [Google Scholar]
  46. Yoshimoto, H.; Date, N.; Yonemoto, S. Vision-based real-time motion capture system using multiple cameras. In Proceedings of the IEEE International Conference on Multisensor Fusion and Integration for Intelligent Systems, MFI2003, Crete, Greece, 30 July–1 August 2003; pp. 247–251. [Google Scholar]
  47. Huang, Q.; Yang, J.; Qiao, Y. Person re-identification across multi-camera system based on local descriptors. In Proceedings of the 2012 Sixth International Conference on Distributed Smart Cameras (ICDSC), Hong Kong, China, 30 October–2 November 2012; pp. 1–6. [Google Scholar]
  48. Jalal, A.; Shahzad, A. Multiple facial feature detection using vertex-modeling structure. In Proceedings of the IEEE Conference on Interactive Computer Aided Learning, Villach, Austria, 26–28 September 2007; Volume 2628. [Google Scholar]
  49. Xu, H.; Yang, Z.; Zhou, Z.; Shangguan, L.; Yi, K.; Liu, Y. Enhancing wifi-based localization with visual clues. In Proceedings of the 2015 ACM International Joint Conference on Pervasive and Ubiquitous Computing, Osaka, Japan, 7–11 September 2015; pp. 963–974. [Google Scholar]
  50. Hu, X.; Shang, J.; Gu, F.; Han, Q. Improving Wi-Fi indoor positioning via AP sets similarity and semi-supervised affinity propagation clustering. Int. J. Distrib. Sens. Netw. 2015, 11, 109642. [Google Scholar] [CrossRef]
  51. Wang, X.; Gao, L.; Mao, S.; Pandey, S. CSI-based fingerprinting for indoor localization: A deep learning approach. IEEE Trans. Veh. Technol. 2017, 66, 763–776. [Google Scholar] [CrossRef]
  52. Nowicki, M.; Wietrzykowski, J. Low-effort place recognition with WiFi fingerprints using deep learning. In International Conference Automation; Springer: Berlin, Germany, 2017; pp. 575–584. [Google Scholar]
  53. Dong, J.; Xiao, Y.; Noreikis, M.; Ou, Z.; Ylä-Jääski, A. imoon: Using smartphones for image-based indoor navigation. In Proceedings of the 13th ACM Conference on Embedded Networked Sensor Systems, Seoul, Korea, 1–4 November 2015; pp. 85–97. [Google Scholar]
  54. Gu, F.; Niu, J.; Duan, L. Waipo: A fusion-based collaborative indoor localization system on smartphones. IEEE/ACM Trans. Netw. 2017, 25, 2267–2280. [Google Scholar] [CrossRef]
  55. Sun, L.; Zheng, Z.; He, T.; Li, F. Multifloor Wi-Fi localization system with floor identification. Int. J. Distrib. Sens. Netw. 2015, 11, 131523. [Google Scholar] [CrossRef]
  56. Bitew, M.A.; Hsiao, R.S.; Lin, H.P.; Lin, D.B. Hybrid indoor human localization system for addressing the issue of RSS variation in fingerprinting. Int. J. Distrib. Sens. Netw. 2015, 11, 831423. [Google Scholar] [CrossRef]
  57. Bensky, A. Wireless Positioning Technologies and Applications; Artech House: Norwood, MA, USA, 2016. [Google Scholar]
  58. Zafari, F.; Gkelias, A.; Leung, K. A survey of indoor localization systems and technologies. arXiv 2017, arXiv:1709.01015. [Google Scholar] [CrossRef]
  59. Stats, S.C.G. Mobile OS Market Share. 2019. Available online: http://gs.statcounter.com/os-market-share/mobile/worldwide (accessed on 5 June 2019).
  60. Lee, N.; Han, D. Magnetic indoor positioning system using deep neural network. In Proceedings of the 2017 International Conference on Indoor Positioning and Indoor Navigation (IPIN), Sapporo, Japan, 18–21 September 2017; pp. 1–8. [Google Scholar]
  61. Liu, M.; Chen, R.; Li, D.; Chen, Y.; Guo, G.; Cao, Z.; Pan, Y. Scene recognition for indoor localization using a multi-sensor fusion approach. Sensors 2017, 17, 2847. [Google Scholar] [CrossRef]
  62. Zhu, Y.; Ouyang, Q.; Mao, Y. A deep convolutional neural network approach to single-particle recognition in cryo-electron microscopy. BMC Bioinform. 2017, 18, 348. [Google Scholar] [CrossRef]
  63. Hinton, G.E.; Srivastava, N.; Krizhevsky, A.; Sutskever, I.; Salakhutdinov, R.R. Improving neural networks by preventing co-adaptation of feature detectors. arXiv 2012, arXiv:1207.0580. [Google Scholar]
  64. Bishop, C.M. Pattern Recognition and Machine Learning; Springer: Berlin, Germany, 2006. [Google Scholar]
  65. Piyathilaka, L.; Kodagoda, S. Gaussian mixture based HMM for human daily activity recognition using 3D skeleton features. In Proceedings of the 2013 IEEE 8th Conference on Industrial Electronics and Applications (ICIEA), Melbourne, Australia, 19–21 June 2013; pp. 567–572. [Google Scholar]
  66. Jalal, A.; Kamal, S.; Kim, D. A depth video sensor-based life-logging human activity recognition system for elderly care in smart indoor environments. Sensors 2014, 14, 11735–11759. [Google Scholar] [CrossRef]
  67. Jalal, A.; Kim, Y.H.; Kim, Y.J.; Kamal, S.; Kim, D. Robust human activity recognition from depth video using spatiotemporal multi-fused features. Pattern Recognit. 2017, 61, 295–308. [Google Scholar] [CrossRef]
  68. Jalal, A.; Kamal, S.; Kim, D. Shape and motion features approach for activity tracking and recognition from kinect video camera. In Proceedings of the 2015 IEEE 29th International Conference on Advanced Information Networking and Applications Workshops, Gwangju, Korea, 24–27 March 2015; pp. 445–450. [Google Scholar]
  69. Jalal, A.; Kim, Y. Dense depth maps-based human pose tracking and recognition in dynamic scenes using ridge data. In Proceedings of the 2014 11th IEEE International Conference on Advanced Video and Signal Based Surveillance (AVSS), Seoul, Korea, 26–29 August 2014; pp. 119–124. [Google Scholar]
  70. Jalal, A.; Kamal, S.; Kim, D. Individual detection-tracking-recognition using depth activity images. In Proceedings of the 2015 12th International Conference on Ubiquitous Robots and Ambient Intelligence (URAI), Goyang City, Korea, 28–30 October 2015; pp. 450–455. [Google Scholar]
  71. Wu, H.; Pan, W.; Xiong, X.; Xu, S. Human activity recognition based on the combined svm&hmm. In Proceedings of the 2014 IEEE International Conference on Information and Automation (ICIA), Hailar, China, 28–30 July 2014; pp. 219–224. [Google Scholar]
  72. Weinberg, H. Using the ADXL202 in pedometer and personal navigation applications. Analog Devices AN-602 Appl. Note 2002, 2, 1–6. [Google Scholar]
  73. Jalal, A.; Quaid, M.A.; Sidduqi, M. A Triaxial acceleration-based human motion detection for ambient smart home system. In Proceedings of the 2019 16th International Bhurban Conference on Applied Sciences and Technology (IBCAST), Islamabad, Pakistan, 8–12 January 2019; pp. 353–358. [Google Scholar]
  74. Jalal, A.; Maria, M.; Sidduqi, M. Robust spatio-temporal features for human interaction recognition via artificial neural network. In Proceedings of the IEEE Conference on International Conference on Frontiers of Information Technology, Paris, France, 17–19 December 2018. [Google Scholar]
  75. Jalal, A.; Uddin, M.Z.; Kim, J.T.; Kim, T.S. Recognition of human home activities via depth silhouettes and R transformation for Smart Homes. Indoor Built Environ. 2012, 21, 184–190. [Google Scholar] [CrossRef]
  76. Jalal, A.; Rasheed, Y.A. Collaboration achievement along with performance maintenance in video streaming. In Proceedings of the IEEE Conference on Interactive Computer Aided Learning, Villach, Austria, 26–28 September 2007; Volume 2628, p. 18. [Google Scholar]
  77. Cortes, C.; Vapnik, V. Support-vector networks. Mach. Learn. 1995, 20, 273–297. [Google Scholar] [CrossRef]
  78. Ashraf, I.; Hur, S.; Park, Y. MagIO: Magnetic Field Strength Based Indoor-Outdoor Detection with a Commercial Smartphone. Micromachines 2018, 9, 534. [Google Scholar] [CrossRef]
  79. Broadcom. Online. 2018. Available online: https://www.broadcom.com/products/wireless/wireless-lan-infrastructure/bcm4360 (accessed on 5 June 2019).
  80. STMicroelectronics. LSM6DSL Fact Sheet. 2018. Available online: https://www.st.com/resource/en/datasheet/lsm6dsl.pdf (accessed on 5 June 2019).
Figure 1. Architecture of the proposed approach.
Applsci 09 02337 g001
Figure 2. Convolutional neural network for scene recognition.
Applsci 09 02337 g002
Figure 3. Image capturing points for training.
Applsci 09 02337 g003
Figure 4. Magnetic fingerprint collection.
Applsci 09 02337 g004
Figure 5. The process followed in location estimation.
Applsci 09 02337 g005
Figure 6. Location estimates and prediction using K nearest neighbor (KNN) and modified KNN.
Applsci 09 02337 g006
Figure 7. The path used for experiments, floor 3 (top), floor 2 (middle), and floor 1 (bottom).
Applsci 09 02337 g007
Figure 8. Indoor scenes of the experiment area.
Applsci 09 02337 g008
Figure 9. Accuracy and loss of convolutional neural network (CNN) classifier for training.
Applsci 09 02337 g009
Figure 10. Localization results for S8 and G6.
Applsci 09 02337 g010
Table 1. Accuracy statistics for CNN and support vector machines (SVM).
ClassCNN AccuracySVM Accuracy
00.9420.890
10.9250.880
20.9200.800
30.9120.880
40.8870.740
50.8540.710
60.9530.910
70.9240.880
80.9570.899
90.8700.760
100.9010.843
110.8900.820
120.8820.810
130.9280.846
140.9130.808
Average 0.91040.8317
Table 2. Error statistics for KNN and mKNN.
Method & DeviceMean ErrorStandard Deviation50% Accuracy75% Accuracy
KNN-G61.861.441.532.88
mKNN-G61.461.231.082.22
KNN-S81.401.241.022.18
mKNN-S81.151.010.891.68
MFP-S8 with scene2.041.441.502.9
MFP-G6 with scene2.472.411.703.35
MFP-S8 without scene14.0517.455.742.28
MFP-G6 without scene19.7421.029.7734.55

