Article

Intelligent Thermal Imaging-Based Diagnostics of Turbojet Engines

Technical University of Košice, Faculty of Aeronautics, Rampová 7, 041 21 Košice, Slovakia
*
Author to whom correspondence should be addressed.
Appl. Sci. 2019, 9(11), 2253; https://doi.org/10.3390/app9112253
Submission received: 2 April 2019 / Revised: 14 May 2019 / Accepted: 27 May 2019 / Published: 31 May 2019
(This article belongs to the Special Issue Advanced Intelligent Imaging Technology)

Abstract

:

Featured Application

The methodology presented in this paper is directly intended for application in the area of turbojet engines. This paper presents the design of an automated system which can create diagnostic information using data from an infrared thermal camera, utilizing methods of computational intelligence and expert systems, which can be considered as a novel approach. The developed system segments infrared images use a self-organizing feature map and an expert system to automatically extract diagnostic information about the technical state of a turbojet engine. The diagnostic system was developed using a small iSTC-21v turbojet engine with a thrust of 500 N in laboratory conditions and can be simply modified for application to other engine types. The system is not limited to engines and can be considered for application in other technical systems which produce heat, such as generators, transmissions, and electronic circuit boards.

Abstract

There are only a few applications of infrared thermal imaging in aviation. In the area of turbojet engines, infrared imaging has been used to detect temperature field anomalies in order to identify structural defects in the materials of engine casings or other engine parts. In aviation applications, the evaluation of infrared images is usually performed manually by an expert. This paper deals with the design of an automatic intelligent system which evaluates the technical state and diagnoses a turbojet engine during its operation based on infrared thermal (IRT) images. A hybrid system interconnecting a self-organizing feature map and an expert system is designed for this purpose. A Kohonen neural network (the self-organizing feature map) is successfully applied to segment IRT images of a turbojet engine with high precision, and the expert system is then used to create diagnostic information from the segmented images. This paper represents a proof of concept of this hybrid system using data from a small iSTC-21v turbojet engine operating in laboratory conditions.

Graphical Abstract

1. Introduction

Infrared thermography (IRT) is one of the many diagnostic methodologies currently applied in various types of industry and research [1]. It can be used to detect so-called invisible defects in a non-destructive way. Compared to traditional areas of IRT applications, such as biomedical applications [2], energetics, buildings, and other constructions [3,4,5,6], the application of this methodology in aviation is still at an early stage [1].
The advantages of IRT have been fully demonstrated in pre-flight and post-flight aircraft checks, where damage (e.g., water in honeycomb structures of composite parts), is monitored by thermal imaging cameras [7,8]. In aviation, extensive research and development is being conducted on the IRT diagnostics of corrosion in aluminum materials [9,10], and especially composite structures [11,12,13]. In aircraft operation, it is possible to use IRT to detect air leaks inside the cabin [14], abnormal strain in individual parts of aircraft casings, fuselage, and wheel attachments [15], damage to electrical wiring and insulation [16,17], etc. In aviation, IRT is also used for rescue, firefighting, and surveillance operations [18,19]. Other applications of IRT diagnostics can be found in the area of unmanned vehicles, whose thermal imaging cameras are used to inspect power lines [20], pipelines [21], buildings [22], constructions [23], vegetation [24], etc. Thermography has also recently found an application in the design of stealth aircraft [25].
For the diagnostics of aviation engines, IRT is mainly used to check their composite covers [26]. Another area where IRT is applied, which is closer to the topic of this paper, is the diagnostics of turbojet engines; infrared images of the diagnosed engines’ gas turbines are compared to standard IRT images of engines without defects, which allows temperature field anomalies to be detected and thus allows defects to be identified [27]. These defects can be damage to the turbine blades, combustion chamber disturbance, disturbance to the homogeneous field of fuel burning, etc. [28].
Aircraft engine diagnostics and health monitoring [29,30,31] can be divided into two basic processes: ground diagnostics and on-board diagnostics with their associated systems. On-board, or online, diagnostics involve the checking of engine components and thermodynamic processes during the operation of the engine [32]. These components include individual engine parts, such as compressors, combustion chambers, and turbines and associated accessories, while thermodynamic process checks include reviewing parameters such as temperature, pressure, rotational turbo-compressor speed, and vibrations. Ground, or offline, diagnostics [33,34] involve tribo-technical analysis, non-destructive checking methods, and checks by thermal cameras as mentioned earlier.
This article aims to develop a progressive method for the online evaluation of the technical state of a turbojet engine using infrared thermal imaging. Contrary to traditional methods, in which a comparative analysis of thermal images is performed on some normalized samples, this paper proposes an intelligent adaptive method which can discriminate anomalous areas of thermal images and create resulting diagnostic information automatically without any human input or previous training.
Since the output of a thermal imaging camera is a digital image, computer vision techniques and methodologies should be used to automatically process this output. In order to extract meaningful information from a thermal image for a diagnostic system, a pattern recognition/classification approach has to be applied. Many methodologies and an array of methods can be used for this purpose [35,36]. These include traditional methodologies, which perform pattern recognition using deterministic image-processing methods such as filtering, feature analysis, and support vector machines. [37]. However, the most successful methodologies for image classification come from the area of computational intelligence. These include artificial neural networks, which have been widely and successfully applied in image processing, pattern recognition, and diagnostic tasks [38,39]. The most complex neural networks, such as convolutional neural networks, are able to classify any pattern in an image with high precision, as well as detect objects [40]. However, these approaches are computationally complex and require large amounts of data and training [41]. In order to create a successful diagnostic method for pattern recognition in IRT images, a simpler methodology should be used, since such images are more homogeneous than traditional images; they have fewer colors, lower resolution, and are well structured, with well-defined edges. The motivation for this study was to develop a methodology which does not require a large amount of computationally intensive training to successfully segment infrared images using intelligent adaptive algorithms.
Accordingly, in this paper, the field of neural networks with uncontrolled learning is explored. One of the methods that has been successfully used in pattern recognition and image segmentation is self-organizing feature maps (SOFMs), which comply with the demand for simplicity, uncontrolled learning, and good classification results. SOFMs can be transformed and formalized into the form of a Kohonen neural network [42,43]. Kohonen neural networks have been successfully applied in image segmentation tasks, the detection of specific areas in geographic maps [44,45,46], and the detection of cracks and corrosion in materials [47]. The results obtained from these applications represent a solid foundation and an inspiration for this approach to be applied in the segmentation of infrared images for the detection of anomalies in the temperature fields of different objects.
The results of pattern recognition and image segmentation come in the form of classes present in the image. In order to extract knowledge from this information, the classes have to be interpreted. This can be done by simply labeling the classes; however, in the field of technical systems, this may not be sufficient. In technical objects, some areas are naturally hot and some are naturally cold, and therefore there needs to be some inference system which interprets the displacement and size of the classes from thermal images, and generates diagnostic information, which in the simplest case can be the determination of whether the diagnosed object is in a normal or an abnormal operational state [48,49]. The traditional approach is to consider a diagnosed system as healthy if it operates within some specific limits; otherwise, a failure is indicated [48,49]. This is a natural approach, and can be used when dealing with a technical system where parameters which determine the technical state (temperature, vibrations, etc.) can be simply measured, such as a jet engine. However, to extract diagnostic information from a classified image, a more complex approach needs to be used [49,50]. Diagnostic expert systems are a natural candidate for extracting diagnostic information from complex data, and have been applied in the diagnostics of turbojet engines [49,50]. The aim of the present study is to create a specialized approach for the creation of a rule-base of an expert system which can transform class information in an infrared image into useful diagnostic information, thus creating hybrid architecture.
The functionality of this approach has been evaluated and designed specifically for application to turbojet engines, and the approach can be considered as novel compared to other intelligent approaches in turbojet engine diagnostics, which are applied to data measured by the engines’ sensors and do not deal with visual/infrared image information [51,52,53]. The aim of this paper is to explore the design of this new approach and prove its functionality by applying thermal vision-based diagnostics in an automated adaptive system in the area of turbojet engine diagnostics. The approach can be expanded and applied to almost any technical system which has been observed by an infrared camera. The hybrid architecture of our approach, which combines a Kohonen neural network and a specialized expert system with a designed rule-base, can be considered as a novel and original contribution of our research. A proof of concept is presented using real data from an iSTC-21v turbojet engine tested and operated in laboratory conditions.

2. Methodology

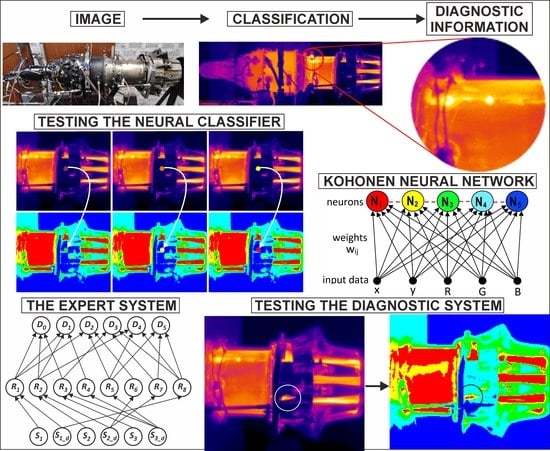
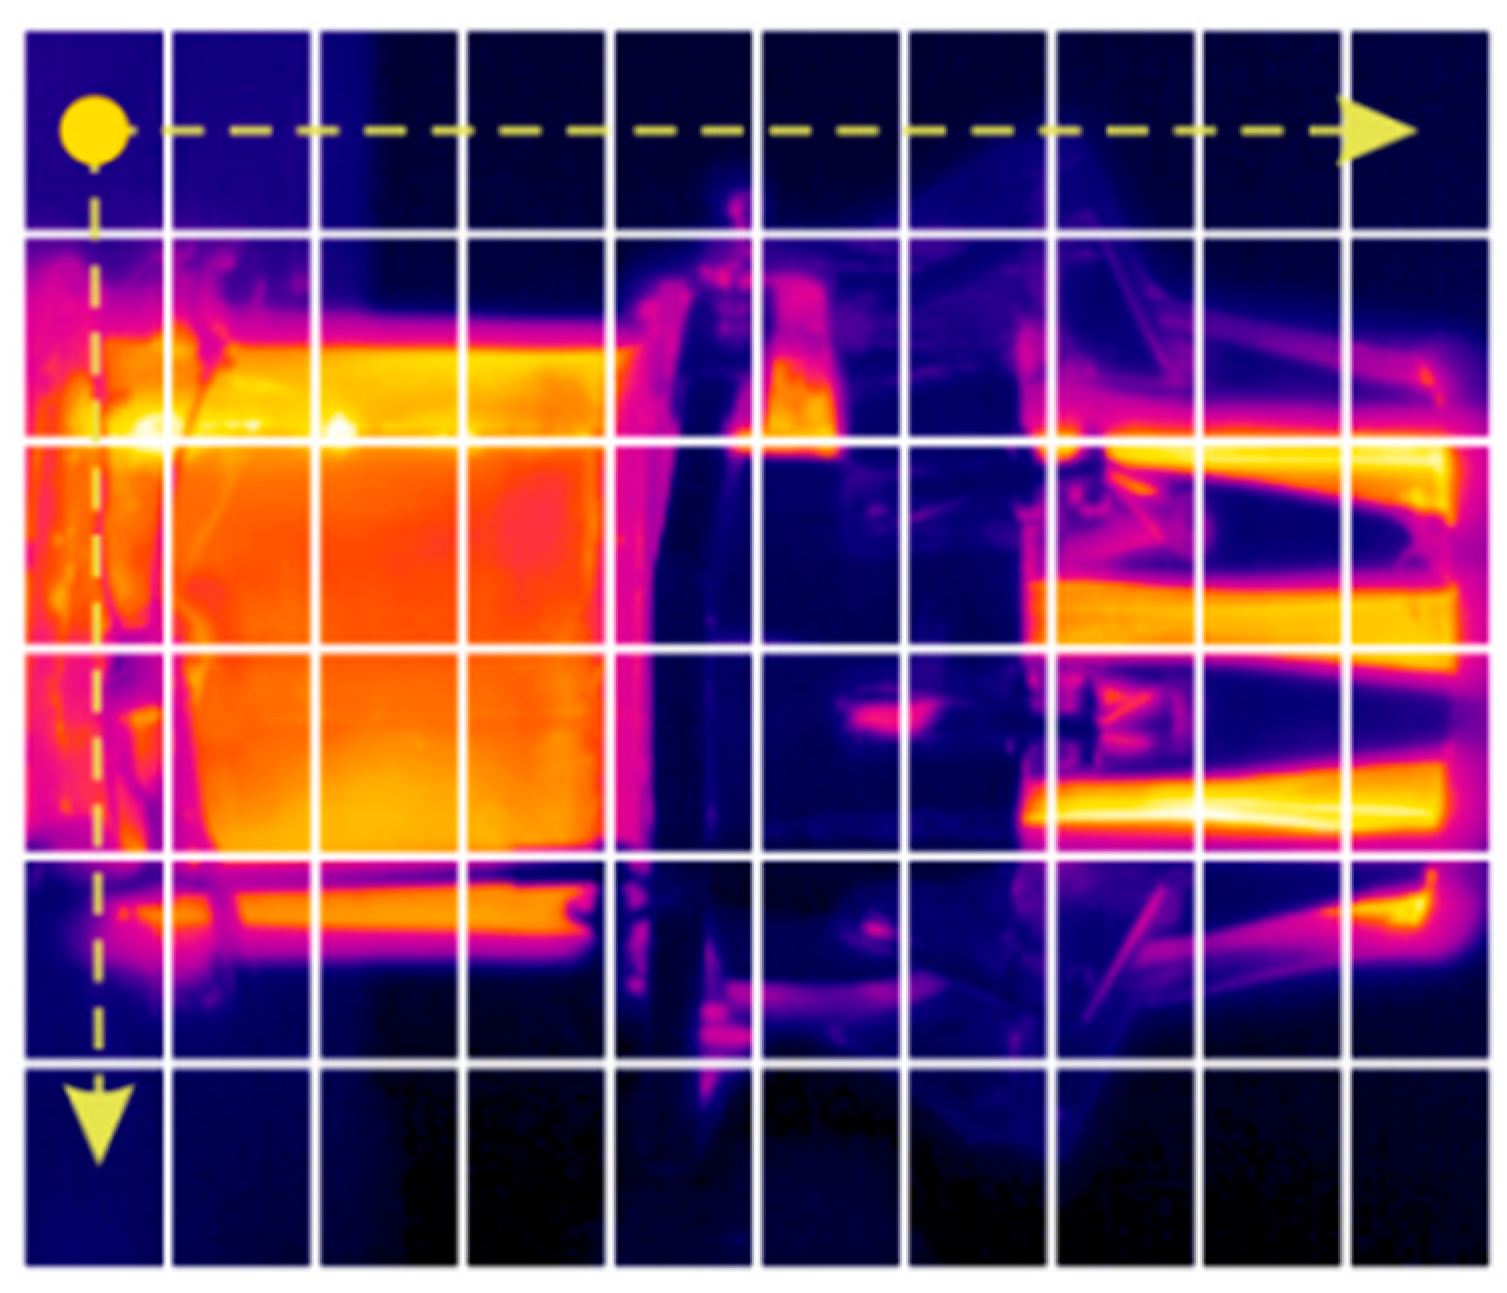
2.1. Using Infrared Imaging for Diagnostics

Every object whose temperature is above absolute zero radiates thermal energy. IRT systems measure this energy to create thermal infrared images. These images can be used to identify heat radiation anomalies of an object, which are usually characterized by increases or decreases in the radiated temperature [8,9,13]. The basic principle of IRT diagnostics is shown in Figure 1, with the following general meaning:
  • Image: an object to be captured by a thermal camera.
  • Classification: monitoring the object, scanning it, obtaining infrared data, classifying hot and cold parts as well as possible problematic areas.
  • Diagnostic information: evaluating infrared thermal images, for example, identifying defects or deficiencies, deciding about the technical state of the engine.
The aforementioned principle is a standard principle when using human expertise to obtain diagnostic information from infrared images. Examples of applications in aviation are pre-flight and post-flight engine checks, where the engine’s casing is checked for defects and cracks caused by freezing water or material deficiencies. In such cases, the evaluation of thermal images and the detection of anomalies is strictly dependent on human expert knowledge [49].
When a human expert inspects infrared images of a technical object, he or she basically performs two operations. First, he/she discriminates different areas of the thermal image and classifies them into categories according to their temperature. They next use their expert knowledge to inspect hot or cold areas for some anomalies according to their position and temperature. The traditional approach is to superimpose the obtained infrared image over a standardized infrared image of an object without defects and evaluate the differences between the two images [54]. The whole process can therefore be formalized into two basic parts—image processing and classification, and knowledge acquisition. A variety of methods exist to solve both problems, as mentioned in the introduction, and are suitable to identify and evaluate anomalies. As previously stated, one aim of this study was to develop an autonomous diagnostic system which is able to learn and locate anomalies without any prior knowledge (e.g., normal faultless operation IRT images). The other aim was to make the system autonomous.
The general concept of the intelligent diagnostic system can be expressed by the scheme shown in Figure 2. The data acquisition part of the approach is usually done using the infrared camera, and the image pre-processing can be done before the data are fed into a classifier. The effects of the image pre-processing and filtering are not directly investigated in this study; however, the methodology is designed to be relatively robust in order to use image data of reasonable quality with low noise levels. Infrared cameras usually pre-process the image data in order to compensate for air humidity and other environmental effects. The robustness is achieved by the application of an intelligent adaptive algorithm, and the design therefore consists mainly of the classifier part by finding a methodology and selecting its structure, input/output relations, and the training algorithm in the case of the application of neural networks. Information about classes in the thermal image can be further used to evaluate the technical state of the investigated object (in this case, a jet engine), and a diagnostic expert system is a natural candidate for the completion of this task. The basis of the proposed methodology is therefore centered around:
  • Image processing classification system: involving a SOFM.
  • Knowledge acquisition system: an expert system for the evaluation of the technical state of an engine.
The other advantage of the designed system is that it does not use the absolute temperature data obtained from the camera, which are dependent on many environmental and material factors, but rather only uses image data, which describe relative temperatures and relations as well as the displacement of the temperature field of the investigated object.

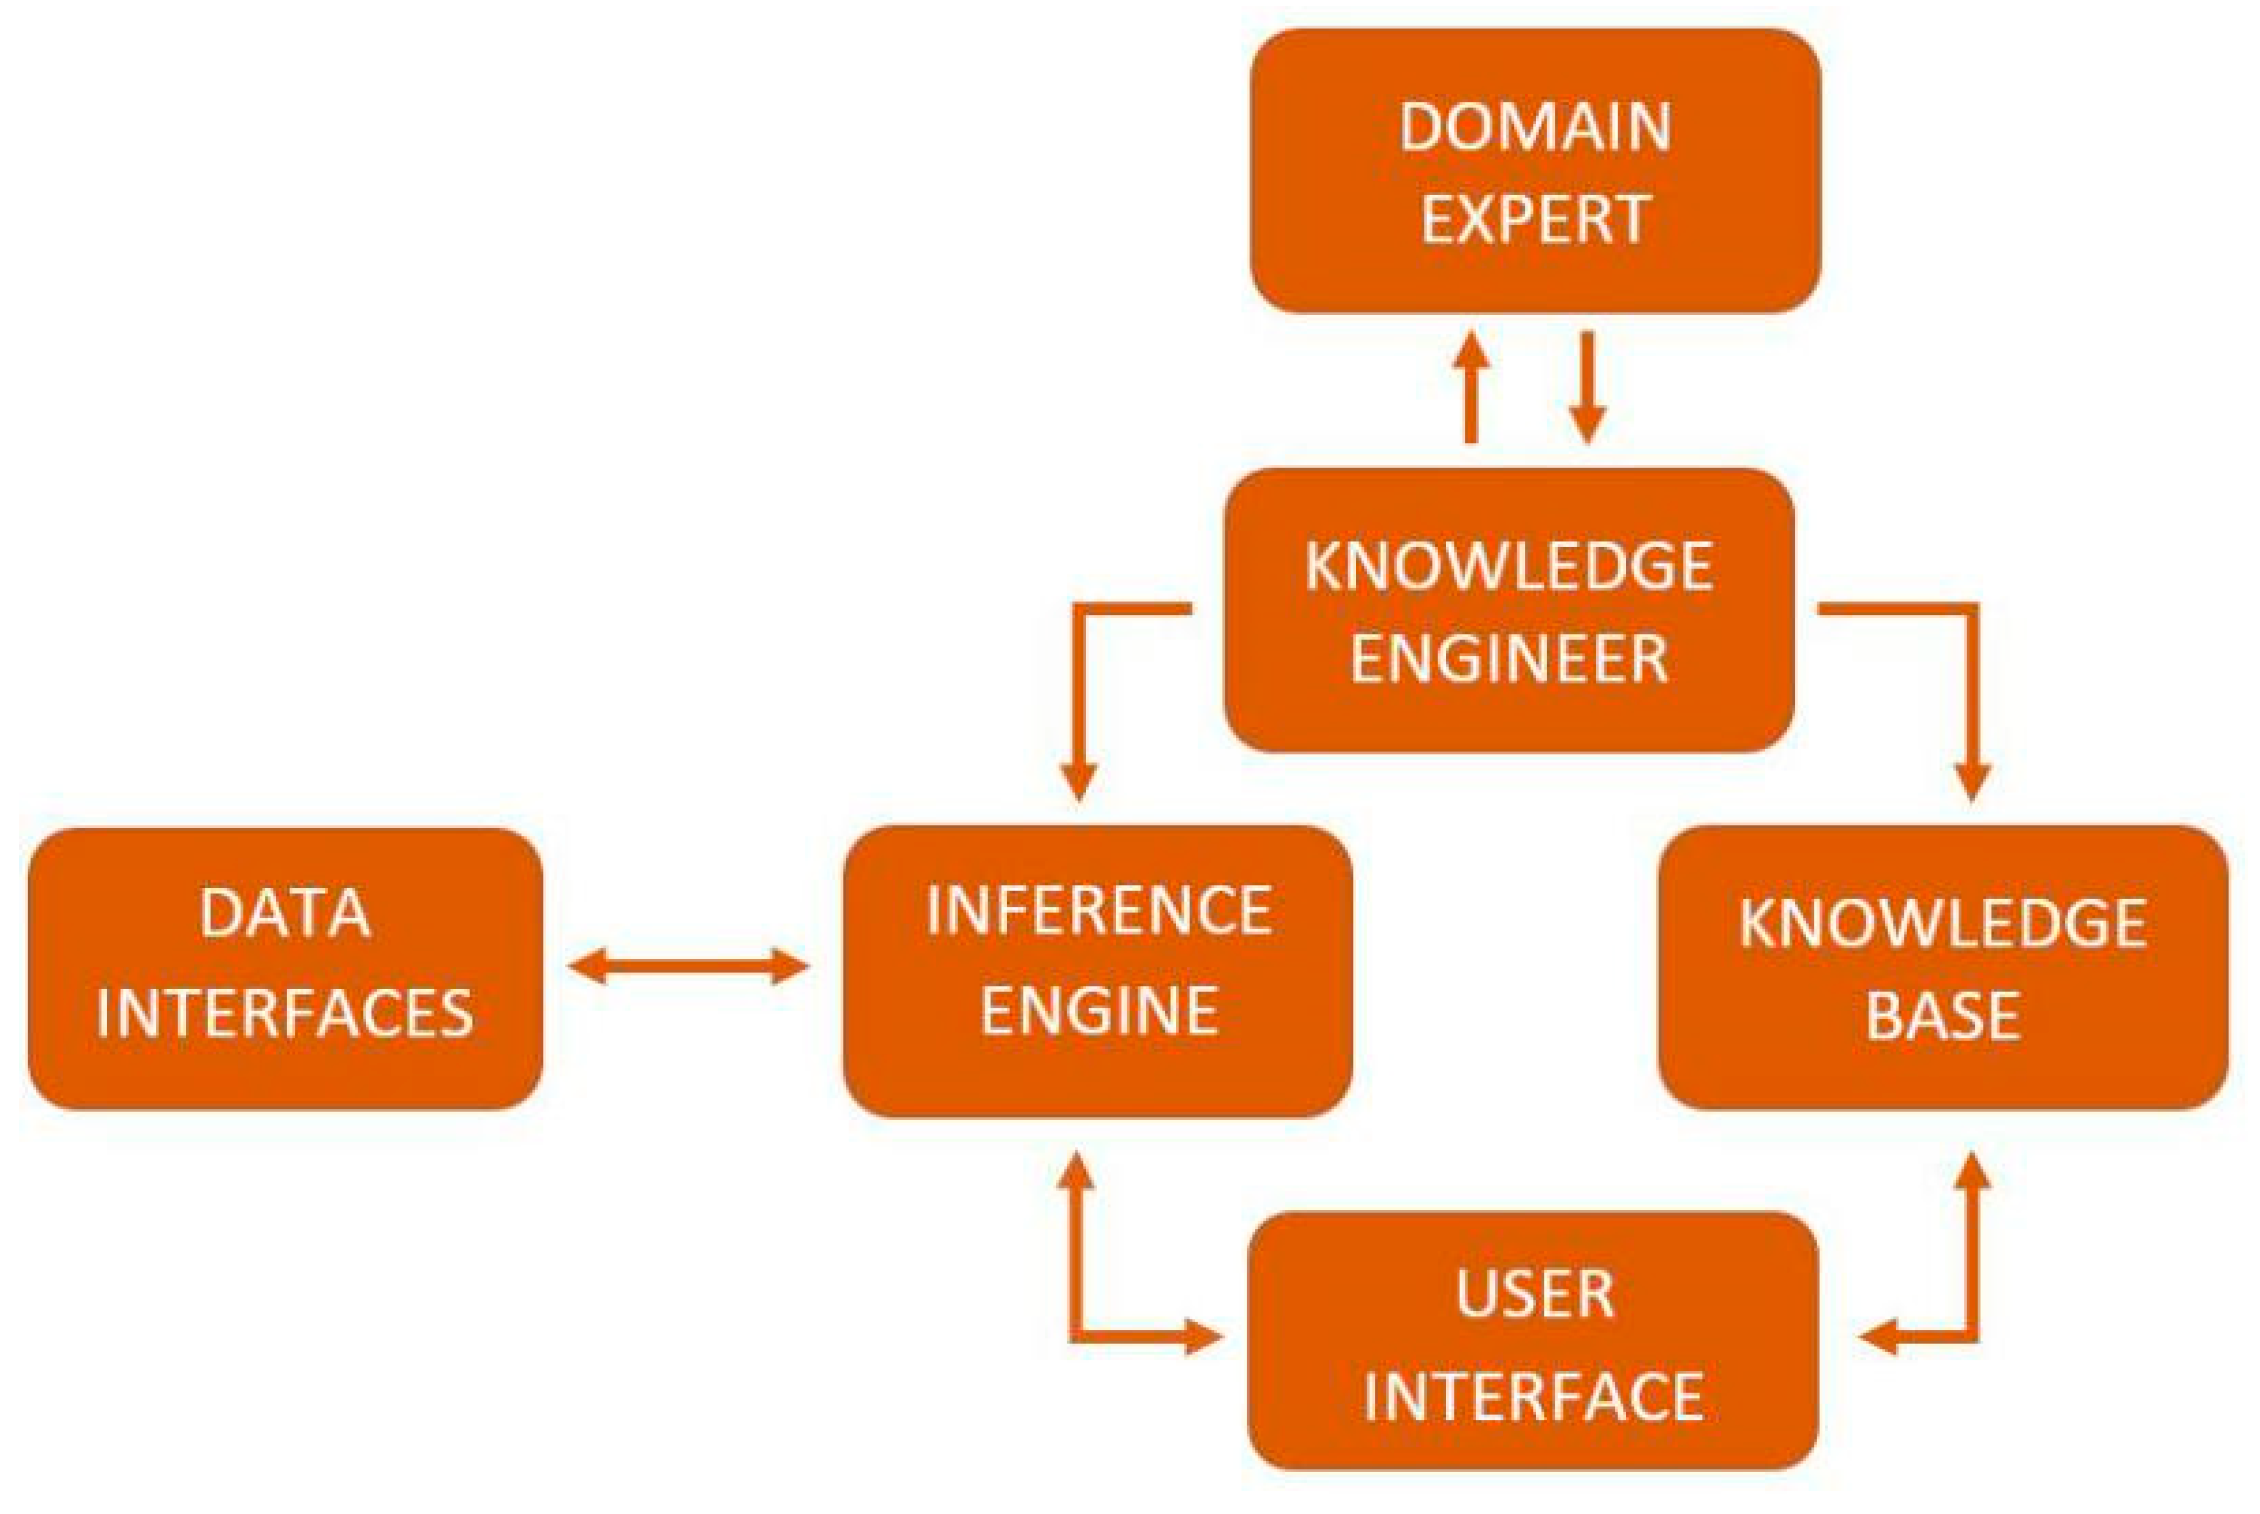
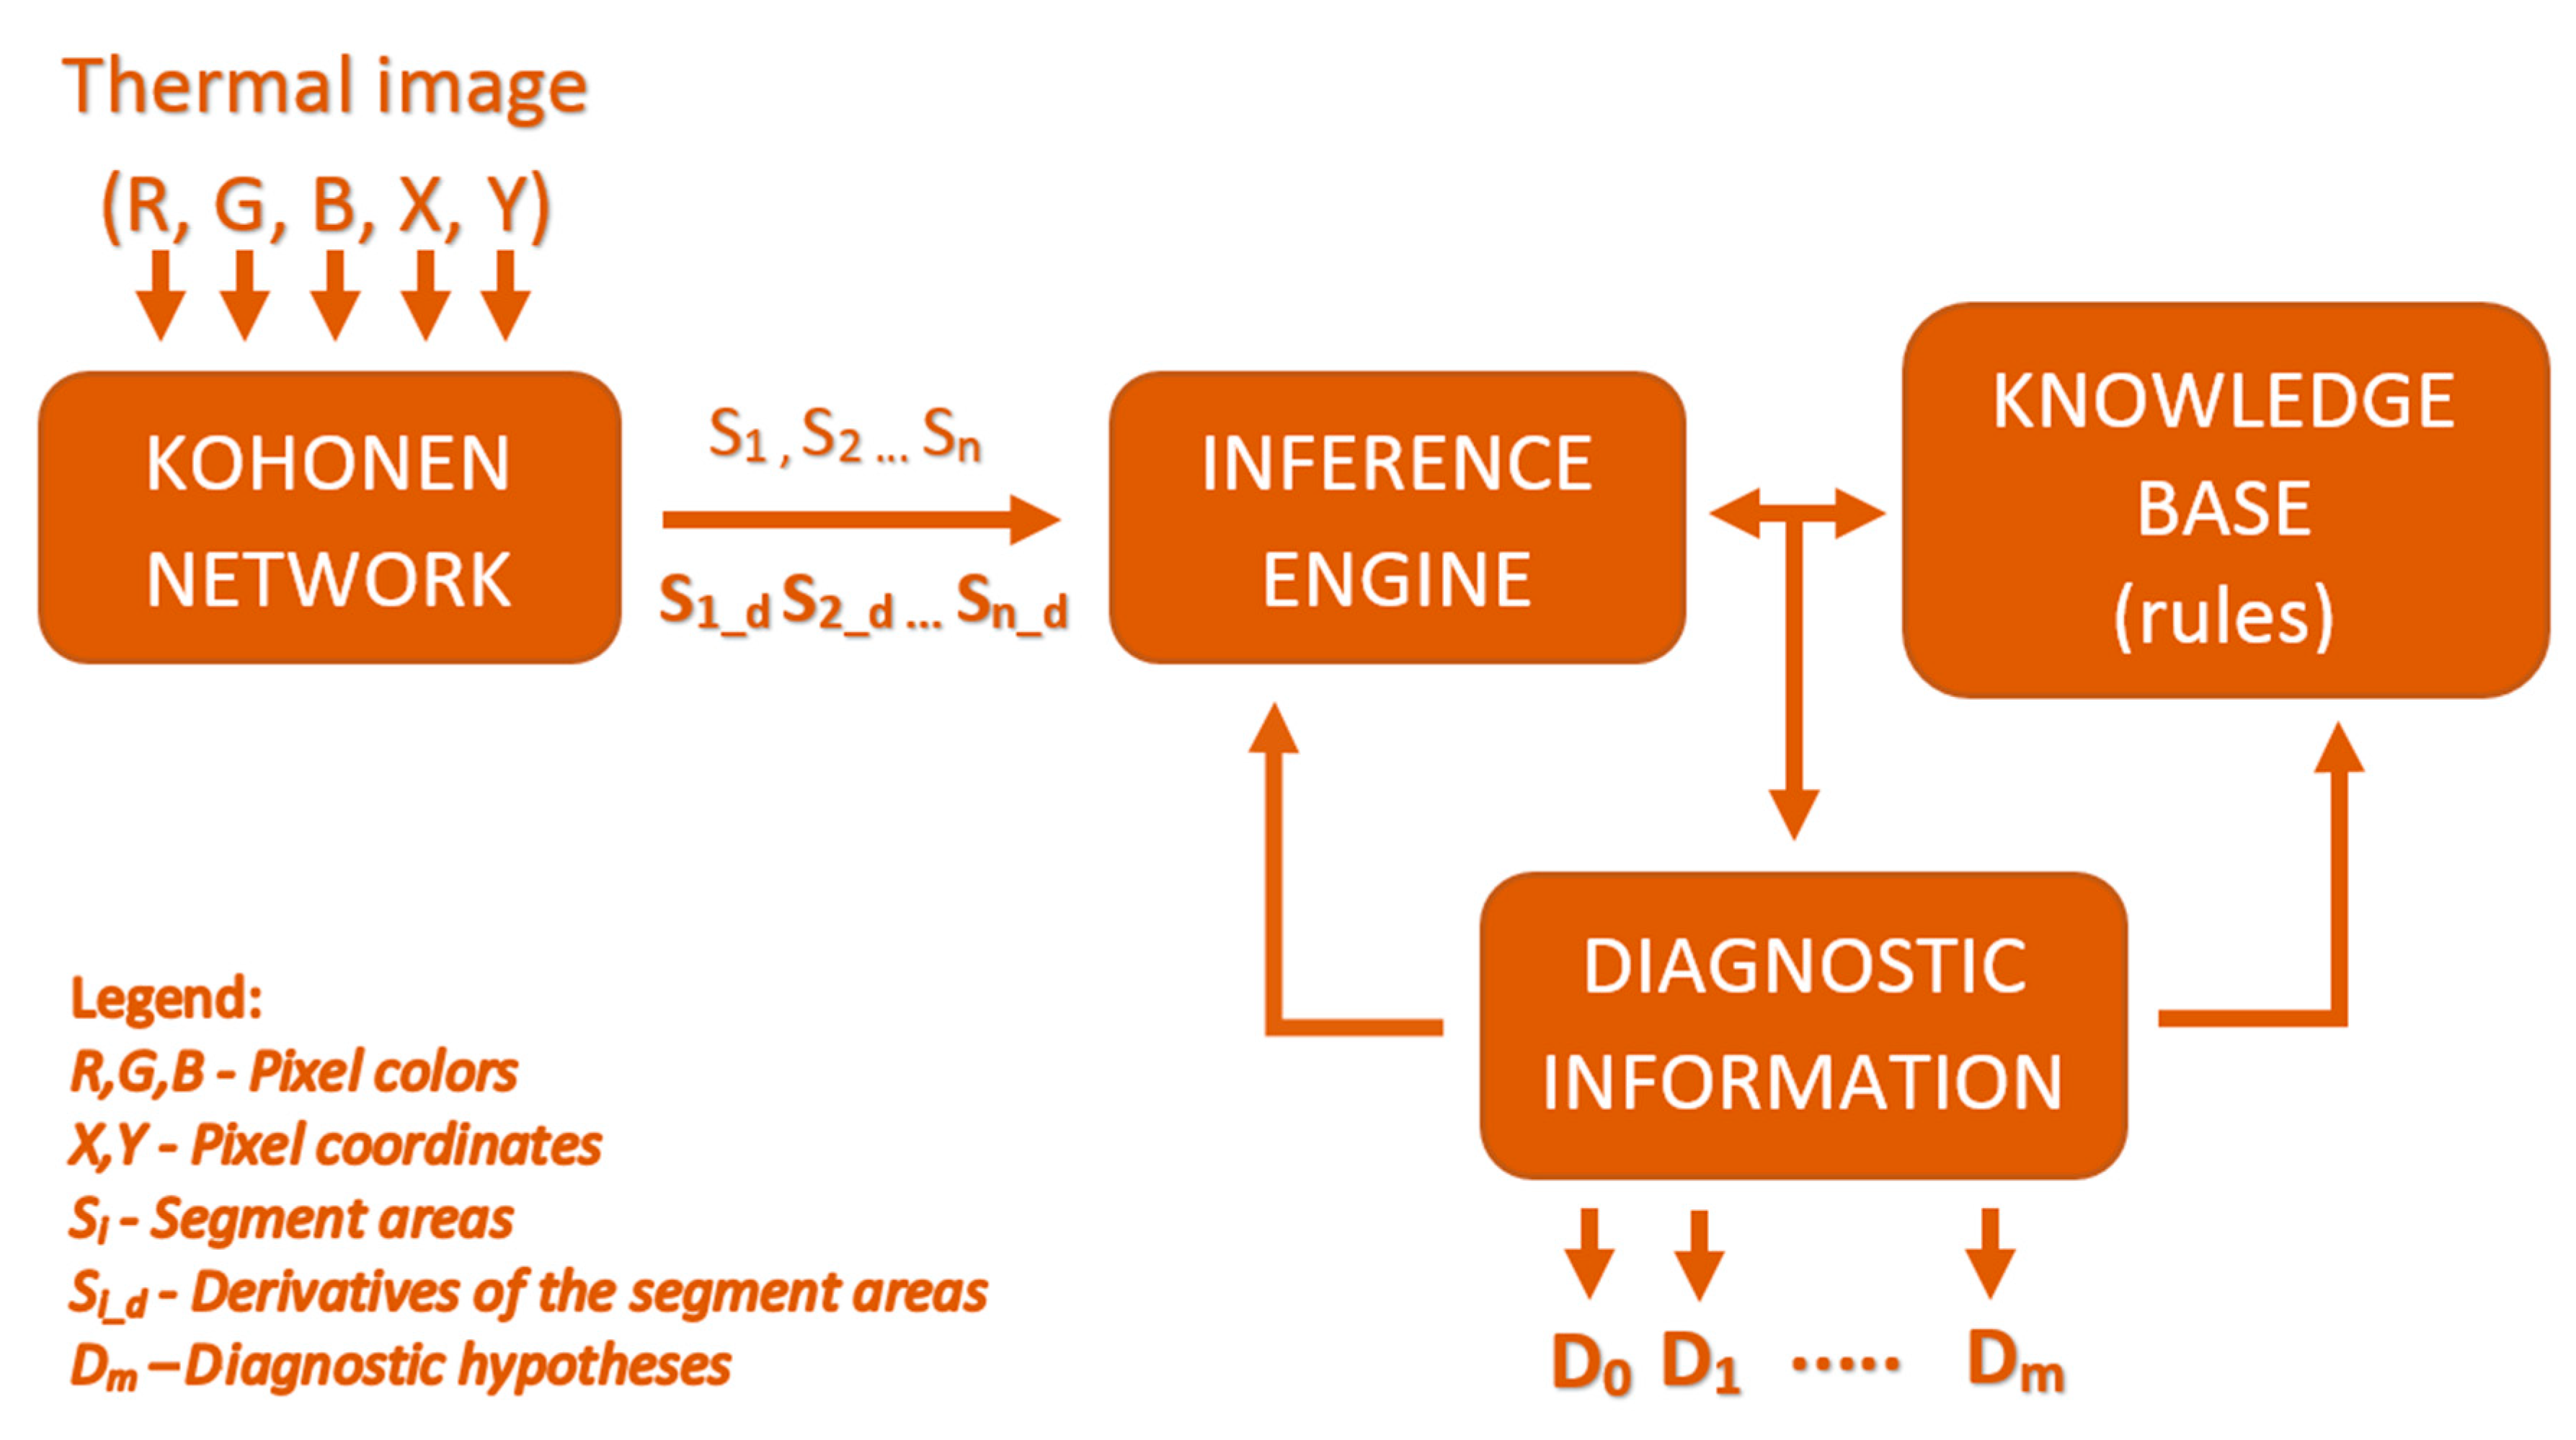
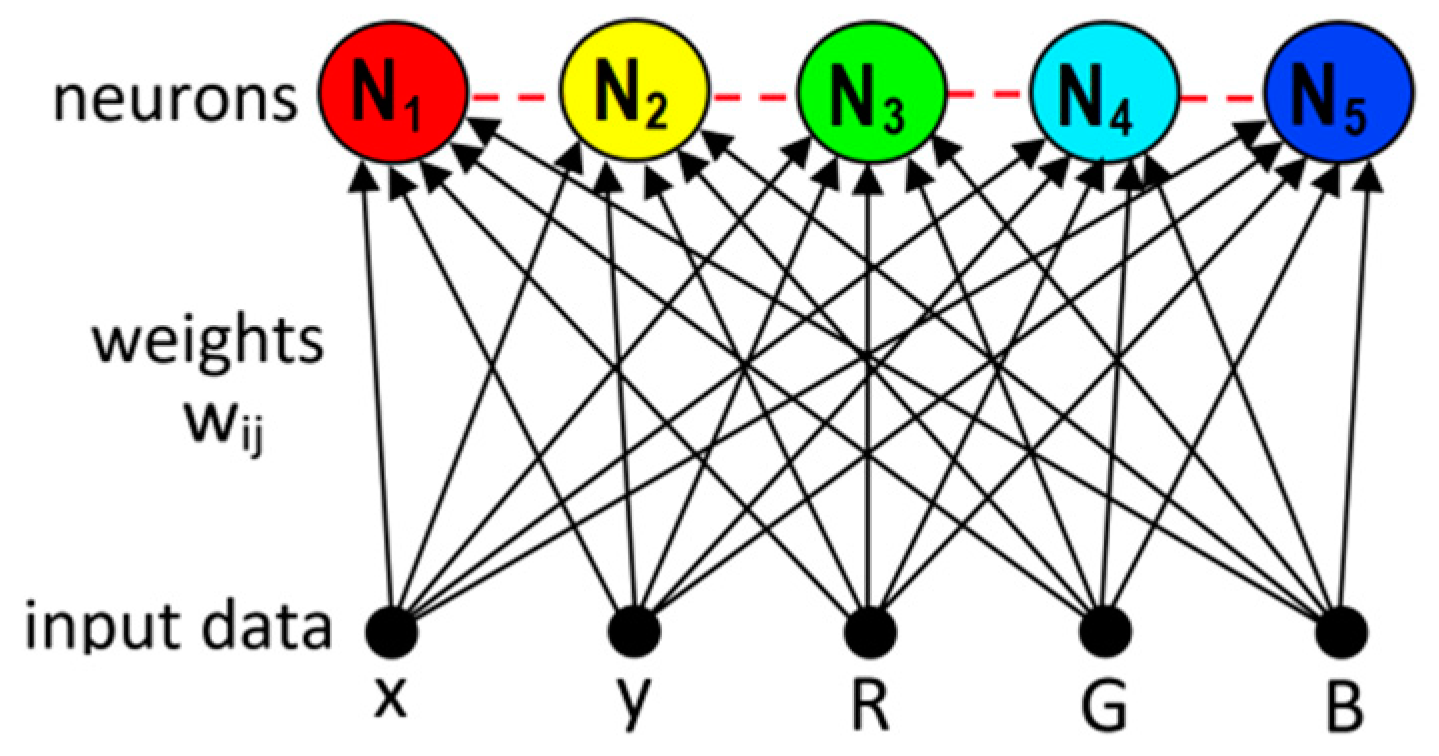
2.2. Self-Organizing Feature Maps in Image Segmentation and Classification

SOFMs are characterized by their outstanding properties in clustering (classification), data visualization, probability density estimation, etc. Kohonen artificial neural networks are one of the most widely used SOFMs [42].
Kohonen artificial neural networks (KNN) map a high-dimensional input space/layer (xi for i = 1, 2, ..., n, where n is the number of inputs) onto an output space/layer (Nj = 1, 2, ..., m, where m is the number of neurons) with fewer or an equal number of dimensions. KNN contains only a single layer of neurons—the Kohonen layer. The number of neurons n, which is the network’s parameter, is optional and usually equals the number of target classes. The inputs to the network are interconnected with all neurons in the Kohonen layer. This means that every neuron has information from all the inputs. Synaptic weights leading to each neuron (designated as a weight vector, wij, of the neuron) can be understood as coordinates, which indicate the location of the neuron in the array (Figure 3). Neurons are mostly organized in a regular two-dimensional grid/matrix or one-dimensional row/vector array.
There are lateral links (local connections) between the neurons in the Kohonen layer (dashed line in Figure 3), which means that any particular neuron affects other neurons in its neighborhood.
In order to segment an IRT image, a layer that has 1 × m neurons (Figure 4) is proposed. Using this type of array, it is possible to segment thermal infrared images into m different segments, which can be labeled as different areas of the temperature field (cold, hot, etc.). Thus, if a higher number of neurons is used, the classification will be more detailed.
In the most simplified way, the self-organization process (Kohonen learning) consists of four main steps: initialization, competition, cooperation, and adaptation [55]:
  • Initialization: Random values are set for all neuron weights. The input vector from the input space is selected.
  • Competition: From the inputs, the discriminant function (Equation (1), below) of a particular neuron is computed. A Kohonen unit computes the Euclidean distance between an input xi and its weight vector wij. The winning neuron is the one with the smallest value of the discriminant function.
  • Cooperation: The winning neuron influences its adjacent neurons (i.e., the weight vectors of adjacent neurons are influenced), however this influence decreases with increasing distance to other neurons.
  • Adaptation: The excited neurons decrease their values of the discriminant function in relation to the input pattern through adjustment of the associated weights. The response of the winning neuron to the subsequent application of a similar input pattern is enhanced. The process will stop if the maximum number of iterations is reached.
d j = i = 1 m ( x i w i j ) 2
The self-organization process is graphically depicted in Figure 5, where blue dots represent neurons, green dots represent input vectors, and red lines represent connections between neighboring neurons. The temperature field has five areas, which are indicated by five neurons. In this simplistic example, the labeling is performed by coloring the neurons and the corresponding training data, which activates the neurons. In this manner, the blue area after adaptation represents the coldest area in the temperature field and the red area the hottest area.

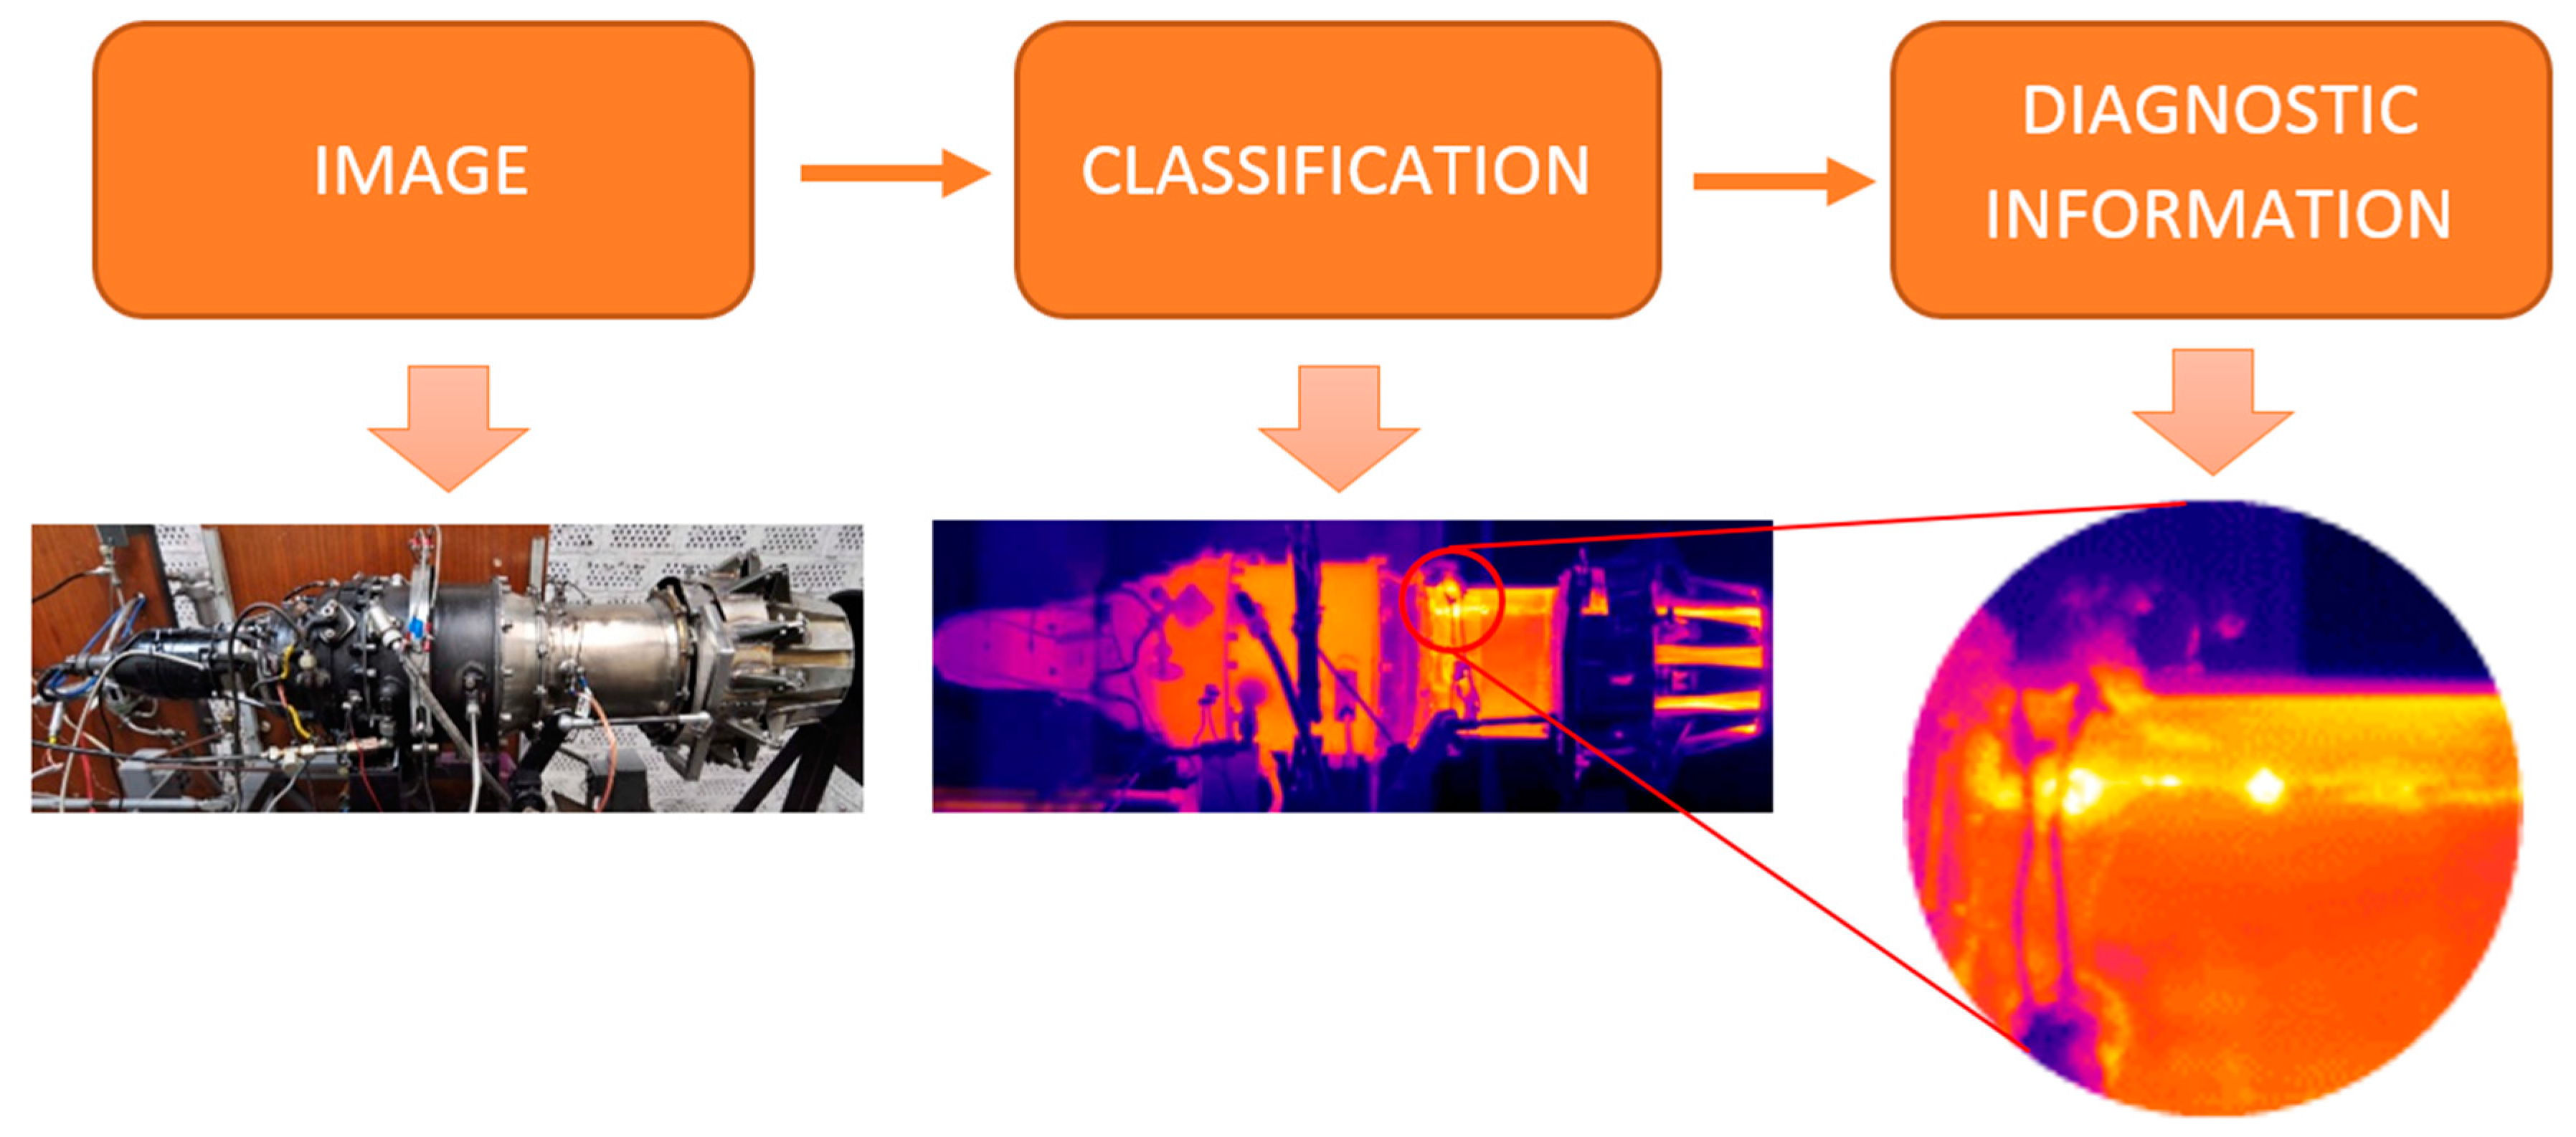
2.3. Expert Diagnostic Systems

An expert system consists of a knowledge base, an inference engine (solving or deducing), an input/output data interface (user interface or links to other systems and tools), a working memory, and an explaining or communication module in the form of a user interface. These elements are shown in Figure 6. A very important part of every expert system is its inference engine, which uses data from the knowledge base (knowledge gained from an expert) and specific problem-oriented data [56].
The inference engine and the knowledge base represent the core of every expert system. The inference engine provides the mathematical means to evaluate the rules in the knowledge base to reach a conclusion about the state of the diagnosed object [58,59,60]. In applications for turbojet engines, the knowledge base contains rules defining the technical state of the turbojet engine based on the outputs from the segmentation algorithm (i.e., the Kohonen neural network). The design of the diagnostic system interconnected with a SOFM, which was used in the present study, is shown in Figure 7.
In this diagnostic system, the knowledge is represented by IF->THEN rules, which can be written in a simple way as IF E THEN H, as follows:
E H
where E represents an observation (evidence) and H represents a hypothesis.
Rule-based systems differ from classical logic systems in their non-monotonic “thinking” and their ability to process uncertainties. In rule-based systems, inference is based on the rule of modus ponens (direct thinking) [61], which is described as:
E , E H H _
This means that, if the E assumption is true and the rule implies E→H, then the conclusion H is true. In the case of an inference network, the conclusions are represented by facts, which correspond to assumptions of other rules. These inference networks are mostly used in domains where the number of possible solutions is limited (e.g., diagnostic problems or classification problems). The benefit of inference networks is that they can be easily implemented. The following model rules (Equation (4)) [61] can be formalized in an inference network structure as shown in Figure 8 [61]:
A ∧ B → P, B ∧ D → Q, P → X, Q ∧ R → Y, C → P, C ∧ E → R, Q → X

2.4. Experimental Setup for Design of the Infrared Imaging-Based Diagnostics System

In order to design an infrared imaging-based diagnostic system for use with turbojet engines and to construct a working knowledge base, a small iSTC-21v turbojet engine, developed in the Laboratory of Intelligent Control Systems of Aircraft Engines at the Faculty of Aeronautics, Technical University of Košice (Figure 9), was used [62]. This is a single-stream, single-shaft turbojet engine with a single-stage one-sided radial compressor, an annular combustion chamber, and a single-stage non-cooled gas turbine with a variable exhaust nozzle with full authority intelligent electronic digital control system developed from the TS-21 engine (Ljulka-Saturn, Rybinsk, Russia). A schematic of the measurement and data acquisition system is shown in Figure 10, and the arrangement of the camera is shown in Figure 11 [62].
A digital data acquisition system was used to observe the state of the engine [62]. Various sensors and data acquisition (DAQ) devices serve this purpose and send all the data to the control personal computer (PC). This PC contains a control system created in the LabVIEW (National Instruments Corporation, Austin, TX, USA) and Matlab/Simulink (MathWorks, Natick, MA, USA) software which is able to control and visualize the engine’s performance, save and track all measured parameters, and update the control algorithms.
For the design of the IRT diagnostics system, the following parameters are utilized:
  • n (rpm)—speed of the engine’s shaft.
  • T2 (°C)—air temperature at the output of the radial compressor.
  • T3 (°C)—gas temperature at the input to the gas turbine.
  • T4 (°C)—gas temperature at the output of the gas turbine.
These parameters represent the inner state and temperature of the engine. The interior temperature was measured by a thermal sensor contained in the engine. The temperature of the engine’s casing was measured by a thermal camera; this temperature can be correlated with the inner temperature although it has different dynamics.
To measure the thermal temperature field around the engine, a FLIR Thermovision A40 thermal imaging camera was used (FLIR Systems, Wilsonville, OR, USA), and a stationary IR camera was used for scanning during long measurement processes, where continuous measurement in real time is necessary. The IR detector of the camera is a 320 × 240 focal plane array uncooled microbolometer. Its spectral range is 7.5 to 13 µm, its instantaneous field of view (IFOV) is 1.3 mrad, its noise equivalent temperature difference at 60 Hz is 0.08 °C at 30 °C, its measurement uncertainty is ±2 °C or ± 2%, its temperature sampling frequency is 60 Hz, and its observable temperature range is from −40 to 1500 °C. The camera was controlled via the PC using the ThermaCAM Researcher software (FLIR Systems, Wilsonville, OR, USA) through the FireWire interface. One of the settings when capturing a video is the choice of color palette, which is used to convert the levels of the infrared spectrum into the visible spectrum. This selection is mainly important when there are small temperature differences between parts of an object or its surroundings. In the case of an object with a wide range of temperatures, such as a turbojet engine, the standard iron-bow palette is a suitable option [63]. As the engine is a dynamic object, the displacement of its thermal field needs to be evaluated continuously. The camera allows uncompressed video to be captured at 25 frames per second in audio video interleave (AVI) format using the selected color palette. The video can then be decomposed into single frames in uncompressed bitmap (BMP) format. The resulting pictures contain IR images of the engine with the assigned RGB pixel values from the selected color palette during its operation. Full color resolution of the camera can be obtained only when taking static images of the engine, which is not an option for the application, but a video with this resolution would definitely improve the resulting IR images. It can be concluded here that parameters of the camera are sufficient for application on an object operating in a wide temperature range, where fine temperature resolution is not that important.
The thermal fields were captured and observed during the whole engine operational process, from its start-up to the time of full thrust, as shown by the measured basic parameters displayed in Figure 12. The infrared camera was positioned 1.5 m from the engine and was turned on 0.5 h before the measurement in order to allow the temperature of its sensor to equalize with that of the environment. Before the measurement, the values of the background air temperature, air humidity, and the emissivity of the engine surface were determined and inputted in the camera. The environment in the laboratory had a relatively stable humidity (around 50%) and temperature (around 21 °C) during the experiments with no direct sunlight. These parameters can have an impact on the precision of the IRT measurements, but can be quite well-controlled in a laboratory environment [39]. The measured state parameters (n (rpm), T2 (°C), T3 (°C), T4 (°C)) for a single run of the iSTC-21v engine in laboratory conditions are shown in Figure 12.

3. Thermal Image Segmentation and Classification

3.1. Design and Training of the Kohonen Self-Organizing Feature Map

The Kohonen SOFM was used for the segmentation of the IRT images obtained with the thermal camera at a resolution of 320 × 240 pixels as described in Section 2.4. Each pixel was defined as a five-dimensional vector P_i (t) = {R,G,B,x,y}, where R, G, and B represent the values of the color spectrum {R,G,B} = <0,255> and x and y represent the coordinates of each pixel where x = <0,320>; y = <0,240>. The engine’s temperature as evaluated and processed by the camera was not taken into account, since it may contain errors created by the camera compensating for environmental conditions and assigning different temperatures to a single color, thus confusing the classifier. In order to evaluate the technical state of the engine, the relative temperature-field displacement was used as it is holds the most important diagnostic information. The dynamic range of the camera was set in the interval <0,500> °C and was fixed. These parameters define the design of the SOFM. The pilot testing showed that these multi-dimensional vectors should be classified into five classes. As proposed in Section 2.2, a feature map with a single row is able to acceptably segment the IRT image, with low demands of computational time and complexity, which was one of the design goals.
The classes are labeled as Ni and represented by different colors as follows:
  • N1: the hottest and most critical part of the IRT image, red.
  • N2: a hot and critical part of the IRT image, yellow.
  • N3: a hot and non-critical part of the IRT image, green.
  • N4: a low-temperature and non-critical part, cyan.
  • N5: the temperature of the surrounding objects (not a part of the diagnosed object), blue.
The structure of the network can be visualized as shown in Figure 13. The training parameters which were found to be efficient were set as defined in Table 1, and the standard Kohonen network learning rule was used [42,43].
A training dataset was prepared to train the network as follows. The engine was run for 120 s and thermal images were recorded at two frames per second, as the pilot experiments showed that this timing is sufficient since the dynamics of the temperature of the engine casing have a time constant of 1.2 s. The training sample therefore contained a set of 240 thermal images. The run of the engine, which was used to obtain the IRT images is shown in Figure 14. To demonstrate the ability of the trained Kohonen SOFM, five operational points are shown in Figure 14, where the network was tested if it produced sensible results. The first operational point, Op1, corresponds to the lowest evaluated rotational speed of the engine 42,058 rpm, and the last, Op5, corresponds to the highest rotational speed (i.e., 50,289 rpm).
The classifications of the five example images are shown in Figure 15a, and the created segment areas are shown in Figure 15b. Following expert examination of the infrared images and heuristic evaluation of the temperature field, it can be concluded that the Kohonen network works as expected and is able to sensibly assign the hottest and coldest parts of the object to each of the five classes/segments. In order to quantify the results, the number of activations of each neuron are summed, giving the total segment areas S1, …, S5 corresponding to each of the classes N1, …, N5. This can be formalized as follows:
S i = j = 1 p x j ;   x   =   { 0 ; 1 }
where p is the number of activations of the i-th neuron.
In this way, the size of each class and the total area of each temperature segment can be obtained. As can be seen in Figure 16, the total area of the segments in the three hottest classes increased as the engine speed and temperature increased. As it is not possible to define the exact areas which correspond to each class (as in traditional image segmentation where, for example, a river area is clearly defined), a system for the objective evaluation of the trained classifier performance was designed, and is described in the next section.

3.2. Classification System Testing and Results

To validate the ability of the trained Kohonen network to segment the thermal image, a system for its evaluation was designed as follows. Five artificial spheres, each with an area of 150 pixels, were created, each of which fell into only one of the classes. As can be seen in Figure 17, the network was able to correctly classify these artificial anomalies in this particular case.
In order to properly evaluate the functionality of the classifier, five testing infrared images were divided into 60 segments. The artificially created spherical temperature field anomaly for each class was moved across all segments, giving a total of 300 testing images for each class and 1500 testing images in total. The division of the image into segments when the artificial anomaly was included is shown in Figure 18.
The results are summarized in the confusion matrix shown in Table 2; the first row represents the real class of the anomaly and the first column represents the class output by the network. The contingency table gives a clear picture of the network’s ability to correctly segment the infrared images.
The network achieved a very good accuracy for the first two classes, and only misclassified objects for the three hottest classes. The lowest obtained accuracy was for the classification of class N5, which was the coldest class and mostly represented the surroundings of the engine, which are of a low temperature. This class also contained misclassified objects belonging to class N4, which only represented relatively cold parts of the engine or its surroundings. The most important classes for the evaluation of the technical state of a turbojet engine are those which represent its hottest parts, that is, N1, N2, and N3. The results could probably be improved by using a larger training dataset or different Kohonen layer topologies, however they can nevertheless be evaluated as very successful for the purpose of turbojet engine diagnostics.

4. Expert Diagnostic System Design Based on Infrared Images

4.1. Design of the Expert System

As presented in Figure 15, areas of the segments are not absolutely representative of the engine’s technical state, as their changes are quite slow as the engine heats up or cools down and the internal thermal energy is transferred to its casing, which has its own heating and cooling dynamics. The main task of the expert system is to evaluate the areas of the segments and their changes, and to then present to the operator some information about the technical state of the engine.
To fulfill this task, the designed expert system needs as an input the total area of the segments and some indication of how they evolve over time. Temporal changes in the areas of the segments can be predicted by the computation of derivations/differences between two segmented images in a set time interval Δ t . The standard derivative equation can be used for this purpose for the i-th neuron and the total area of the i-th segment Si:
d S i ( t ) = S i ( t + Δ t ) S i ( t ) Δ t
From a diagnostic point of view, it makes sense to investigate only the three hottest states (levels S1–S3) and their derivations S1_d–S3_d, as they represent the most critical temperatures for the engine. The time derivation of the surface areas of the segments allows the magnitude of the change in the area of different temperature regions to be determined and early structural failures to be detected. The knowledge base of the proposed expert diagnostic system consists of a set of rules that describe normal and atypical engine operation based on the outputs of the Kohonen SOFM. Each rule Ri (i = 1, 2, ..., 8) is designed according to precisely defined intervals of the allowed amount of pixels (area sizes) of individual color levels and intervals of allowed values of their derivations, based on results for the normal state and atypical states of the object. The outputs of the rules Ri take Boolean logical values Ri Є {0; 1}. The rules Ri in Table 3 are defined as follows:
IF Si is the area size <from;to> AND Si_d is the derivative <from;to> => Ri, where Si (i = 1, 2, 3)
The rules Ri are partial conclusions about the technical state of the investigated engine. In order to obtain some knowledge about the engine’s technical state, the hypotheses which are to be connected with these rules have to be defined. In order to keep the rule base simple at first, diagnostic signals (hypotheses) for a turbojet engine are proposed in Table 4.
These diagnostic signals (Di; i = 0, 1, 2, ..., 5) are activated by combinations of the proposed rules. The rules to obtain the diagnostic signals are defined in Table 5.
The rules, hypotheses, and inputs can be formalized in the form of an oriented graph. The inference network is defined in Section 2.3. In the case of a turbojet engine with diagnostics based on the sizes and derivatives of segmented thermal images, the inference network shown in Figure 19 is proposed based on rules in Table 3 and Table 4, which represent the knowledge base of the expert system. The inference engine then performs a bottom–up search from data of the segments’ sizes Si and their derivatives Si_d through intermediate rules Rj up to evaluation of the hypotheses Dk.

4.2. Pilot Testing of the Expert System Using Infrared Thermography (IRT) Inputs

The idea behind the design of the presented expert system is to evaluate its possibilities and its ability to correctly present diagnostic signals to the engine’s operator or supervisory control system [64,65]. The designed rule base was therefore constructed to be very simple in order to evaluate the five pre-defined temperature states represented by hypotheses D. Pilot tests were conducted to prove that the system works as intended. For real-world engine operation, it was only possible to test the states D0, D1, D4, and D5. The resulting classifications for these tested situations are shown in Table 6. States D4 and D5 were artificially induced by quickly adding heating material on the surface of the engine’s exhaust nozzle, which created anomalies in the temperature field of the engine. The condition of light overheating was achieved when the engine was running at a high speed setting, (i.e., at an operating speed of 50,000 rpm for around 20 s). The rules which were evaluated as true, and the way the diagnostic signal/hypothesis was obtained, are shown in Table 6. These results suggest that the diagnostic expert system is able to determine basic states represented by hypotheses D0 , D1, D4, D5 and that the designed rules work.
Additionally, another test was set up using the data from a single engine run, as shown in Figure 14. Normal and light overheating states were tested during standard operation of the engine, and are shown in Figure 20. It can be seen that the expert system selected the state D1 (light overheating) even though the speed of the engine and the corresponding temperatures had decreased. This was the correct selection, since the temperature of the casing takes more time to cool down, whereas the inner gas temperature as measured by internal sensors decreases immediately. This set of pilot tests showed that the inference engine works as intended and that the expert system is able to produce some sensible results in the evaluation of the technical state of the engine during normal conditions and to detect artificially induced structural defects. In order to prove the correctness of the setting of the rules Ri, as well as the definition of intervals in these rules, a more systematic approach has to be taken. This will be designed in a follow-up study of the system.

5. Conclusions

This article defines a way to use infrared imaging directly in a new area of aviation, namely, in the evaluation of the technical state of turbojet engines. A concept of a hybrid system combining a SOFM, namely a Kohonen neural network, and an expert system, is shown to be a promising approach to solve the problem of thermal image segmentation and to extract knowledge about the technical state of the engine from the obtained segmented IRT images. The Kohonen neural network defined in this article is a computationally very simple algorithm, and was able to achieve a precision of higher than 90% in the segmentation of infrared images obtained by the FLIR A40 camera when introducing an artificial temperature anomaly. By using the total areas of segmented infrared images corresponding to different temperatures, and their time derivatives, the technical state of the engine can be extracted and evaluated. This can be considered as a novel approach, and it has shown promising results as a proof of concept, which can be further developed and investigated, for example, to take into account environmental or high noise conditions or the impact of application of different image filtering techniques. Moreover, accuracy of the classification could also be increased by utilizing a camera with the ability to record a video with 10 bit color resolution instead of the reduced iron-bow palette for applications, where fine temperature resolution is important. On the other hand, the developed methodology with an expert system seems to be robust enough to work well with the reduced color spectrum and the engine is working in a wide temperature range. The rule base of the expert system proposed in this article can be further expanded to contain more hypotheses, and can also be developed to use fuzzy logic to evaluate the rules to improve the precision of the system. It can be considered as a progressive methodology in the application of computational intelligence and infrared thermography to the area of aviation. The methodology can also be applied in other fields of technical practice to evaluate the temperature fields of different technical objects, such as electronic circuit boards, transmissions, rotating machinery, generators, and electric engines operating in laboratory conditions. The system is designed to be objective, and does not need any input or examination of the infrared images by humans. It can also be integrated into a complex situational control algorithm of a turbojet engine in laboratory conditions, where outputs of the expert system can be used as inputs for the situational classifier and also to tune adaptive controllers of the engine [62,64,65].

Author Contributions

Conceptualization, R.A., M.S. (Martin Schrötter), and M.Č.; data curation, R.A. and L.F.; formal analysis, R.A., L.F., M.S. (Martin Schrötter), and S.S.; funding acquisition, R.A. and S.S.; investigation, R.A., L.F., M.S. (Martin Schrötter), M.Č., R.B., and M.S. (Michal Schreiner); methodology, R.A., L.F., and R.B.; project administration, R.A., M.S. (Martin Schrötter), and S.S.; resources, L.F., M.S. (Martin Schrötter), M.Č., R.B., and M.S. (Michal Schreiner); supervision, R.A., M.Č., and S.S.; validation, R.A., L.F., M.S. (Martin Schrötter), and R.B.; visualization, L.F., M.S. (Martin Schrötter), M.Č., and M.S. (Michal Schreiner); writing—original draft, R.A., L.F., M.S. (Martin Schrötter), and M.Č.; writing—review and editing, R.A., L.F., M.S. (Martin Schrötter), and M.Č.

Funding

This work was supported by the following projects: Efficient Systems and Propulsion for Small Aircraft (ESPOSA), funded by the European commission in the seventh framework program under grant agreement ACP1-GA-2011-284859-ESPOSA, the Slovak Research and Development Agency (APVV) under grant agreement DO7RP-0023-11 and KEGA 044TUKE-4/2019—a small unmanned airplane—the platform for education in the area of intelligent avionics.

Conflicts of Interest

The authors declare no conflicts of interest.

References

  1. Osornio-Rios, R.A.; Antonino-Daviu, J.A.; Jesus Romero-Troncoso, R. Recent Industrial Applications of Infrared Thermography: A Review. IEEE Trans. Ind. Inform. 2019, 15, 615–625. [Google Scholar] [CrossRef]
  2. Lahiri, B.B.; Bagavathiappan, S.; Jayakumar, T.; Philip, J. Medical applications of infrared thermography: A review. Infrared Phys. Technol. 2012, 55, 221–235. [Google Scholar] [CrossRef]
  3. Balaras, C.A.; Argiriou, A.A. Infrared thermography for building diagnostics. Energy Build. 2002, 34, 171–183. [Google Scholar] [CrossRef]
  4. Lisowska, A. Thermographic monitoring of the power transformers. Meas. Autom. Monit. 2017, 63, 154–157. [Google Scholar]
  5. López-Pérez, D.; Antonino-Daviu, J. Application of Infrared Thermography to Failure Detection in Industrial Induction Motors: Case Stories. IEEE Trans. Ind. Appl. 2017, 53, 1901–1908. [Google Scholar] [CrossRef]
  6. Yang, R.; He, Y.; Mandelis, A.; Wang, N.; Wu, X.; Huang, S. Induction Infrared Thermography and Thermal-Wave-Radar Analysis for Imaging Inspection and Diagnosis of Blade Composites. IEEE Trans. Ind. Inform. 2018, 14, 5637–5647. [Google Scholar] [CrossRef]
  7. Vavilov, V.; Nesteruk, D.A. Detecting water in aviation honeycomb structures: The quantitative approach. Quant. Infrared Thermogr. J. 2004, 1, 173–184. [Google Scholar] [CrossRef]
  8. Vavilov, V.; Pan, Y.Y.; Nesteruk, D. Infrared thermographic inspection of water ingress in composite honeycomb panels. Appl. Opt. 2016, 55, 120–125. [Google Scholar] [CrossRef] [PubMed]
  9. Vavilov, V.P. Non-contact one-sided evaluation of hidden corrosion in metallic constructions by using transient infrared thermography. Rev. Metal. 2003, 39, 235–242. [Google Scholar] [CrossRef] [Green Version]
  10. Eddazi, A.; Belattar, S. Nondestructive Testing Evaluation of Aircraft Fuselage Corrosion by Infrared Thermography and Finite Element Method. In Proceedings of the 14th International Conference on Computer Graphics, Imaging and Visualization, Marrakesh, Morocco, 23–25 May 2017. [Google Scholar]
  11. Addepalli, S.; Zhao, Y.; Roy, R.; Galhenege, W.; Colle, M.; Yu, J.; Ucur, A. Non-destructive evaluation of localised heat damage occurring in carbon composites using thermography and thermal diffusivity measurement. Measurement 2019, 131, 706–713. [Google Scholar] [CrossRef]
  12. Meola, C.; Boccardi, S.; Carlomagno, G.M. Infrared Thermography in the Evaluation of Aerospace Composite Materials: Infrared Thermography to Composites; Woodhead Publishing: Cambridge, UK, 2016. [Google Scholar]
  13. Swiderski, W. IR Thermography Nondestructive Testing Methods of Composite Materials Used in Aerospace Applications. In Proceedings of the 12th International Conference on Quantitative Infrared Thermography, The e-Journal of Nondestructive Testing, Mahabalipuram, India, 6–10 July 2016. [Google Scholar]
  14. Orton, B.R.; Copaul, M.; Velez-Ospina, C.E. Potential use of infrared thermography to detect aircraft pressurization leaks. Insight Non-Destr. Test. Cond. Monit. 1999, 41, 164–166. [Google Scholar]
  15. Wang, Y.; Gao, B.; Lok Woo, W.; Tian, G.; Maldague, X.; Zheng, L.; Guo, Z.; Zhu, Y. Thermal Pattern Contrast Diagnostic of Microcracks With Induction Thermography for Aircraft Braking Components. IEEE Trans. Ind. Inform. 2018, 14, 5563–5574. [Google Scholar] [CrossRef] [Green Version]
  16. White, J.E.; Tucholski, E.J.; Green, R.E. Nondestructive Testing of Aircraft and Spacecraft Wiring. Mater. Eval. 2003, 61, 1315–1320. [Google Scholar]
  17. Tulloch, J.S.; Jennings, M.C. Thermographic Wiring Inspection. U.S. Patent No. US 6,995,565 B1, 7 February 2006. [Google Scholar]
  18. Short, M.; Torres, J.; Kreckie, J. Thermal Imaging for Aircraft Rescue and Fire Fighting Applications; DOT/FAA/TC-17/27 Final Report; U.S. Department of Transportation, Federal Aviation Administration: Cambridge, MA, USA, 2017.
  19. Štumper, M.; Kraus, J. Thermal Imaging in Aviation. Mag. Aviat. Dev. 2015, 3, 13–16. [Google Scholar] [CrossRef]
  20. Matikainen, L.; Lehtomäki, M.; Ahokas, E.; Hyyppä, J.; Karjalainen, M.; Jaakkola, A.; Kukko, A.; Heinonen, T. Remote sensing methods for power line corridor surveys. ISPRS J. Photogramm. Remote Sens. 2016, 119, 10–31. [Google Scholar] [CrossRef] [Green Version]
  21. Gómez, C.; Green, D.R. Small unmanned airborne systems to support oil and gas pipeline monitoring and mapping. Arab. J. Geosci. 2017, 10, 202. [Google Scholar] [CrossRef]
  22. Kylili, A.; Fokaides, P.A.; Christou, P.; Kalogirou, S.A. Infrared thermography (IRT) applications for building diagnostics: A review. Appl. Energy 2014, 134, 531–549. [Google Scholar] [CrossRef]
  23. Omar, T.; Nehdi, M.L. Remote sensing of concrete bridge decks using unmanned aerial vehicle infrared thermography. Autom. Constr. 2017, 83, 360–371. [Google Scholar] [CrossRef]
  24. Harvey, M.C.; Rowland, J.; Luketina, K.M. Drone with Thermal Infrared Camera Provides high resolution georeferenced imagery of the Waikite Geothermal Area, New Zealand. J. Volcanol. Geotherm. Res. 2016, 325, 61–69. [Google Scholar] [CrossRef]
  25. Baranwal, N.; Mahulikar, S.P. Infrared Signature of Aircraft Engine with Choked Converging Nozzl. J. Thermophys. Heat Transf. 2016, 30, 1–9. [Google Scholar] [CrossRef]
  26. Ciampa, F.; Mahmoodi, P.; Pinto, F.; Meo, M. Recent Advances in Active Infrared Thermography for Non-Destructive Testing of Aerospace Components. Sensors 2018, 18, 609. [Google Scholar] [CrossRef]
  27. MacLeod, J.D.; Steckhan, P.; He, D. Infrared Thermal Imaging System as a Diagnostic Tool for Gas Turbine Engine Faults. In ASME 1994, International Gas Turbine and Aeroengine Congress and Exposition; American Society of Mechanical Engineers (ASME): New York, NY, USA, 1994; Volume 2. [Google Scholar]
  28. Bogdan, M.; Błachnio, J.; Kułaszka, A.; Derlatka, M. Assessing the Condition of Gas Turbine Rotor Blades with the Optoelectronic and Thermographic Methods. Metals 2019, 9, 31. [Google Scholar] [CrossRef]
  29. Yang, X.; Pang, S.; Shen, W.; Lin, X.; Jiang, K.; Wang, Y. Aero Engine Fault Diagnosis Using an Optimized Extreme Learning Machine. Int. J. Aerosp. Eng. 2016, 2016. [Google Scholar] [CrossRef]
  30. Ntantis, E.; Botsaris, P. Diagnostic Methods for an Aircraft Engine Performance. J. Eng. Sci. Technol. Rev. 2015, 8, 64–72. [Google Scholar] [CrossRef]
  31. Rajani, J. Engine Health Condition Monitoring—A Brief Review. Control Data Fusion E J. 2017, 1, 25–38. [Google Scholar]
  32. Armstrong, J.B.; Simon, D.L. Implementation of an Integrated On-Board Aircraft Engine Diagnostic Architecture. In Proceedings of the 47th Joint Propulsion Conference and Exhibit cosponsored by the AIAA, ASME, SAE, and ASEE, San Diego, CA, USA, 31 July 2011–3 August 2011. [Google Scholar]
  33. Rabenoro, T.; Lacaille, J.; Cottrell, M.; Rossi, F. A Methodology for the Diagnostic of Aircraft Engine Based on Indicators Aggregation. In Proceedings of the CDM 2014: Advances in Data Mining, Applications and Theoretical Aspects, St. Petersburg, Russia, 16–20 July 2014; Volume 8557, pp. 144–158. [Google Scholar]
  34. Seabra, J.; Campos, A. EHD Analysis of a Roller/Inner Ring Contact in a Jet Engine Roller Bearing. In Proceedings of the 82nd Meeting of the AGARD Structures and Materials Panel, Sesimbra, Portugal, 6–7 May 1996; Volume 589. [Google Scholar]
  35. Zaitouna, N.M.; Aqel, M.J. Survey on Image Segmentation Techniques. Procedia Comput. Sci. 2015, 65, 797–806. [Google Scholar] [CrossRef] [Green Version]
  36. Karamizadeh, S.; Abdullah, S.M.; Zamani, M.; Kherikhah, A. Pattern Recognition Techniques: Studies on Appropriate Classifications. ARPN J. Eng. Appl. Sci. 2014, 9, 791–799. [Google Scholar]
  37. Spontón, H.; Cardelino, J. A Review of Classic Edge Detectors. Image Process. Line 2015, 5, 90–123. [Google Scholar] [CrossRef] [Green Version]
  38. Egmont-Petersen, M.; Ridder, D.; Handels, H. Image processing with neural networks—A review. Pattern Recognit. 2002, 35, 2279–2301. [Google Scholar] [CrossRef]
  39. Vardasca, R.; Vaz, L.; Mendes, J. Classification and Decision Making of Medical Infrared Thermal Images. In Classification in BioApps; Lecture Notes in Computational Vision and Biomechanics; Dey, N., Ashour, A., Borra, S., Eds.; Springer: Cham, Switzerland, 2018; Volume 26. [Google Scholar]
  40. Zhiqiang, W.; Jun, L. A review of object detection based on convolutional neural network. In Proceedings of the 2017 36th Chinese Control Conference (CCC), Dalian, China, 26–28 July 2017. [Google Scholar]
  41. Rawat, W.; Wang, Z. Deep Convolutional Neural Networks for Image Classification: A Comprehensive Review. Neural Comput. 2017, 29, 1–98. [Google Scholar] [CrossRef]
  42. Kohonen, T. Self-Organizing Maps, 3rd ed.; Springer: Berlin/Heidelberg, Germany, 2001. [Google Scholar]
  43. Kohonen, T. MATLAB Implementations and Applications of the Self-Organizing Map; Unigrafia Oy: Helsinki, Finland, 2014. [Google Scholar]
  44. Zimmermann, R.; Brandmeier, M.; Andreani, L.; Mhopjeni, K.; Gloaguen, R. Remote Sensing Exploration of Nb-Ta-LREE-Enriched Carbonatite (Epembe/Namibia). Remote Sens. 2016, 8, 620. [Google Scholar] [CrossRef]
  45. Kim, S.; Singh, V.P. Spatial Disaggregation of Areal Rainfall Using Two Different Artificial Neural Networks Models. Water 2015, 7, 2707–2727. [Google Scholar] [CrossRef] [Green Version]
  46. Chi, D. Self-Organizing Map-Based Color Image Segmentation with k-Means Clustering and Saliency Map. ISRN Signal Process. 2011, 2011. [Google Scholar] [CrossRef]
  47. Xu, Y.; Ran, J.; Chen, H. Kohonen Neural Network Classification for Failure Process of Metallic Organic Coating in Corrosion Environment. Metals 2017, 7, 147. [Google Scholar] [Green Version]
  48. Ganguli, R. Gas Turbine Diagnostics: Signal Processing and Fault Isolation; CRC Press: Boca Raton, FL, USA, 2013. [Google Scholar]
  49. Li, Y.G. Performance Analysis Based Gas Turbine Diagnostics: A Review. Proc. Inst. Mech. Eng. Part A J. Power Energy 2002, 216, 363–377. [Google Scholar] [CrossRef]
  50. Mohammadi, E.; Montazeri-Gh, M. Performance Enhancement of Global Optimization-Based Gas Turbine Fault Diagnosis Systems. J. Propuls. Power 2016, 32, 214–224. [Google Scholar] [CrossRef]
  51. Li, Z.; Zhong, S.-S.; Lin, L. Novel Gas Turbine Fault Diagnosis Method Based on Performance Deviation Model. J. Propuls. Power 2017, 33, 730–739. [Google Scholar] [CrossRef]
  52. Meskin, N.; Naderi, E.; Khorasani, K. A Multiple Model-Based Approach for Fault Diagnosis of Jet Engines. IEEE Trans. Control Syst. Technol. 2013, 21, 254–262. [Google Scholar] [CrossRef]
  53. Vanini, Z.N.S.; Khorasani, K.; Meskin, N. Fault detection and isolation of a dual spool gas turbine engine using dynamic neural networks and multiple model approach. Inf. Sci. 2014, 259, 234–251. [Google Scholar] [CrossRef]
  54. Szentkuti, A.; Kavanagh, H.S.; Grazio, S. Infrared thermography and image analysis for biomedical use. Period. Biol. 2011, 113, 385–392. [Google Scholar]
  55. Rojas, R. Neural Networks—A Systematic Introduction; Springer: Berlin, Germany; New York, NY, USA, 1996. [Google Scholar]
  56. Abraham, A. Handbook of Measuring System: Design Rule-Based Expert Systems; John Wiley & Sons: New York, NY, USA, 2005. [Google Scholar]
  57. Buchanan, B.G.; Smith, R.G. Fundamentals of Expert Systems. Annu. Rev. Comput. Sci. 1988, 3, 23–58. [Google Scholar] [CrossRef] [Green Version]
  58. Yang, J.; Ye, C.; Zhang, X. An expert system shell for fault diagnosis. Robotica 2001, 19, 669–674. [Google Scholar] [CrossRef]
  59. Chlebus, E.; Krot, K.; Kuliberda, M. Hybrid Artificial Intelligent Systems: Rule-Based Expert System Dedicated for Technological Applications; Springer: Berlin/Heidelberg, Germany, 2011; pp. 373–380. [Google Scholar]
  60. Dvořák, J. Expertní Systémy; Vysoké Učení Technické v Brne: 2004. Available online: http://www.uai.fme.vutbr.cz/~jdvorak/Opory/ExpertniSystemy.pdf (accessed on 22 February 2019).
  61. Sinha, A.P.; Zhao, H. Tuning Expert Systems for Cost-Sensitive Decisions. Adv. Artif. Intell. 2011, 2011. [Google Scholar] [CrossRef]
  62. Andoga, R.; Főző, L.; Judičák, J.; Bréda, R.; Szabo, S.; Rozenberg, R.; Džunda, M. Intelligent Situational Control of Small Turbojet Engines. Int. J. Aerosp. Eng. 2018, 2018. [Google Scholar] [CrossRef]
  63. Cruz-Albarran, I.A.; Benitez-Rangel, J.P.; Osornio-Rios, R.; Dominguez, B.T.; Medina, D.A.R.; Morales-Hernández, L.A. A new approach to obtain a colour palette in thermographic images. Quant. InfraRed Thermogr. J. 2019, 16, 35–54. [Google Scholar] [CrossRef]
  64. Roman, R.-C.; Radac, M.-B.; Precup, R.-E.; Petriu, E.M. Data-driven Model-Free Adaptive Control Tuned by Virtual Reference Feedback Tuning. Acta Polytech. Hung. 2016, 13, 83–96. [Google Scholar] [CrossRef]
  65. Andoga, R.; Adamčík, F.; Hrabovský, J.; Vaispacher, T. A hybrid diagnostic system for a small turbojet engine. NASE More 2016, 63, 86–92. [Google Scholar] [CrossRef]
Figure 1. Procedure for the detection of temperature anomalies in engine casings by analyzing an infrared image.
Applsci 09 02253 g001
Figure 2. The conceptual design of the diagnostic system.
Applsci 09 02253 g002
Figure 3. The structure of a Kohonen network.
Applsci 09 02253 g003
Figure 4. A single-row structure of the Kohonen layer.
Applsci 09 02253 g004
Figure 5. The self-organization process with a single-row structure of the Kohonen layer.
Applsci 09 02253 g005
Figure 6. The structure of expert systems and their integration (reproduced from [57]).
Applsci 09 02253 g006
Figure 7. The connection between the Kohonen neural network and an expert system.
Applsci 09 02253 g007
Figure 8. An example of an AND/OR inference network (reproduced from [61]).
Applsci 09 02253 g008
Figure 9. Views of the iSTC-21v turbojet engine (left) and its starting process (right) in a laboratory.
Applsci 09 02253 g009
Figure 10. Schematic of the measurement and data acquisition system used in this study.
Applsci 09 02253 g010
Figure 11. The arrangement of the FLIR Thermovision A40 thermal imaging camera in the laboratory.
Applsci 09 02253 g011
Figure 12. The measured parameters of the iSTC-21v turbojet engine that are usable for infrared thermography-based diagnostics.
Applsci 09 02253 g012
Figure 13. The structure of the Kohonen self-organizing feature map for infrared image segmentation.
Applsci 09 02253 g013
Figure 14. The measured parameters during a single run of the iSTC-21v engine.
Applsci 09 02253 g014
Figure 15. The segmented thermal images produced by the Kohonen map.
Applsci 09 02253 g015
Figure 16. The size Si of each segmented area for five example points.
Applsci 09 02253 g016
Figure 17. Thermal anomalies correctly classified by the Kohonen network.
Applsci 09 02253 g017
Figure 18. Division of the infrared image for the insertion of the artificial anomaly.
Applsci 09 02253 g018
Figure 19. The inference network of the designed diagnostic expert system.
Applsci 09 02253 g019
Figure 20. The division of the engine’s operation into technical states D0 and D1.
Applsci 09 02253 g020
Table 1. Training parameters.
Topology functionGrid
Distance computationDirect
Initial neighborhood size3
Initial learning rate0.9
Training iterations500
Table 2. The confusion matrix of the trained Kohonen self-organizing feature map (SOFM).
Actual Class
N1N2N3N4N5
Predicted ClassN12865200
N2102841510
N341027246
N4011027534
N500120260
Accuracy95.3%94.6%90.6%91.6%86%
Total Accuracy91.8% (1377/1500)
Table 3. A partial set of rules in the knowledge base of the proposed expert diagnostic system.
IFS1IS<13,200; 13,300>ANDS1_d is <−5; 50 >=> R1
IFS2IS<3600; 3700>ANDS2_d is <−10; 30>=> R2
IFS3IS<7300; 7420>ANDS3_d is <−5 ; 45>=> R3
IFS3_dIS<46; 160 >=> R4
IFS3_dIS<−85; −6>=> R5
IFS2_dIS<31; 140>=> R6
IFS2_dIS<−120; −11>=> R7
IFS1_dIS<51; 160>=> R8
Table 4. Technical states of the turbojet engine.
D0Normal condition
D1Light overheating
D2Moderate overheating
D3Critical overheating
D4Light structural defect
D5Critical structural defect
Table 5. Inference of the diagnostic signals.
IFR1ANDR2ANDR3=> D0
IFR1ANDR2ANDR4=> D1
IFR1ANDR5ANDR6=> D2
IFR3ANDR7ANDR8=> D3
IFR2ANDR5ANDR8=> D4
IFR5ANDR7ANDR8=> D5
Table 6. Testing of the expert system for the evaluation of hypotheses D0, D1, D4, and D5.
Applsci 09 02253 i001 Applsci 09 02253 i002D0—normal condition
R1: S1 = 13,270 AND S1_d = 20
R2: S2 = 3628 AND S2_d = 14
R3: S3 = 7374, AND S3_d = 24
R1 AND R2 AND R3 => D0
Applsci 09 02253 i003 Applsci 09 02253 i004D1—light overheating
R1: S1 = 13,227 AND S1_d = 31
R2: S2 = 3643 AND S2_d = −5
R4: S3_d = 112
R1 AND R2 AND R4 => D1
Applsci 09 02253 i005 Applsci 09 02253 i006D4—light structural defect
R2: S2 = 3671 AND S2_d = 3
R5: S3_d = −67
R8: S1_d = 92
R2 AND R5 AND R8 => D4
Applsci 09 02253 i007 Applsci 09 02253 i008D5—critical structural defect
R5: S3_d = −72
R7: S2_d = −45
R8: S1_d = 118
R5 AND R7 AND R8 => D5

