Article

Classification of Marine Vessels with Multi-Feature Structure Fusion

1
Department of Information Science, Xi’an University of Technology, Xi’an 710048, China
2
Shaanxi Provincial Key Laboratory of Printing and Packaging Engineering, Xi’an University of Technology, Xi’an 710048, China
*
Author to whom correspondence should be addressed.
Appl. Sci. 2019, 9(10), 2153; https://doi.org/10.3390/app9102153
Submission received: 14 April 2019 / Revised: 12 May 2019 / Accepted: 22 May 2019 / Published: 27 May 2019
(This article belongs to the Special Issue Multimodal Deep Learning Methods for Video Analytics)

Abstract

:
The classification of marine vessels is one of the important problems of maritime traffic. To fully exploit the complementarity between different features and to more effectively identify marine vessels, a novel feature structure fusion method based on spectral regression discriminant analysis (SF-SRDA) was proposed. Firstly, we selected the different convolutional neural network features that better describe the characteristics of ships, and constructed the features based on graphs by the similarity metric. Then we weighed the concatenate multi-feature and fused their structures according to the linear relationship assumption. Finally, we constructed the optimization formula to solve the fusion features and structure by using spectral regression discriminant analyses. Experiments on the VAIS dataset show that the proposed SF-SRDA method can reduce the feature dimension from the original 102,400 dimensions to 5 dimensions, that the classification accuracy of visible images can reach 87.60%, and that that of the infrared image can reach 74.68% at daytime. The experimental results demonstrate that the proposed method can not only extract the optimal features from the original redundant feature space, but also greatly reduce the dimensions of the feature. Furthermore, the classification performance of SF-SRDA also gets a promising result.

1. Introduction

The classification of marine vessels is an important issue in maritime safety and traffic control. It has a broad application in both civil and military industries [1]. Compared with other target recognition problems, the classification of marine vessels is more difficult because of the large changes in viewing perspectives, illumination conditions, and scale, and the image background is disorganized [2].
According to the image types of marine vessels, there are mainly synthetic aperture radar images (SAR), spaceborne optical images (SOI), visible images and infrared images (IR). Because SAR images are characterized by all-day and all-weather imaging, Eldhuset et al. [3] developed an automatic ship wake detection system for spaceborne SAR images in 1996. However, the number of SAR sensors is limited, the revisit period is long, and the resolution is low. In 2010, Zhu et al. [4] conducted experiments on SOI image sets with higher resolution captured by optical sensors from multiple satellites, which can effectively distinguish between ships and non-ships, and obtain satisfactory ship detection performance. Similarly, satellite resources were still limited, and it is obviously more convenient for the camera to collect images. In 2015, Zhang et al. [5] published the world’s first marine vessel dataset with paired visible and infrared images, which lead to progress in the research field of marine vessel classification. The visible image has sufficient detail and color information, and the infrared image has a strong adaptability to the environment, which meant combining the two images yielded a higher accuracy of vessel classification.
From the perspective of feature extraction, there are two types of methods for classifying marine vessels: methods based on traditional features and methods based on a convolutional neural network (CNN). Methods based on traditional features rely on artificially designed feature vectors for target recognition and classification [6,7]. Zhang Difei et al. [8] used the Histogram of Oriented Gradient (HOG) feature combined with the support vector machine (SVM) method to identify and classify the infrared ship targets on the sea surface, which can overcome the background interference to a certain extent. However, in the experiment, there are no tests on multiple targets, deformation, illumination, or other changes. Feineigle et al. [9] used SIFT descriptors to identify ship targets in the port, and realized the invariance of illumination and angle by describing and matching the local features of the target. Yet using sliding window to extract features of targets resulted in high dimension leads to low computational efficiency. Sánchez et al. [10] combined Fisher vector with Gaussian mixture model to linearly classify large-scale datasets. The target category contained more than one thousand kinds and the best classification accuracy was obtained by optimizing the loss function. The literature [11] has proposed that different features have their own advantages and disadvantages in different aspects, so the idea of using three features was synthetically adopted. The three features consist of multi-scale completed local binary patterns (MS-CLBP), Bag of visual words (BOVW), and spatial pyramid matching (SPM). Methods based on CNN mainly refer to select the features of a certain layer in the convolutional neural network, and then use the support vector machine (SVM), extreme learning machine (ELM) or logistic regression classifier [12,13,14,15,16,17,18]. The literature [5] has used the 15th layer feature extracted from the pre-trained model vgg-16 based on the ImageNet dataset. Literature [12] has adopted AlexNet, VGG-16 and Inception-V3 to extract the features of the image, and then normalizes the different features into the same feature space. Literature [13] has designed a convolutional neural network extraction feature, and combined the traditional Gabor feature with MS-CLBP feature to describe the ship’s target. Literature [16] has trained extreme learning machine for exploiting the correlation of multi-color features. Literature [17] has extracted features from a pre-trained 16-layer convolutional neural network (vgg-16) and train the logistic regression classifier for object recognition. Literature [18] has constructed a dual-flow DNN network to extract the high-frequency and low-frequency features of ship images, and finally ELM aggregates feature and decision-making. Literature [19] has proposed a classification framework consists of a multi-feature ensemble based on convolutional neural network (ME-CNN). Literature [20] has introduced a new approach based on ELM to learn discriminative CNN features. Compared with the method based on traditional features, the method based on CNN shows powerful capabilities of feature extraction.
Considering the fact that a single feature may not be comprehensive enough for representing an image, some scholars have made further explorations on feature fusion. Some existing feature fusion methods mostly have used simple concatenation of different features in series [12,13], which do not consider the heterogeneous characteristics between different features. Sun et al. [21] have adopted Canonical Correlation Analysis (CCA) for feature fusion to achieve compression of feature vector dimensions. Subsequently, KCCA (Kernel CCA) [22] and OCCA (Orthogonal CCA) [23] were presented for feature fusion. Lin et al. [24,25,26,27] proposed a multi-feature structure fusion method, which achieved good recognition results in many fields. The method first constructs the internal structure of each feature by the similarity measure, and then performs algebraic operations on the corresponding structure and features based on locality preserving projection (LPP) [28]. The method projects features from the combined high-dimensional space to the low-dimensional space. This method not only retains the internal structure of the features, but also greatly reduces the dimension of the features and improves the performance of object classification.
Although the method of structural fusion can fuse different features together, this method belongs to unsupervised learning method. The weakness of this method is that the feature’s category information is not integrated into the process of feature fusion, so the natural distribution structure of the class from multi-feature is usually ignored. The structural information can enhance the discrimination of object classification. To solve this issue, a novel multi-feature structure fusion based on spectral regression discriminant analysis (SF-SRDA) is proposed in this paper by combining structural fusion [24] with linear discriminant analysis (LDA) [29,30]. SF-SRDA is a supervised dimension reduction technology, so that the method can not only preserve the internal structure of the category information in the process of feature fusion, but also select the minimal dimension features. The minimal dimension features can completely describe the target for object recognition and classification. The overall framework of the method is shown in Figure 1 (In this paper, two-type features indicate multi-feature for structure fusion), and the focus (which will be detailed in Section 3) of this paper is marked with a red box. The main contributions of this paper can be summarized as follows: (1) we propose a feature structure fusion method based on LDA. The method can not only maintain the internal structure of the feature, but also integrate the category information to improve recognition performance. (2) Due to the consideration of category information and the intrinsic structure, the feature dimension can be greatly reduced from 102,400 to 5 dimensions. (3) The experimental results are promising for marine vessels classification.
The following sections are arranged as follows. Section 2 is the selection of multiple features. Section 3 describes the construction of the internal structure of features and the structure fusion mechanism of the feature. Section 4 gives the experimental results and comparison with other state-of-art methods. Finally, a conclusion is made and the work is summarized in Section 5.

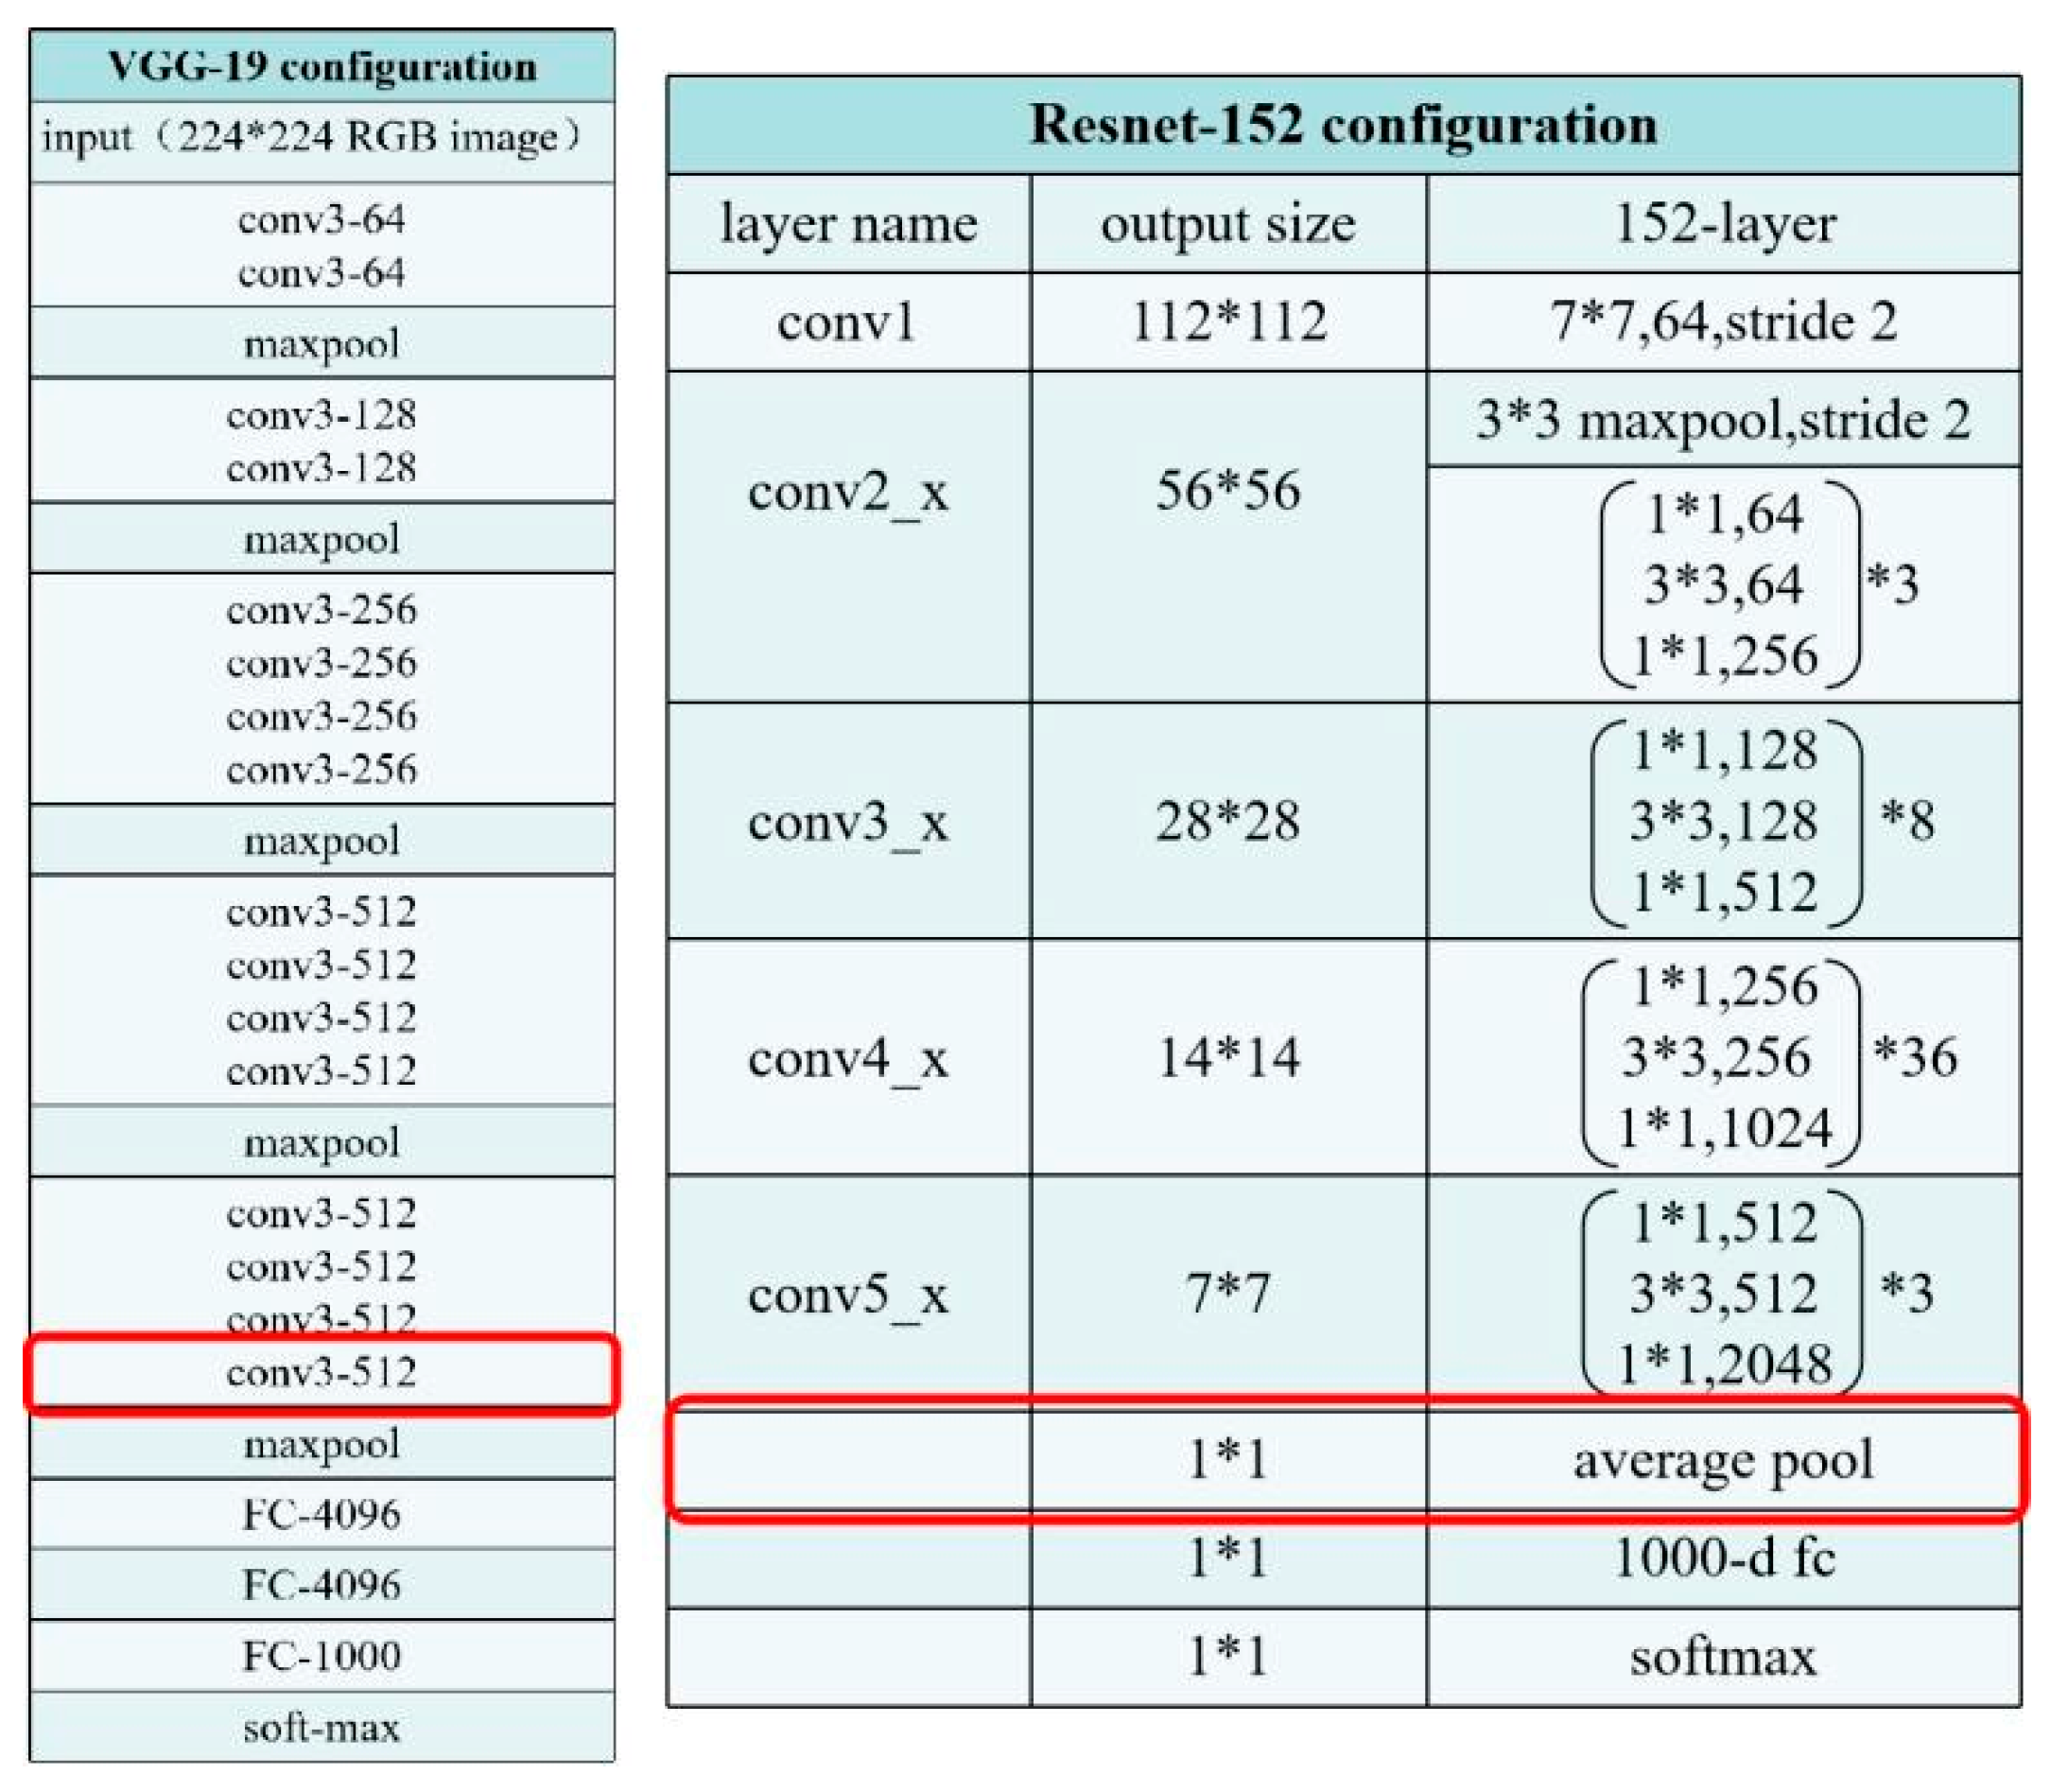
2. Feature Selection

To select features that can better describe the visual characteristic of the vessel, we conducted some experiments with typical traditional features and CNN features according to the existing literature. Traditional features include both the HOG [6] and LBP [31] features. CNN features include the extracted features of different depths and different layers in the pre-trained CNN models, which refer to VGG [32], GoogLeNet [33], and ResNet [34]. These features can be sent to the SVM classifier for classification. These experiments involve the visual information that includes the visible and IR vessel images provided in [5]. Table 1 shows the dimensionality of each feature and the classification accuracy about visible and IR images. In Table 1, the relu5-4 layer features based on VGG-19 [32] and the pool5 layer features based on ResNet-152 [34] achieve a higher correct recognition accuracy and have the better complementarity because of the large different network structure, so we selected these two types of features for subsequent experimental fusion. Figure 2 shows VGG-19 or ResNet-152 of the structure, in which layer output selected as features marked with a red box.

3. Multi-feature Structure Fusion Based on Linear Discriminant Analysis

Linear discriminant analysis (LDA) is a very popular dimensionality reduction technique, which is widely used in the field of pattern recognition. However, in the process of dimensionality reduction, the natural distribution structure of the class from a multi-feature is not considered, resulting in the complementarity structure information loss with class labels between multi-features after dimensionality reduction. However, structure information mining is a key question in vessel target recognition. In existing methods, the structure fusion [24] method applies a multi-structure fusion, but this does not take into account the category information of the features. Therefore, this method makes feature discrimination insufficient. Based on both the linear discriminant analysis and structure fusion, we propose a fusion method of the multi-feature structure that considers the class label in a supervised way.

3.1. Linear Discriminant Analysis

LDA [29] is a supervised dimensionality reduction technology. The idea of LDA minimizes the variance within a class and simultaneously maximizes the variance between classes. After projecting the data into a low dimensional space, the same category data are as close as possible, and the different category data are as far as possible. By eigenvalue decomposition of the divergence matrix of the given training data, the optimal projection function of LDA can be solved. A brief introduction of LDA and spectral regression discriminant analysis (SRDA) [29] is shown below.
Suppose m samples x 1 , x 2 , , x m , the optimization function of LDA is shown in Equation (1):
a * = a r g m a x a a T S b a a T S w a
S b = k = 1 c m k ( μ ( k ) μ ) ( μ ( k ) μ ) T
S w = k = 1 c ( i = 1 m k ( x i ( k ) μ ( k ) ) ( x i ( k ) μ ( k ) ) T )
where c is the number of classes, μ is the mean vector of all samples, m k is the number of samples of the k t h class, μ ( k ) the mean vector of the k t h class, x i ( k ) the i t h sample in the k t h class, S w is the intra-class divergence matrix, and S b is the inter-class divergence matrix.
Define S t = i = 1 m ( x i μ ) ( x i μ ) T as the total divergence matrix ( S t = S b + S w ), and the optimization function of LDA in Equation (1) is equivalent to Equation (4).
a * = a r g m a x a a T S b a a T S t a
The optimization problem of Equation (4) is equivalent to solving the following generalized eigenvalue problem:
S b a = λ S t a
Then, Equation (2) can be converted to Equation (6):
S b = k = 1 c m k ( μ ( k ) μ ) ( μ ( k ) μ ) T = k = 1 c m k ( 1 m k i = 1 m k ( x i ( k ) μ ) ) ( 1 m k i = 1 m k ( x i ( k ) μ ) ) T = k = 1 c 1 m k ( i = 1 m k x ¯ i ( k ) i = 1 m k ( x ¯ i ( k ) ) T ) = k = 1 c X ¯ ( k ) W ( k ) ( X ¯ ( k ) ) T = X ¯ W X ¯ T
where W ( k ) is a m k × m k matrix where all elements are 1 / m k . W is a m × m matrix as follows:
W = [ W ( 1 ) 0 0 0 W ( 2 ) 0 0 0 W ( c ) ]
x ¯ i = x i μ stands for the centralized data point, X ¯ ( k ) = [ x ¯ 1 ( k ) , , x ¯ m k ( k ) ] denotes the centralized data matrix of the k t h class, and X ¯ = [ X ¯ ( 1 ) , , X ¯ ( c ) ] is the centralized data matrix. Since S t = X ¯ X ¯ T , the generalized eigenvalue problem of Equation (5) can be converted as follows:
X ¯ W X ¯ T a = λ X ¯ X ¯ T a
To solve the eigenvector problem of LDA in Equation (8) more effectively, the literature [29] has proposed spectral regression discriminant analysis (SRDA). Let X ¯ T a = y ¯ , and then Equation (8) can be transformed into:
W   y ¯ = λ   y ¯
Since the eigenvalue λ of Equations (8) and (9) are the same, the eigenvector a of X ¯ T a = y ¯ is the same as the eigenvector a in Equation (8). For the solution of X ¯ T a = y ¯ , a possible solution is to use the least squares method, as shown in Equation (10):
a = arg min a i = 1 m ( a T x ¯ i y ¯ i ) 2
By solving Equations (9) and (10), the mapping matrix can be obtained as A = [ a 1 , a 2 , , a c 1 ] . Thus, the features after dimension reduction is obtained by Y = A T X , where Y is a c 1 dimensional vector through projection.

3.2. Structure Fusion Mechanism

Structure fusion [24] means that the structures (the similarity measure is used to represent the internal structure of the feature) of different features are merged by the algebraic optimization. The combined feature is mapped onto a new structure-fusion feature by the mapping matrix under consideration with a fusion structure. Therefore, the literature [24] has proposed a structure fusion method based on a locality-preserving projection (SFLPP).
X 1 = [ x 11 , x 12 , , x 1 m ] and X 2 = [ x 21 , x 22 , , x 2 m ] are the high-dimensional feature sets of the multi-feature, where x 1 i R D 1 and x 2 i R D 2   ( i = 1 , 2 , , m ) . These feature matrixes are then combined into X 3 = [ x 31 , x 32 , , x 3 m ] and x 3 i = [ x 1 i x 2 i ] R D 1 + D 2 . The internal structure of the features W k = { W k i j }   ( k = 1 , 2 ; i = 1 , 2 , , m ; j = 1 , 2 , , m ) is measured by the similarity measure, and they are calculated by the χ 2 metric distance as formula (11); the specific formula of the χ 2 metric is described in the literature [24].
W k i j = { e d ( x k i , x k j ) / σ k , x k i   and   x k j   is   neighbor 0   , x k i   and   x k j   is   not   neighbor
W 1 = { W 1 i j } or W 2 = { W 2 i j } respectively is a single-feature structure. The structure of the combined feature X 3 can be represented as W = W 1 + W 2 . The literature [24] demonstrates that W has the same characteristics as W 1 and W 2 due to their linear relationship, so W can indirectly represent the internal structure of the combined feature X 3 .
By performing a specific optimization solution on the combined feature X 3 and its internal structure W , the combined feature can be mapped into a new structure fusion feature. More details can be found in [24] and [25], the former of which refers to the optimized formula of LPP. Since LPP is an unsupervised method, the category information is not integrated into the feature structure fusion process. Therefore, the recognition performance of SFLPP needs to be further improved by considering the category information.

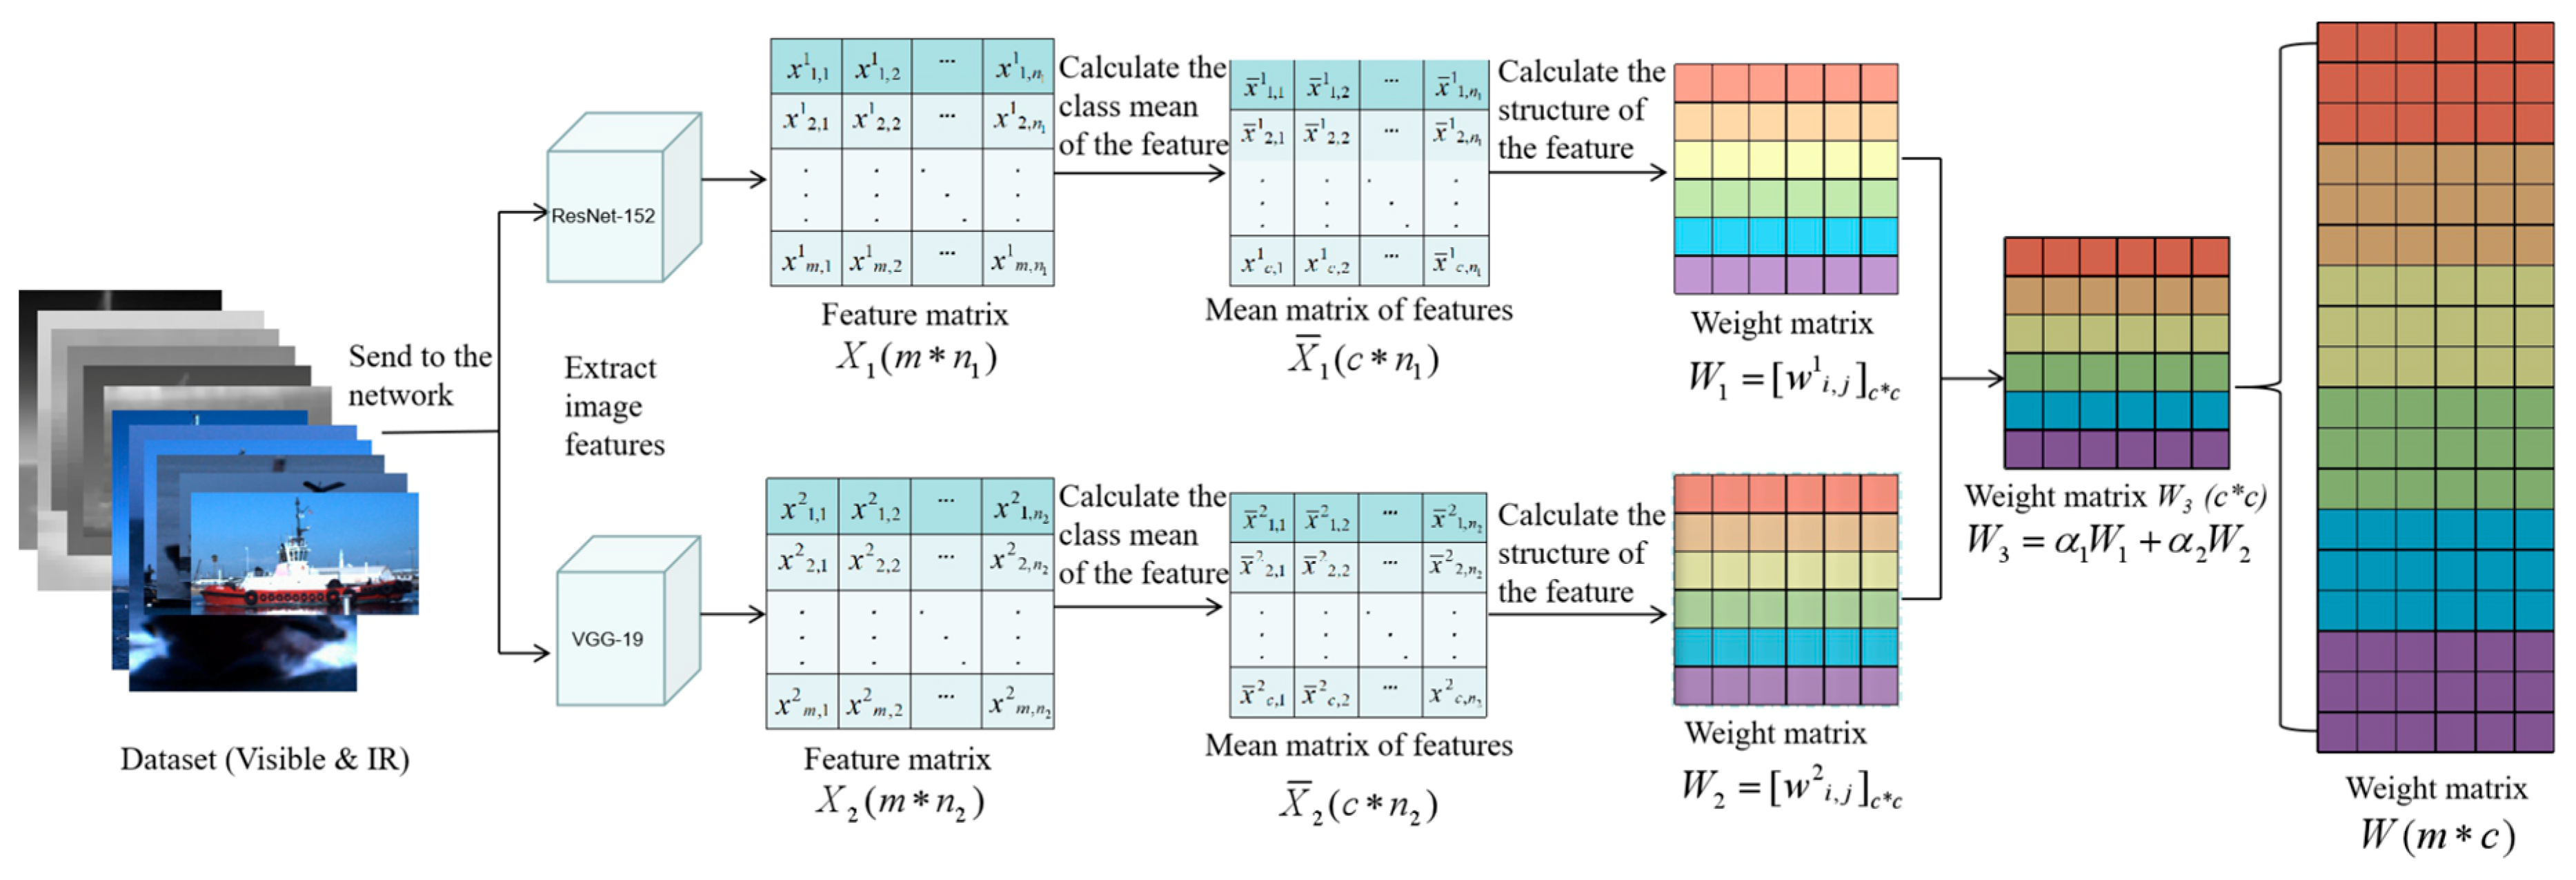
3.3. Multi-feature Structure Fusion Based on Linear Discriminant Analysis

In the LDA, the inter-class matrix S b in Equation (6) contains a matrix W on class information. In the final solution of Equation (8), different categories information only show in the weight of matrix W when solving the equation. The weight matrix W in the original formula is as shown in Equation (7). The weights of the same class are same, while the weights of different classes are different. Each weight is marked as 1 / m k . The information of the class is only related to the sample number of the class.
To enhance feature discrimination, we incorporate class information into feature structure fusion process. For this purpose, SF-SRDA is proposed for combining LDA with structure fusion. The schematic diagram of the method is shown in Figure 3. The core of the method is how to construct a weight matrix (it represents the internal structure of feature) as shown in Equation (7). Our weight matrix contains both the class information and the structural information of the feature, and replaces the original weight matrix with the internal structure of the combined feature. The proposed method mainly includes three aspects: one is the construction of the weight matrix of the same kind feature, which comes from the same extracting method; the other is the weight matrix fusion of the different kind features, which are extracted by the various methods; and the third is the weight matrix generation after the feature weighting.

3.3.1. Weight Matrix Construction of the Same Kind Feature

Firstly, we extract the selected features in training image samples, such as the pool5 layer feature of ResNet-152 and the relu5-4 layer feature of VGG-19 in Figure 2. Suppose the number of training samples is m ; the class number of samples is c ; the feature dimensions of ResNet-152 and VGG-19 are n 1 and n 2 respectively. We define feature matrix X 1 = [ x 1 1 , x 1 2 , , x 1 m ] R n 1 and X 2 = [ x 2 1 , x 2 2 , , x 2 m ] R n 2 . Then, we calculate the respective class feature matrices X ¯ 1 = [ x ¯ 1 1 , x ¯ 1 2 , , x ¯ 1 c ] R n 1 and X ¯ 2 = [ x ¯ 2 1 , x ¯ 2 2 , , x ¯ 2 c ] R n 2 , here x ¯ p q = 1 c p i = 1 c p x i q , p = { 1 , 2 , c } , q = { 1 , 2 } and c p is the sample of each class. Finally, construct weight matrix W 1 = [ w 1 i , j ] c * c and W 2 = [ w 2 i , j ] c * c for each kind of feature, where the element of matrix W 1 and W 2 are as follows:
w 1 i , j = { e d ( x ¯ 1 i , x ¯ 1 j ) / t , x ¯ 1 i   and   x ¯ 1 j   are   k   neighbor 0   ,   else
w 2 i , j = { e d ( x ¯ 2 i , x ¯ 2 j ) / t , x ¯ 2 i   and   x ¯ 2 j   are   k   neighbor 0   ,   else
In the Formulas (12) and (13), d ( a , b ) represents the Euclidean distance of vectors a and b , and t is selected to be 0.4. The weight matrix W 1 and W 2 reflect the relationship between each class center and others. In other words, these weight matrixes are the description of the relationship between classes.

3.3.2. Weight Matrix Fusion of Different Kind Features

To fuse the weight matrix of different type features, we sum the weighted W 1 and W 2 matrix based on ResNet-152 and VGG-19 features in this paper. W 3 = α 1 W 1 + α 2 W 2 , where α 1 = 0 . 6 and α 2 = 0 . 4 by cross-validation.

3.3.3. Weight Matrix Generation after Feature Weighting

We combine feature X 1 and feature X 2 by the proportional weighted stitching, that is X 3 = [ X 1 * β 1 X 2 * β 2 ] T , here β 1 = 0 . 6 and β 2 = 0 . 4 is selected by cross-validation.
To match the weighted spliced feature X 3 , the weight matrix W is produced by assigning each class weights in W 3 to all samples of the corresponding class, as shown in Equation (14).
W = [ r e p m a t ( W 3 , 1 , m 1 ) r e p m a t ( W 3 , 2 , m 2 ) r e p m a t ( W 3 , c , m c ) ] m c
where the operator r e p m a t ( W 3 , k , m k ) means that the k t h row of matrix W 3 is copied m k times as m k rows of matrix W .
The combined feature X 3 and its internal structure W are constructed by the above method, and then Equation (8) is reformulated as Equation (15):
X ¯ 3 W X ¯ 3 T a = λ X ¯ 3 X ¯ 3 T a
To solve Equation (15), the mapping matrix A = [ a 1 , a 2 , , a c 1 ] can be obtained by using the SRDA method proposed in [29], followed by the feature after structure fusion is Y = A T X .
For the fusion feature, we calculated the mean of each class samples to get each class feature, and used the nearest neighbor method to determine the classification of each sample.

4. Experimental Results and Analysis
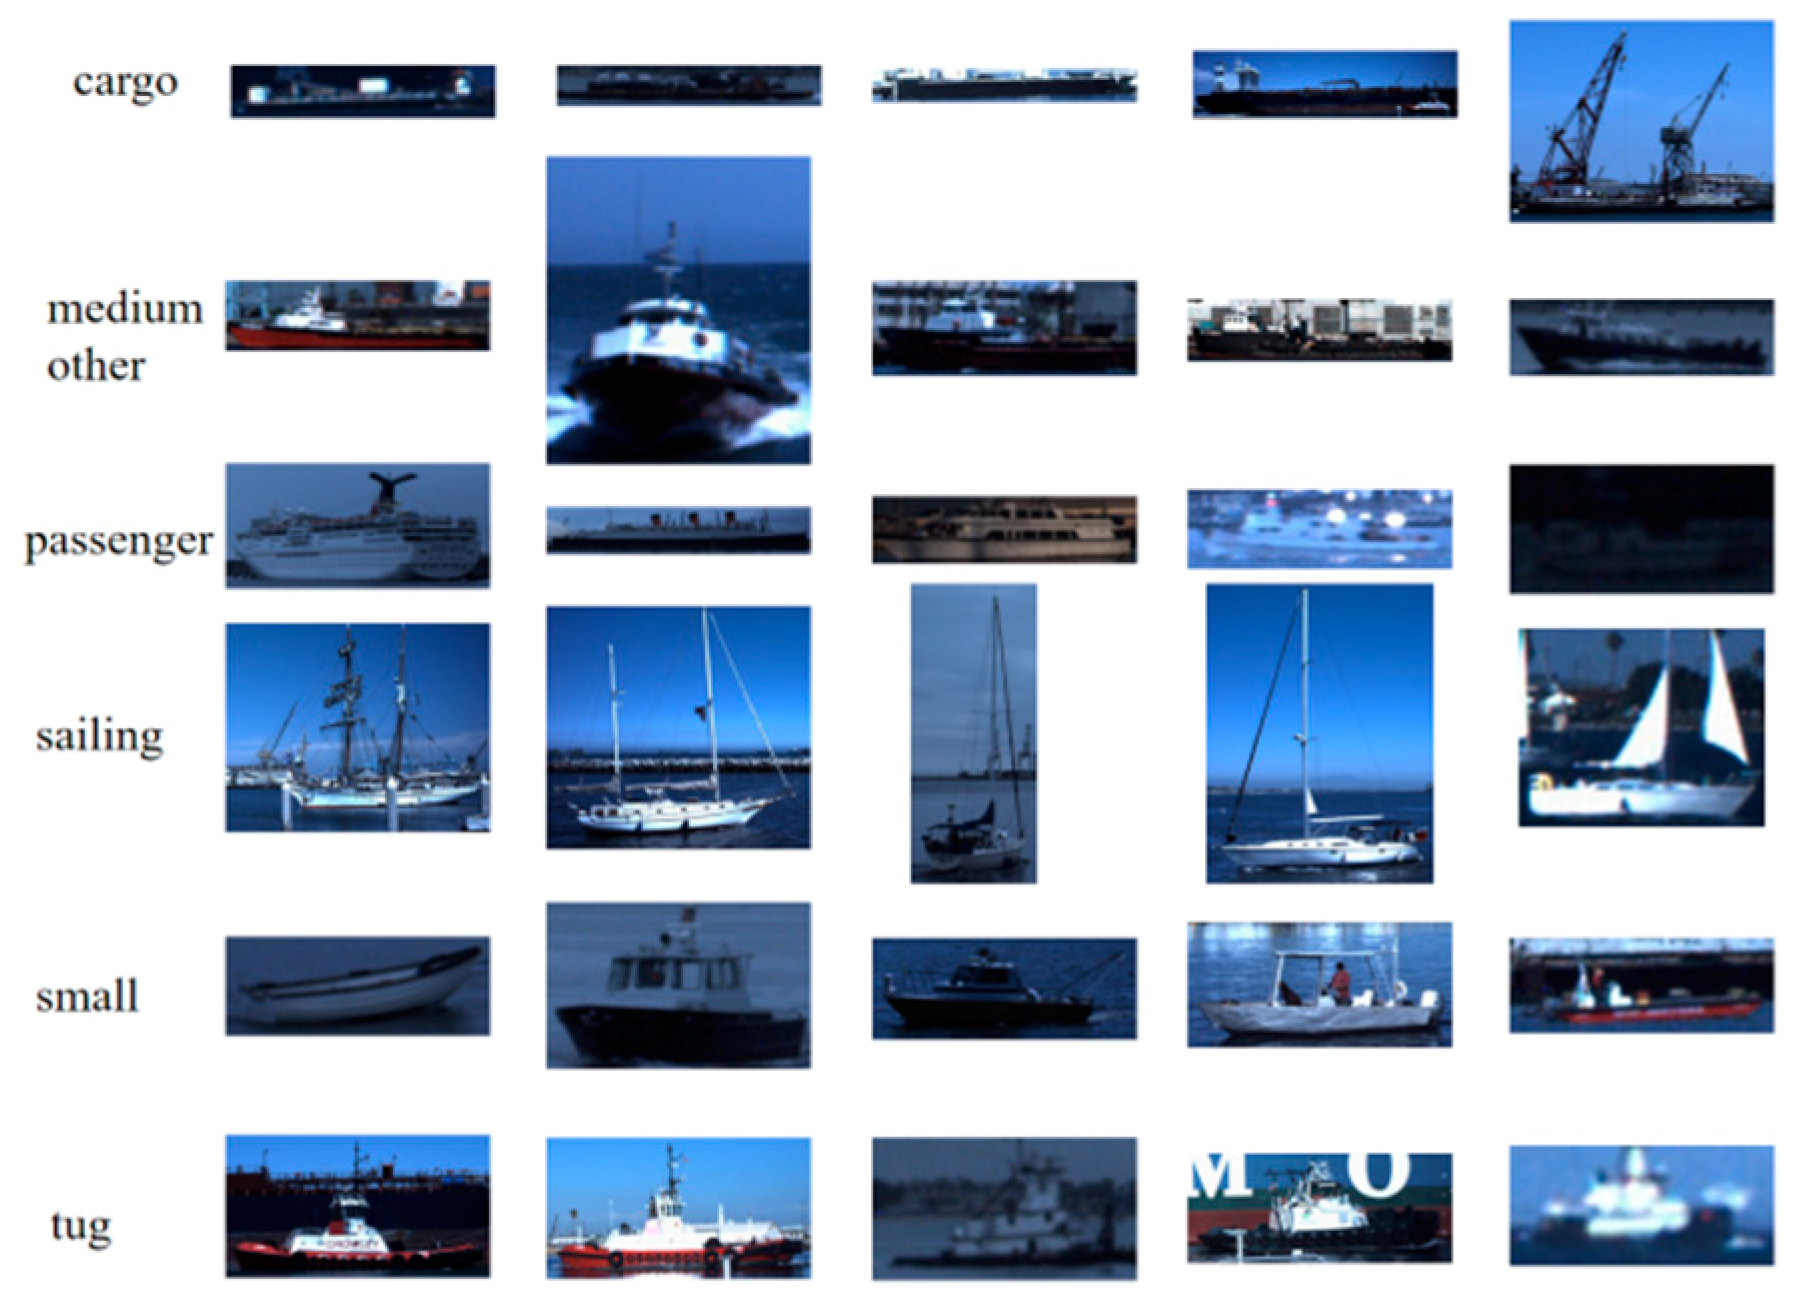
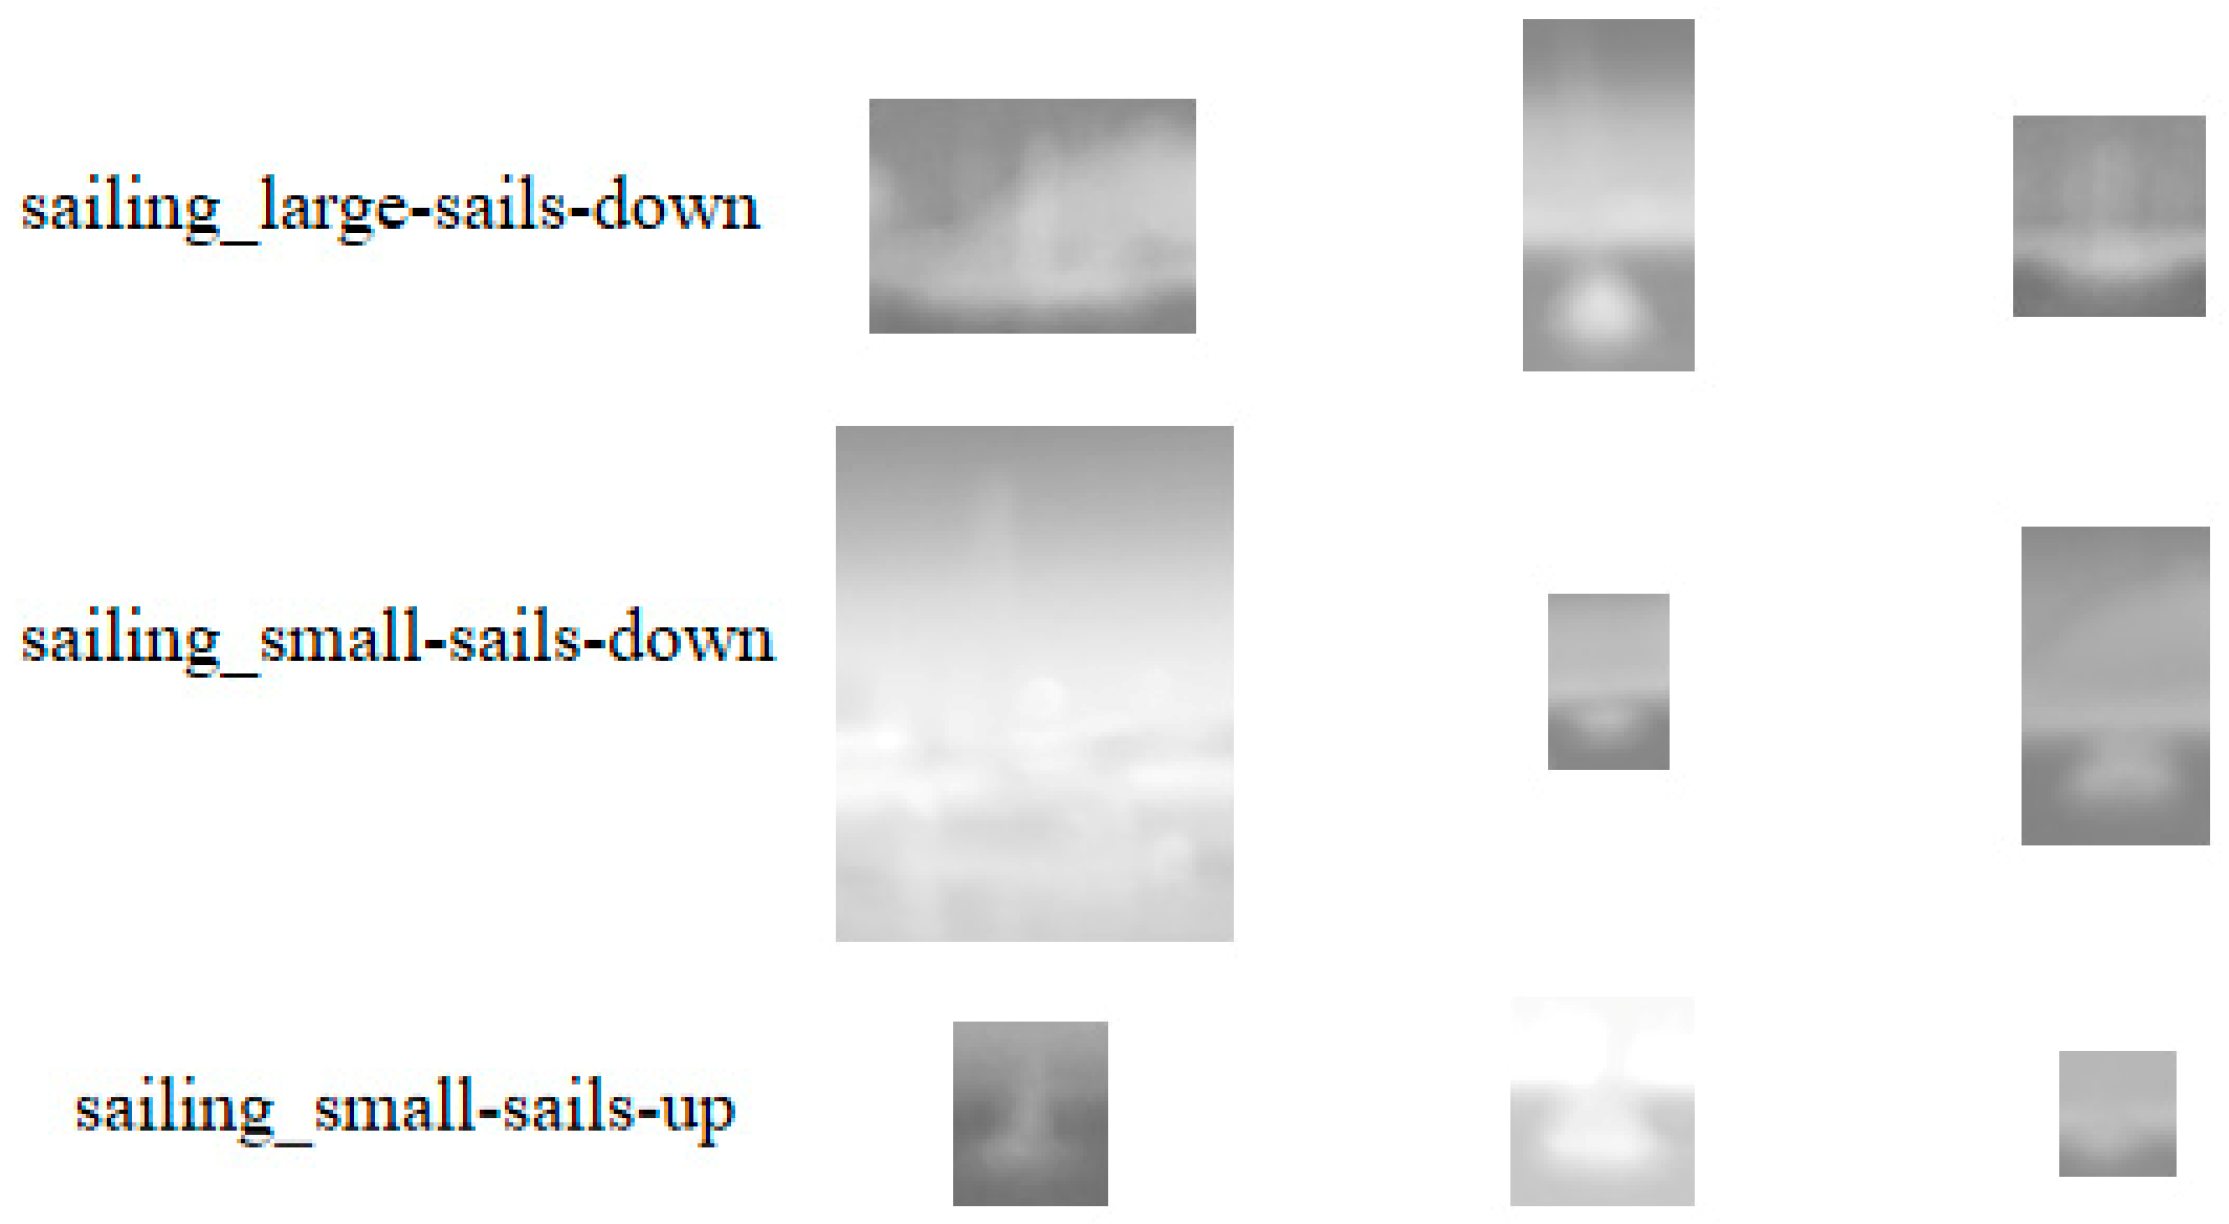
4.1. Dataset

The experiment used the VAIS dataset, which was the first publicly available dataset presented at the CVPR conference in 2015 [5], and it contains pairs of both visible and infrared vessel images. The dataset consists of 1623 visible and 1242 infrared images—a total of 2865 images—in which there are 1088 pairs (the visible and corresponding infrared image pairs). The dataset includes six coarse-grained categories, namely merchant ships, medium-other ships, passenger ships, sailing ships, small boats, and tugboats. It can also be subdivided into 15 fine-grained categories, such as the sailing ships that can be further subdivided into sailing-large-sails-down, sailing-small-sails-down, and sailing-small-sails-up. Table 2 gives the distribution of the VAIS dataset in the experiment, where it can be seen that the distribution of samples in each category is extremely imbalanced, which increases the difficulty of classification. For example, some categories have 67 images, while others have 499 images in coarse-grained training samples. Figure 4 and Figure 5 show some visible and IR samples from each class in the dataset. It can be seen that the size of ships is various, the illumination is uneven, and the background is complex. These issues put forward a very high requirement for the distinguishing ability of features.

4.2. Experiments

To evaluate the proposed SF-SRDA, we compared the related methods with three configurations. The first configuration is the comparison between SF-SRDA and the base-line methods in the coarse-grained partition. The second configuration is the comparison between SF-SRDA and the state-of-arts in the coarse-grained partition. The third configuration is the comparison of the fine-grained partition between SF-SRDA and the base-line methods.
In Table 3, features involve the VGG-19(relu5-4) feature, the ResNet-152(pool5) feature and the combination of these two features. We assessed the base-line methods (VGG-19(relu5-4) + SVM, ResNet-152(pool5) + SVM, SFLPP [24], and SRDA [29]) and the proposed SF-SRDA on the visible and IR imagery. Since the SFLPP method can customize the feature dimension after fusion, we found that the fusion feature has the highest accuracy in the 85 dimension after many experiments, so the SFLPP method in Table 3 gives the result when the feature is reduced to 85 dimension. Table 4 shows the train time and test time for different methods. In this experiment, the train images are 873 visible images or 539 IR images, while the test images are 750 visible images or 703 IR images.
From Table 3 and Table 4, it can be observed that: (1) the dimension of single feature is higher, such as VGG-19(relu5-4) feature, which has 100352 dimension, and the ResNet-152(pool5), which has 2048 dimension. However, the feature has redundancy and single feature recognition ability is insufficient; (2) Comparing SF-SRDA with SFLPP, the feature dimension of fusion using our method is greatly reduced, to only 5 dimensions. Moreover, the recognition rate on visible and IR images is higher than that of the SFLPP method. It shows that SF-SRDA improves the discriminant ability of features; (3) Comparing SF-SRDA with SRDA, the recognition rate of our method is higher than that of SRDA when the feature is reduced to the same dimension. It proves that the structure information between features can be maintained by structure fusion in the process of feature dimension reduction, as is beneficial to target recognition; (4) In terms of training time, our approach is similar to ResNet-152 (pool5) + SVM and SRDA, and much lower than VGG-19 (relu5-4) + SVM and SFLPP; (5) Generally speaking, the proposed SF-SRDA achieves the best results, which can greatly reduce the feature dimension and improve the recognition ability of features to different targets.
The VAIS dataset has proposed by the literature [5], which gives experimental results of daytime visible images, daytime IR images, paired visible and IR images, and nighttime IR images. To compare with the method in reference [5], we carried out the vessel classification experiment under the coarse-grained condition according to the setting of reference [5]. Apart from the four test sets mentioned above, we added an all-day IR test set for comparison. In addition, we also compared the proposed SF-SRDA with traditional methods (HOG + SVM, LBP + SVM), SFLPP [24], SRDA [29], and other state-of-the-arts in literature [11,19,20]. The experimental results are shown in Table 5. From the results of Table 5, with the exception of the nighttime IR results, our method achieved the best recognition results for different weather conditions, different modal images, and multi-modal images, indicating that the feature fusion method of this paper has a strong robustness.
To further validate the effectiveness of SF-SRDA, we conduct experiments in the case of fine-grained dataset with more categories, and compare with the two base-line methods. As shown in the experimental results in Table 6, we compared SF-SRDA with SFLPP and achieved better recognition results and great improvement in various cases. Compared with the SRDA method, SF-SRDA obtains better recognition results in cases of visible, IR, and paired images during the daytime. Only nighttime IR results are slightly lower than the SRDA method.
The main discussion about the performance comparisons include the following: (1) The proposed SF-SRDA under the coarse-grained condition and SFLPP under the fine-grained condition, combining multi sensors (visible and IR) shows performance enhancement, while in some other cases, it shows performance degradation. The reason for this is that the IR image has a significantly lower resolution and a smaller size than the visible image. Figure 6 shows some examples of the IR image, thus IR information has little effect on enhancing recognition during the day. (2) The focus of this paper is on feature fusion. It can be seen from our experimental results that feature fusion is better than modal fusion. (3) In the nighttime IR image classification, the reason our method did not improve may be that the category information of the nighttime IR image is very blurred, and the image of the fine-grained classes makes almost no difference. As shown in Figure 6, there are three subcategories under the sailing category in the fine-grained classification: the first row is the large-sails-down class, the second row is the small-sails-down class, and the third row is the small-sails-up class. As can be seen from Figure 6, the images of different class vessels have almost no discrimination, which explains why our methods aimed at improving category information cannot work well.

5. Conclusions

In this paper, a classification method of SF-SRDA was proposed. Firstly, we selected different types of features through experiments and constructed the internal structure of features by similarity measure. Then, the algebraic operation was formed after the feature and its internal structure were effectively combined. The optimization method refers to linear discriminant analysis and spectral regression discriminant analysis. Finally, the fusion features after dimension reduction were sent to the classifier for marine vessels classification. Experiments on the VAIS dataset show that the extremely high dimensional feature can be reduced to very low dimension by the proposed method, and the accuracy is improved. Through our method, during the daytime, the classification accuracy of visible images can reach 87.60%, which is 5.7% higher than the best result of [5], and the infrared image can reach 74.68%, which is 15.98% higher than the best result in reference [5]. In general, the proposed method can not only extract the optimal features from the original redundant feature space, but also save a large amount of memory space and greatly improve the classification accuracy.

Author Contributions

E.Z. conceived this study and improved the text of the manuscript. K.W. designed the computational algorithms, wrote the program code, and wrote the manuscript. G.L. proposed some valuable suggestion and guided the experiments.

Funding

This work is supported by the Key Program of Natural Science Foundation of Shaanxi Province of China under Grant No. 2017JZ020, the National Natural Science Foundation of China under Grants No. 61771386 and No. 61671374, and the Project of Xi’an University of Technology (108-45148006).

Conflicts of Interest

The authors declare no conflicts of interest.

References

  1. Margarit, G.; Tabasco, A. Ship classification in single-pol SAR images based on fuzzy logic. IEEE Trans. Geosci. Remote Sens. 2011, 49, 3129–3138. [Google Scholar] [CrossRef]
  2. Leclerc, M.; Tharmarasa, R.; Florea, M.C.; Boury-Brisset, A.C.; Kirubarajan, T.; Duclos-Hindié, N. Ship Classification using Deep Learning Techniques for Maritime Target Tracking. In Proceedings of the 21st International Conference on Information Fusion, Cambridge, UK, 10–13 July 2018; pp. 737–744. [Google Scholar]
  3. Eldhuset, K. An automatic ship and ship wake detection system for spaceborne SAR images in coastal regions. IEEE Trans. Geosci. Remote Sens. 1996, 34, 1010–1019. [Google Scholar] [CrossRef]
  4. Zhu, C.; Zhou, H.; Wang, R.; Guo, J. A novel hierarchical method of ship detection from spaceborne optical image based on shape and texture features. IEEE Trans. Geosci. Remote Sens. 2010, 48, 3446–3456. [Google Scholar] [CrossRef]
  5. Zhang, M.M.; Choi, J.; Daniilidis, K.; Wolf, M.T.; Kanan, C. VAIS: A Dataset for Recognizing Maritime Imagery in the Visible and Infrared Spectrums. In Proceedings of the 2015 IEEE Conference on Computer Vision and Pattern Recognition Workshops (CVPRW), Boston, MA, USA, 19 October 2015. [Google Scholar]
  6. Dalal, N.; Triggs, B. Histograms of oriented gradients for human detection. In Proceedings of the International Conference on Computer Vision & Pattern Recognition (CVPR’05), San Diego, CA, USA, 20–25 June 2005. [Google Scholar]
  7. Ojala, T.; Pietikainen, M.; Mäenpää, T. Multiresolution gray-scale and rotation invariant texture classification with local binary patterns. IEEE Trans. Pattern Anal. Mach. Intell. 2002, 24, 971–987. [Google Scholar] [CrossRef]
  8. Zhang, D.F.; Zhang, J.S.; Yao, K.M. Infrared ship-target recognition based on SVM classification. Infrared Laser Eng. 2016, 45, 167–172. [Google Scholar]
  9. Feineigle, P.A.; Morris, D.D.; Snyder, F.D. Ship recognition using optical imagery for harbor surveillance. In Proceedings of the Association for Unmanned Vehicle Systems International (AUVSI), Washington, DC, USA, 6–9 August 2007; pp. 249–263. [Google Scholar]
  10. Sánchez, J.; Perronnin, F.; Mensink, T.; Verbeek, J. Image classification with the fisher vector: Theory and practice. Int. J. Comput. Vision. 2013, 105, 222–245. [Google Scholar]
  11. Huang, L.; Li, W.; Chen, C.; Zhang, F.; Lang, H. Multiple features learning for ship classification in optical imagery. Multimedia Tools Appl. 2018, 77, 13363–13389. [Google Scholar] [CrossRef]
  12. Akilan, T.; Wu, Q.J.; Zhang, H. Effect of fusing features from multiple DCNN architectures in image classification. IET Image Proc. 2018, 12, 1102–1110. [Google Scholar] [CrossRef]
  13. Shi, Q.; Li, W.; Zhang, F.; Hu, W.; Sun, X.; Gao, L. Deep CNN with Multi-Scale Rotation Invariance Features for Ship Classification. IEEE Access 2018, 6, 38656–38668. [Google Scholar] [CrossRef]
  14. Zhang, Y.; Zhang, E.; Chen, W. Deep neural network for halftone image classification based on sparse auto-encoder. Eng. Appl. Artif. Intell. 2016, 50, 245–255. [Google Scholar] [CrossRef]
  15. Kang, X.; Zhang, E. A universal defect detection approach for various types of fabrics based on the Elo-rating algorithm of the integral image. Text. Res. J. 2019, 1–28, (online publication, in press). [Google Scholar] [CrossRef]
  16. Zhang, E.; Zhang, Y.; Duan, J. Color Inverse Halftoning Method with the Correlation of Multi-Color Components Based on Extreme Learning Machine. Appl. Sci. 2019, 9, 841. [Google Scholar] [CrossRef]
  17. Ibrahim, Y. Development of a deep convolutional neural network-based system for object recognition in visible light and infrared images. Master’s Thesis, Ahmadu Bello University, Zaria, Kaduna State, Nigeria, 2017. [Google Scholar]
  18. Tang, J.; Deng, C.; Huang, G.B.; Zhao, B. Compressed-domain ship detection on spaceborne optical image using deep neural network and extreme learning machine. IEEE Trans. Geosci. Remote Sens. 2015, 53, 1174–1185. [Google Scholar] [CrossRef]
  19. Shi, Q.; Li, W.; Tao, R.; Sun, X.; Gao, L. Ship Classification Based on Multifeature Ensemble with Convolutional Neural Network. Remote Sens. 2019, 11, 419. [Google Scholar] [CrossRef]
  20. Khellal, A.; Ma, H.; Fei, Q. Convolutional neural network based on extreme learning machine for maritime ships recognition in infrared images. Sensors 2018, 18, 1490. [Google Scholar] [CrossRef]
  21. Sun, Q.; Zeng, S.G.; Heng, P.G.; Xia, D.S. The theory of canonical correlation analysis and its application to feature fusion. Chin. J. Comput. 2005, 28, 1524–1533. [Google Scholar]
  22. Shen, X.B.; Sun, Q.S.; Yuan, Y.H. Orthogonal canonical correlation analysis and its application in feature fusion. In Proceedings of the 16th International Conference on Information Fusion, Istanbul, Turkey, 9–12 July 2013. [Google Scholar]
  23. Tuzel, O.; Porikli, F.; Meer, P. Pedestrian detection via classification on riemannian manifolds. IEEE Trans. Pattern Anal. Mach. Intell. 2008, 30, 1713–1727. [Google Scholar] [CrossRef] [PubMed]
  24. Lin, G.; Zhu, H.; Kang, X.; Fan, C.; Zhang, E. Multi-feature structure fusion of contours for unsupervised shape classification. Pattern Recognit. Lett. 2013, 34, 1286–1290. [Google Scholar] [CrossRef]
  25. Lin, G.; Zhu, H.; Kang, X.; Fan, C.; Zhang, E. Feature structure fusion and its application. Inf. Fusion. 2014, 20, 146–154. [Google Scholar] [CrossRef]
  26. Lin, G.; Fan, G.; Kang, X.; Zhang, E.; Yu, L. Heterogeneous feature structure fusion for classification. Pattern Recognit. 2016, 53, 1–11. [Google Scholar] [CrossRef]
  27. Lin, G.; Zhu, H.; Kang, X.; Miu, Y.; Zhang, E. Feature structure fusion modelling for classification. IET Image Proc. 2015, 9, 883–888. [Google Scholar] [CrossRef]
  28. He, X.; Niyogi, P. Locality preserving projections. In Proceedings of the Advances in Neural Information Processing Systems, Vancouver, BC, Canada, 8–13 December 2003; pp. 153–160. [Google Scholar]
  29. Cai, D.; He, X.; Han, J. SRDA: An efficient algorithm for large-scale discriminant analysis. IEEE Trans. Knowl. Data Eng. 2008, 20, 1–12. [Google Scholar]
  30. Duda, R.O.; Hart, P.E.; Stork, D.G. Pattern Classification, 2nd ed.; John Wiley & Sons: New York, NY, USA, 2012; pp. 568–598. [Google Scholar]
  31. Guo, Z.; Zhang, L.; Zhang, D. A completed modeling of local binary pattern operator for texture classification. IEEE Trans. Image Process. 2010, 19, 1657–1663. [Google Scholar] [PubMed]
  32. Simonyan, K.; Zisserman, A. Very Deep Convolutional Networks for Large-Scale Image Recognition. In Proceedings of the 2015 International Conference on Learning Representations (ICLR 2015), San Diego, CA, USA, 7–9 May 2015. [Google Scholar]
  33. Szegedy, C.; Liu, W.; Jia, Y.; Sermanet, P.; Reed, S.; Anguelov, D.; Erhan, D.; Vanhoucke, V.; Rabinovich, A. Going deeper with convolutions. In Proceedings of the IEEE Conference on Computer Vision and Pattern Recognition, Boston, MA, USA, 7–12 June 2015. [Google Scholar]
  34. He, K.; Zhang, X.; Ren, S.; Sun, J. Deep residual learning for image recognition. In Proceedings of the IEEE Conference on Computer Vision and Pattern Recognition, Las Vegas, NV, USA, 26–30 June 2016. [Google Scholar]
Figure 1. The overall framework of multi-feature Structure Fusion based on Spectral Regression Discriminant Analysis (SF-SRDA). CNN: convolutional neural network, IR: Infrared images.
Applsci 09 02153 g001
Figure 2. The location of the extracted features from VGG-19 or ResNet-152.
Applsci 09 02153 g002
Figure 3. Internal structure fusion of multi-feature.
Applsci 09 02153 g003
Figure 4. Some visible image of VAIS dataset.
Applsci 09 02153 g004
Figure 5. Some infrared image of VAIS dataset.
Applsci 09 02153 g005
Figure 6. Fine-grained image examples under the sailing class.
Applsci 09 02153 g006
Table 1. Classification accuracy of different input features.
FeatureDimensionAccuracy
VisibleIR
HOG31,24872.40%57.18%
LBP25676.27%56.67%
VGG-16(relu5-3)100,35284.93%51.64%
VGG-16(relu6)409682.13%59.03%
VGG-19(relu5-4)100,35286.53%67.71%
VGG-19(fc6)409685.60%63.16%
VGG-19(relu6)409681.87%63.16%
GoogLeNet(cls3_pool)102479.73%54.62%
ResNet-50(pool5)204884.27%64.30%
ResNet-101(pool5)204886.67%64.58%
ResNet-152(pool5)204884.93%69.13%
HOG: Histogram of Oriented Gradient. IR: Infrared Images.
Table 2. Distribution of data sets.
Data PartitionClass NumberTrain Number
(Sample Distribution)
Test Number
(Sample Distribution)
coarse-grained61411(67~499)1453(89~538)
fine-grained151411(24~218)1453(26~219)
Table 3. Comparison between SF-SRDA and the base-line methods in the coarse-grained partition.
MethodFeatureDimensionVisibleIR
Single feature+ SVMVGG-19(relu5-4)100,35286.53%67.71%
ResNet-152(pool5)204884.93%69.13%
SFLPP [24]ResNet-152(pool5) + VGG-19(relu5-4)8584.93%65.43%
SRDA [29]ResNet-152(pool5) + VGG-19(relu5-4)586.93%70.56%
The proposed SF-SRDA ResNet-152(pool5) + VGG-19(relu5-4)587.60%70.98%
Table 4. Time consume among SF-SRDA and the base-line methods in the coarse-grained partition (second).
MethodVisibleIR
Train Time in 873 Images Test Time in 750 ImagesTrain Time in 539 ImagesTest Time in 703 Images
VGG-19(relu5-4) + SVM31.020.0394.740.03
ResNet-152(pool5) + SVM1.740.0041.580.005
SFLPP [24]7.140.293.010.16
SRDA [29]1.580.100.820.08
The proposed SF-SRDA2.490.101.430.08
Table 5. Coarse-grained results among SF-SRDA and the state-of-arts.
Test FeatureDaytimeNighttimeIR
VisibleIRVisible + IRIR
Gnostic Field [5]82.4%58.7%82.4%51.9%-
CNN [5]81.9%54.0%82.1%59.9%-
Gnostic Field + CNN [5]81.0%56.8%87.4%61.0%-
Gabor + MS-CLBP [11]77.73%----
MFL (decision-level) + ELM [11]85.07%----
MFL (feature-level) + SVM [11]85.33%----
HOG + SVM [19]71.87%----
ME-CNN [19]87.33%----
ELM-CNN [20]----61.17%
LBP + SVM76.27%---56.67%
HOG + SVM72.40%---57.18%
SFLPP [24]84.93%70.67%79.60%46.75%65.43%
SRDA [29]86.93%74.68%86.52%55.84%70.56%
The proposed SF-SRDA87.60%74.68%87.98%57.79%70.98%
Table 6. Fine-grained results of sub-division test sets.
Test FeatureDaytimeNighttime
VisibleIRVisible + IRIR
SFLPP [24]52.00%38.43%52.10%7.79%
SRDA [29]58.93%42.99%56.65%13.64%
The proposed SF-SRDA61.33%43.35%58.11%10.39%

