1. Introduction
Plants and microorganisms form complex associations displaying diverse interactions ranging from mutualism to pathogenicity. The habitat for microorganisms can be both the interior (endosphere occupied by endophytes) and the surroundings (phyllosphere, rhizoplane, and rhizosphere occupied by epiphytes) of the host plant [
1,
2]. Microbial genomes, referred to as the microbiome or plants’ second genome [
2,
3], constitute a specific plant microbiome together with the plant genome. Additionally, given the co-evolution process between plants and their associated microbiome resulting in a strong genomic interdependency, plants and their microbiome are considered as a metaorganism or a holobiont [
4].
Plant-associated microbes, especially endophytes, play a crucial role in plant growth and development, allowing them to survive harsh conditions [
1], which is important for food production (increased crops, biocontrol of plant diseases) and for coping with contaminants (phytoremediation). These beneficial microorganisms are termed as Plant Growth-Promoting Bacteria (PGPB) [
3,
5]. Their beneficial function is the improvement of plant fitness and protection against biotic and abiotic stresses by facilitation of nutrient acquisition and providing plant hormones and other metabolites [
3,
6]. The presence of pollutants, such as heavy metals, may also pose a threat to both plants and some microorganisms (e.g., metal-tolerant species); however, they may be able to immobilize or decompose pollutants, thus protecting plants or improving their defense mechanisms. This issue is crucial for bioremediation and phytoremediation processes [
7,
8].
Despite the enormous microbial abundance in different environments and the substantial progress in their cultivation methods, still only 1% of these microorganisms can be cultured [
9]. In addition, some endophytes are commensals with a yet unknown function in plants. It is also very common to study the function of the microbiome for a specific group of species and to focus mostly on terrestrial plants rather than on a broader taxonomical spectrum of plant species [
3]. Therefore, it is worth discovering microbiomes associated with plants providing new microbiomes that can potentially be valuable to humans. Valuable plants in terms of potential microbiome hosts are ferns belonging to the genus
Azolla, which play important roles in some branches of industry [
10,
11].
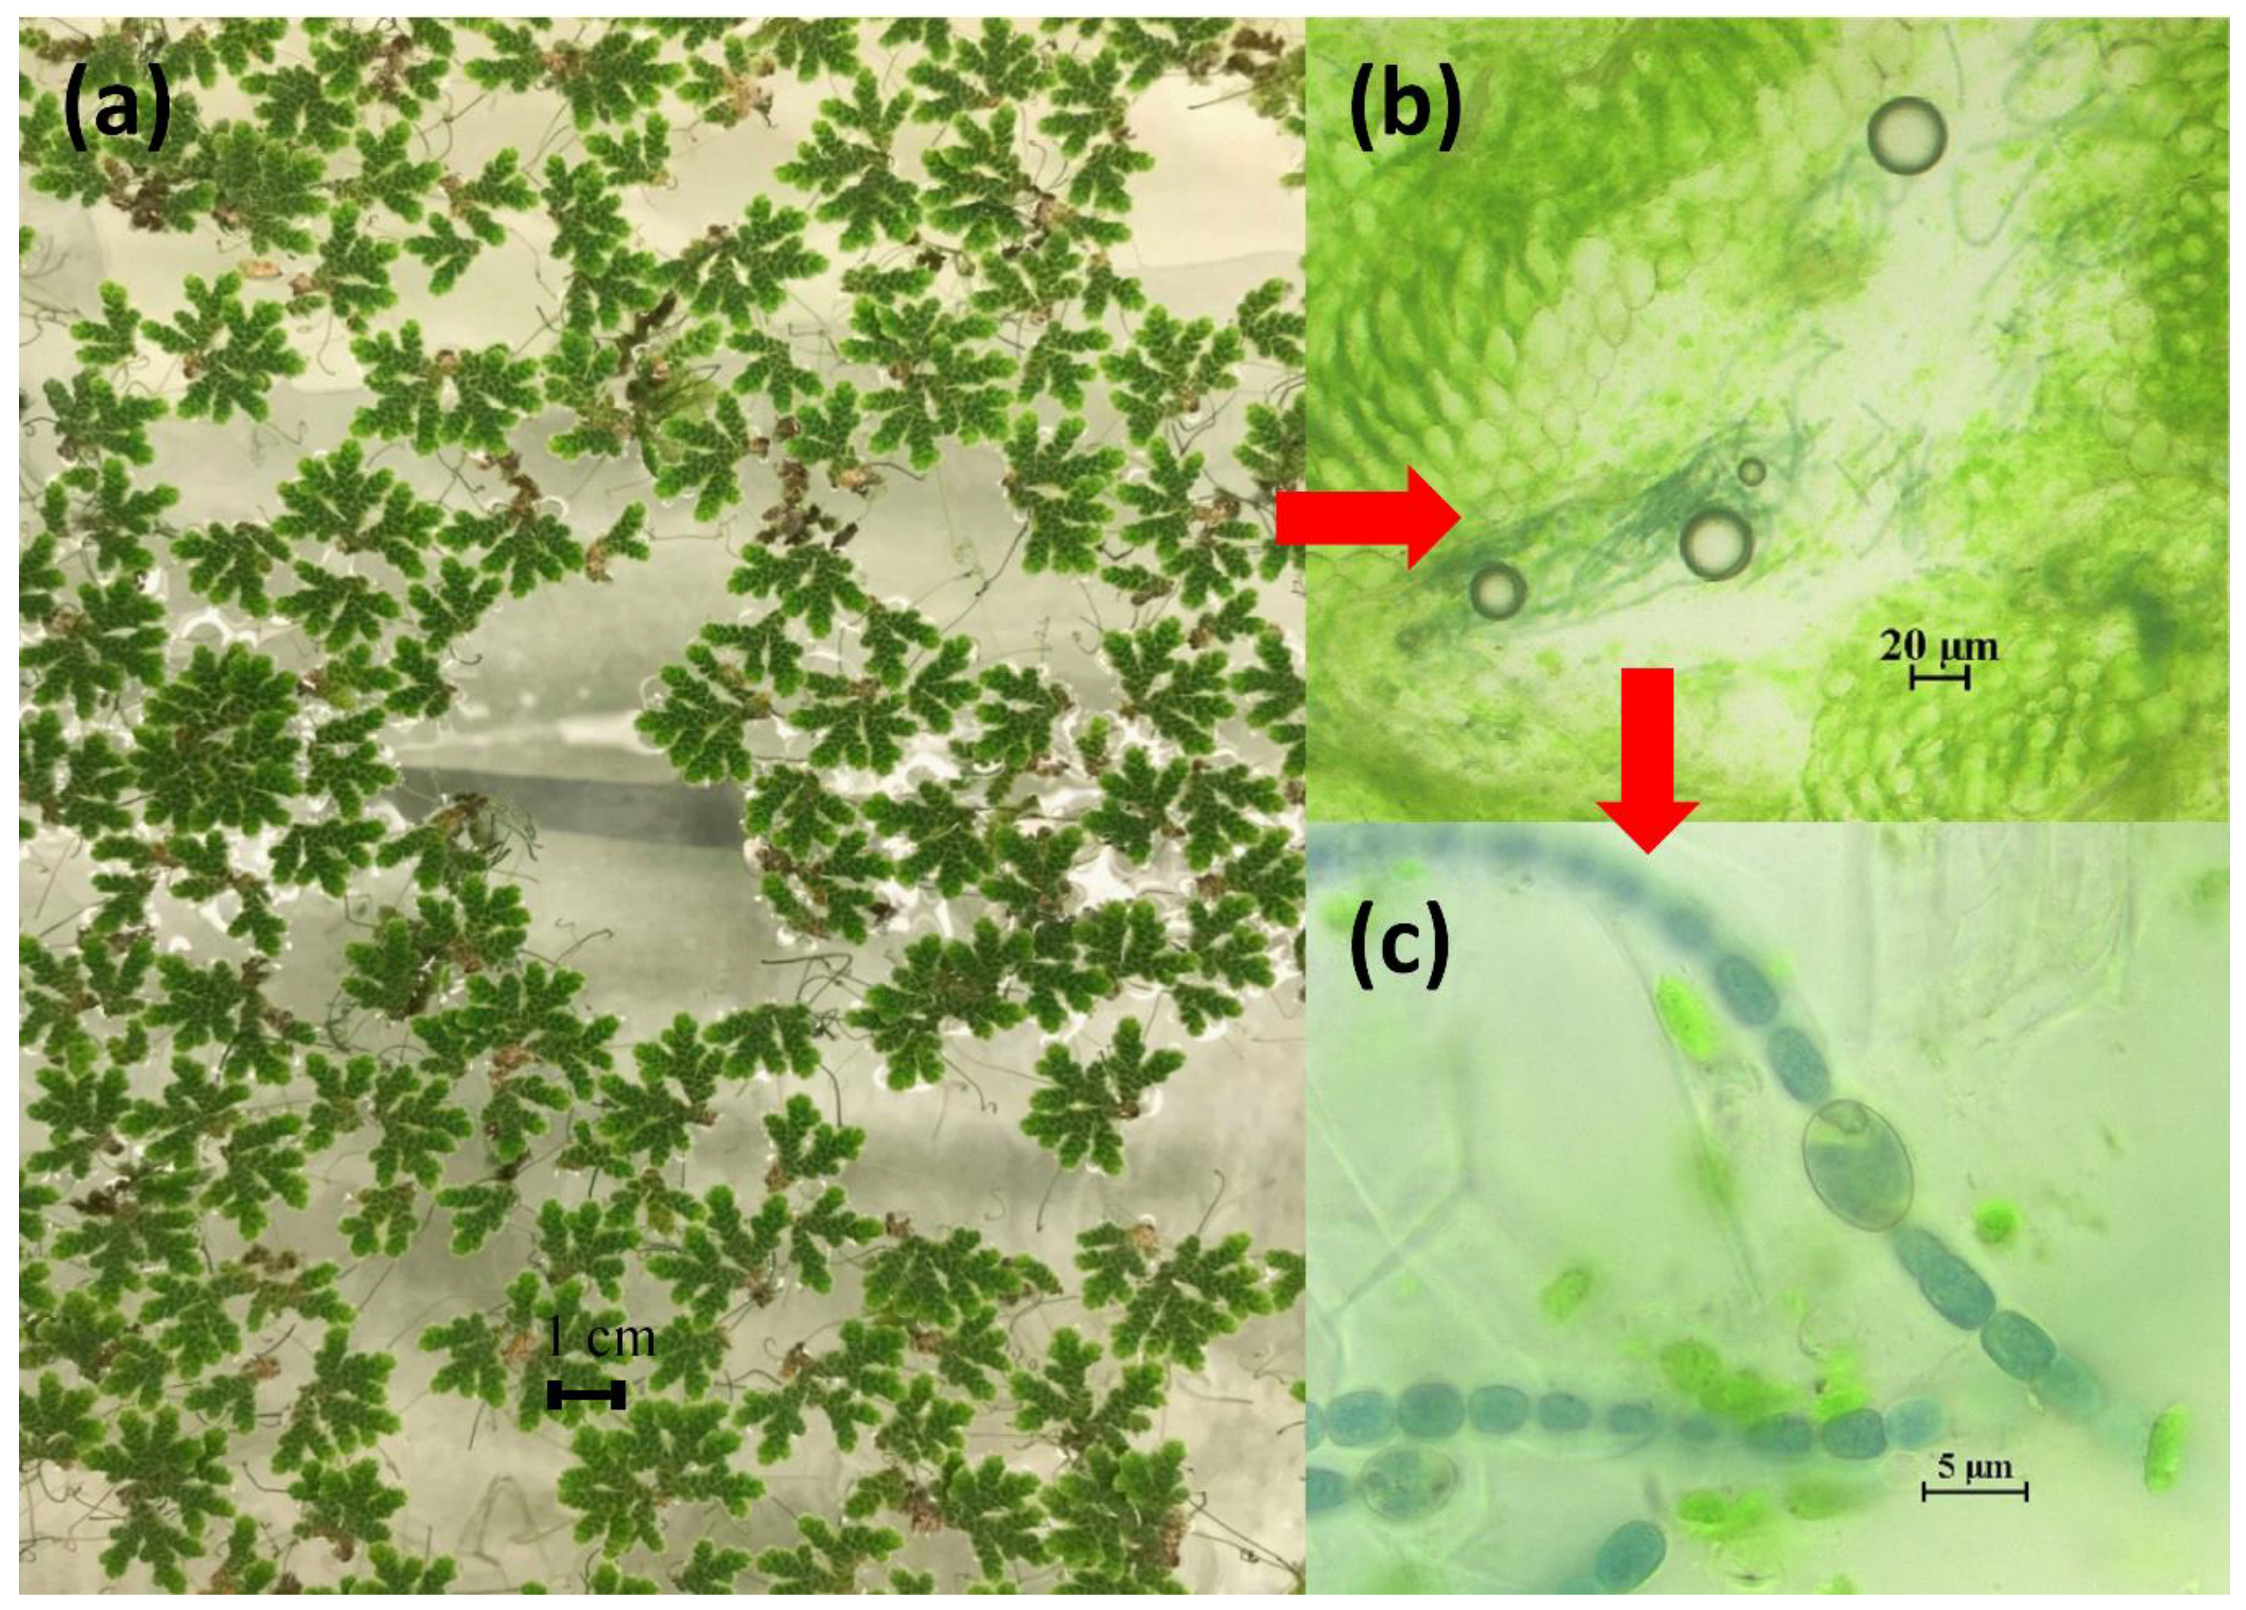
Azolla filiculoides L. (
Salviniaceae) is a small (2.5 cm) heterosporous floating aquatic or semiaquatic pteridophyte occurring on the surface of eutrophic waters in temperate and tropical climate around the world (
Figure 1a). It can exist either individually or in mats, which can reach a thickness of up to 20 cm. The fern has bilobed leaves. The dorsal lobe has an ovoid cavity inhabited by the community of cyanobacteria
Anabaena azollae (Starsb.) (
Figure 1b) capable of atmospheric nitrogen fixing using the nitrogenase enzyme (EC 1.18.6.1) in specialized thick-walled cells called hetrocysts (
Figure 1c).
This trait makes
Azolla sp. independent of other external nitrogen sources allowing its fast growth and production of high-protein biomass. Hence,
Azolla sp. can be used as a green manure on rice fields and animal feed [
10,
11]. Another important feature of the fern is its capability of heavy metal accumulation [
11,
12].
Over the years, the cyanobiont has been named
Nostoc azollae,
Anabaena azollae, and
Trichormus azollae, but no definitive classification exists to date. Studies by Plazinski et al. [
13] suggested that the endosymbiont represents rather
Nostoc sp. than
A. azollae. Gebhardt and Nierzwicki-Bauer [
14] reported that the classification of cyanobacteria depends on the host plant. In 2003, using comparisons of the sequences of the phycocyanin intergenic spacer and a fragment of the 16S rRNA, Baker and co-authors [
15] found that the cyanobiont from
Azolla sp. belongs to neither of these genera. In 2014, Pereira and Vasconcelos [
16] made another attempt to solve this dilemma, but their results were also unclear. Consequently, the problem remains unsolved to date. There is some information about bacteria as a third partner in symbiosis. The presence of bacteria in
Azolla sp. leaves was first reported by Grilli in 1964 [
17] and microscopic observations thereof were done by Nierzwicki-Bauer and Aulfinger [
18] and Carrapiço [
19]. Serrano et al. [
20] determined bacterial species accompanying
Azolla sp. recognized in the 20th century. However, no more detailed analysis or identification of these bacteria has been performed.
All these issues are associated with a huge gap in knowledge on microorganisms inhabiting Azolla sp.; hence, our intention was to fill it. Thus, the novelty and main goal of the study was to isolate, identify, and describe unrecognized bacteria constituting the core microbiome of A. filiculoides. Since the fern is used in agriculture and water treatment, it would be useful to discover its microbiome, which may help to elucidate its role in the symbiotic system Azolla-microorganisms and indicate its possible applications in the branches of industry mentioned above.
2. Results
2.1. Azolla Cyanobiont
The isolation of the cyanobiont allowed us to observe the presence of dense agglomerations of cyanobiont filaments together with plant debris. After one week of cyanobiont culture, we collected sufficient amounts of living material for further studies; an example of the living culture is presented in
Figure 2.
Colony filaments were not attenuated towards ends. Cells are ellipsoidal or barrel-shaped, size of cells changes from 4–6 × 2.5–3.5 µm, with granules. Heterocysts were ellipsoidal, larger than vegetative cells, size 5–9 × 4.5–6 µm, solitary and intercalary. Gas vacuoles were absent.
After conducting PCR reaction using
nifDf and
nifDr primers, specific products of 600 bp were obtained. This observation confirms the presence of the
nif gene encoding enzymes important in atmospheric nitrogen fixing, i.e., a feature typical of cyanobacteria. In the case of primers targeting a fragment of the 16S rRNA gene specific for cyanobacteria, we obtained two 1500 and 1700 bp products specific for used primers [
21]. After purification of the PCR products, the latter one was further analyzed.
The analysis of the similarity of the cyanobacterium-specific 16S rRNA gene fragments to a homologous gene revealed similarities to the previously described
Azolla sp. cyanobionts (
Table 1). We found four hits with a similarity of 90–94%, which indicates that the studied DNA fragments are likely to belong to
Anabaena sp.
2.2. The Cultured Microbiome of A. filiculoides
The isolation yielded in 58 microbial isolates, among which 15 were obtained from the interior of the plant. We noticed differences in the morphology of the colonies, which suggests affiliation of the isolates to different taxonomic groups. The morphology of the obtained isolates is summarized in
Table 2.
The isolates displayed a wide range of colony sizes ranging from <1 mm to ca. 0.5 mm. More than 40% were both punctiform and small, above 20% were moderate in size, and the largest colonies constituted approximately 14%. The epiphytes showed the same pattern, whilst 46% of the endophytes were the smallest, 20% were small, 27% were moderate, and only ca. 7% had a large size.
The circular shape was dominant in the studied pool of microorganisms (60%), with substantially higher counts recorded for the endophytes (87%) than the epiphytes (51%). Oval and irregular shapes accounted for 19% of each of these shapes. Only one epiphytic isolate formed filamentous colonies (2%). The epiphytic microorganisms formed oval and irregular shapes in 26% and 21% cases as well. The endophytes did not form oval and filamentous colonies and an irregular form was recorded in 14% of these microorganisms.
In the case of surfaces, we distinguished dull-glistering and rough-smooth combinations. The glistering/smooth surface accounting for 50% of all isolates was the most abundant (35% and 93% of the epiphytes and endophytes, respectively). The next two abundant surfaces were glistering-rough (22%, 28%, and 6% for the total microbiome, epiphytes, and endophytes, respectively) and dull/smooth (19% of all microbes). The latter was present in 26% of epiphytes whilst endophytes displayed no such surface type. The dull/rough surface was the least common (8.6%); it was not observed for endophytes and only 12% of epiphytes were characterized by such a surface.
We observed three types of colony texture: Butyrous (BUT), mucoid (MUC), and brittle (BRIT). The first type (BUT) was the most common in all microorganisms (67%) followed by MUC (19%) and BRIT (14%). A similar number was recorded for the epiphytes, whilst 73% of the endophytes had BUT and 27% MUC texture.
In terms of colony transparency, we divided the microorganisms into opaque (OPQ), translucent (TRANS), and iridescent (IRID). More than half or all microbes, both epi- and endophytes, produced non-transparent (OPQ) colonies whilst 40% were transparent (44% of epiphytes and 27% of endophytes). Opalescent color was observed in 9% of isolates (4.7% epi- and 20% of endophytes).
The isolated microorganisms displayed two types of pigmentation—white-cream-beige (76%) (
Figure 3a) and yellow-orange (24%) (
Figure 3b). Similar numbers were recorded for the epiphytes, whilst 2/3 of the endophytes were included in the “white group” and 1/3 in the “yellow group”. Deeper analysis within each group revealed cream pigmentation as the most abundant (36%, 40%, and 27% for all the microorganisms, epiphytes, and endophytes, respectively). Beige and white-cream colonies were observed in 34% isolates (equally distributed between these two pigmentations) and only 5% of the colonies were white. The epiphytes were cream in 21%, white-cream in 12%, and white in 5%. The endophytes had white-cream pigmentation in 33% cases and were cream with no white colonies in 6.7%. The second “yellow” group was divided into yellow-cream, yellow, and yellow-orange sub-groups. Among them, pure yellow color was observed in 14% of all microbes – 7% of the epiphytes and 33% of the endophytes. The latter did not produce colonies in another hue of yellow. Bright yellow pigmentation was recorded for 7% of all isolates (9% of the epiphytes) whilst more orange colonies were found in 3.5% of the total number of the microorganisms (4.7% of the epiphytes).
The next studied trait was colony elevation: Flat (F), raised (R), convex (C), and umbonate (U). We found raised colonies as the most abundant (52%). As much as 80% of the endophytes and 42% of the epiphytes were characterized by such colony elevation. Also, 26% of the isolates were flat, 17% were umbonate, and only 5% were convex. Flat, umbonate, and convex colonies were detected in 30%, 21%, and 7% of the epiphytes, respectively. No convex colonies were recorded in the endopytes; 13% were flat and 7% were umbonate.
The margin was the last morphological trait assesses. We observed colonies with entire, undulate, and filiform margins. The first margin type was found to be the most common (71%)—67% of the epiphytes and as much as 80% of the endophytes displayed this margin type. The undulate margin was noted in 30% of the counts (30% of the epiphytes and 20% of the endophytes). The filiform margin was observed only in one case, and this epiphyte formed a filamentous colony (2%) (
Figure 3c).
For additional characterization, we determined the type of the cell wall using Gram staining. We found Gram-positive bacteria as the dominant group—66% of the counts (56% of the epiphytes and 93% of the endophytes).
2.3. Identification of Isolates
On the basis of 16S rRNA (hypervariable fragments V2-V4) analysis, we showed 99% similarity of the sequences (
Table A1). Analysis of the 16S rDNA gene fragment revealed three identical epiphytic isolates number 22, 30, and 32; only no. 22 was entered into GenBank database. In addition, we did not obtain sufficiently good sequences for reliable characterization epiphytes no. 8, 15, 26, 27, 31, 33, 39, and 40 as well as one endophyte no. 15. As a result, 35 epiphytes and 14 endophytes (85% of isolated microorganisms) were successfully identified and entered to the database. Their names and the accession numbers are presented in
Table 3.
The identification procedure revealed that the isolates represented 9 genera (6 for epiphytes, 4 for endophytes; note that some epi- and endophytic microorganisms belong to the same genus). Based on their numbers, it can be concluded that the dominant epiphytic phylum was Firmicutes (60%) followed by Proteobacteria (34%) and Actinobacteria (6%). In the case of the endophytes, Firmicutes (86%) were dominant as well, whereas Proteobacteria and Actinobacteria constituted equally 7%. Within Firmicutes, Bacillus was the only representative genus in the case of the epiphytes (21 isolates). This phylum in the endophytes was equally represented by Bacillus (6 isolates, 43%) and Staphylococcus (4 isolates, 29%). The epiphytes belonging to Proteobacteria were classified into the order Rhizobiales (Alphaproteobacteria) represented by the genus Agrobacterium—11% (4 isolates) and Burkholderiales (Betaproteobacteria) represented by Alcaligenes (1), Achromobacter (6), and Delftia (1 isolate) (23%). Acinetobacter was the only genus representative for endophytic Proteobacteria (1 isolate), Microbacterium (2) represented epiphytic Actinobacteria, and Micrococcus (3 isolates) represented endophytes from this phylum.
2.4. Synthesis of Plant Growth Promoters
In our study, we intended to present the potential of the isolated microorganisms in the synthesis of plant growth-promoting substances, which is very poorly recognized in the case of A. filiculoides. Consequently, the levels of IAA, cellulase and protease activities, utilization of P, and production of siderophores were determined. To this end, we selected one representative of each identified genera, i.e., 6 epiphytes and 4 endophytes.
The quantification of IAA synthesis revealed 3 promising strains:
Micrococcus sp. AzoEndo14,
Delftia sp. AzoEpi7, and
Agrobacterium sp. AzoEpi25. The first one produced the highest amounts of auxin (17.9 µg·mL
−1); in turn, the other two yielded 3.575 and 6.39 µg·mL
−1 of the compound, respectively (
Table 4). To assess the capability of the microorganisms of lysis of the pathogen cell wall, we assayed cellulase and protease activities. Importantly, a positive reaction was recorded in all the isolates studied (
Table 4).
The diameter of the halo after cellulose decomposition ranged from 0.23–1.5 cm. The endophytes were characterized by stronger cellulase activity; we observed zones from 0.98 (
Staphylococcus sp. AzoEndo11) to 1.5 cm (
Micorococcus sp. AzoEndo14). It was demonstrated that the halo was lower by 20% only for
Acinetobacter sp. AzoEndo8 in comparison to the colony diameter. The zone in the other 3 isolates was by 5–19% higher than the size of developed colonies. In the case of the epiphytes, the lowest activity was noted for
Delftia sp. AzoEpi7 (0.23 cm) and the highest value of 1.03 cm was found for
Achromobacter sp. AzoEpi1. We noticed that
Achromobacter sp. AzoEpi1,
Bacillus sp. AzoEpi2, and
Delftia AzoEpi7 developed smaller halos in relation to their colonies, i.e., with the h:c ratios of 0.67, 0.47, and 0.27, respectively. The other three, i.e.,
Alcaligenes sp. AzoEpi21,
Microbacterium sp. AzoEpi23, and
Agrobacterium sp. AzoEpi25, formed halos that were larger by 20–33% (
Table 4). Protein substrate consumption was indicated by halos larger than 1 cm in all samples. The endophytic
Micrococcus sp. AzoEndo14 generated the smallest zone (1 cm), which was 69% smaller than that of the colonies.
Bacillus sp. AzoEndo3, in contrast, developed the biggest zone of 1.76 cm (1% bigger than that of the colonies). However, the epiphytic
Bacillus sp. AzoEpi2 showed the lowest protease activity with a 1.1 cm halo (72% smaller zone than that of the colonies).
Agrobacterium sp. AzoEpi25 produced the biggest zones 2.95 cm with the highest h:c ratio of 1.1 (
Table 4).
Importantly, all the isolates demonstrated potential for organic P mineralization; the endophytes had halos ranging from 0.26 cm (Staphylococcus sp. AzoEndo11) with a h:c ratio of 0.23–0.62 cm (
Bacillus sp. AzoEndo3) and an h:c ratio of 0.47. The epiphytes mineralized more phosphate on average: The halos ranged from 0.35 (
Alcaligenes sp. AzoEpi21) to 0.52 cm (
Bacillus sp. AzoEpi2) with h:c ratios of 0.33–0.43, respectively. Inorganic P appeared to be more difficult to solubilize; the endophytic
Acinetobacter sp. AzoEndo8 was unable to utilize it and only the epiphytic
Delftia sp. AzoEpi7 was able to develop a halo of 0.79 cm, which was by 10% larger than that of its colonies. The rate of P solubilization by the endophytes ranged between 0.29 cm (
Micrococcus sp. AzoEndo14), i.e., 64% of the colony sizes and 1.95 cm (
Staphylococcus sp. AzoEndo11), i.e., 91% larger than in the colonies (
Table 5). This study allowed us to qualify all isolates as PMB, and only
Staphylococcus sp. AzoEndo11,
Micrococcus sp. AzoEndo14, and
Bacillus sp. AzoEndo3 (endophytes) were qualified as PSM, whereas
Delftia sp. AzoEpi7 was the only PMPSB.
Production of siderophores was visualized only in some samples: One endophyte, i.e., Bacillus sp. AzoEndo3 (a huge halo of 3.56 cm with low colony growth—10 times lower colony size), and 3 epiphytes produced the compounds. Among them, Delftia sp. AzoEpi7 produced the largest halo (0.98 cm), which represented 64% of the colony size. Achromobater sp. AzoEpi1 followed by Alcaligenes sp. AzoEpi21 produced large halos as well (0.1 and 0.56 cm, respectively).
3. Discussion
One of our goals was to identify the cyanbiont co-existing with
A. filicuoides. Given the contrasting information from the literature, this issue is still not completely clear. In the study by Pereira and Vasconcelos [
16], deep screening of the classification and phylogeny of the cyanobiont was carried out. The existing controversy over its classification is associated with the method applied. In addition, co-evolution between the cyanobiont and the
Azolla host is possible as well as the existence of more than one genus or more than one species strain. This could explain the different classifications originating from molecular and botanical analysis. Although many publications traditionally name this cyanobacteria
Anabaena azollae or
Nostoc azollae [
10], likewise new publications [
26], Komárek and Anagnostidis [
27] renamed it to
Trichormus azollae. The results reported by Baker and colleagues [
15] are consistent with the latter study. In addition, most of non-planktonic species of
Anabeana without gas vacuoles are now included in
Tirichormus. All planktonic species with gas vacuoles retain their classification into
Anabeana. The difference between the two genera,
Tirichormus and
Anabeana, as presently understood, is related to the developmental relationships between the heterocysts and spores [
28]. The botanical observation carried out in this study revealed these traits, allowing a conclusion that T. azollae is the cyanobiont. It is also convincing that the AlgaeBase states that
A. azollae is currently regarded as a synonym of
T. azollae [
29].
The main goal in our study was to detect and identify cultured microbiome of
A. filiculoides. Previous studies mentioned the presence of bacterial endosymbionts within fern’s cavities; yet, they have not been identified. This could be attributed to insufficient identification tools available at that time, whereas many modern tools are available now. Studies conducted by Serrano et al. and Carrapiço [
19,
20] typed some bacterial genera:
Pseudomonas,
Alcaligenes,
Caulobacter, and
Arthrobacter. Nierzwicki-Bauer and Aulfinger [
18] presented a description of 5 different microorganisms, i.e., both G+ and G- bacteria inhabiting leaf cavities of
A. caroliniana. All these studies were based on the use of biochemical and microbiological tests for describing these microorganisms. Nevertheless, none of them employed any molecular analysis for identification of bacteria. However, an interesting paper has recently been published by Dijkhuizen and colleagues [
26], who performed a metagenomic study of the
A. filiculoides genome. They found Burkholderiales, Caulobacteriales, and Rhizobiales as the most abundant microbial groups accompanying the fern. Deeper analysis revealed microorganisms belonging to the genera
Microbacterium,
Hypomicrobium,
Shinella,
Ralstonia,
Rhizobium, and
Hydrocarboniphaga [
26]. We found these data different from ours. In our study, Burkholderiales constituted 23% and Rhizobiales 11% of the epiphytic microbiome, which is one-third of the whole microbiome identified. In addition, we obtained two isolates belonging to
Microbacterium. Moreover, other genera, including
Delftia were not detected. The differences in microbiome composition may be connected with
Azolla sp. environment. Our laboratory culture was sustained for 9 years on IRRI medium. Dijkhuizen and colleagues [
26] tested bacterial communities with both natural (ditch) and controlled (sterilized, IRRI collections). They stated that
Azolla sp. has control over the bacterial community assembly within its closed leaf pockets and it differs between sources of
Azolla sp. Since there are no more similar studies, we consider our study as a next very important step providing deep knowledge on the
A. filiculoides microbiome.
For microbiome phenotyping, we found only one paper describing the capability of
A. filiculoides and
A. pinnata endosymbiotic
Arthrobacter sp. for IAA production, where the auxin concentration remained at the level of 1.5–10 µg mL
−1 at an L-tryptophan dose of 100–600 µg·mL
−1 [
30]. Other studies demonstrated different efficiencies of IAA production by various microorganisms. In the study by Ghodsalavi et al. [
31], the highest production of IAA (>20 µg mL
−1) was recorded for
Pseudomonas sp., whereas these values in
Bacillus sp. and
Agrobacterium sp. amounted to 3–7 and 16 µg mL
−1, respectively. Dutta et al. [
32] showed IAA production of 87.9 µg mL
−1 for
Bacillus sp. In turn, Morel et al. [
33] proved that
Delftia sp. JD2 was able to synthesize IAA up to 80 µg·mg
−1 dw when exposed to Cr(VI) ions. Strains from the genus
Bacillus were reported to display both cellulase and protease activity [
32,
34]. Ghodsalavi et al. [
31] reported high protease activity in
Bacillus sp., which produced 2–3 cm diameter halos, i.e., approximately twice as big as in our study.
Agrobacterium sp. formed 2.3 cm halos, whilst 2.95 cm zones were noted in our study. In contrast to our study, Cho et al. [
34] indicated no ability to decompose the pathogen cell wall by
Microbacterium sp. The ability to solubilize P in
Bacillus sp. was reported by Dutta et al. [
32]. PSB, PSM, and PMPSB microorganisms were reported in the study of Jorquera and colleagues [
35]; however, the authors mentioned only strains from the genera
Pseudomonas,
Enterobacter, and
Pantoea, whereas Chen et al. [
36] presented Delftia sp. as PSB for the first time. The production of siderophores by
Bacillus sp. was reported by Ghodsalavi et al. [
31] and Dutta et al. [
32]. Morel et al. [
33] reported that
Delftia sp. JD2 produced siderophores in Cr(VI) stress conditions.
It is worth emphasizing that other authors presented the ability to promote plant growth by microorganisms originating from soil or isolated from terrestrial vegetation. However, the data regarding aquatic microorganisms are scarce. Most of the microorganisms described were not found in the A. filiculoides microbiome and only Bacillus sp. was often identified.
By displaying the highest potential in growth promotion among all isolates,
Delftia sp. AzoEpi7 particularly attracted our attention. Members of the genus
Delftia are aerobic non-endospore forming Gram-negative rods that inhabit diverse ecological niches. Taxonomically, this genus belongs to the Comamonadaceae family within the Burkholderiales order of the Betaproteobacteria class. Currently, it comprises five species:
D. acidovorans,
D. tsuruhatensis,
D. lacustris,
D. litopenaei, and
D. deserti [
37].
Delftia sp. is known as a halotolerant bacterium with the capability of organic biodegradation [
38]. It has also been reported that
Delftia sp. have potential roles in bioremediation of organic and inorganic pollutants and production of industrially valuable compounds [
39]. In addition, the
Delftia sp. genome sequencing (6–6.7 Mb, GC content of approximately 66%) proved that particular genetic elements are involved in diverse biodegradation pathways and resistance to heavy metals [
37,
40], production of phytohormones and siderophores [
33], and production of antimicrobial compounds [
41]. In 2013, Johnston et al. [
42] reported that
D. acidovorans exhibited resistance against gold by producing a secondary metabolite allowing biomineralization of the metal from liquid. Recently, Li and colleagues [
43] have proved that
D. tsuruhatensis GX-3 is able to bioaccumulate gold forming nanoparticles outside its cell. This makes
Delftia sp. extremely interesting bacteria from the biotechnological and engineering point of view, since all ways for reclaiming precious metals are tempting and wanted. Another interesting potential of
Delftia sp. was demonstrated in the study conducted by Jangir and colleagues [
44]. It appeared to use an extracellular electron transfer (EET) strategy for energy harvesting via generation of anodic current using acetate as an electron donor. This may indicate the potential of
Delftia sp. in electricity generation via Microbial Fuel Cells (MFC). All this information proves the high importance of these bacteria. Another feature of
Delftia sp. is the production of nanopods, i.e., extracellular structures important in cell-to-cell interactions, when grown on phenanthrene [
45].
Since there are studies on microbially-assisted phytoremediation, it would be worth studying the role of the microbiome in metal remediation [
7,
9,
46], which what would be beneficial for designing better metal-removing biological systems. Moreover, our previous studies [
11] showed high potential of
Azolla sp. in the reduction of metal levels in waters, which encourages us to study the newly discovered microbiome and
Delftia sp. AzoEpi7 in detail.
4. Materials and Methods
4.1. Plant Material
A. filiculoides originated from our laboratory culture established in 2010 using material obtained from Warsaw Botanical Garden (Poland). Plants were grown according to the recommendation of the International Rice Research Institute [
47] (
Appendix A). After 3 weeks, the biomass obtained was used for microbial isolation.
All reagents were dedicated for microbiological analyses and purchased from Sigma-Aldrich; water was deionized and sterilized before use (sdH2O).
4.2. Azolla Cyanobiont
The isolation of the cyanobiont was performed by crushing the plant material (sterilized three times in 0.12% NaClO, 0.01% Triton X-100 for 10 min, next in 70% ethanol and sdH
2O) between two sterile microscopic slides and washing with nitrogen-free BG11
0 medium [
47]. Next, the material was incubated in batch culture using 15 mL BG11
0 medium (1:6, culture: Medium ratio) at 23 °C and 63 µmol quantum photosynthetically active radiation (PAR) per m
2 s at a 24/0h photoperiod (n = 5). After 7 days, the cells were passaged by inoculating 20 mL of fresh BG11
0 medium with 2.5 mL inoculum (n = 4). One week later, the next subculture was performed (6.5 mL of inoculum + 40 mL of both media, 7 days). Importantly, after each step, the samples were taken for microscopic observations and after the last passage, the material was used for isolation of cyanobacterial DNA.
4.3. Isolation of Microorganisms
Prior to the isolation of the endophytic microorganisms, the plan material was sterilized in a laminar chamber. For this operation, 3 healthy plants were randomly chosen from the culture in order to provide repeatability. The material was washed in sdH2O and separated into shoots and roots. Next, the plants’ parts were immersed for a given time in subsequent reagents: (1) 0.1% Tween 80 for 30 s, (2) 1% NaClO for 5 min, (3) 70% ethanol—5 min, and (4) sdH2O—5 min. The efficiency of sterilization was assessed by inoculating Petri dishes with the water from the last washing. Each sterilized plant part was ground in a mortar using 1 mL of phosphate buffer (pH 6.7). Next, three 250-μL samples of each portion of the ground material were transferred into Eppendorf tubes.
The microorganisms present on the surface of A. filiculoides were isolated in two ways. The first method involved placing a few randomly chosen plants into a beaker with 10 mL of phosphate buffer; next, the plants were discarded after careful stirring. The second variant of isolation consisted of placing randomly picked plants onto the agar (n = 3) setting their top part on the agar (see agar composition below).
4.4. Cultivation and Description of Isolated Microorganisms
All material obtained from isolation described below were subjected to series dilutions up to 10−4. These diluted cultures (250 μL) were spread on sterile nutrient agar (25 mL per Petri dish) consisting of: Yeast extract (0.2%), beef extract (0.2%), peptone (0.5%), NaCl (0.4%) and agar (1.5%), pH 7.4 (BTL, Poland), supplemented with nystatin (50 mg·mL−1) to avoid fungal growth (as fungi were not the subject of this study) and incubated in the dark at 30 °C for 7 days (Hereus B20, Thermo Fisher Scientific, USA). Then, microbial colonies were inoculated into fresh medium and cultivated as above. The procedure was repeated until pure cultures were obtained.
The morphology of the colonies was described in terms of their shape (surface, elevation, margin, texture, size), pigmentation, and opacity. Their counts were made and referred to the total number of isolates (58) and total counts of both epi- (43) and endophytes (15). These numbers were further discussed as percentages, but they are presented in the table as individual counts. In order to describe the shape of the isolated cells and the type of their cellular wall, the Gram staining method was applied. The resulting slides were examined under a Nikon Eclipse 80i microscope equipped with UV2A, B2A, G2A, FITC and TRITC filters and photographs were taken using a digital camera with NIS-Elements software (Nikon Instruments Europe B.V., Amsterdam, The Netherlands). Cells with purple color were considered as Gram-positive, whilst red color indicated Gram-negative microorganisms.
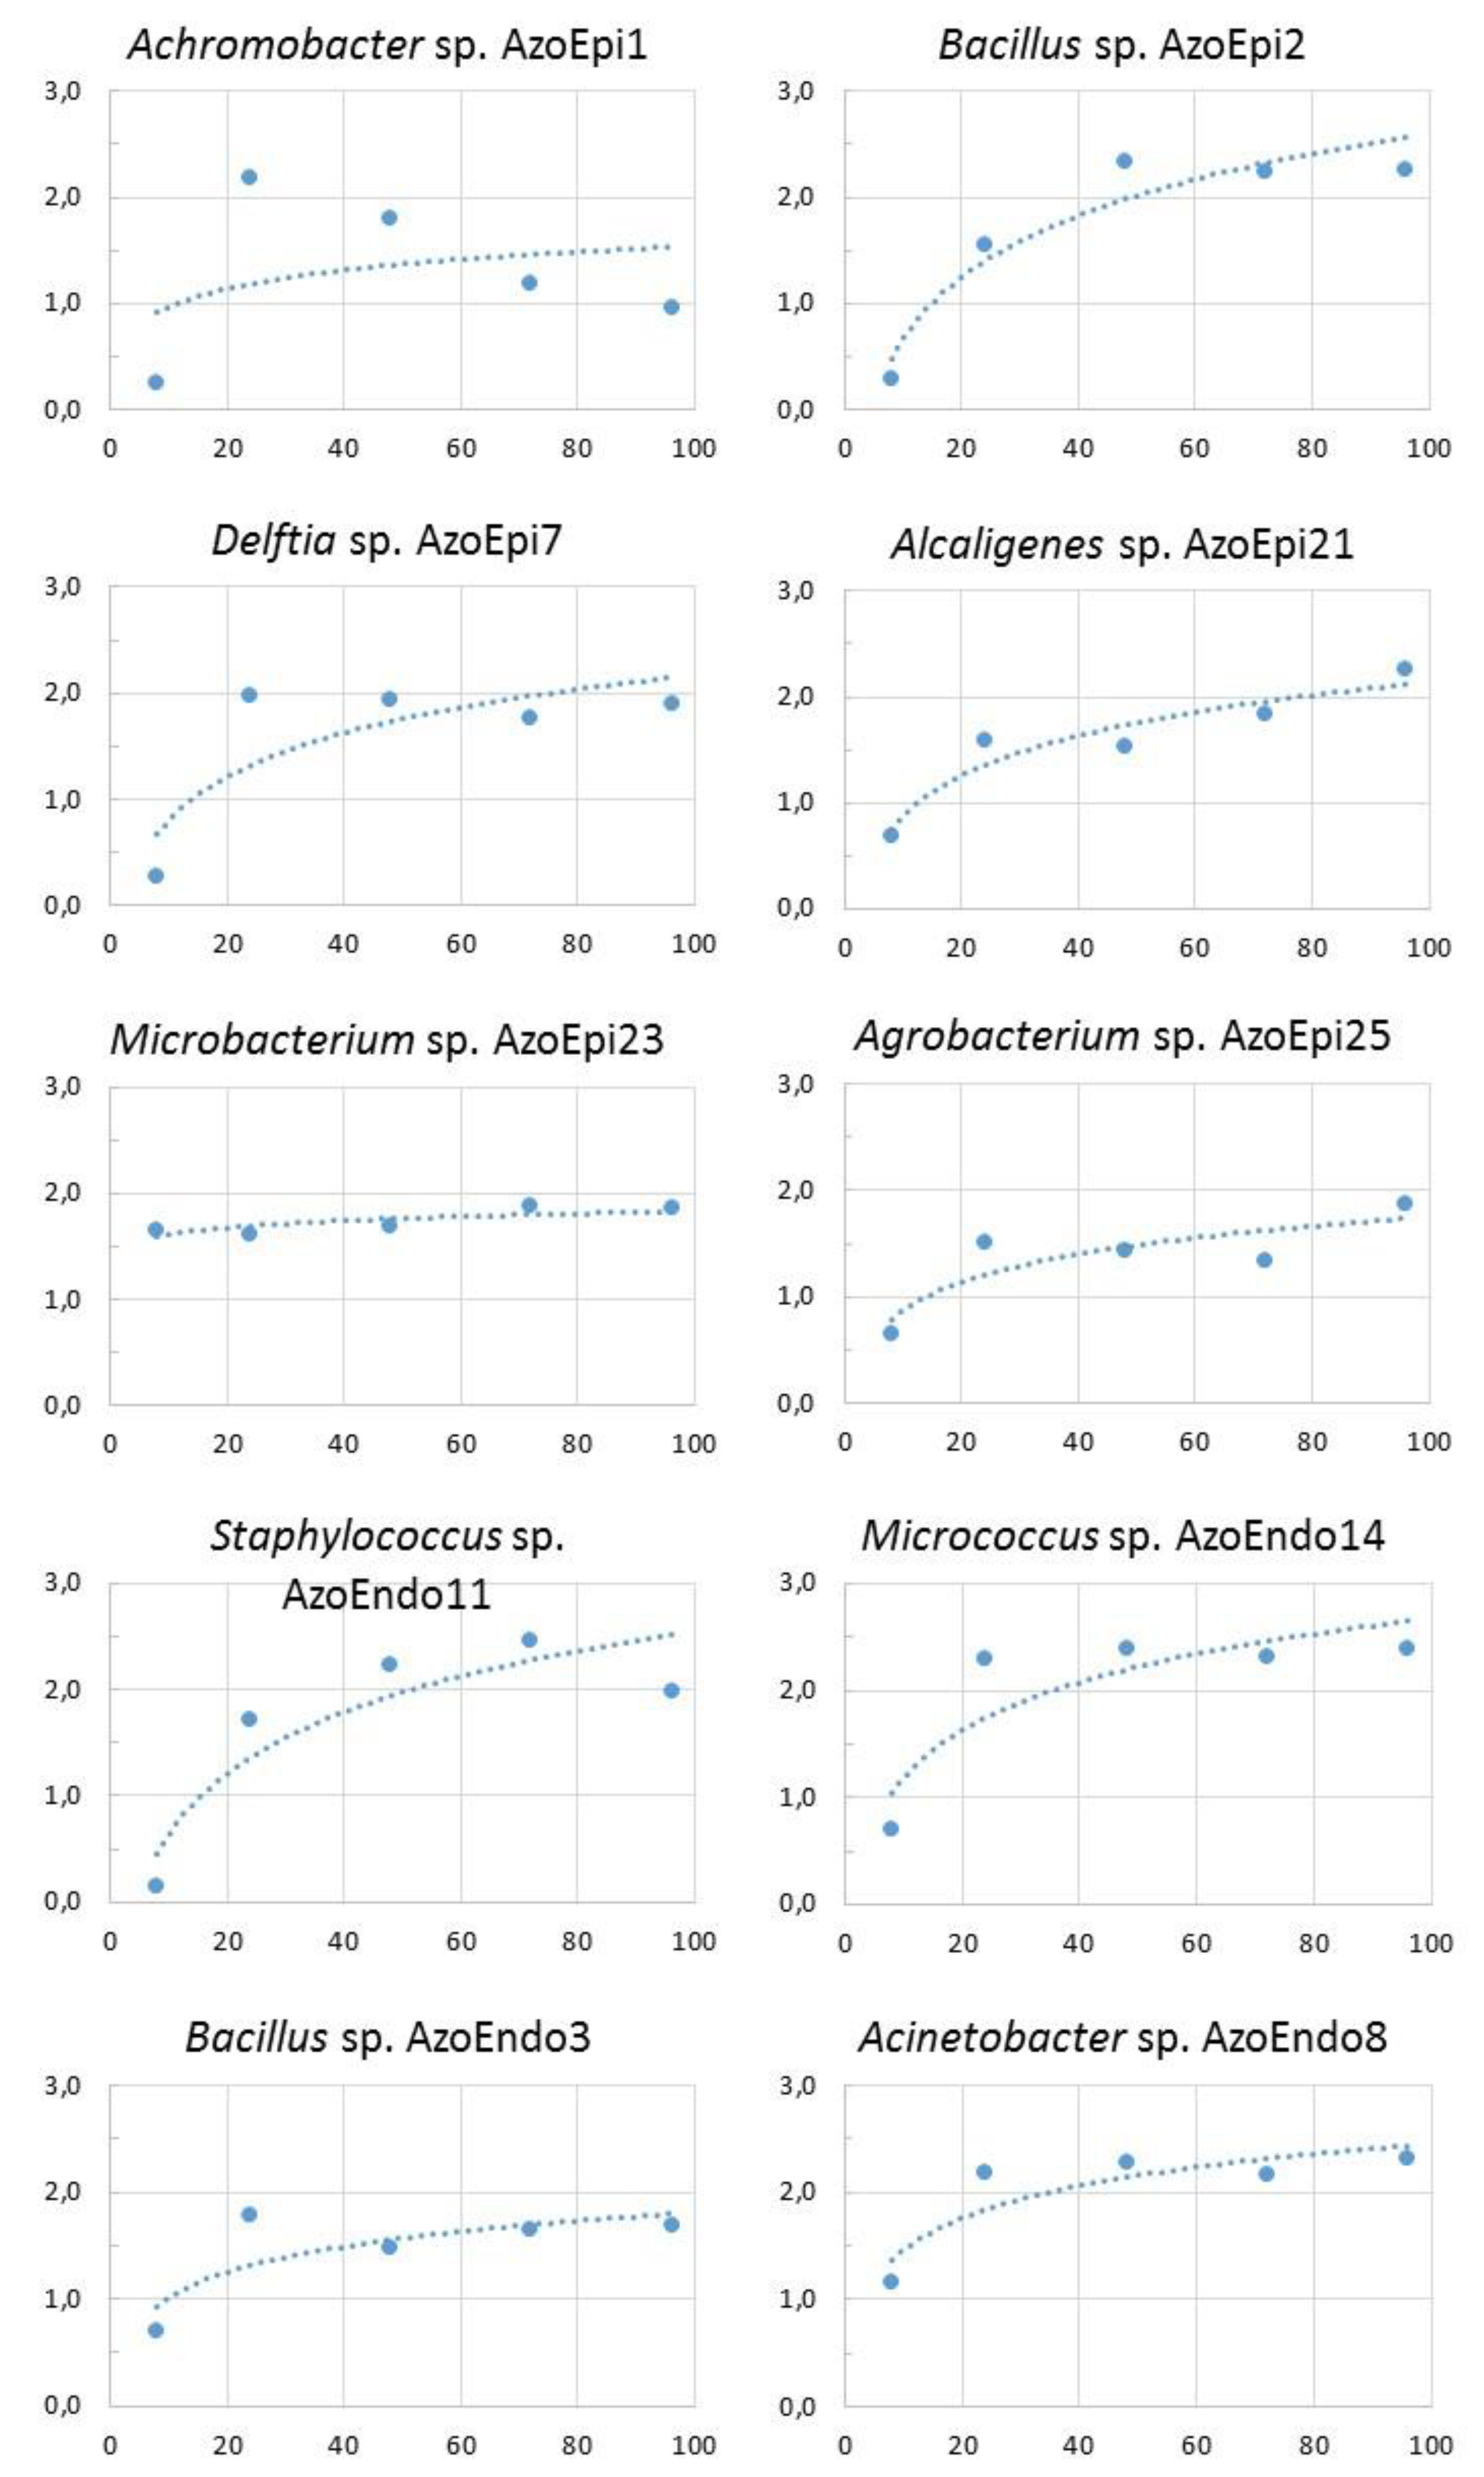
The isolates were cultured on a liquid nutrient broth (0.2 % yeast extract, 0.2% beef extract, 0.5% peptone, 0.4% NaCl and 1.0% glucose, BTL, Poland) for 7 days at 30 °C (New Brunswick™ Innova
® 42R, Eppendorf AG, Germany). During incubation, optical density (OD
600) was determined spectrophotometrically (Shimadzu UV-1800, Japan) to construct growth curves for the microorganisms (
Figure A1). For long-term storage, 700 μL of each inoculum was mixed with 300 μL of glycerol (3 replicates for the endophytes and 2 replicates for the epiphytes) and frozen at −80°C (ZLN-UT 300, Pol-Eko-Aparatura, Poland). The other samples were used for subsequent analyses.
4.5. Identification of the Cyanobiont
Only living material from the cultures was applied for taxonomic identification. Microscopic observations in a light field and using a UV lamp and UV2A filter were carried out using an Eclipse 80i Nikon microscope working with the magnification range up to 100x (Nikon Instruments Europe B.V., Amsterdam, The Netherlands). The microscope was connected to a digital microscope camera with NIS-Elements software, used to observe and measure colonies, cells, and heterocyst of the studied cyanobacteria. The taxonomic designation was based on Komárek [
48] and Hindak [
49].
4.6. Molecular Techniques
Total genomic DNA was isolated according to Stepniewska et al. [
50] (
Appendix A) followed by PCR reaction. The PCR mixture contained 1X Phusion Flash High-Fidelity PCR Master Mix (Thermo Scientific, USA), 1 μL of template DNA (1100 µg/mL on the average,
Table A1), and sterile double-distilled water (free DNase) in a total volume of 25 μL. Universal eubacterial primers (each 1.0 μM): 27F and 518R (
Table A2) were used. The reaction was carried out under the following conditions: 98 °C for 10 s; 30 cycles of 95 °C for 5 s, 56 °C for 5 s, and 72 °C for 40 s (LABCYCLER, SensoQuest GmbH, Germany). For amplification of cyanobiont DNA, the following four primers were used: Cyanobacterium-specific 23S30R and CYA359F, whilst nif-Df and nif-Dr were used for targeting the
nif gene (
Table A2). The PCR reactions were carried out as follows: 98 °C for 10 min; 30 cycles of 98 °C for 5 s, 55 °C for 5 s, and 72 °C for 60 s (
nif primers) and 98 °C for 5 min; 30 cycles of 98 °C for 35 s, 54 °C for 45 s, and 72 °C for 60 s (16S rRNA primers). The PCR products were run on agarose gel (1%) and visualized with the use of SimplySafe™ (EURx, Poland). Additionally, control reactions were performed: Negative—containing only sterile double-distilled water (free DNase) without a DNA template and positive, in which DNA isolated from
E. coli DH5α™ was a template. Then, all PCR products were purified and sent to sequencing (Genomed S.A., Poland). The sequences were analyzed by the web-version of BLASTN algorithm (NCBI, USA) for identification of the isolates. The identified sequences were deposited in the GenBank (NCBI,
http://www.ncbi.nlm.nih.gov/) under the following accession numbers: MG859252-7, MG881884-915, MG881917-9, MH605441-3, and MH605510-14.
4.7. Phenotypic Characterization
Bacterial strains in an exponential phase were applied for testing the ability of the microbiome to synthesize plant growth promoters. The production of indole-3-acetic acid (IAA) was initiated by inoculating liquid nutrient broth supplemented with 1 g l
-1 of L-tryptophan. Quantification of IAA was performed using Salkowski’s reagent (35% HClO
4 + 0.5 M FeCl
3∙6H
2O) and colorimetric analysis at 530 nm in reference to the calibration curve. Samples with pink color were considered positive for production of IAA [
51] (
Appendix A). Results were presented as means ± SD (standard deviation).
The ability to synthesize cellulolytic enzymes was assayed by growing the microorganisms (30 °C for 24 h) on nutrient agar supplemented with 1% carboxylmethylcellulose (CMC) sodium salt (cellulase activity indicator medium). Lugol’s solution was applied for visualization of cellulose activity. A positive reaction was observed when the colonies of the isolates were surrounded by a yellow halo against a dark background [
52]. Protease activity was determined by culturing selected isolates on nutrient agar supplemented with 5% skim milk at 30 °C in darkness (protease activity indicator medium). The development of clear zones around the colonies revealed protease activity.
Phosphate utilization by the microorganisms was determined using two P sources: Organic, sodium phytate, C
6H
18P
6O
24·12Na·xH
2O (PSM medium) and inorganic calcium phosphate (Ca
3(PO
4)
2) (NBRIP medium). The first was used for identification of P-mineralizing bacteria (PMB) and the second for P-solubilizing bacteria (PSB) [
35]. The inoculated media were incubated at 30 °C for 4 days. The presence of clear zones around the colonies was taken as an indicator of phytate mineralization and phosphate solubilization. Based on these observations, we divided the microorganisms into PMB, PSM, and those using both P-sources (phosphate mineralizing, phosphate solubilizing bacteria, PMPSB).
Siderophore production was quantified using a CAS-agar assay of Alexander and Zuberer [
53] (
Appendix A). Positive results were indicated by formation of a clear halo around the colonies, showing a visual change in the color from dark blue to yellow.
For all plate tests, Petri dishes were inoculated with 15 µl of the cell suspension in 4 points. To quantify the enzymatic activities, the sizes of colonies and halos were assessed and halo-to-colony size ratios (n = 3) were calculated. The data are presented as means ± SD.
5. Conclusions
Our experiment has proved that A. filiucloides is inhabited by not only its cyanobiont but also by bacteria present both on its surface (epiphytes) and inside the plant (endophytes).
In general, the isolates represented Gram-positive bacteria mostly with a punctiform size (epiphytes, also small size) with a circular shape, raised with a glistering and smooth surface (epiphytes, also rough) with butyrous texture, opaque, and cream pigmentation (endophytes, also yellow and white-cream) with an entire margin.
The similarity analysis allowed us to classify the isolates into 9 bacterial genera. The epiphytes belonged to Achromobacter, Bacillus, Microbacterium, Delftia, Agrobacterium, and Alcaligenes, while the endophytes were classified as Bacillus, Staphylococcus, Micrococcus, and Acinetobacter.
The tests applied for the determination of plant growth promotion features revealed high importance and benefits of the tested microbiome for plants. All isolates were able to synthesize enzymes responsible for cell wall lysis (cellulase and protease). In addition, all of them showed P mineralization potential and some exhibited P solubilization capability. Three bacterial strains (Micrococcus sp. AzoEndo14, Delftia sp. AzoEpi7, Agrobacterium sp. AzoEpi25) synthesized IAA. Siderophores were only produced by endophytic Bacillus sp. AzoEndo3 and epiphytic Achromobacter sp. AzoEpi1, Delftia sp. AzoEpi7, Alcaligenes sp. AzoEpi21, and Agrobacterium sp. AzoEpi25. Delftia sp. AzoEpi7 seemed to be the only strain with the ability to synthesize all studied growth promoters; hence, we recommend it as the most beneficial for host plants.


