Article

Planning Lung Radiotherapy Incorporating Motion Freeze PET/CT Imaging

1
Department of Biomedical Imaging and Radiological Science, China Medical University, Taichung 40402, Taiwan
2
Department of Medical Imaging, Chang Bing Show Chwan Memorial Hospital, Changhua 50544, Taiwan
3
Department of Radiation Oncology, Moffitt Cancer Center, Tampa, FL 33612, USA
4
Department of Bioinformatics and Medical Engineering, Asia University, Taichung 41354, Taiwan
5
AI Center for Medical Diagnosis, China Medical University Hospital, Taichung 40402, Taiwan
*
Author to whom correspondence should be addressed.
These authors contributed equally to this work.
Appl. Sci. 2018, 8(9), 1583; https://doi.org/10.3390/app8091583
Submission received: 30 July 2018 / Revised: 4 September 2018 / Accepted: 5 September 2018 / Published: 7 September 2018
(This article belongs to the Special Issue Advanced Intelligent Imaging Technology)

Abstract

:

Featured Application

The Motion Freeze (MF) technique, which integrates 100% of the signal of each respiratory phase in four-dimensional positron emission tomography (4D-PET) images and creates the MF-PET images, is capable of eliminating the effect by respiratory motion and signal dispersion from three-dimensional PET (3D-PET) and 4D-PET images. In this study, the effectiveness of respiratory gated radiotherapy applying MF-PET images (MF-Plan) in lung cancer patients was investigated and compared with three-dimensional intensity modulated radiotherapy (3D-Plan) and routine respiratory gated radiotherapy (4D-Plan) on the impact of target volume and dosimetry. Our results indicate that MF-Plans have dosimetrical advantages compared with the 3D-Plan and 4D-Plan in lung cancer radiotherapy. The MF-Plan may improve critical organ sparing in the lung, heart, and spinal cord, while maintaining high target coverage.

Abstract

Motion Freeze (MF), which integrates 100% of the signal of each respiratory phase in four-dimensional positron emission tomography (4D-PET) images and creates the MF-PET, is capable of eliminate the influences induced by respiratory motion and dispersing from three-dimensional PET (3D-PET) and 4D-PET images. In this study, the effectiveness of respiratory gated radiotherapy applying MF-PET (MF-Plan) in lung cancer patient was investigated and compared with three-dimensional intensity modulated radiotherapy (3D-Plan) and routine respiratory gated radiotherapy (4D-Plan) on the impact of target volume and dosimetry. Thirteen lung cancer patients were enrolled. The internal target volumes were generated with 40% of maximum standardized uptake value. The 3D-Plan, 4D-Plan, and MF-Plan were created for each patient to study the radiation to the targets and organs at risk. MF-Plans were associated with significant reductions in lung, heart, and spinal cord doses. The median reductions in lung V20, lung mean, heart mean doses, and spinal cord maximum dose compared with 3D-Plans were improved. When compared with 4D-Plans, the median reductions in lung V20, lung mean dose, heart mean dose, and spinal cord maximum dose were improved. Our results indicate that the MF-Plan may improve critical organ sparing in the lung, heart, and spinal cord, while maintaining high target coverage.

1. Introduction

In order to reduce the uncertainty caused by respiratory motion during lung cancer radiotherapy, four-dimensional positron emission tomography/computed tomography (4D PET/CT) and respiratory-gated radiation therapy have been applied [1]. The use of respiratory-gated 4D PET/CT improves the quality of lung cancer radiotherapy, as it enables delivery of the correct dose during the optimal time window of the respiratory phase [2]. In addition to new acquisition and radiation therapy techniques, obtaining a better depiction of the primary tumor decreases uncertainty related to tumor delineation, which may contribute towards motion target volumes. Methods developed in recent years that use normal tissue dosimetry have been shown to further improve the definition of tumor contours based on 4D PET/CT. These methods identify the region of interest for radiation treatment planning using imaging information from a certain respiratory phase, and enable treatment to be focused on targets of small sizes, named planning target volumes (PTVs). Reduction in PTVs may result in reduced toxicity and may potentially improve tumor treatment outcomes if used in conjunction with dose escalation [3,4]. However, the use of these methods remains controversial, and it has been suggested that better tumor contours need to be obtained during treatment planning [5]. Therefore, studies have been performed to compare the accuracy of tumor delineation by 3D PET/CT and 4D PET/CT [6,7]. In recent years, incorporation of 4D PET/CT into radiotherapy planning has been demonstrated to contribute towards more conformal treatment plans, which only shape the radiation beams and escalate radiation dose to cover the tumor. Moreover, employment of 4D PET/CT with the Motion Freeze (MF) technique can provide a clearer definition of certain tumor subvolumes in a specific section of the respiratory cycle [8].
In order to effectively utilize 4D PET/CT imaging, improve the image quality, and enhance the accuracy of target volume definition, our research team applied the MF approach in 4D-PET imaging to generate a single 3D effective PET image. By deformable image registration, this process used 100% of the counts of the PET scan data acquired from all phases to correct for respiratory tumor movement, and enabled creation of an MF-PET image corresponding to a static frame of a specific respiratory phase. The results of our study indicated that application of MF in 3D and 4D PET can not only reduce tumor mismatching, but also effectively increases the quantitative standardized uptake value (SUV) [8]. When 4D PET/CT is used in treatment planning for lung cancer, SUV measurement is often affected by signal dispersion and image noise, which reduce the accuracy of the measurement. Use of the MF technique successfully solves this problem and assists with an accurate definition of target volumes in clinical cancer treatment planning.
In this study, we used MF technology to assemble MF-PET images, and applied the results in respiratory-gated radiotherapy. We compared this approach with routine respiratory-gated radiotherapy and conventional 3D intensity-modulated radiation therapy, and also investigated the impact of using MF-PET imaging on target delineation and dosimetry evaluation parameters in the lung cancer treatment plan.

2. Materials and Methods

2.1. Phantom Study

This study used the CIRS dynamic thorax phantom (CIRS Inc., Norfolk, VA, USA) to validate the effect of using MF technology on target volume definition for cancer treatment planning. During 4D imaging, the target volume was set to 8 mL under all different respiratory motion situations, and [18F]Fluoro-2-deoxy-2-d-glucose ([18F]FDG) was injected at a concentration of 10 µCi/mL. In addition to the static status, the movement pattern of the target (tumor) in the phantom included three pre-defined motions generated by the CIRS motion control software; namely, Sin, Cos6, and Sharkfin. All motion patterns had the same settings: the superior–inferior (SI) direction had an amplitude of 5 mm (displacement = 10 mm), and the anterior–posterior (AP) and left–right (LR) directions were set to exhibit synchronized movement with an amplitude of 5 mm (displacement = 10 mm). Under the three motion patterns, 4D PET/CT and 3D PET/CT images were obtained, and the T50% phase during which the tumor anatomical movement was smallest for the longest duration was used as the reference to build the MF-PET images. A threshold of 40% of the maximum standardized uptake value (SUVmax) was used to delineate the target volume. The differences in target volumes defined by PETMF, PET4D-T50%, PET3D, and PETStatic were investigated.

2.2 Patients

Thirteen patients with non-small cell lung cancer (NSCLC) were enrolled in this study from the Department of Radiation Oncology, China Medical University Hospital, Taiwan. The clinical features of the patients are shown in Table 1. There were seven men and six women, of an average age of 65 years. The lung tumor locations of the patients were also recorded. Six patients had tumors in their left lung, four of which had lesions in the left upper lobe (LUL) and two in the left lower lobe (LLL). The remaining seven patients had tumors in their right lung, two of which had lesions in the right upper lobe (RUL), one in the right middle lobe (RML), and four in the right lower lobe (RLL). All the patients with NSCLC underwent both 3D PET/CT and 4D PET/CT imaging. The protocol of this study was approved by the Research Ethics Committee of China Medical University Hospital (Institutional Review Board approval no.: CMUH103-REC2-047) prior to imaging and clinical data collection.

2.3. Image Acquisition

All patients in this study underwent standard 3D PET/CT imaging using a GE PET/CT-16 slice and a Discovery STE (GE Medical System, Milwaukee, WI, USA). In all cases, 370 MBq [18F]FDG was administered to the patients 40 min prior to 3D PET/CT imaging. Three-dimensional CT was conducted at 120 kV in the helical mode with a Smart/Auto mA (range, 30–210 mA), followed by conduction of 3D-PET imaging. In the PET imaging process, image collection of each section took 1.5 min to complete for the set field size. Three-dimensional PET image reconstruction was performed using the expectation-maximization algorithm (20 subsets and 2 iterations), and the images were post-filtered with a 7-mm 3D Gaussian filter.
After completion of 3D PET/CT imaging, the patients underwent 4D PET/CT imaging using an instrument similar to that employed for 3D PET/CT imaging, but equipped with an additional Varian Real-Time Position Management (RPM, Varian Medical Systems, Palo Alto, CA, USA) system. The process began with conduction of 4D-CT imaging. Unlike 3D-CT, which continuously captures images using helical mode scanning, 4D-CT uses Cine mode scanning (an axial scan of generally more than one gantry rotation) to acquire a series of images from an anatomical portion of the chest for at least the temporal length of one breathing cycle, and then moves to the next portion of the anatomy to take images not covered by the previous acquisition. The process was complete when the images acquired spatially and temporally covered the entire chest. In this way, for each portion of the anatomy, a series of images that covers the entire breathing cycle was obtained for subsequent 4D-CT image reconstruction. The 4D-CT scan conditions for the chest region were 120 kV and 100 mA, and the respiratory cycle was divided into 10 phases, named T5%, T15%, T25%, …, T95% (the T5% phase corresponding to the end-inspiration and the T55% phase to the end-expiration). In order to obtain sufficient images to resolve the problem caused by respiratory movement of patients, an 8-min series of images was used to reconstruct the 4D-PET images. Reconstruction was performed using the expectation-maximization algorithm with 2 iterations and 20 subsets, and a post-reconstruction Gaussian filter (7 mm) was applied.

2.4. Motion Freeze (MF) Technique

After 4D PET/CT images had been obtained, the MF technique was applied to reconstruct the 4D PET images [8]. The end-expiration phases (T45%, T55%, and T65%), which are the most reproducible phases in the respiration cycle, were selected for the generation of MF-PET images (PETMF-45%, PETMF-55%, and PETMF-65%). These three phases were also taken as the treatment period for respiratory-gated radiation therapy in this study.
The MF technique is based on the optical flow method (OFM) used to perform image reconstruction [9]. The main computing equation is as below:
  v ( n + 1 ) = v ( n ) + f ( f · v ( n ) + f t α 2 + f 2 )  
Terms definition:
  • v(n): the average velocity of the surrounding voxels.
  • n: the iteration number.
  • f: the image intensity.
  • α: the weighting factor.
In this study, calculation of v was divided into the three-dimensional displacements of the voxels in the directions of head to feet, front to back, and left to right. In general, during reconstruction of MF PET images, a reference phase is first selected, which is normally the most reproducible phase, that is, the end-expiration phase (T55%). However, we did not use MF-PET imaging to delineate the tumor volume. In order to define the respiratory-gated window in the radiation therapy, three phases, T45%, T55%, and T65%, were used for MF image reconstruction.

2.5 Treatment Planning

All 3D PET/CT, 4D PET/CT, and MF images were then input into the Eclipse Treatment Planning System (version 13.6, Varian Medical Systems, Palo Alto, CA, USA) to carry out delineation of the tumor and develop a treatment plan.
In order to achieve the best treatment outcome of respiratory-gated radiotherapy, the respiratory-gated window is normally set as the respiratory phase of end-expiration, during which the tumor anatomical movement is the least for the longest duration. We found that the best respiratory phases to use as the respiratory-gated window in our patients were T45%, T55%, and T65%. Therefore, we used images from these three phases for target delineation [10]. To integrate the imaging information from these three respiratory phases, 4D-CT, 4D-PET, and PETMF images were processed using the maximum intensity projection (MIP) technique to generate CTMIP, PETMIP, and MF-PETMIP images. These MIP images were then used for delineation of the tumor volume (from 3D PET, PETMIP, and MF-PETMIP images) and identification of organs at risk (OARs) (from CTMIP images).
  • CTMIP: generated from 4D CTT45%, 4D CTT55%, and 4D CTT65% images using MIP.
  • PETMIP: generated from 4D PETT45%, 4D PETT55%, and 4D PETT65% images using MIP.
  • MF-PETMIP: generated from PETMF-45%, PETMF-55%, and PETMF-65% images using MIP.
For each patient, individual three-dimensional (3D-Plan), four-dimensional (4D-Plan), and MF (MF-Plan) respiratory-gated radiotherapy plans were designed, in which the delineation of internal target volumes (ITVs) was performed as described below:
  • ITV3D: volumes of 3D PET images with a SUV over 40% of the SUVmax.
  • ITV4D: volumes of PETMIP images with a SUV over 40% of the SUVmax.
  • ITVMF: volumes of MF-PETMIP images with a SUV over 40% of the SUVmax.
After ITV delineation, a 5-mm margin was added to create the PTV of each treatment plan, namely PTV3D, PTV4D, and PTVMF, respectively. OARs, such as the heart, lungs, and spinal cord, were delineated by an experienced radiation oncologist based on the CTMIP images.
Once the extent of the PTVs and OARs had been determined, treatment plans for individual patients were custom-designed by an experienced medical physicist. For the 3D Plan, 4D Plan, and MF Plan, the target volume was determined based on the PTVs (PTV3D, PTV4D, and PTVMF, respectively). All three plans used 60 Gy in 30 fractions with 6 MV photons. In addition, the designs of the treatment plans (including the number of photon fields, number of segments, and dose constraints) were all the same. In each treatment plan, 95% of the PTV was covered by the 97% isodose curve. In addition, dose constraints for OARs were limited to radiotherapy standards: restriction of the relative volume of the lung receiving doses above 5 (V5) and 20 Gy (V20) to below 65% and 35%, respectively, and an average dose < 20 Gy; 1/3 of the volume of the heart limited to a maximum dose of 50 Gy; and the spinal cord limited to a maximum dose of 50 Gy.

2.6. Statistical Analysis

After the radiotherapy plans for each patient had been designed, in addition to comparison of the tumor volume between the different plans, we also analyzed the differences in the target margins and the radiation level received by surrounding normal tissues. The dose distribution within the target volume was evaluated based on the homogeneity index (HI) and the conformity index (CI) proposed by the Radiation Therapy Oncology Group (RTOG) [11,12], whose guidelines describe HI and CI as shown below:
  Homogeneity   Index   ( HI )   = I m a x R I  
Terms definition:
  • Imax: the maximum isodose in the target.
  • RI: the reference isodose.
If the HI was close to 1, it was considered as having a dose distribution within the target with excellent homogeneity.
  Conformity   Index   ( CI )   = V R I T V  
Terms definition:
  • VRI: the target volume covered by the reference isodose.
  • TV: the target volume.
The CI is between 0 and 1. If the CI was close to 1, it corresponded to the ideal conformation. To evaluate the dose received by OARs, V5, V10, and V20 of the lung; the mean radiation dose; mean radiation dose of the heart; and maximum radiation dose of the spinal cord were recorded for comparison.
The results of the study were compared using SPSS software (version 22.0; SPSS Inc., Chicago, IL, USA), and the Wilcoxon signed-rank test (for paired variables) was used to examine differences in the radiation dose and PTV parameters. The Pearson correlation coefficient was used to analyze the dosimetric parameters of OARs and the differences in PTVs between treatment plans. A p-value < 0.05 was considered to indicate a significant difference.

3. Results

3.1. Phantom Study

The target volume was defined based on images taken from the CIRS dynamic thorax phantom using a threshold of 40% of the SUVmax. The volumes defined by different PET images under various waveforms are shown in Table 2. The percentage of difference on target size was calculated from the contour of volume and the gold standard target (8 cm3). The results showed that MF reconstruction had the smallest volume that most closely conformed to the real target volume at any waveform as compared with the results obtained from images reconstructed with 3D-PET or 4D-PET from the T50% phase.

3.2. Tumor Volume

For patient number 10, we compared the 3D-PET, 4D-PET (T55%), MF-PET (T55%) images, and the vertical image profiles drawn across the SUVmax voxel of the lesion on MF-PET image and the same location in 3D-PET and 4D-PET images in Figure 1. Compared with 3D-PET and 4D-PET, the lesion was substantially improved in MF-PET. Further, the ITV (SUV over 40% of the SUVmax), the solid line area on the profile, of MF-PET was smaller than other images.
The SUVmax value of each patient were as shown in Table 3. The SUVmax of 4D-PETMIP and MF-PETMIP was close and the maximum percentage difference was 2%. When comparing MF-PETMIP with 3D-PETMIP, there were five patients’ SUVmax that were smaller than 3D-PETMIP.
The tumor volumes delineated in the radiotherapy plans were as shown in Table 4. The results demonstrated that the PTV obtained from 3D-PET imaging (PTV3D) was the largest (range, 732.9–54.4 cm3), followed by PTV4D defined by PETMIP (range, 509.7–24.7 cm3), with PTVMF defined by MF-PETMIP being the smallest (range, 499.4–14.1 cm3). Comparison of the PTVs obtained using the three methods showed that PTV3D versus PTV4D, PTV3D versus PTVMF, and PTV4D versus PTVMF were significantly different, with p values of 0.001, 0.001, and 0.002, respectively.
We next compared the percentage difference in PTVs between the treatment plans (Table 5). Between PTV3D and PTV4D, a maximum percentage difference of 55.3% was observed, with a median value of 35.6%; between PTV3D and PTVMF, the maximum percentage difference and the median were 74.1% and 40.6%, respectively; and between PTV4D and PTVMF, the maximum percentage difference and the median were 44.7% and 5.6%, respectively. Delineation of PTVs on CT images in the three treatment plans and their differences are shown in Figure 2.

3.3. Radiation Dose Distribution

The HI, the CI, the percentage volume that received at least 95% of the prescription dose (V95%), and the maximum target dose (Dmax) were also compared between the different treatment plans (Table 6 and Table 7). The median values (and their ranges) of the HI for the 3D, 4D, and MF-Plans were 1.05 (1.07–1.04), 1.05 (1.06–1.04), and 1.05 (1.07–1.04), respectively; the median values of the CI (and their ranges) of the three plans were 1.00 (1.00–0.90), 1.00 (1.00–0.99), and 1.00 (1.00–0.99), respectively. No statistical difference was seen between the three plans (p > 0.05). In addition, no differences in the V95% and Dmax between the plans were observed.

3.4. Radiation Dose Received by Organs at Risk (OARs)

The dose distributions of the 3D-Plan, 4D-Plan, and MF-Plan on CT images in radiotherapy are shown in Figure 3. The relative volume of the lung receiving a dose above 5 (V5), 10 (V10), and 20 (V20) Gy; the mean radiation dose of the heart; and the maximum radiation dose of the spinal cord were used to evaluate the radiation dose received by OARs.
Among the three plans, the radiation dose received by the lung was of the order 3D Plan > 4D Plan > MF Plan, and the phenomenon was seen when V5, V10, or V20 were used as the criterion (Figure 4). For the 3D Plan, 4D Plan, and MF Plan, the median values (and ranges) of the V5 were 30.6% (56.6–11.5%), 26.1% (54.4–8.1%), and 21.6% (5.2–6.9%), respectively; those of the V10 were 20.6% (41.8–7.8%), 16.2% (36.4–5.6%), and 14.1% (37.8–5.2%), respectively; and those of the V20 were 15.6% (30.3–5.5%), 13% (28.1–3.8%), and 10.5% (27.4–3.2%), respectively.
The MF Plan had the lowest mean radiation dose received by the lung, followed by the 4D Plan (Figure 5). For the 3D Plan, 4D Plan, and MF Plan, the median values (and ranges) were 810 cGy (1554–348 cGy), 622 cGy (1396–238 cGy), and 540.4 cGy (1353–223 cGy), respectively.
Comparison of the three plans revealed that the MF Plan resulted in the lowest mean radiation dose of the heart, followed by the 4D Plan (Figure 6). For the 3D Plan, 4D Plan, and MF Plan, the median values (and ranges) were 906 cGy (1648–30 cGy), 722 cGy (1593–15 cGy), and 616 cGy (1618–11 cGy), respectively.
Comparison of the maximum radiation dose received by the spinal cord under the three plans (Figure 7) revealed that a significant difference was only observed between the MF Plan and the 3D Plan (p = 0.046). For the 3D Plan, 4D Plan, and MF Plan, the median values (and ranges) were 1422 cGy (3630–258 cGy), 1270 cGy (4389–39 cGy), and 1179 cGy (3865–34 cGy), respectively.
This study also investigated the relationship between the percentage difference in the PTV and the mean dose of the lung. As shown in Figure 8, the percentage difference in the PTV and the percentage difference in the V20 exhibited positive correlations between the 3D-Plan versus 4D-Plan, 3D-Plan versus MF-Plan, and 4D-Plan versus MF-plan (Figure 8a). In addition, the percentage difference in the PTV was also positively associated with the percentage difference in the mean dose of the lung (Figure 8b). In a comparison of the V20, the 3D-Plan versus 4D-plan, 3D-Plan versus MF-plan, and 4D-Plan versus MF-plan had Pearson correlation coefficients of 0.714 (p = 0.006), 0.866 (p < 0.001), and 0.779 (p = 0.002), respectively; and in a comparison of the mean dose, the Pearson correlation coefficients were 0.819 (p = 0.001), 0.898 (p < 0.001), and 0.753 (p = 0.003), respectively.

4. Discussion

In this study, we demonstrated the effect of application of the MF technique on the dose distribution in respiratory-gated radiation therapy. In comparison with the conventional 3D-Plan or respiratory-gated 4D-Plan, the MF-Plan using a MF reconstruction approach showed a better efficacy in terms of delineation of the target volume and reduced the radiation dose received by the surrounding normal tissues. Our findings suggested that the MF technique is of clinical value for use in radiotherapy planning for the treatment of lung cancer.
In the past, respiration-caused motion and deformation of the tumor have represented an extensive problem during radiotherapy for lung cancer. Conventional treatment increased treatment volumes by adding additional margins to the extent of the tumor. In this way, it is ensured that the radiation covers the possible path of the tumor due to target motion under respiration. However, although a better killing effect on the tumor may be obtained, this method also increases the radiation dose received by the surrounding normal tissues, which often lowers the quality of life for patients. Therefore, in order to obtain a balance between killing cancer cells and reducing normal tissue complications, a better method for the definition of tumor volumes is required [5,13]. Following the development of respiratory-gated imaging or real-time tumor tracking, diagnosis of and radiotherapy for lung tumors have become more accurate. The results of our current study demonstrated that the 4D-Plan and MF-Plan for respiratory-gated radiotherapy maintained a high radiation dose on the target volume, achieving the same treatment effect as that obtained by conventional treatment while reducing the dose received by OARs.
For definition of a tumor, unlike traditional 3D-PET imaging, 4D-PET can only collect images at certain respiratory phases, which limits the application of 4D PET/CT for the diagnosis and treatment of cancer. Rahmim and coworkers concluded that when 4D-PET uses a higher frame rate to collect fast dynamic images, noise in the images during most respiratory phases is increased. In order to increase the temporal resolution, complex image reconstruction needs to be introduced to divide the images into more respiratory phases, but the process also separates the original data collected into sequences and is time-consuming [13]. The differences in the signal level of the 4D-PET images among the respiratory phases directly affects the accuracy of volume definition of a tumor, and may even affect the outcome of the radiation treatment [5].
Although the currently-used respiratory-gated radiotherapy technique enables administration of radiation at the correct time and location, the question of how to make better use of clinical imaging technology to define the extent of a tumor remains an important issue in this field [6,14]. Studies have shown that PET/CT in combination with 18F-FDG can define smaller tumor volumes than those defined by CT alone [15]. Respiratory-gated 18F-FDG PET imaging has a significantly higher SUVmax than 3D-PET and 4D-PET [16], which can provide more accurate image quantification in cases of lung cancer. Therefore, in the present study, we applied the MF technique to reconstruct PETMF images for delineation of the tumor volume. In comparison with 3D and 4F PET, we found that the PTVMF delineated by PETMF was significantly smaller than that defined by PTV3D or PTV4D. This phenomenon of volume reduction was also similar to the results of our previous study [8]. The PTV is the result of 5 mm expansion through the ITV center. This PTV reduction is derived from the image difference used in defining the ITV. Although the threshold method was used to delineate the internal target volume, the value of SUVmax does not affect the target contouring (as the SUVmax in 3D-PET, 4D-PET, and MF-PET may vary). The reduction in the ITV is a result of the noise reduction in MF-PET images. The MF technique used in this study was first collected from 4D-PET images. The signal value in the same position in different respiratory phase images for which using the statistical median effectively avoids the statistical effects of excessive height and excessively low regions that may be caused by image noise or insufficient signal in each single respiratory phase. Therefore, the MF-PET image produces an image of the difference in ITV definition in the definition of tumor volume. In addition to using PETMF images, this study also incorporated the MIP technique to integrate images within the same time window of set respiratory phases. The delineation of ITVs using the MIP technique to reconstruct PET images with a threshold of 40% of the SUVmax reduces human error, and the ITV obtained by this method also accurately defines the volume covering the movement of the tumor affected by respiration [4,17].
First, in the phantom experiment, we used the known target size as the gold standard to discuss PET3D, PET4D, PETMF, and target in the PETStatic image at rest. The tumor volume was defined by the threshold of 40% of the SUVmax. The percentage difference in standard. In our study, the tumor volume of PETMF and PETStatic obtained by MF is closest to the gold standard, and the second is PET4D-T50%. Although the respiratory gating technique is used to eliminate the influence of respiratory motion, the reduced signal acquisition time results in a higher SNR (signal-to-noise ratio) that still affects the definition of tumor volume, while the most different is PET3D that is completely affected by respiratory motion.
Our results showed that among the treatment volumes defined by different methods, PTVMF was the smallest (Table 4 and 
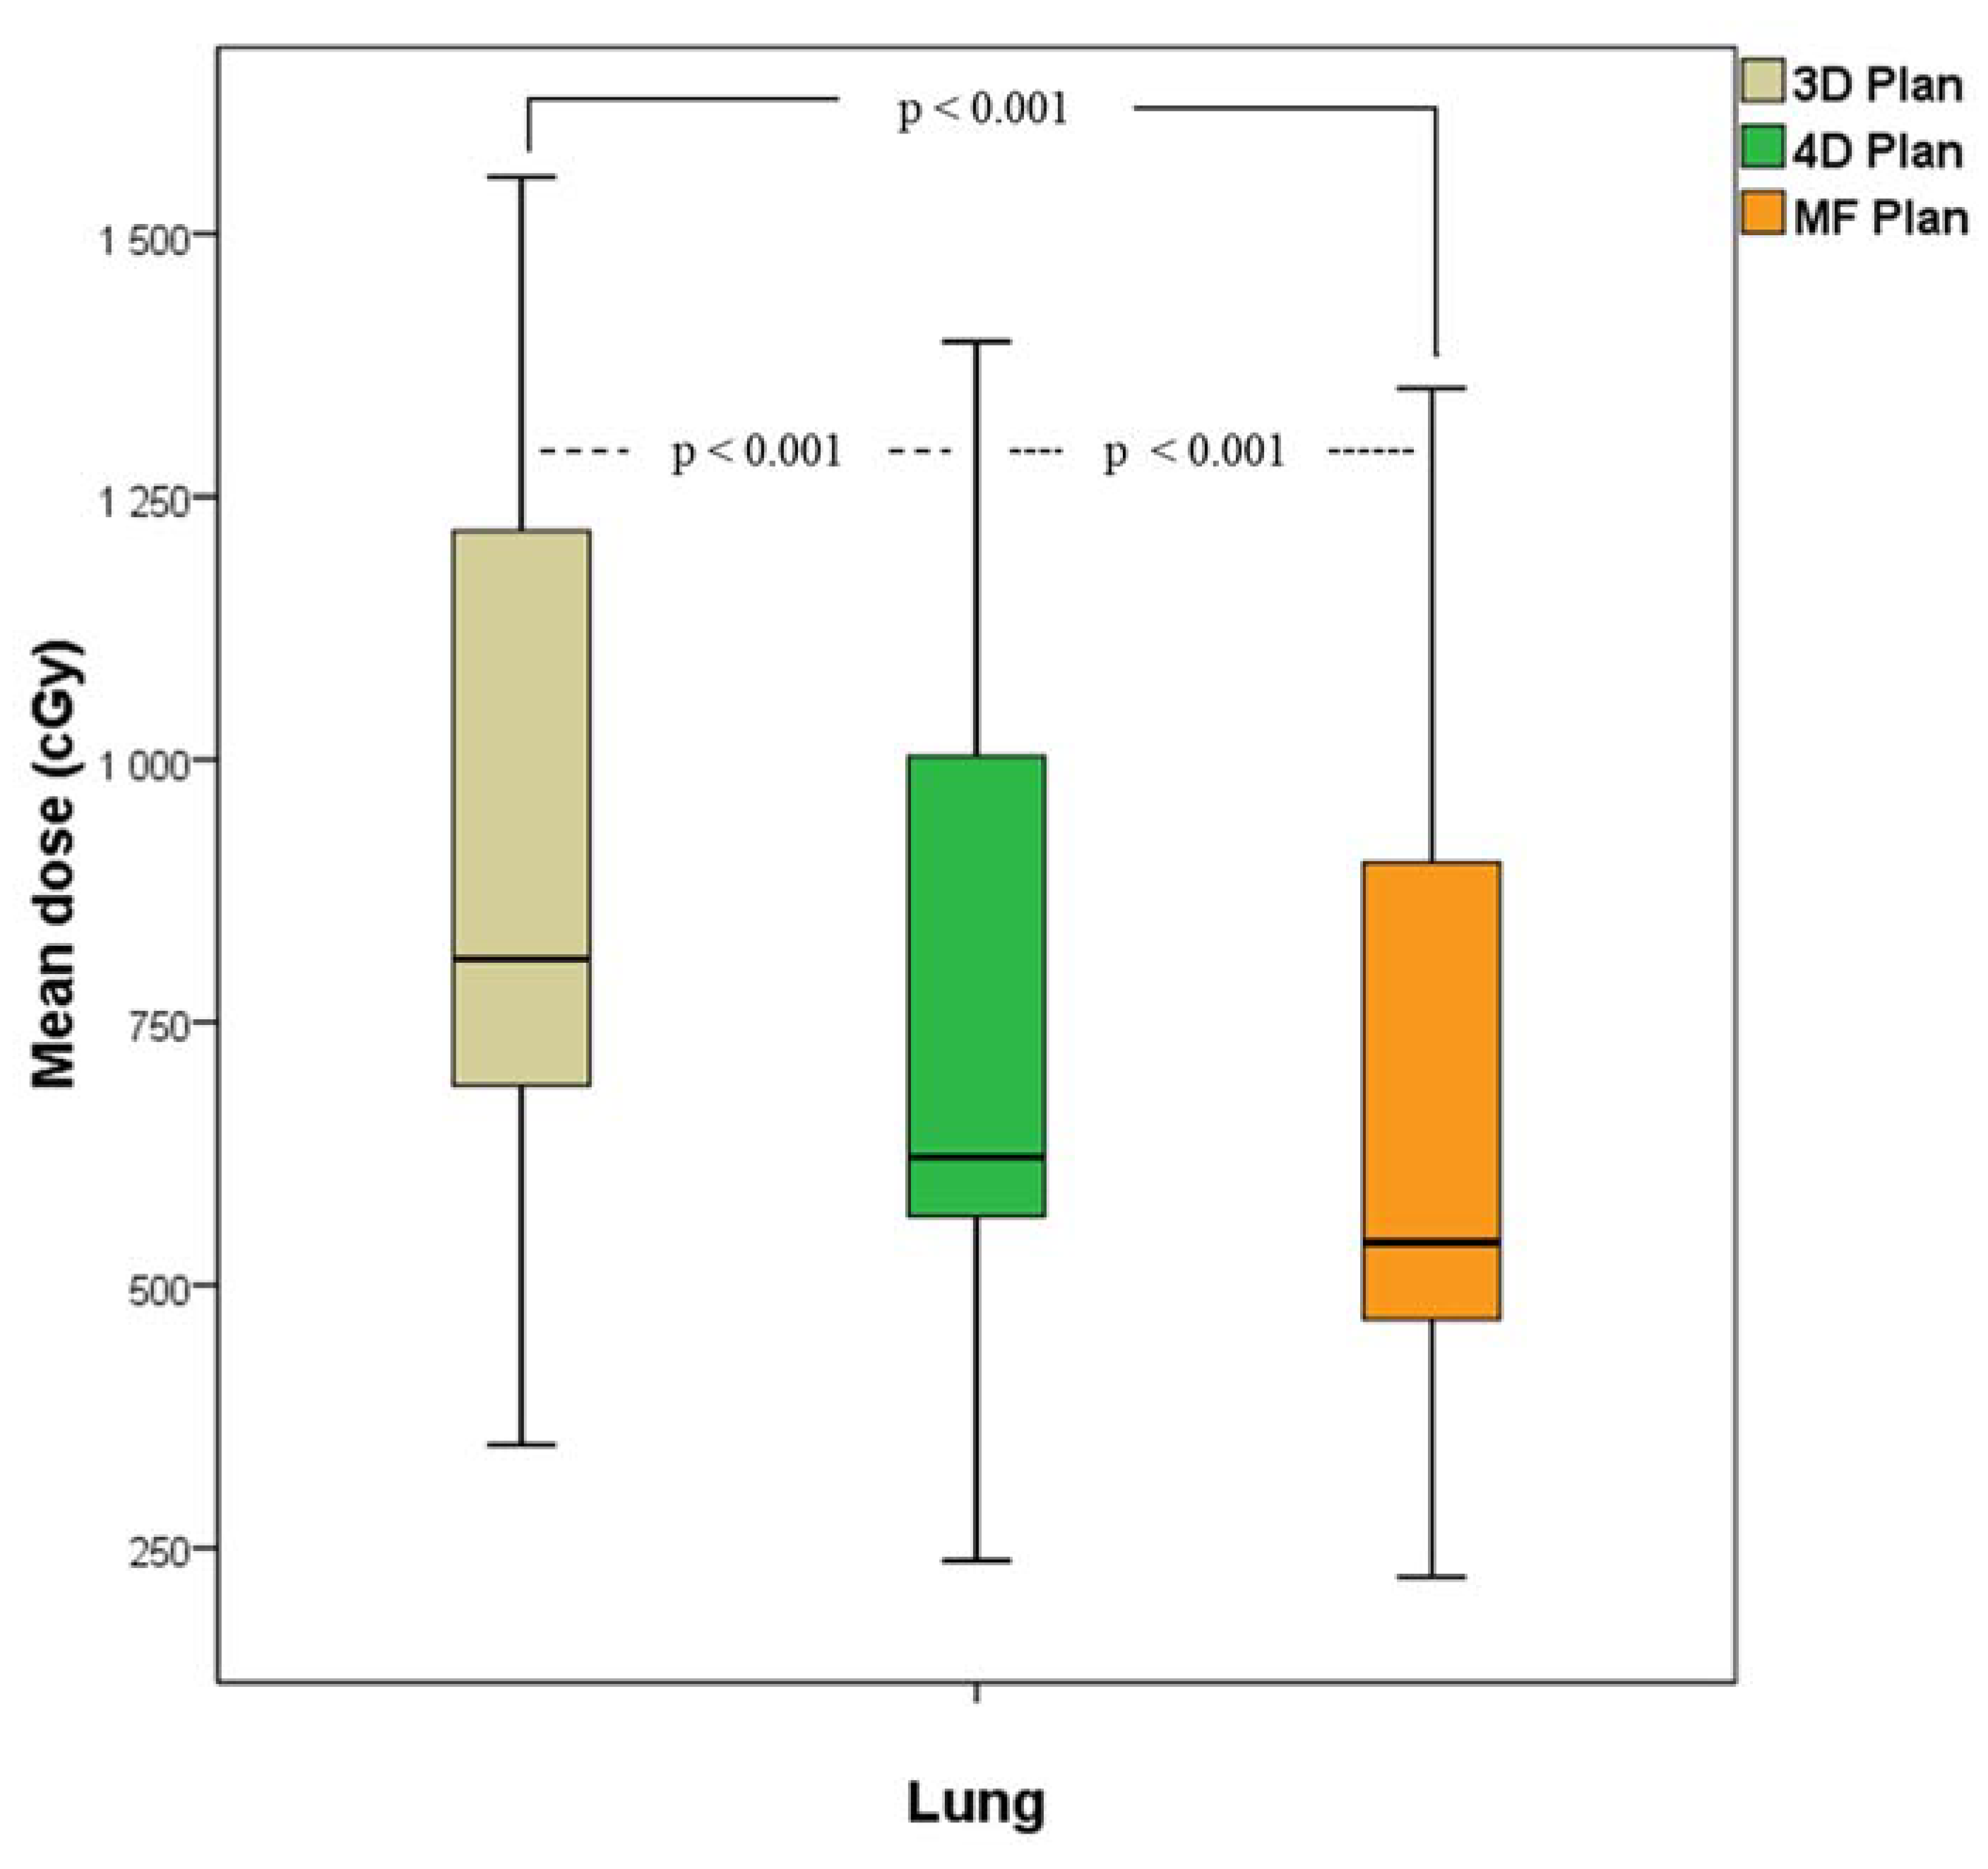
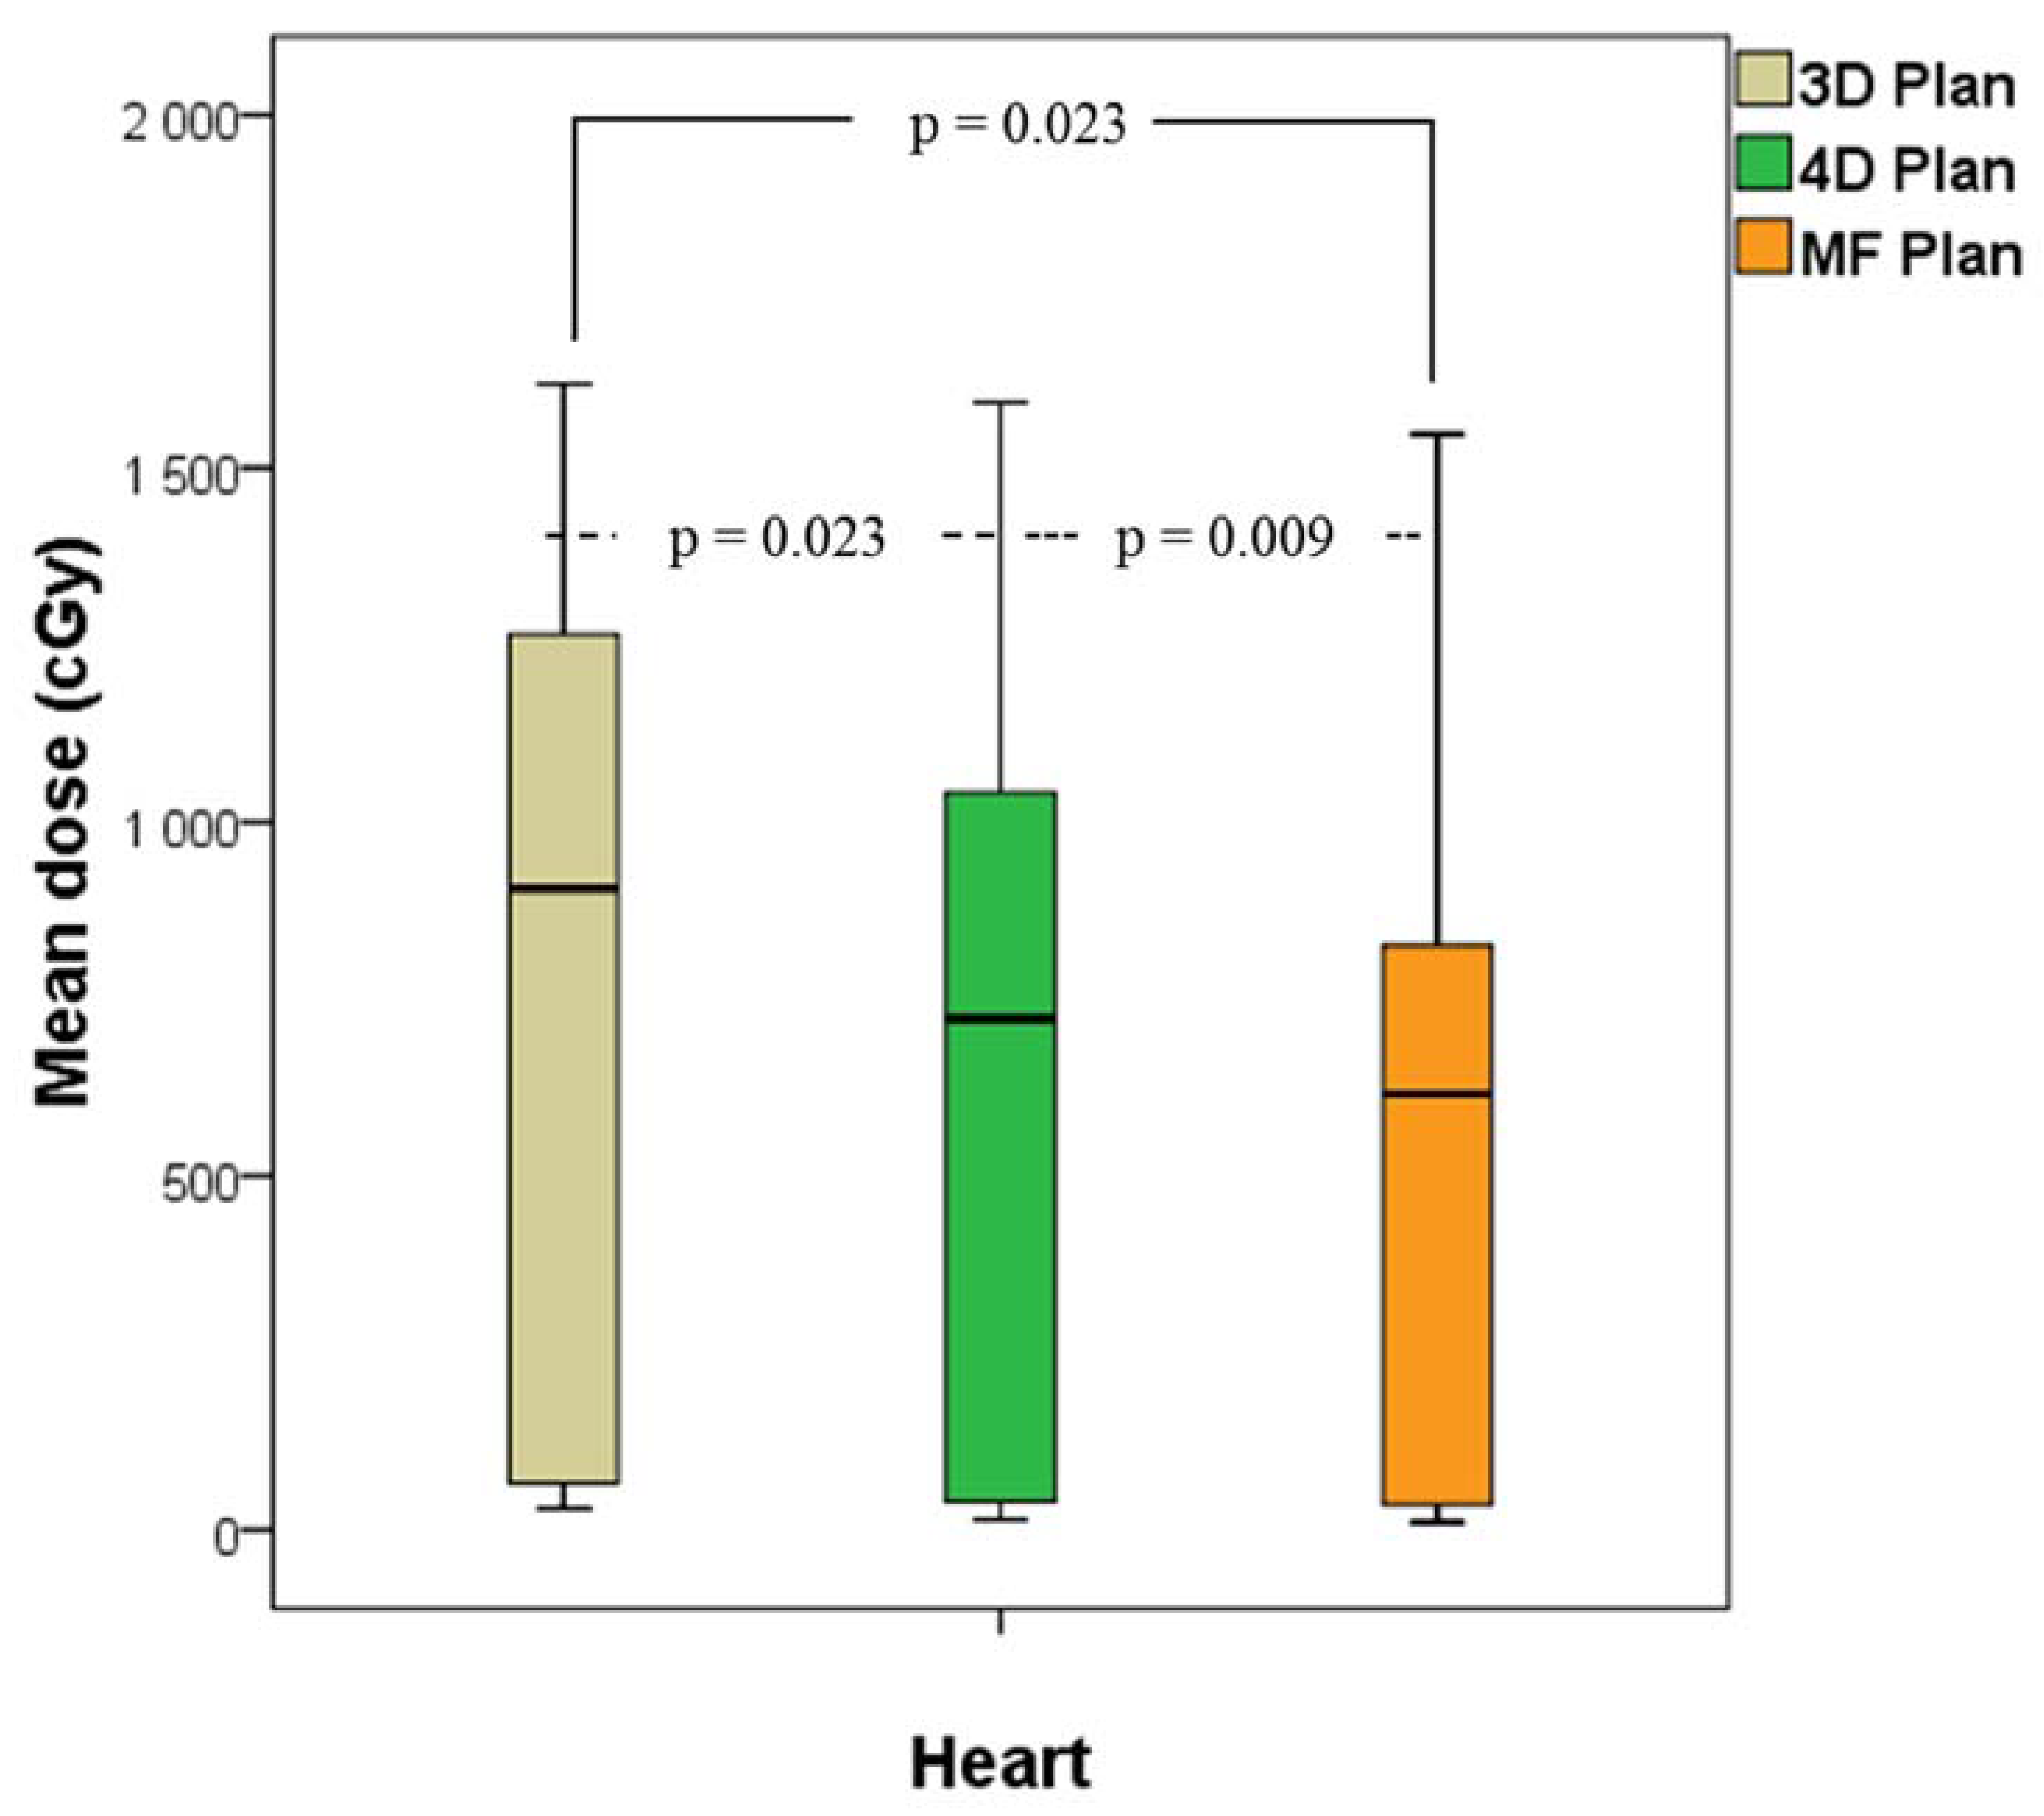
Table 5). Reduction of PTVs by the MF technique indicated a better treatment outcome, as the radiation dose received by OARs was reduced while still maintaining the same therapeutic quality (Table 6 and Table 7). The MF Plan resulted in significant reduction of the dose received by the lung (V5, V10, V20, and mean dose), the heart (mean dose), and the spinal cord (maximum dose). As shown in Figure 8, the results demonstrated that the percentage difference in the PTV was correlated with the percentage difference in the V20, indicating that respiratory-gated PET image reconstruction using the MF technique reduced the radiation dose of OARs and improved the outcome of treatment planning. The results of this study show that using respiratory-gated radiotherapy with a delineation method reduced the ITV to decrease the radiation dose received by normal tissues in the lung were in agreement with the findings of Hau et al. [3]. This indicates that the application of PETMF for the definition of tumor volume can improve the accuracy of tumor definition for treatment planning during respiratory-gated radiotherapy, as it lowers the damage to OARs. Although there is a significant improvement in the mean dose of OARs, the lung (V5, V10, V20, and mean dose), the heart (mean dose), and the spinal cord (maximum dose) in the radiotherapy program. However, in our study, the standard deviation is also quite large. The reason is that in the lung cancer tumor radiotherapy program, the therapeutic dose distribution is complicated because of the complex location of the physiological anatomical structure of the treatment area in the thoracic cavity and various organs. Although the situation can be improved by the definition of tumor volume, it may also cause differences in the dose distribution of radiation therapy because of the size of the lesion, its location, and the relative positional relationship with the surrounding organs. The patients collected in the study had inconsistent lung tumor locations and a certain degree of tumor volume between different patients. These reasons all led to a large standard deviation in the study results.
We present herein the benefits of using the MF approach, which may improve the outcome of lung cancer treatment; however, there were still some limitations of the study. Although the use of a threshold of 40% of the SUVmax to delineate the target volume can directly define the metabolic tumor volume from data provided by PET images, which may avoid human error, this may still not be perfect in some cases, as skilled clinicians might define a better tumor volume for treatment based on their experience. The aim of this study was to investigate the effects of using the MF technique in respiratory-gated radiotherapy. The goal was to find an objective method, such as one that relies on PETMF images, to define the tumor volume without the need for manual or semi-manual delineation. In addition, because this study is a retrospective study, it is not possible to compare images of different reconstruction methods with other images reconstructed through the change of the respiratory gating parameter during 4D-PET angiography, in the definition of tumor volume in the treatment plan, and the effect of treatment dose distribution and OARs dose acceptance. Our results indicated that the MF technique was of clinical value for this application, although further study is still required in order to render it an ideal tool.
In this study, we compared the radiation doses received by the tumor target and OARs, and found that the MF technique maintained treatment quality but reduced the radiation received by OARs using image data from patients. However, no practical application of treatment plans for patients has been performed as yet. Whether or not the application of this technique will affect the prognosis of patients or cause any side effects still needs to be studied, and long-term follow up is necessary to validate the value of this technique.
Finally, we selected images from end-expiration phases (T45%, T55%, and T65%) to reconstruct PETMF images, when the target is at the window in which the tumor movement is the least for the longest duration. This helps to deliver radiation to target areas more precisely. However, in the real case of tumor treatment, the respiratory waveform is not always uniform, as seen a priori, and the respiratory waveform does not always exactly correspond with the tumor motion. These factors all may affect the delivery of radiation to the target and the surrounding tissues. Therefore, for clinical application of the MF-Plan, validation in different settings in phantoms is needed, or clinical trials are required to confirm that this technique can target lesions and benefit patients.

5. Conclusions

In this study, the MF technique was used to reconstruct 4D PET/CT images of patients to obtain PETMF images. We then employed the PETMF in the treatment plan for respiratory-gated radiotherapy, and compared the outcomes with those of traditional 3D radiotherapy planning and respiratory-gated 4D planning. Our results showed that the MF-Plan using PETMF images to define PTVs had smaller tumor volumes than the 3D-Plan and 4D-Plan; that PTVMF was 40.6% and 5.6% lower than PTV3D and PTV4D (median values), respectively. Our study demonstrated that the MF technique can not only reduce PTVs, it can also reduce the dose received by OARs, such as the lung, heart, and spinal cord. However, in real cases, the conditions of respiratory motion are capable variations that suggest further research with phantom on the accuracy of radiation dose delivery and ITV volume coverage.

Author Contributions

Conceptualization, S.-N.Y. and W.-C.C.; Methodology, K.-T.C. and T.-C.H.; Software, G.Z. and T.-C.H.; Validation, S.-N.Y. and K.-T.C.; Formal Analysis, K.-T.C.; Investigation, S.-N.Y.; Resources, S.-N.Y.; Data Curation, K.-T.C.; Writing-Original Draft Preparation, T.-C.H.; Writing-Review & Editing, S.-N.Y., G.Z. and T.-C.H.; Visualization, S.-N.Y.; Supervision, T.-C.H.; Project Administration, T.-C.H.; Funding Acquisition, T.-C.H.

Funding

This study was financially supported by China Medical University Hospital, Taiwan (DMR107-058) and Chang Bing Show Chwan Memorial Hospital, Changhua, Taiwan (RD107013). The funders had no role in study design, data collection and analysis, decision to publish, or preparation of the manuscript.

Conflicts of Interest

The authors declare no conflict of interest.

References

  1. Keall, P.J.; Mageras, G.S.; Balter, J.M.; Emery, R.S.; Forster, K.M.; Jiang, S.B.; Kapatoeset, J.M.; Low, D.A.; Murphy, M.J.; Murray, B.B.; et al. The management of respiratory motion in radiation oncology report of AAPM Task Group 76. Med. Phys. 2006, 33, 3874–3900. [Google Scholar] [CrossRef] [PubMed]
  2. Wolthaus, J.W.; Sonke, J.-J.; Van Herk, M.; Belderbos, J.S.; Rossi, M.M.; Lebesque, J.V.; Damen, E.M.F. Comparison of different strategies to use four-dimensional computed tomography in treatment planning for lung cancer patients. Int. J. Radiat. Oncol. Biol. Phys. 2008, 70, 1229–1238. [Google Scholar] [CrossRef] [PubMed]
  3. Hau, E.; Rains, M.; Browne, L.; Muirhead, R.; Yeghiaian-Alvandi, R. Minimal benefit of respiratory-gated radiation therapy in the management of thoracic malignancy. J. Med. Imaging Oncol. 2013, 57, 704–712. [Google Scholar] [CrossRef] [PubMed]
  4. Lamb, J.M.; Robinson, C.; Bradley, J.; Laforest, R.; Dehdashti, F.; White, B.M.; Wuenschel, S.; Low, D.A. Generating lung tumor internal target volumes from 4D-PET maximum intensity projections. Med. Phys. 2011, 38, 5732–5737. [Google Scholar] [CrossRef] [PubMed] [Green Version]
  5. Park, S.-J.; Ionascu, D.; Killoran, J.; Mamede, M.; Gerbaudo, V.H.; Chin, L.; Berbeco, R. Evaluation of the combined effects of target size, respiratory motion and background activity on 3D and 4D PET/CT images. Phys. Med. Biol. 2008, 53, 3661. [Google Scholar] [CrossRef] [PubMed]
  6. Guerra, L.; Meregalli, S.; Zorz, A.; Niespolo, R.; De Ponti, E.; Elisei, F.; Morzenti, S.; Brenna, S.; Crespi, A.; Gardani, G.; et al. Comparative evaluation of CT-based and respiratory-gated PET/CT-based planning target volume (PTV) in the definition of radiation treatment planning in lung cancer: Preliminary results. Eur. J. Nucl. Med. Mol. Imaging 2014, 41, 702–710. [Google Scholar] [CrossRef] [PubMed]
  7. Aristophanous, M.; Berbeco, R.I.; Killoran, J.H.; Yap, J.T.; Sher, D.J.; Allen, A.M.; Larson, E.; Chen, A.B. Clinical utility of 4D FDG-PET/CT scans in radiation treatment planning. Int. J. Radiat. Oncol. Biol. Phys. 2012, 82, 99–105. [Google Scholar] [CrossRef] [PubMed]
  8. Huang, T.-C.; Chou, K.-T.; Wang, Y.-C.; Zhang, G. Motion freeze for respiration motion correction in PET/CT: A preliminary investigation with lung cancer patient data. BioMed Res. Int. 2014, 2014, 167491. [Google Scholar] [CrossRef] [PubMed]
  9. Horn, B.K.; Schunck, B.G. Determining optical flow. Artif. Intell. 1981, 17, 185–203. [Google Scholar] [CrossRef] [Green Version]
  10. Vedam, S.; Keall, P.; Kini, V.; Mohan, R. Determining parameters for respiration-gated radiotherapy. Med. Phys. 2001, 28, 2139–2146. [Google Scholar] [CrossRef] [PubMed]
  11. Huchet, A.; Caudry, M.; Belkacemi, Y.; Trouette, R.; Vendrely, V.; Causse, N.; Récaldini, L.; Atlan, D.; Maire, J.P. [Volume-effect and radiotherapy [II]. Part II: Volume-effect and normal tissue]. Cancer Radiother. 2003, 7, 353–362. [Google Scholar] [CrossRef]
  12. Shaw, E.; Scott, C.; Souhami, L.; Dinapoli, R.; Kline, R.; Loeffler, J.; Farnan, N. Single dose radiosurgical treatment of recurrent previously irradiated primary brain tumors and brain metastases: Final report of RTOG protocol 90–05. Int. J. Radiat. Oncol. Biol. Phys. 2000, 47, 291–298. [Google Scholar] [CrossRef]
  13. Rahmim, A.; Tang, J.; Zaidi, H. Four-dimensional (4D) image reconstruction strategies in dynamic PET: Beyond conventional independent frame reconstruction. Med. Phys. 2009, 36, 3654–3670. [Google Scholar] [CrossRef] [PubMed]
  14. Wijsman, R.; Grootjans, W.; Troost, E.G.; Van Der Heijden, E.H.; Visser, E.P.; De Geus-Oei, L.-F.; Johana, B. Evaluating the use of optimally respiratory gated 18F-FDG-PET in target volume delineation and its influence on radiation doses to the organs at risk in non-small-cell lung cancer patients. Nucl. Med. Commun. 2016, 37, 66–73. [Google Scholar] [CrossRef] [PubMed]
  15. Bradley, J.; Bae, K.; Choi, N.; Forster, K.; Siegel, B.A.; Brunetti, J.; Purdy, J.; Faria, S.; Vu, T.; Thorstad, W. A phase II comparative study of gross tumor volume definition with or without PET/CT fusion in dosimetric planning for non-small-cell lung cancer (NSCLC): Primary analysis of Radiation Therapy Oncology Group (RTOG) 0515. Int. J. Radiat. Oncol. Biol. Phys. 2012, 82, 435–441. [Google Scholar] [CrossRef] [PubMed]
  16. Van Elmpt, W.; Hamill, J.; Jones, J.; De Ruysscher, D.; Lambin, P.; Öllers, M. Optimal gating compared to 3D and 4D PET reconstruction for characterization of lung tumours. Eur. J. Nucl. Med. Mol. Imaging 2011, 38, 843–855. [Google Scholar] [CrossRef] [PubMed] [Green Version]
  17. Callahan, J.; Kron, T.; Schneider-Kolsky, M.; Dunn, L.; Thompson, M.; Siva, S.; Aarons, Y.; Binns, D.; Hicks, R.J. Validation of a 4D-PET maximum intensity projection for delineation of an internal target volume. Int. J. Radiat. Oncol. Biol. Phys. 2013, 86, 749–754. [Google Scholar] [CrossRef] [PubMed]
Figure 1. The coronal views of the positron emission tomography (PET) images from (a) 3D, (b) 4D (T55%), (c) Motion Freeze technology (T55%-based) for patient number 10, and (d) vertical image profiles drawn across the standardized uptake value (SUV)max voxel of the lesion on Motion Freeze (MF)-PET image and the profiles of 3D-PET and 4D-PET were both drawn on the same location. The solid line indicated the area over the threshold of 40% SUVmax.
Applsci 08 01583 g001
Figure 2. Planning target volumes (PTVs) delineated on computed tomography (CT) images in different treatment plans for respiratory-gated radiation therapy. (a) Transverse, (b) coronal, and (c) sagittal sections of the chest. The purple line represents the PTV3D of the 3D Plan; the green line represents the PTV4D of the 4D Plan; and the orange line represents the PTVMF of the MF-Plan.
Applsci 08 01583 g002
Figure 3. Radiation dose distribution of (ac) transverse, (df) coronal, and (gi) sagittal sections of the chest computed tomography (CT) image. The dose distributions shown here are for the 3D Plan (a,d,g), 4D Plan (b,e,h), and MF Plan (c,f,i).
Applsci 08 01583 g003
Figure 4. Box plot of the relative volume of the lung receiving a dose above 5 (V5), 10 (V10), and 20 (V20) Gy for the three treatment plans.
Applsci 08 01583 g004
Figure 5. Box plot of the mean radiation dose received by the lung in the three treatment plans.
Applsci 08 01583 g005
Figure 6. Box plot of the mean radiation dose received by the heart for the three treatment plans.
Applsci 08 01583 g006
Figure 7. Box plot of the maximum radiation dose received by the spinal cord under the three treatment plans.
Applsci 08 01583 g007
Figure 8. (a) Correlation between the percentage difference in the PTV and the percentage difference in the V20 (the relative volume of the lung receiving a dose above 20 Gy); (b) correlation between the percentage difference in the PTV and the percentage difference in the mean dose of the lung. The red lines indicate the 3D-Plan vs. 4D Plan; the blue lines indicate the 3D-Plan vs. MF-Plan; and the yellow lines indicate the 4D-Plan vs. MF plan.
Applsci 08 01583 g008
Table 1. Clinical features of patients with non-small cell lung cancer (NSCLC).
Patient NumberSexAge (years)HistologyLocation
1M64NSCLCRLL
2M59NSCLCLLL
3M63NSCLCRLL
4F57NSCLCLUL
5M61NSCLCRLL
6M64NSCLCLLL
7F53NSCLCLUL
8M77NSCLCLUL
9F69NSCLCRUL
10F53NSCLCRLL
11F79NSCLCRUL
12M72NSCLCLUL
13F68NSCLCRML
Abbreviations-M: male; F: female; LUL: left upper lobe; LLL: left lower lobe; RUL: right upper lobe; RML: right middle lobe; RLL: right lower lobe.
Table 2. Target volumes delineated by different positron emission tomography (PET) images taken from the CIRS dynamic thorax phantom under various waveforms. The percentage of difference was calculated from volume contour and gold standard volume (8 cm3). MF-Motion Freeze.
WaveformPETMFPET4D-T50%PET3DPETStatic
Cos6
(% of difference)
8.098.299.178.12
1%3%13%1%
Sin
Percentage Difference (P.D.)
8.348.519.028.19
4%6%11%2%
Sharkfin
P.D.
8.198.349.398.04
2%4%15%0%
Table 3. Standardized uptake value (SUV)max value in different PETMIP images. MIP-maximum intensity projection.
Patient Number3D-PETMIP4D-PETMIPMF-PETMIP
15.916.656.65
224.0322.3922.42
315.7617.9117.91
420.5721.5821.58
514.1613.2513.25
610.879.869.86
70.541.361.36
810.059.419.45
92.942.812.81
104.205.105.10
111.111.061.06
127.869.739.73
139.737.817.81
Table 4. Planning target volumes (PTVs) delineated in different treatment plans.
Patient NumberPTV3D (cm3)PTV4D (cm3)PTVMF (cm3)
154.425.514.1
2548.6417.5394.1
3361.8252.3214.8
4344.2267.4260.3
5732.9509.7499.4
655.224.724
764.830.122.8
860.637.432.1
9100.580.175.6
1076.235.333.5
1159.137.132.9
12129.297.188.1
13113.190.992.1
Table 5. Percentage differences in planning target volumes (PTVs) between treatment plans.
Patient NumberPercentage Difference (%)
PTV3D vs. PTV4DPTV3D vs. PTVMFPTV4D vs. PTVMF
153.174.144.7
223.928.25.6
330.340.614.9
422.324.42.7
530.531.92.0
655.356.52.8
753.564.824.3
838.347.014.2
920.324.85.6
1053.756.05.1
1137.244.311.3
1224.831.89.3
1319.618.61.3
Table 6. Homogeneity index (HI) and conformity index (CI) of individual patients under different treatment plans.
Patient NumberHomogeneity IndexConformity Index
3D-Plan4D-PlanMF-Plan3D-Plan4D-PlanMF-Plan
11.051.061.051.000.991.00
21.051.051.051.001.001.00
31.051.041.051.001.001.00
41.051.051.051.001.000.99
51.071.061.070.990.990.99
61.051.051.041.001.001.00
71.051.051.051.001.001.00
81.051.051.051.000.991.00
91.051.051.051.001.001.00
101.051.051.041.001.001.00
111.041.051.051.001.001.00
121.051.051.040.901.001.00
131.051.051.041.001.001.00
Table 7. Percentage volume that received at least 95% of the prescription dose (V95%) and the maximum target dose (Dmax) of the patients under the different treatment plans for respiratory-gated radiation therapy.
Patient NumberV95% (%)Dmax (%)
3D-Plan4D-PlanMF-Plan3D-Plan4D-PlanMF-Plan
199.899.899.9104.8104.7104.8
299.798.999.9104.9104.7105
399.999.999.9104.9104.4104.8
499.999.999105105104.6
599.499.398.6104.9104.8104.6
699.999.899.9104.8104.9104.4
799.999.999.9104.5104.5104.4
899.899.399.6104.7104.5104.6
999.999.899.8104.4104.4104.1
1099.399.899.9104.4104.3104.1
1199.999.999.8103.6104.9104.9
1299.999.999.8104.6104.7104.5
1399.999.899.9104.6104.5104.4

