Effect of IoT Capabilities and Energy Consumption behavior on Green Supply Chain Integration

 , , and
Abstract
:1. Introduction
2. Background and Related Work
2.1. Resource-Based Theory (RBT)
2.2. Contingency Theory
2.3. Internet of Things
2.4. Energy Consumption Behavior
2.5. Supply Chain Integration
2.6. Customer and Supplier integration to Performance
2.7. Green Training
3. Methodology
3.1. Sample and Data Collection Procedure
3.2. Why Use PLS-SEM? Use of Modern Tools and Software
3.3. Research Instrument
3.4. Common Method Variance
3.5. Measurement Model
3.6. Structural Model
4. Discussion and Conclusions
5. Limitations and Future Directions
Author Contributions
Funding
Conflicts of Interest
References
- Atzori, L.; Iera, A.; Morabito, G. The internet of things: A survey. Comput. Netw. 2010, 54, 2787–2805. [Google Scholar] [CrossRef]
- Edwards, C.; Hopkins, J. The Australian Supply Chain Tech Survey Results; SCLAA: Loganholme, Australia, 2018. [Google Scholar]
- Borgia, E. The Internet of Things vision: Key features, applications and open issues. Comput. Commun. 2014, 54, 1–31. [Google Scholar] [CrossRef]
- Mattern, F.; Floerkemeier, C. From the Internet of Computers to the Internet of Things. In From Active Data Management to Event-Based Systems and More; Springer: Berlin, Germany, 2010; pp. 242–259. [Google Scholar]
- Constantinides, E.; Kahlert, M.; de Vries, S.A. The Relevance of Technological Autonomy in the Acceptance of IoT Services in Retail. In Proceedings of the 2nd International Conference on Internet of Things, Data and Cloud Computing, (ICC) 2017, Cambridge, UK, 22–23 March 2017. [Google Scholar]
- Vanpoucke, E.; Vereecke, A.; Muylle, S. Leveraging the impact of supply chain integration through information technology. Int. J. Oper. Prod. Manag. 2017, 37, 510–530. [Google Scholar] [CrossRef] [Green Version]
- Kahlert, M.; Constantinides, E.; de Vries, S. The relevance of technological autonomy in the customer acceptance of IoT services in retail. In Proceedings of the Second International Conference on Internet of things and Cloud Computing, Cambridge, UK, 22–23 March 2017; ACM: New York, NY, USA, 2017; p. 12. [Google Scholar]
- Li, G.; Yang, H.; Sun, L.; Sohal, A.S. The impact of IT implementation on supply chain integration and performance. Int. J. Prod. Econ. 2009, 120, 125–138. [Google Scholar] [CrossRef]
- Qrunfleh, S.; Tarafdar, M. Supply chain information systems strategy: Impacts on supply chain performance and firm performance. Int. J. Prod. Econ. 2014, 147, 340–350. [Google Scholar] [CrossRef]
- Rai, A.; Patnayakuni, R.; Seth, N. Firm performance impacts of digitally enabled supply chain integration capabilities. MIS Q. 2006, 30, 225–246. [Google Scholar] [CrossRef]
- De Vass, T.; Shee, H. The effect of “Internet of Things” on supply chain integration and performance: An organisational capability perspective. Australas. J. Inf. Syst. 2018, 22, 833–852. [Google Scholar] [CrossRef]
- Barney, J. Firm resources and sustained competitive advantage. J. Manag. 1991, 17, 99–120. [Google Scholar] [CrossRef]
- Barney, J. How marketing scholars might help address issues in resource-based theory. J. Acad. Mark. Sci. 2014, 42, 24–26. [Google Scholar] [CrossRef]
- Fahy, J.; Smithee, A. Strategic marketing and the resource based view of the firm. Acad. Mark. Sci. Rev. 1999, 10, 1–21. [Google Scholar]
- Wernerfelt, B. A resource-based view of the firm. Strat. Manag. J. 1984, 5, 171–180. [Google Scholar] [CrossRef]
- Kozlenkova, I.V.; Samaha, S.A.; Palmatier, R.W. Resource-based theory in marketing. J. Acad. Mark. Sci. 2014, 42, 1–21. [Google Scholar] [CrossRef]
- Lawrence, P.R.; Lorsch, J.W. The integrator. Harv. Bus. Rev. 1967, 1–13. [Google Scholar]
- Thompson, J. Organizations in Action: Social Science Bases of Administrative Theory; McGraw-Hill: New York, NY, USA, 2003. [Google Scholar]
- Sinha, K.K.; Van de Ven, A.H. Designing work within and between organizations. Organ. Sci. 2005, 16, 389–408. [Google Scholar] [CrossRef]
- Donaldson, L. The Contingency Theory of Organizations; Sage: Thousand Oaks, CA, USA, 2001. [Google Scholar]
- Lawrence, P.R.; Lorsch, J.W. Differentiation and integration in complex organizations. Adm. Sci. Q. 1967, 12, 1–47. [Google Scholar] [CrossRef]
- Chandler, A.D. Strategy and structure: Chapters in the history of the American enterprise. Mass. Inst. Technol. Camb. 1962, 4, 125–137. [Google Scholar]
- Galbraith, J.R. Organization design: An information processing view. Interfaces 1974, 4, 28–36. [Google Scholar] [CrossRef]
- Drazin, R.; Van de Ven, A.H. Alternative forms of fit in contingency theory. Adm. Sci. Q. 1985, 30, 514–539. [Google Scholar] [CrossRef]
- Venkatraman, N.; Prescott, J.E. Environment-strategy coalignment: An empirical test of its performance implications. Strat. Manag. J. 1990, 11, 1–23. [Google Scholar] [CrossRef] [Green Version]
- Milgrom, P.; Roberts, J. Complementarities and fit strategy, structure, and organizational change in manufacturing. J. Account. Econ. 1995, 19, 179–208. [Google Scholar] [CrossRef]
- Madakam, S.; Ramaswamy, R.; Tripathi, S. Internet of Things (IoT): A literature review. J. Comput. Commun. 2015, 3, 164–173. [Google Scholar] [CrossRef]
- Nunberg, G. The Advent of the Internet. Available online: http://courses.ischool.berkeley.edu/i103/s12/SLIDES/HOFIInternet1Apr12.pdf (accessed on 23 July 2012).
- Yan, B.; Huang, G. Supply chain information transmission based on RFID and internet of things. In Proceedings of the ISECS International Colloquium on Computing, Communication, Control, and Management, Sanya, China, 8–9 August 2009; pp. 166–169. [Google Scholar]
- Pang, Z.; Chen, Q.; Han, W.; Zheng, L. Value-centric design of the internet-of-things solution for food supply chain: Value creation, sensor portfolio and information fusion. Inf. Syst. Front. 2015, 17, 289–319. [Google Scholar] [CrossRef]
- Bahari, T.F.; Elayidom, M.S. An efficient CRM-data mining framework for the prediction of customer behaviour. Procedia Comput. Sci. 2015, 46, 725–731. [Google Scholar] [CrossRef]
- DeWaters, J.; Qaqish, B.; Graham, M.; Powers, S. Designing an energy literacy questionnaire for middle and high school youth. J. Environ. Educ. 2013, 44, 56–78. [Google Scholar] [CrossRef]
- Demirel, Y. Energy and energy types. In Energy; Springer: Berlin, Germany, 2012; pp. 27–70. [Google Scholar]
- Awan, A.B.; Khan, Z.A. Recent progress in renewable energy—Remedy of energy crisis in Pakistan. Renew. Sustain. Energy Rev. 2014, 33, 236–253. [Google Scholar] [CrossRef]
- Abbas, M.N. Energy Crisis in Pakistan; Naval Postgraduate School Monterey United States: Monterey, CA, USA, 2015. [Google Scholar]
- Paulraj, A.; Lado, A.A.; Chen, I.J. Inter-organizational communication as a relational competency: Antecedents and performance outcomes in collaborative buyer–supplier relationships. J. Oper. Manag. 2008, 26, 45–64. [Google Scholar] [CrossRef]
- Mabert, V.A.; Venkataramanan, M. Special research focus on supply chain linkages: Challenges for design and management in the 21st century. Decis. Sci. 1998, 29, 537–552. [Google Scholar] [CrossRef]
- Spekman, R.E.; Kamauff, J.W., Jr.; Myhr, N. An empirical investigation into supply chain management: A perspective on partnerships. Supply Chain Manag. Int. J. 1998, 3, 53–67. [Google Scholar] [CrossRef]
- Fawcett, S.E.; Magnan, G.M. The rhetoric and reality of supply chain integration. Int. J. Phys. Distrib. Logist. Manag. 2002, 32, 339–361. [Google Scholar] [CrossRef]
- Lee, H.L.; Whang, S. Winning the last mile of e-commerce. MIT Sloan Manag. Rev. 2001, 42, 54–62. [Google Scholar]
- Flynn, B.B.; Huo, B.; Zhao, X. The impact of supply chain integration on performance: A contingency and configuration approach. J. Oper. Manag. 2010, 28, 58–71. [Google Scholar] [CrossRef]
- Vickery, S.K.; Jayaram, J.; Droge, C.; Calantone, R. The effects of an integrative supply chain strategy on customer service and financial performance: An analysis of direct versus indirect relationships. J. Oper. Manag. 2003, 21, 523–539. [Google Scholar] [CrossRef]
- Naylor, J.B.; Naim, M.M.; Berry, D. Leagility: Integrating the lean and agile manufacturing paradigms in the total supply chain. Int. J. Prod. Econ. 1999, 62, 107–118. [Google Scholar] [CrossRef] [Green Version]
- Bowersox, D.J.; Morash, E.A. The integration of marketing flows in channels of distribution. Eur. J. Mark. 1989, 23, 58–67. [Google Scholar] [CrossRef]
- Hammer, M. Reengineering work: Don’t automate, obliterate. Harv. Bus. Rev. 1990, 68, 104–112. [Google Scholar]
- Stevens, G.C. Integrating the supply chain. Int. J. Phys. Distrib. Mater. Manag. 1989, 19, 3–8. [Google Scholar] [CrossRef]
- Benton, W. Webster’s Third New International Dictionary of the English Language; Unabridged; Encyclopaedia Britannica Inc.: Chicago, IL, USA, 1966. [Google Scholar]
- Bowersox, D.J.; Closs, D.J.; Stank, T.P. 21st Century Logistics: Making Supply Chain Integration a Reality; Michigan State University: East Lansing, MI, USA, 1999; ISBN 0965865320. [Google Scholar]
- Frohlich, M.T.; Westbrook, R. Arcs of integration: An international study of supply chain strategies. J. Oper. Manag. 2001, 19, 185–200. [Google Scholar] [CrossRef]
- Sanders, N.R. Pattern of information technology use: The impact on buyer–suppler coordination and performance. J. Oper. Manag. 2008, 26, 349–367. [Google Scholar] [CrossRef]
- Ellram, L.M. The supplier selection decision in strategic partnerships. J. Purch. Mater. Manag. 1990, 26, 8–14. [Google Scholar] [CrossRef]
- Heide, J.B.; John, G. Alliances in industrial purchasing: The determinants of joint action in buyer-supplier relationships. J. Mark. Res. 1990, 27, 24–36. [Google Scholar] [CrossRef]
- Poirier, C.C.; Reiter, S.E. Supply Chain Optimization: Building the Strongest Total Business Network; Berrett-Koehler Publishers: Oakland, CA, USA, 1996. [Google Scholar]
- Stank, T.P.; Keller, S.B.; Daugherty, P.J. Supply chain collaboration and logistical service performance. J. Bus. Logist. 2001, 22, 29–48. [Google Scholar] [CrossRef]
- Saberi, S.; Kouhizadeh MSarkis, J.; Shen, L. Blockchain technology and its relationships to sustainable supply chain management. Int. J. Prod. Res. 2018, 1–19. [Google Scholar] [CrossRef]
- Ben-Daya, M.; Hassini, E.; Bahroun, Z. Internet of things and supply chain management: A literature review. Int. J. Prod. Res. 2017, 1–24. [Google Scholar] [CrossRef]
- Kingman-Brundage, J.; George, W.R.; Bowen, D.E. “Service logic”: Achieving service system integration. Int. J. Serv. Ind. Manag. 1995, 6, 20–39. [Google Scholar] [CrossRef]
- Accorsi, R.; Bortolini, M.; Baruffaldi, G.; Pilati, F.; Ferrari, E. Internet-of-things paradigm in food supply chains control and management. Procedia Manuf. 2017, 11, 889–895. [Google Scholar] [CrossRef]
- Kotha, S.; Nair, A. Strategy and environment as determinants of performance: Evidence from the Japanese machine tool industry. Strateg. Manag. J. 1995, 16, 497–518. [Google Scholar] [CrossRef]
- Tushman, M.L.; Nadler, D.A. Information processing as an integrating concept in organizational design. Acad. Manag. Rev. 1978, 3, 613–624. [Google Scholar]
- Koufteros, X.; Vonderembse, M.; Jayaram, J. Internal and external integration for product development: The contingency effects of uncertainty, equivocality, and platform strategy. Decis. Sci. 2005, 36, 97–133. [Google Scholar] [CrossRef]
- Song, M.; Di Benedetto, C.A. Supplier’s involvement and success of radical new product development in new ventures. J. Oper. Manag. 2008, 26, 1–22. [Google Scholar] [CrossRef]
- Homburg, C.; Stock, R.M. The link between salespeople’s job satisfaction and customer satisfaction in a business-to-business context: A dyadic analysis. J. Acad. Mark. Sci. 2004, 32, 144. [Google Scholar] [CrossRef]
- Petersen, K.J.; Handfield, R.B.; Ragatz, G.L. Supplier integration into new product development: Coordinating product, process and supply chain design. J. Oper. Manag. 2005, 23, 371–388. [Google Scholar] [CrossRef]
- Koufteros, X.; Cheng, T.E.; Lai, K.-H. “Black-box” and “gray-box” supplier integration in product development: Antecedents, consequences and the moderating role of firm size. J. Oper. Manag. 2007, 25, 847–870. [Google Scholar] [CrossRef]
- Ragatz, G.L.; Handfield, R.B.; Petersen, K.J. Benefits associated with supplier integration into new product development under conditions of technology uncertainty. J. Bus. Res. 2002, 55, 389–400. [Google Scholar] [CrossRef]
- Cousins, P.D.; Menguc, B. The implications of socialization and integration in supply chain management. J. Oper. Manag. 2006, 24, 604–620. [Google Scholar] [CrossRef]
- Daily, B.F.; Huang, S.-C. Achieving sustainability through attention to human resource factors in environmental management. Int. J. Oper. Prod. Manag. 2001, 21, 1539–1552. [Google Scholar] [CrossRef]
- Teixeira, A.A.; Jabbour, C.J.; de Sousa Jabbour, A.B.; Latan, H.; de Oliveira, J.H.C. Green training and green supply chain management: Evidence from Brazilian firms. J. Clean. Prod. 2016, 116, 170–176. [Google Scholar] [CrossRef]
- Paillé, P.; Chen, Y.; Boiral, O.; Jin, J. The impact of human resource management on environmental performance: An employee-level study. J. Bus. Ethics 2014, 121, 451–466. [Google Scholar] [CrossRef]
- Muduli, K.; Govindan, K.; Barve, A.; Geng, Y. Barriers to green supply chain management in Indian mining industries: A graph theoretic approach. J. Clean. Prod. 2013, 47, 335–344. [Google Scholar] [CrossRef]
- Daily, B.F.; Bishop, J.W.; Massoud, J.A. The role of training and empowerment in environmental performance: A study of the Mexican maquiladora industry. Int. J. Oper. Prod. Manag. 2012, 32, 631–647. [Google Scholar] [CrossRef]
- Sarkis, J.; Gonzalez-Torre, P.; Adenso-Diaz, B. Stakeholder pressure and the adoption of environmental practices: The mediating effect of training. J. Oper. Manag. 2010, 28, 163–176. [Google Scholar] [CrossRef]
- Jackson, S.E.; Schuler, R.S.; Jiang, K. An aspirational framework for strategic human resource management. Acad. Manag. Ann. 2014, 8, 1–56. [Google Scholar] [CrossRef]
- Renwick, D.W.; Redman, T.; Maguire, S. Green human resource management: A review and research agenda. Int. J. Manag. Rev. 2013, 15, 1–14. [Google Scholar] [CrossRef] [Green Version]
- Ringle, C.M.; Wende, S.; Becker, J.-M. SmartPLS 3; SmartPLS GmbH: Boenningstedt, Germany, 2015. [Google Scholar]
- Petter, S.; Straub, D.; Rai, A. Specifying formative constructs in information systems research. MIS Q. 2007, 31, 623–656. [Google Scholar] [CrossRef]
- Hair, J.F.; Ringle, C.M.; Sarstedt, M. PLS-SEM: Indeed a silver bullet. J. Mark. Theory Pract. 2011, 19, 139–152. [Google Scholar] [CrossRef]
- Henseler, J.; Dijkstra, T.K.; Sarstedt, M.; Ringle, C.M.; Diamantopoulos, A.; Straub, D.W.; Ketchen, D.J., Jr.; Hair, J.F.; Hult, G.T.M.; Calantone, R.J. Common beliefs and reality about PLS: Comments on Rönkkö and Evermann (2013). Organ. Res. Methods 2014, 17, 182–209. [Google Scholar] [CrossRef]
- Fornell, C.; Bookstein, F.L. Two structural equation models: LISREL and PLS applied to consumer exit-voice theory. J. Mark. Res. 1982, 19, 440–452. [Google Scholar] [CrossRef]
- Astrachan, C.B.; Patel, V.K.; Wanzenried, G. A comparative study of CB-SEM and PLS-SEM for theory development in family firm research. J. Fam. Bus. Strategy 2014, 5, 116–128. [Google Scholar] [CrossRef]
- Narasimhan, R.; Kim, S.W. Effect of supply chain integration on the relationship between diversification and performance: Evidence from Japanese and Korean firms. J. Oper. Manag. 2002, 20, 303–323. [Google Scholar] [CrossRef]
- Morash, E.A.; Clinton, S.R. Supply chain integration: Customer value through collaborative closeness versus operational excellence. J. Mark. Theory Pract. 1998, 6, 104–120. [Google Scholar] [CrossRef]
- Zhu, Q.; Sarkis, J.; Lai, K.-H. Confirmation of a measurement model for green supply chain management practices implementation. Int. J. Prod. Econ. 2008, 111, 261–273. [Google Scholar] [CrossRef]
- Podsakoff, P.M.; MacKenzie, S.B.; Lee, J.-Y.; Podsakoff, N.P. Common method biases in behavioral research: A critical review of the literature and recommended remedies. J. Appl. Psychol. 2003, 88, 879. [Google Scholar] [CrossRef] [PubMed]
- Bagozzi, R.P.; Yi, Y.; Phillips, L.W. Assessing construct validity in organizational research. Adm. Sci. Q. 1991, 36, 421–458. [Google Scholar] [CrossRef]
- Barclay, D.; Higgins, C.; Thompson, R. The Partial Least Squares (pls) Approach to Casual Modeling: Personal Computer Adoption Ans Use as an Illustration. Technol. Stud. 1995, 2, 285–309. [Google Scholar]
- Chin, W.W. The partial least squares approach to structural equation modeling. Mod. Methods Bus. Res. 1998, 295, 295–336. [Google Scholar]
- Nunnally, J.C. Psychometric Theory; McGraw-Hill: New York, NY, USA, 1994. [Google Scholar]
- Henseler, J.; Ringle, C.M.; Sinkovics, R.R. The use of partial least squares path modeling in international marketing. In New Challenges to International Marketing; Emerald Group Publishing Limited: Bingley, UK, 2009; pp. 277–319. [Google Scholar]
- Kutner, M.H.; Nachtsheim, C.; Neter, J.; Li, W. Applied Linear Statistical Models; McGraw-Hill Irwin: New York, NY, USA, 2005. [Google Scholar]
- Fornell, C.; Larcker, D.F. Evaluating structural equation models with unobservable variables and measurement error. J. Mark. Res. 1981, 18, 39–50. [Google Scholar] [CrossRef]
- Hair, J.F.; Black, W.C.; Babin, B.J.; Anderson, R.E.; Tatham, R.L. Multivariate Data Analysis; Prentice Hall: Upper Saddle River, NJ, USA, 1998; Volume 5. [Google Scholar]
- Chin, W.W.; Marcolin, B.L.; Newsted, P.R. A partial least squares latent variable modeling approach for measuring interaction effects: Results from a Monte Carlo simulation study and an electronic-mail emotion/adoption study. Inf. Syst. Res. 2003, 14, 189–217. [Google Scholar] [CrossRef]
- Chin, W.W. How to write up and report PLS analyses. In Handbook of Partial Least Squares; Springer: Berlin, Germany, 2010; pp. 655–690. [Google Scholar]
- Sanchez, G. PLS Path Modeling with R. 2013. Available online: https://www.gastonsanchez.com/PLS_Path_Modeling_with_R.pdf (accessed on 13 April 2018).
- Wetzels, M.; Odekerken-Schröder, G.; Van Oppen, C. Using PLS path modeling for assessing hierarchical construct models: Guidelines and empirical illustration. MIS Q. 2009, 33, 177–195. [Google Scholar] [CrossRef]
- Accorsi, R.; Cholette, S.; Manzini, R.; Tufano, A. A hierarchical data architecture for sustainable food supply chain management and planning. J. Clean. Prod. 2018, 203, 1039–1054. [Google Scholar] [CrossRef]
- Cohen, J. Statistical Power Analysis for the Behavioral Sciences, 2nd ed.; Routledge: Abingdon, UK, 1988; ISBN 9780805802832. [Google Scholar]
- Huo, B. The impact of supply chain integration on company performance: An organizational capability perspective. Supply Chain Manag. Int. J. 2012, 17, 596–610. [Google Scholar] [CrossRef]
- Fosso Wamba, S.; Angappa, G.; Papadopoulos, T.; Ngai, E. Big data analytics in logistics and supply chain management. Int. J. Logist. Manag. 2018, in press. [Google Scholar] [CrossRef]
- Verdouw, C.N.; Beulens, A.J.; Reijers, H.A.; van der Vorst, J.G. A control model for object virtualization in supply chain management. Comput. Ind. 2015, 68, 116–131. [Google Scholar] [CrossRef] [Green Version]
- Liu, Y.; Wang, H.; Wang, J.; Qian, K.; Kong, N.; Wang, K.; Zheng, L.; Shi, Y.; Engels, D.W. Enterprise-oriented IoT name service for agricultural product supply chain management. Int. J. Distrib. Sens. Netw. 2015, 11, 308165. [Google Scholar] [CrossRef]


| Demographic Factor | Values | Frequency | Percentage |
|---|---|---|---|
| Gender | |||
| Female | 62 | 25.0 | |
| Male | 188 | 75.0 | |
| Education | |||
| Intermediate | 25 | 10.0 | |
| Bachelor | 62 | 24.5 | |
| Masters | 163 | 65.5 | |
| Age in Years | |||
| 18–25 | 19 | 7.6 | |
| 26–35 | 115 | 46.0 | |
| 36–40 | 101 | 40.4 | |
| Above 40 | 15 | 6.5 | |
| Experience in Years | |||
| 1–3 | 24 | 9.6 | |
| 4–6 | 56 | 22.4 | |
| 7–9 | 90 | 36.0 | |
| Above 9 | 80 | 32.0 | |
| Designation | |||
| Lower level Management | 80 | 32.0 | |
| Middle Level Management | 120 | 48.0 | |
| Upper Management | 50 | 20.0 |
| Mean | S.D. | CI | ECB | GSCP | GT | IoT | SI | |
|---|---|---|---|---|---|---|---|---|
| CI | 3.40 | 0.491 | 0.727 | |||||
| ECB | 3.41 | 0.510 | 0.89 | 0.76 | ||||
| GSCP | 3.50 | 0.501 | 0.736 | 0.737 | 0.688 | |||
| GT | 3.38 | 0.498 | 0.78 | 0.776 | 0.753 | 0.75 | ||
| IoT | 3.36 | 0.540 | 0.78 | 0.775 | 0.87 | 0.774 | 0.691 | |
| SI | 3.40 | 0.489 | 0.781 | 0.784 | 0.77 | 0.988 | 0.788 | 0.737 |
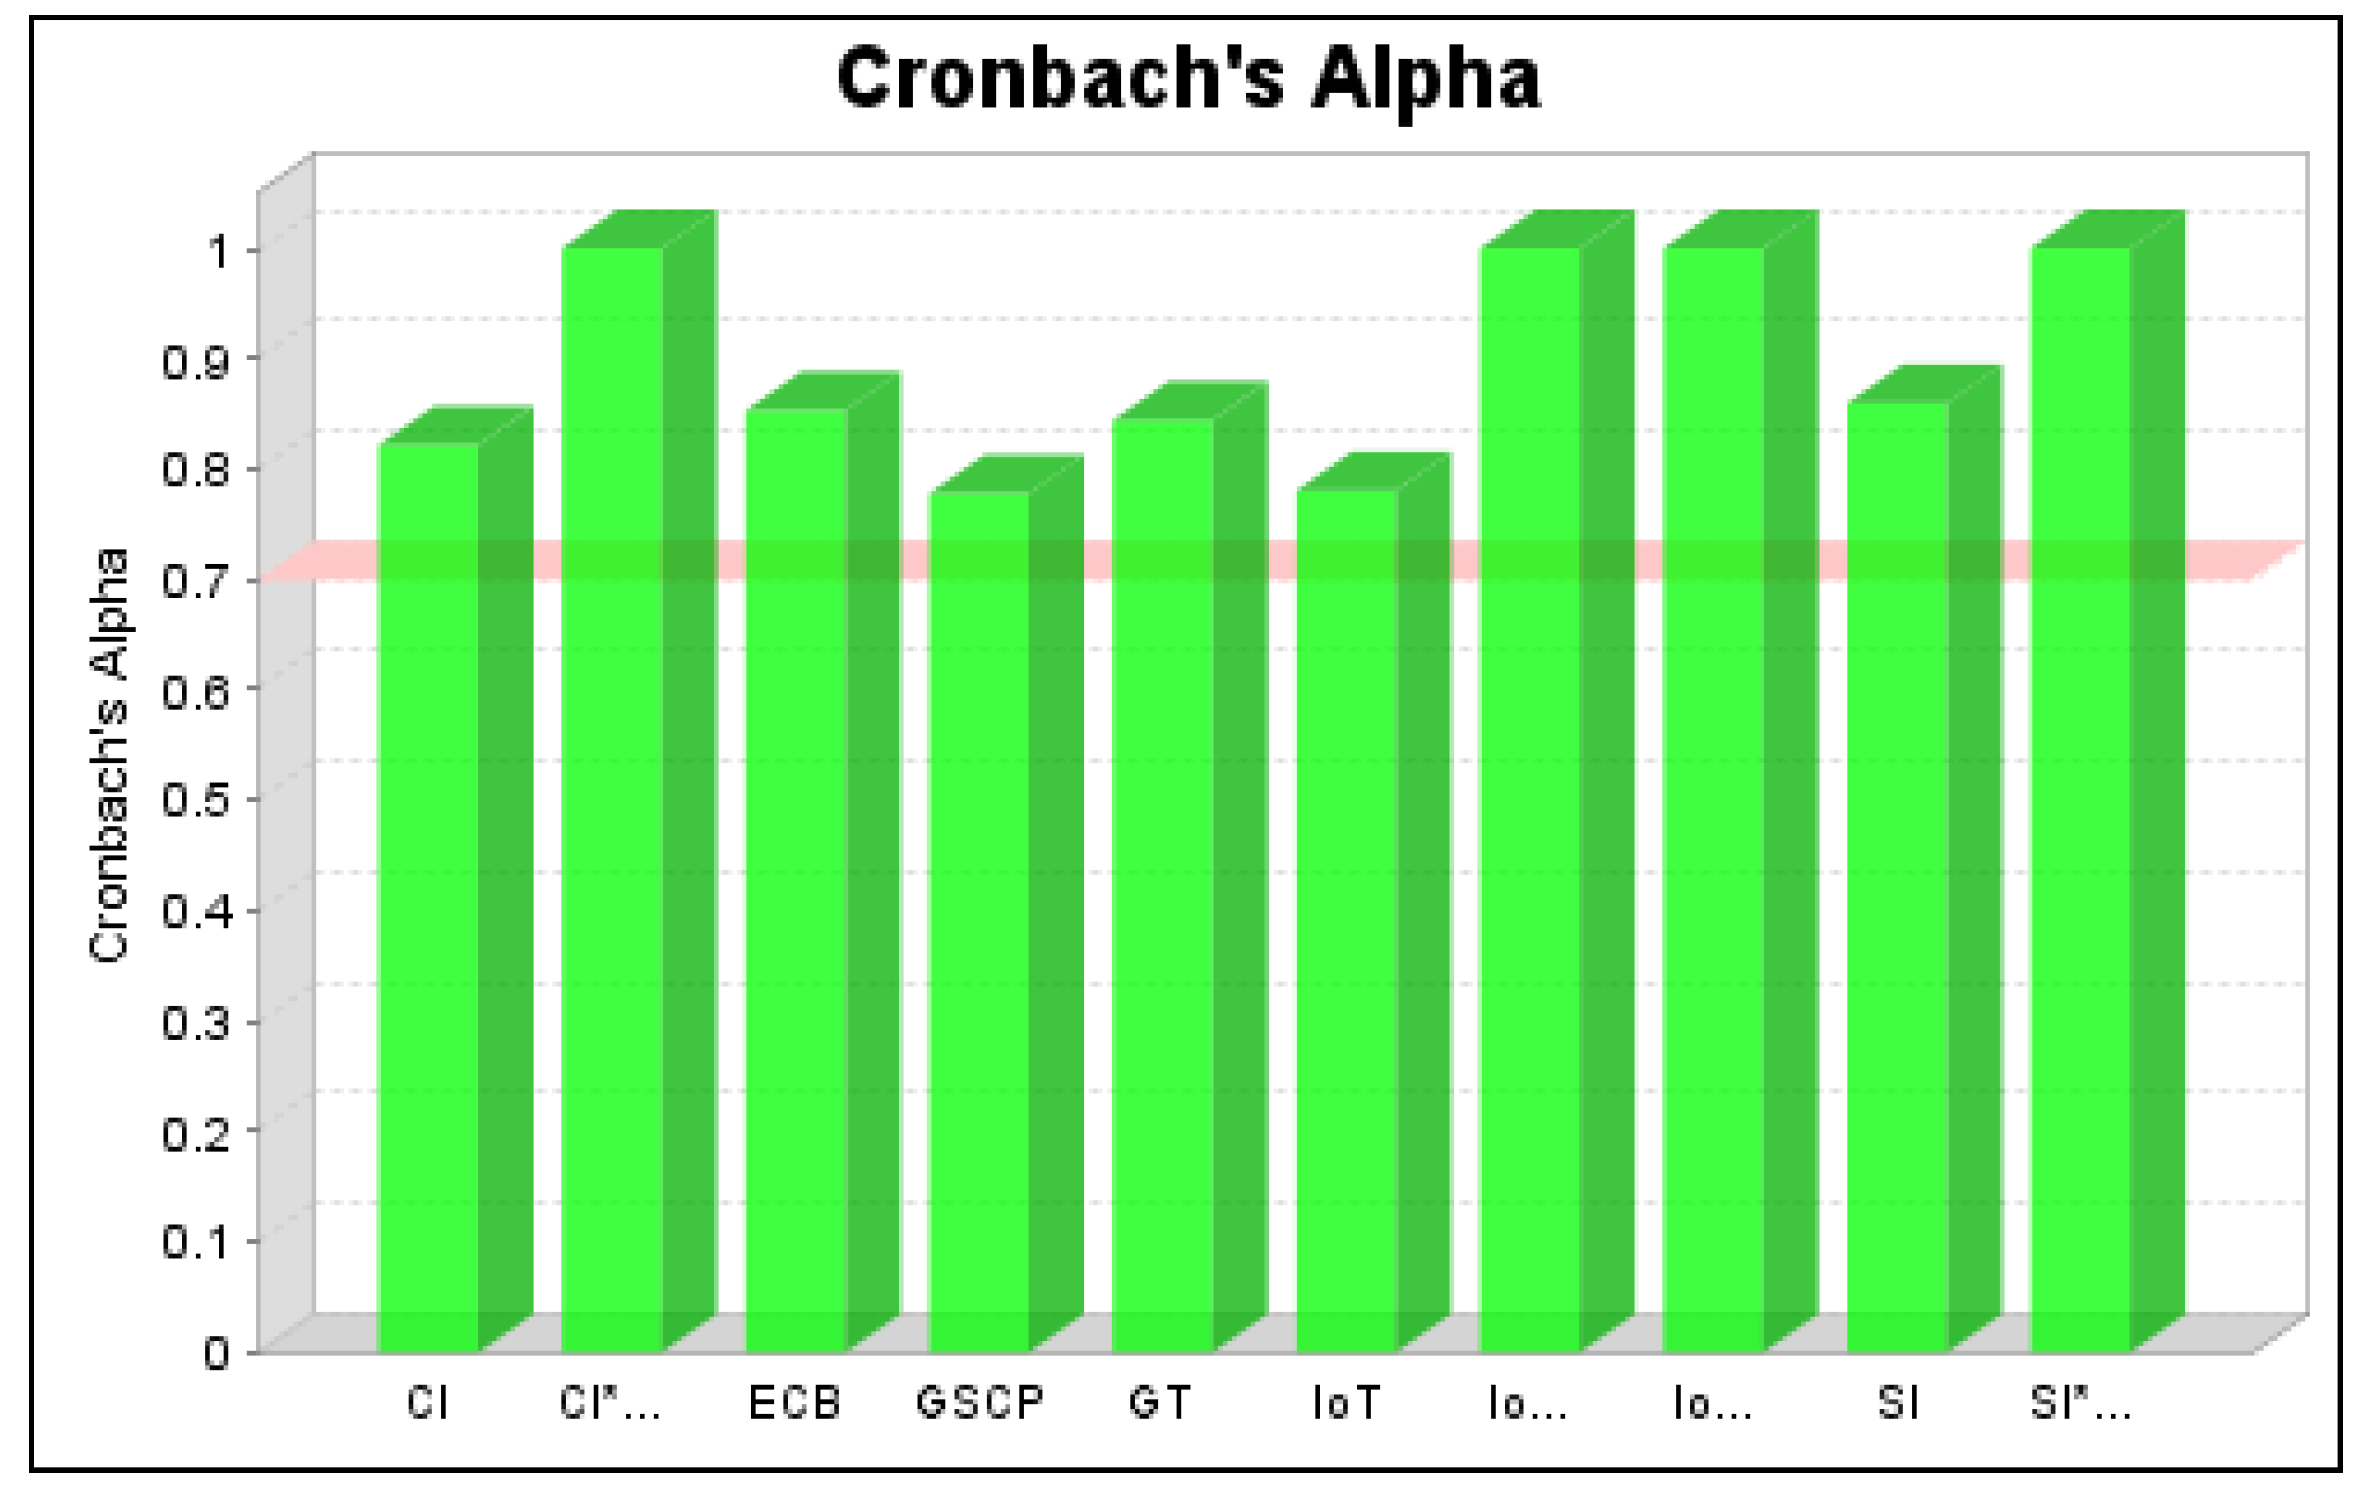
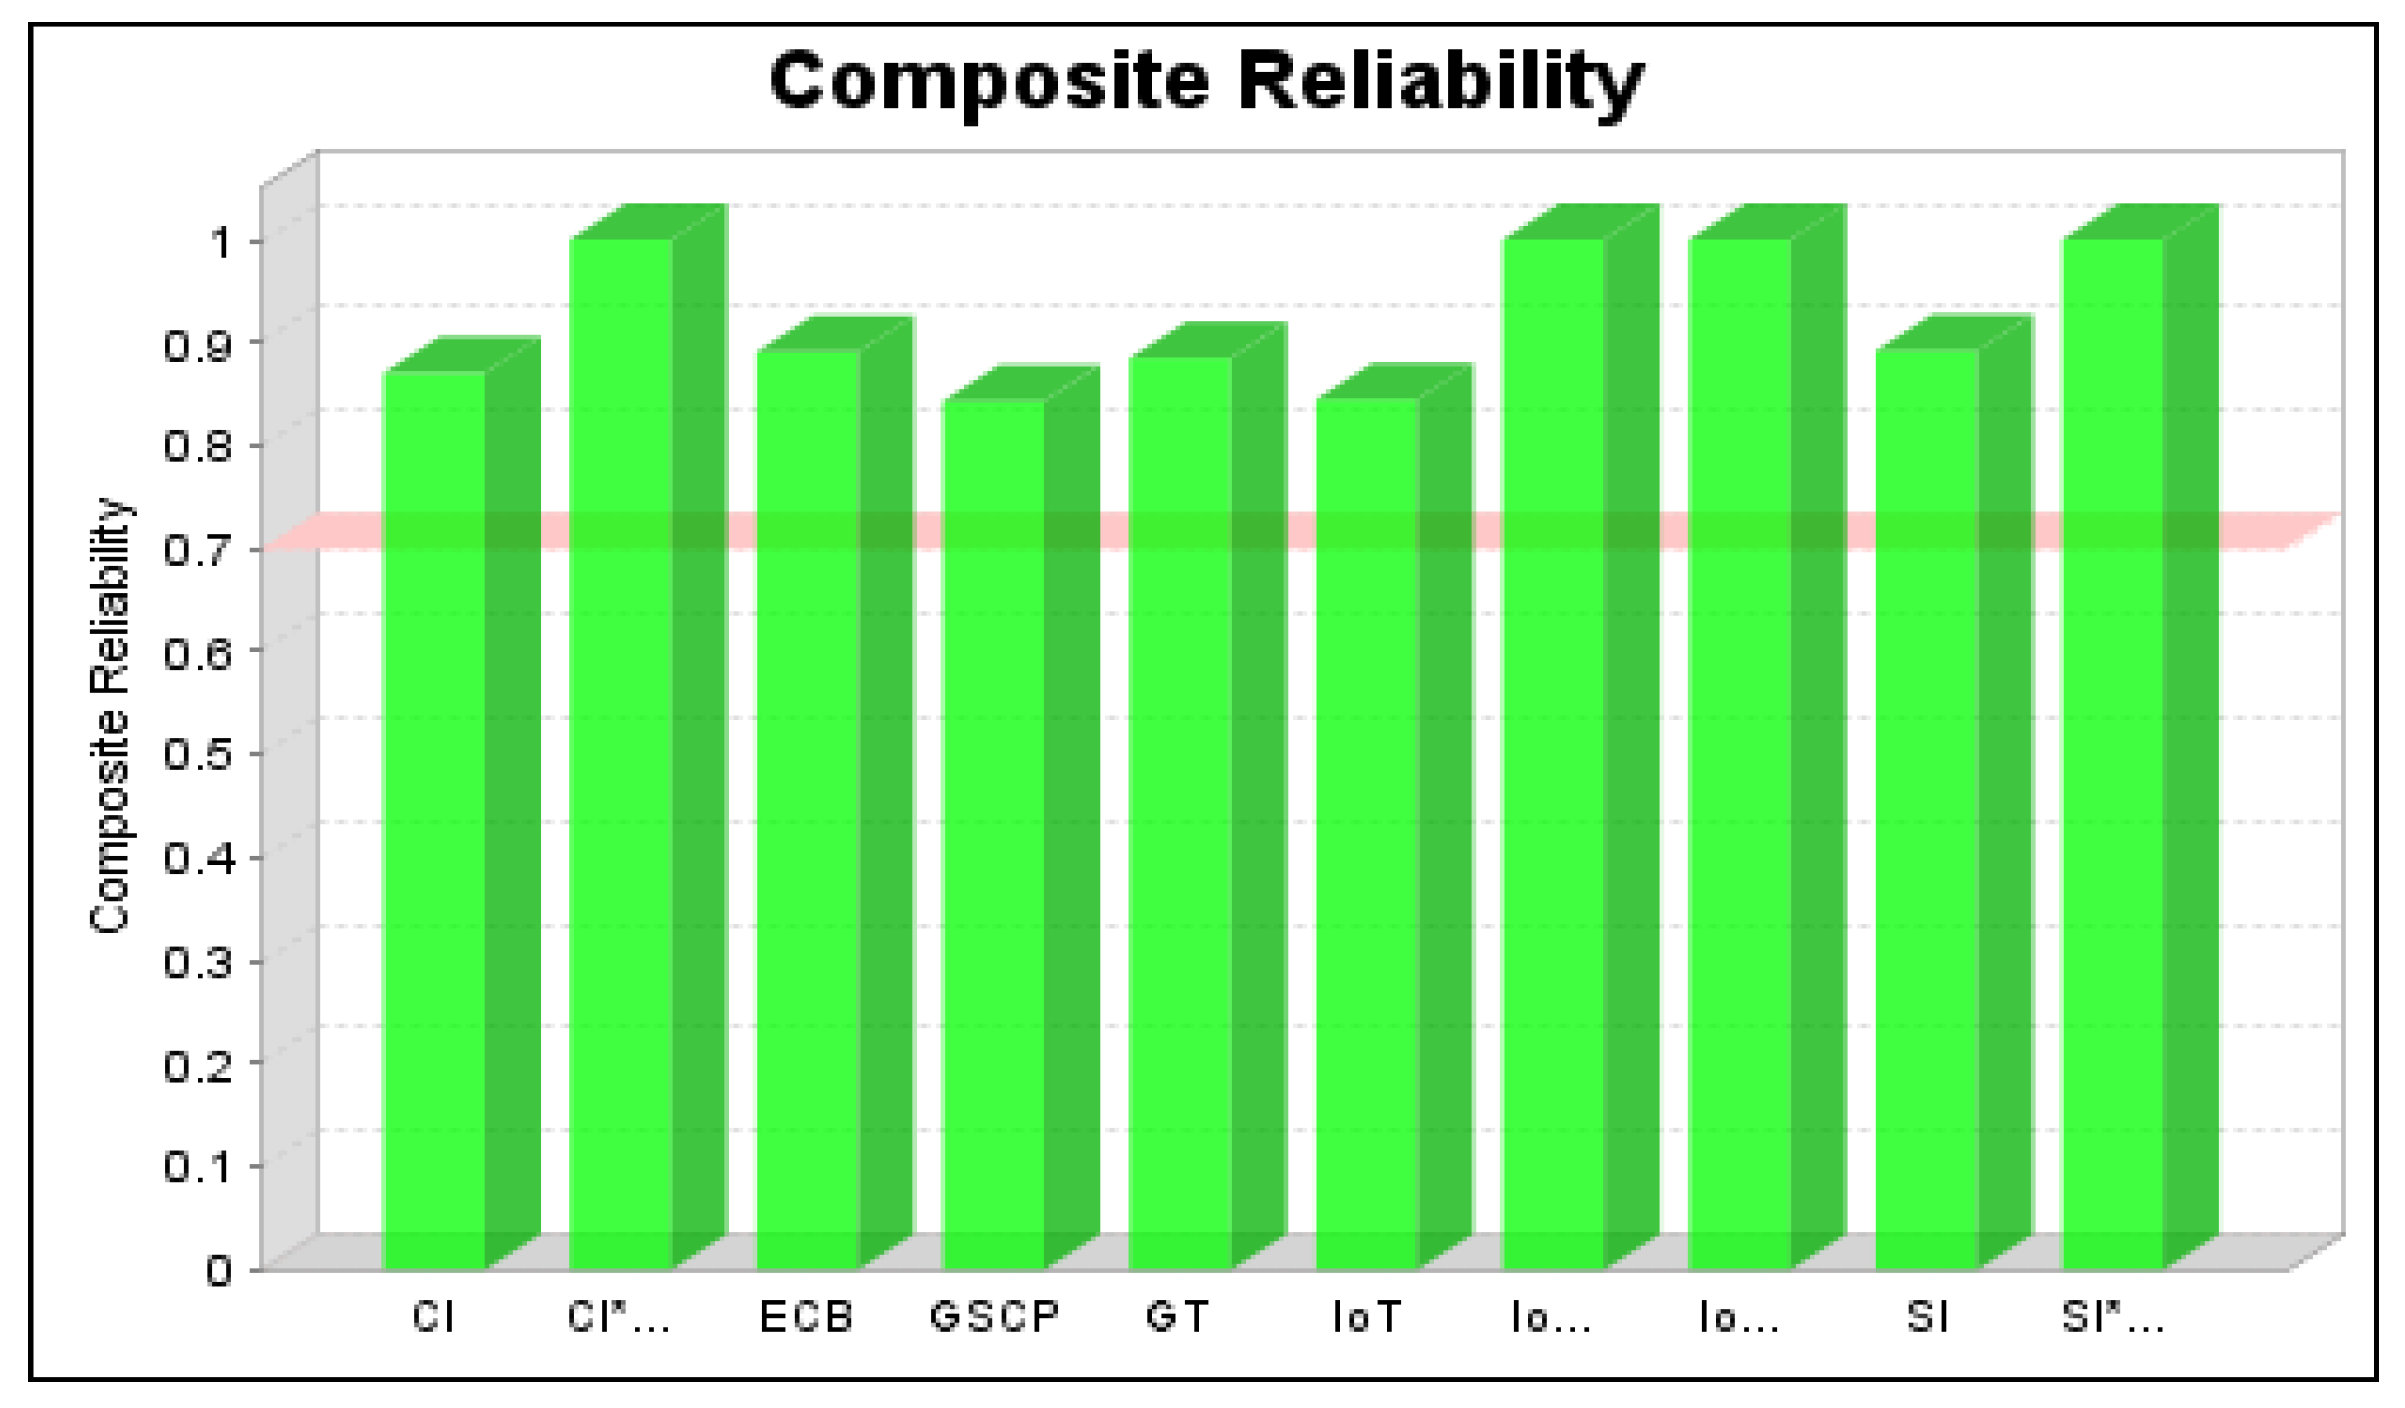
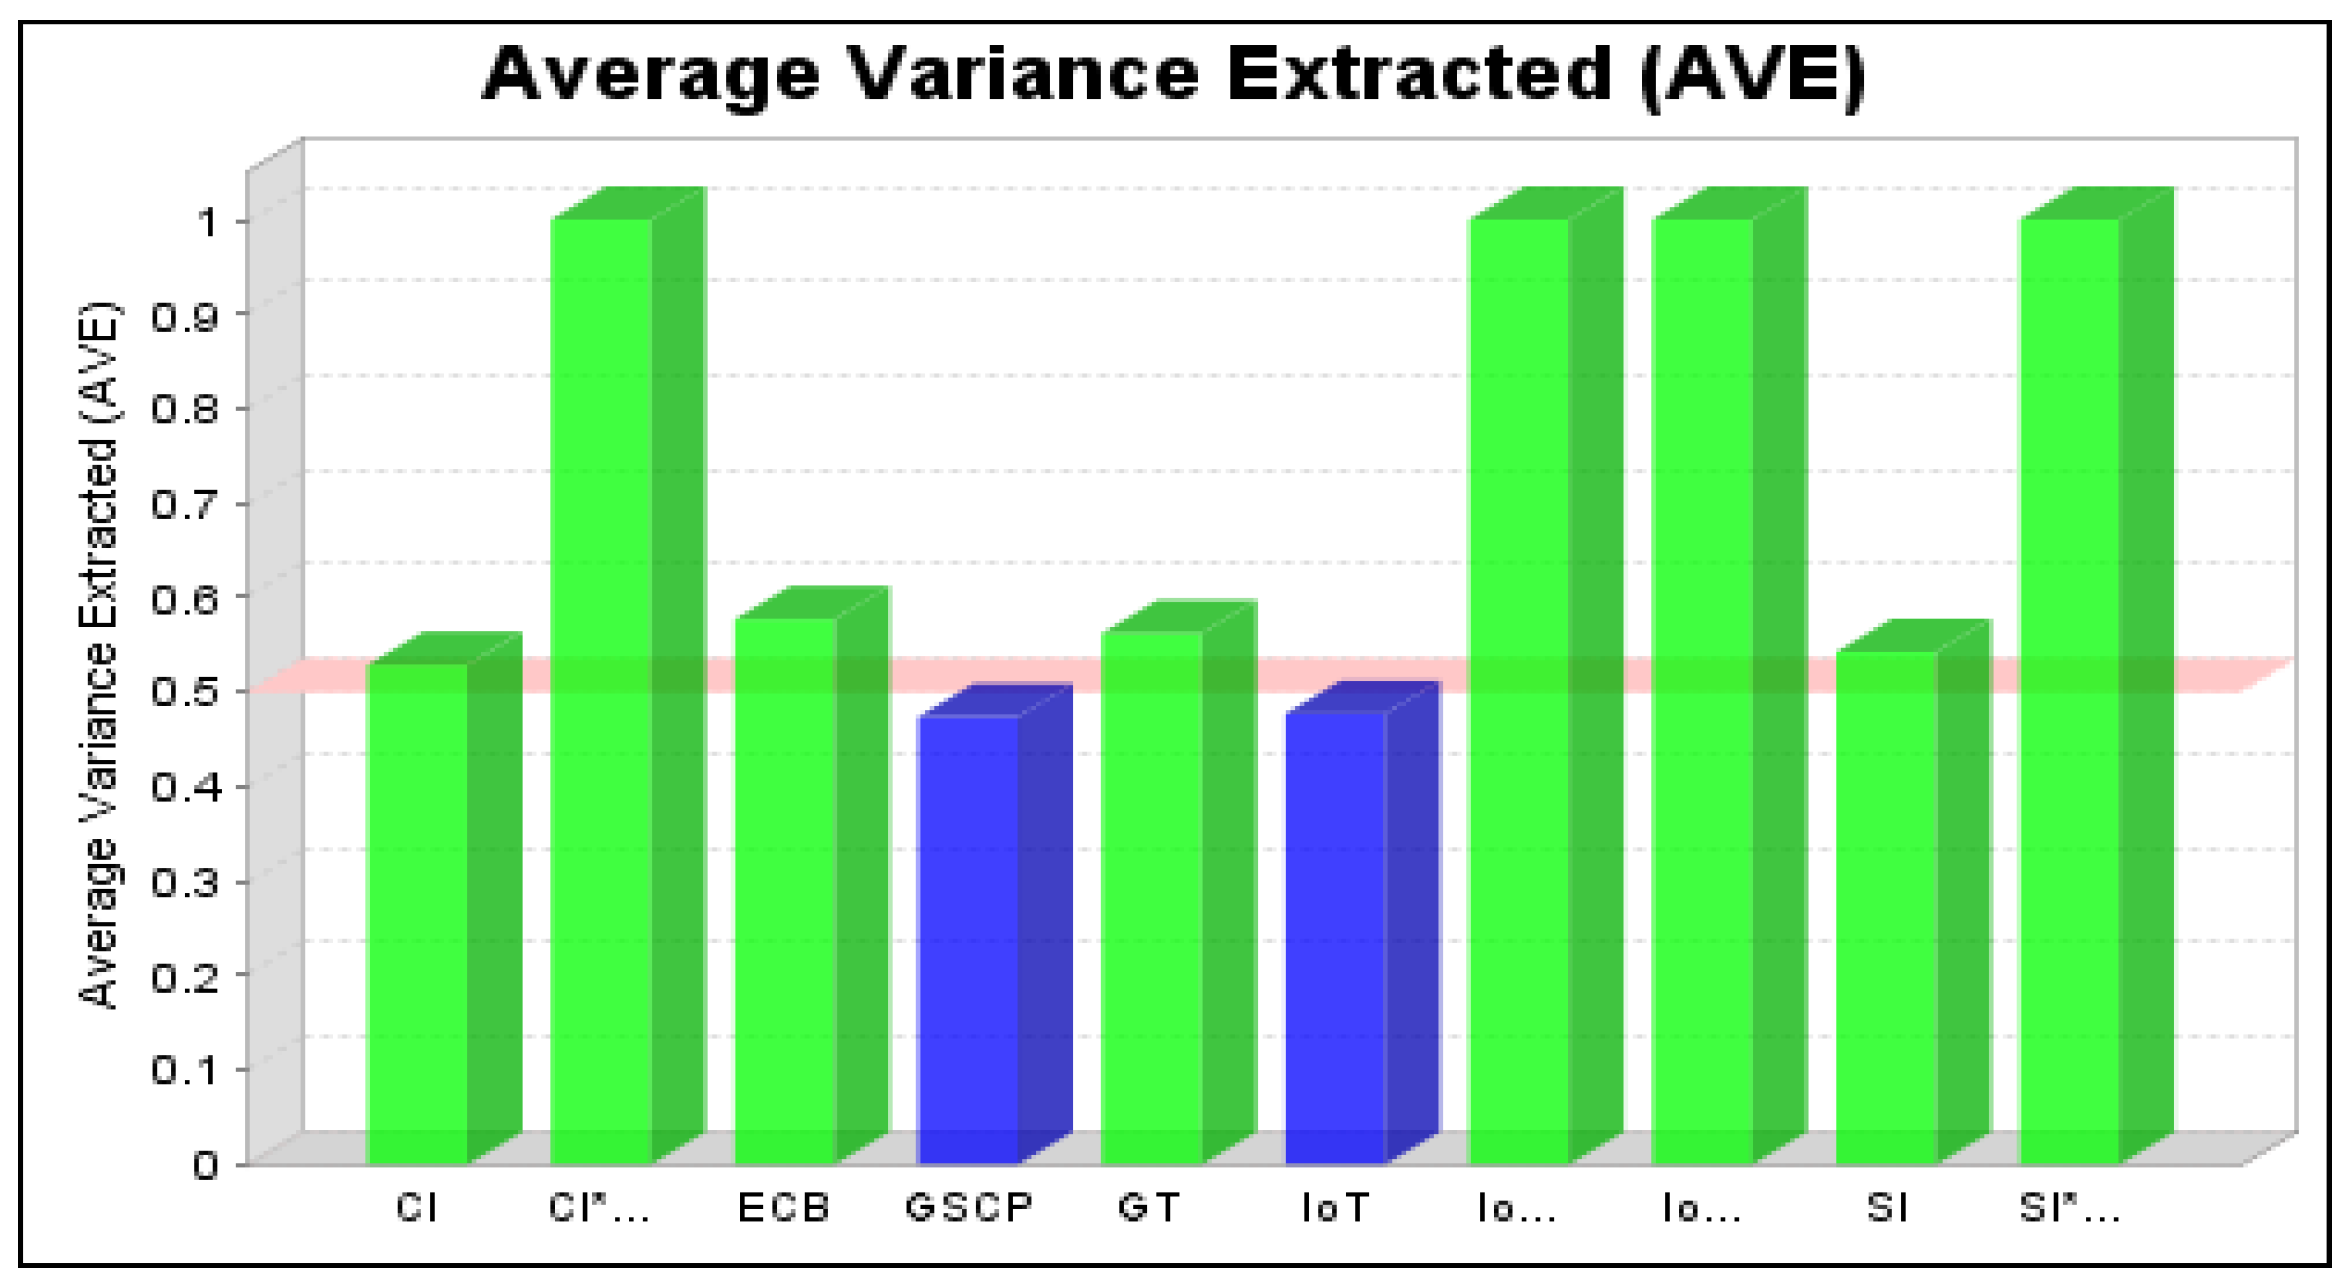
| Construct | Item Loading | t-Statistics | Cronbach’s Alpha | CR & AVE |
|---|---|---|---|---|
| Internet of Things (IoT) | ||||
| IoT 2 | 0.707 | 18.63 | 0.781 | CR = 0.845 AVE = 0.477 |
| IoT 3 | 0.704 | 16.36 | ||
| IoT 4 | 0.666 | 13.92 | ||
| IoT 5 | 0.691 | 14.23 | ||
| IoT 7 | 0.619 | 11.15 | ||
| IoT 9 | 0.751 | 22.63 | ||
| Energy Consumption Behavior (ECB) | ||||
| ECB 10 | 0.710 | 15.92 | 0.853 | CR = 0.891 AVE = 0.577 |
| ECB 3 | 0.772 | 27.76 | ||
| ECB 4 | 0.780 | 23.66 | ||
| ECB 5 | 0.714 | 17.46 | ||
| ECB 8 | 0.768 | 23.03 | ||
| ECB 9 | 0.811 | 31.79 | ||
| Supplier Integration (SI) | ||||
| SI 1 | 0.717 | 19.29 | 0.860 | CR = 0.893 AVE = 0.543 |
| SI 2 | 0.729 | 21.32 | ||
| SI 4 | 0.734 | 18.46 | ||
| SI 5 | 0.711 | 17.59 | ||
| SI 6 | 0.743 | 22.74 | ||
| SI 7 | 0.765 | 23.53 | ||
| SI 9 | 0.756 | 25.05 | ||
| Customer Integration (CI) | ||||
| CI 2 | 0.705 | 15.88 | 0.822 | CR = 0.871 AVE = 0.529 |
| CI 3 | 0.731 | 19.74 | ||
| CI 4 | 0.766 | 30.25 | ||
| CI 6 | 0.711 | 18.23 | ||
| CI 8 | 0.759 | 21.63 | ||
| CI 9 | 0.689 | 14.50 | ||
| Green Training (GT) | ||||
| GT 10 | 0.769 | 26.05 | 0.845 | CR = 0.885 AVE = 0.563 |
| GT 2 | 0.741 | 21.44 | ||
| GT 3 | 0.746 | 22.55 | ||
| GT 5 | 0.746 | 18.29 | ||
| GT 8 | 0.728 | 20.24 | ||
| GT 9 | 0.769 | 21.96 | ||
| Green Supply Chain Performance (GSCP) | ||||
| GSCP 4 | 0.698 | 13.86 | 0.778 | CR = 0.844 AVE = 0.474 |
| GSCP 5 | 0.647 | 10.28 | ||
| GSCP 6 | 0.704 | 16.78 | ||
| GSCP 7 | 0.666 | 8.449 | ||
| GSCP 8 | 0.710 | 13.18 | ||
| GSCP 9 | 0.702 | 11.41 | ||
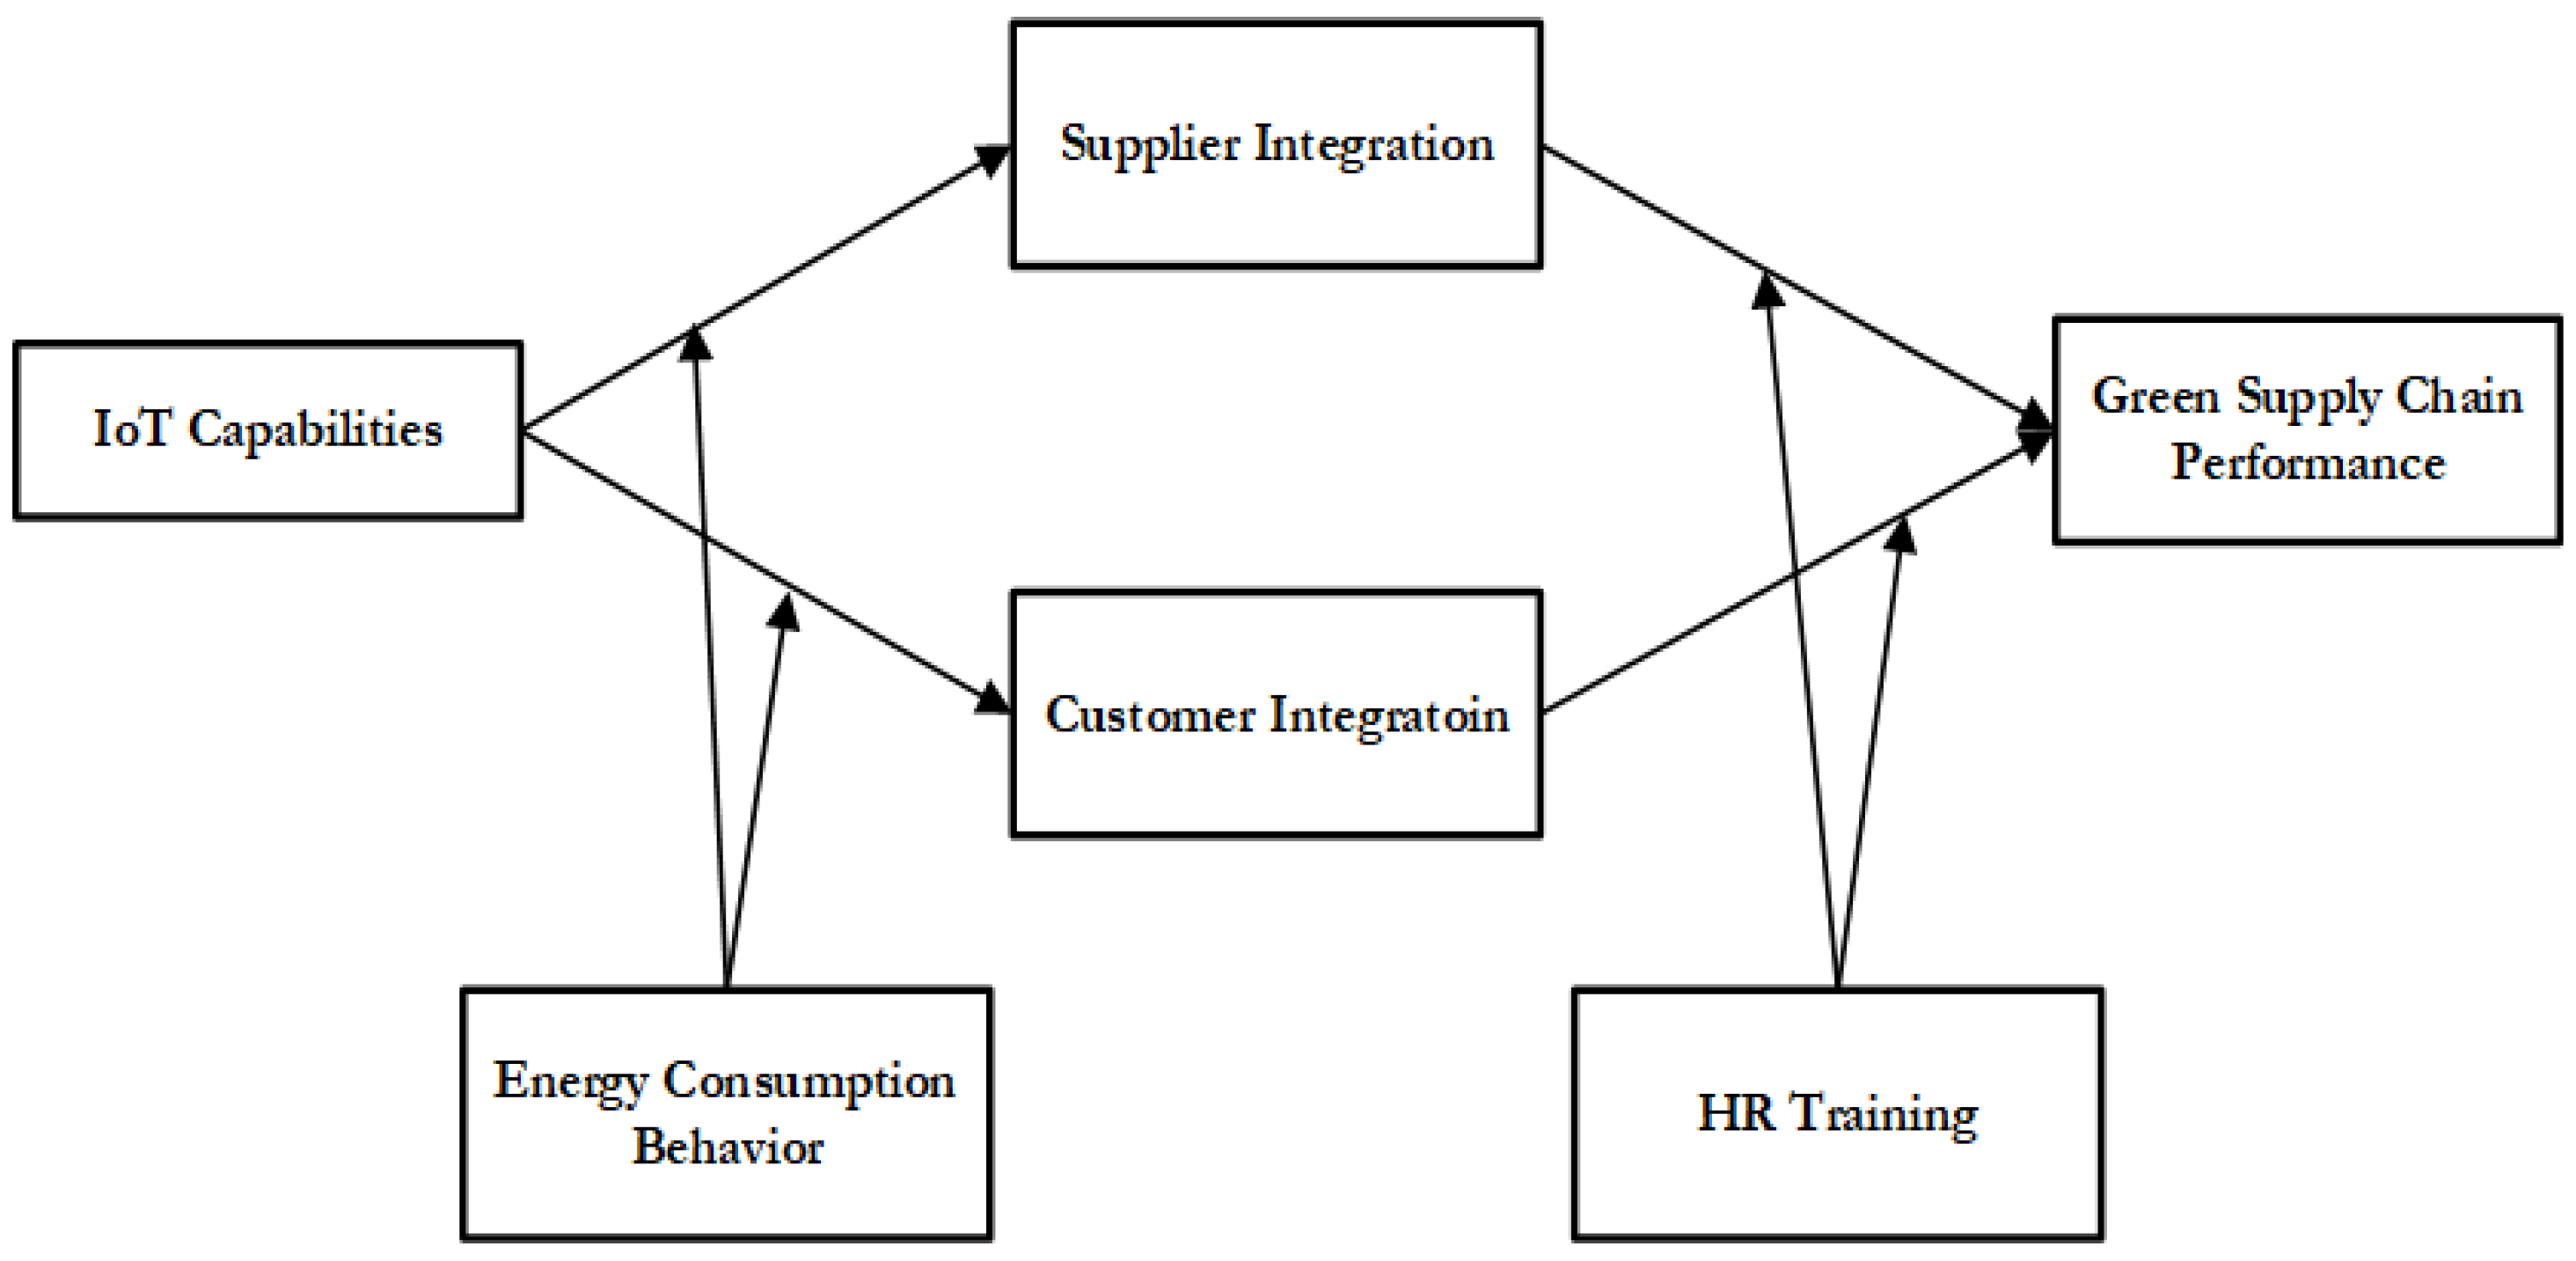
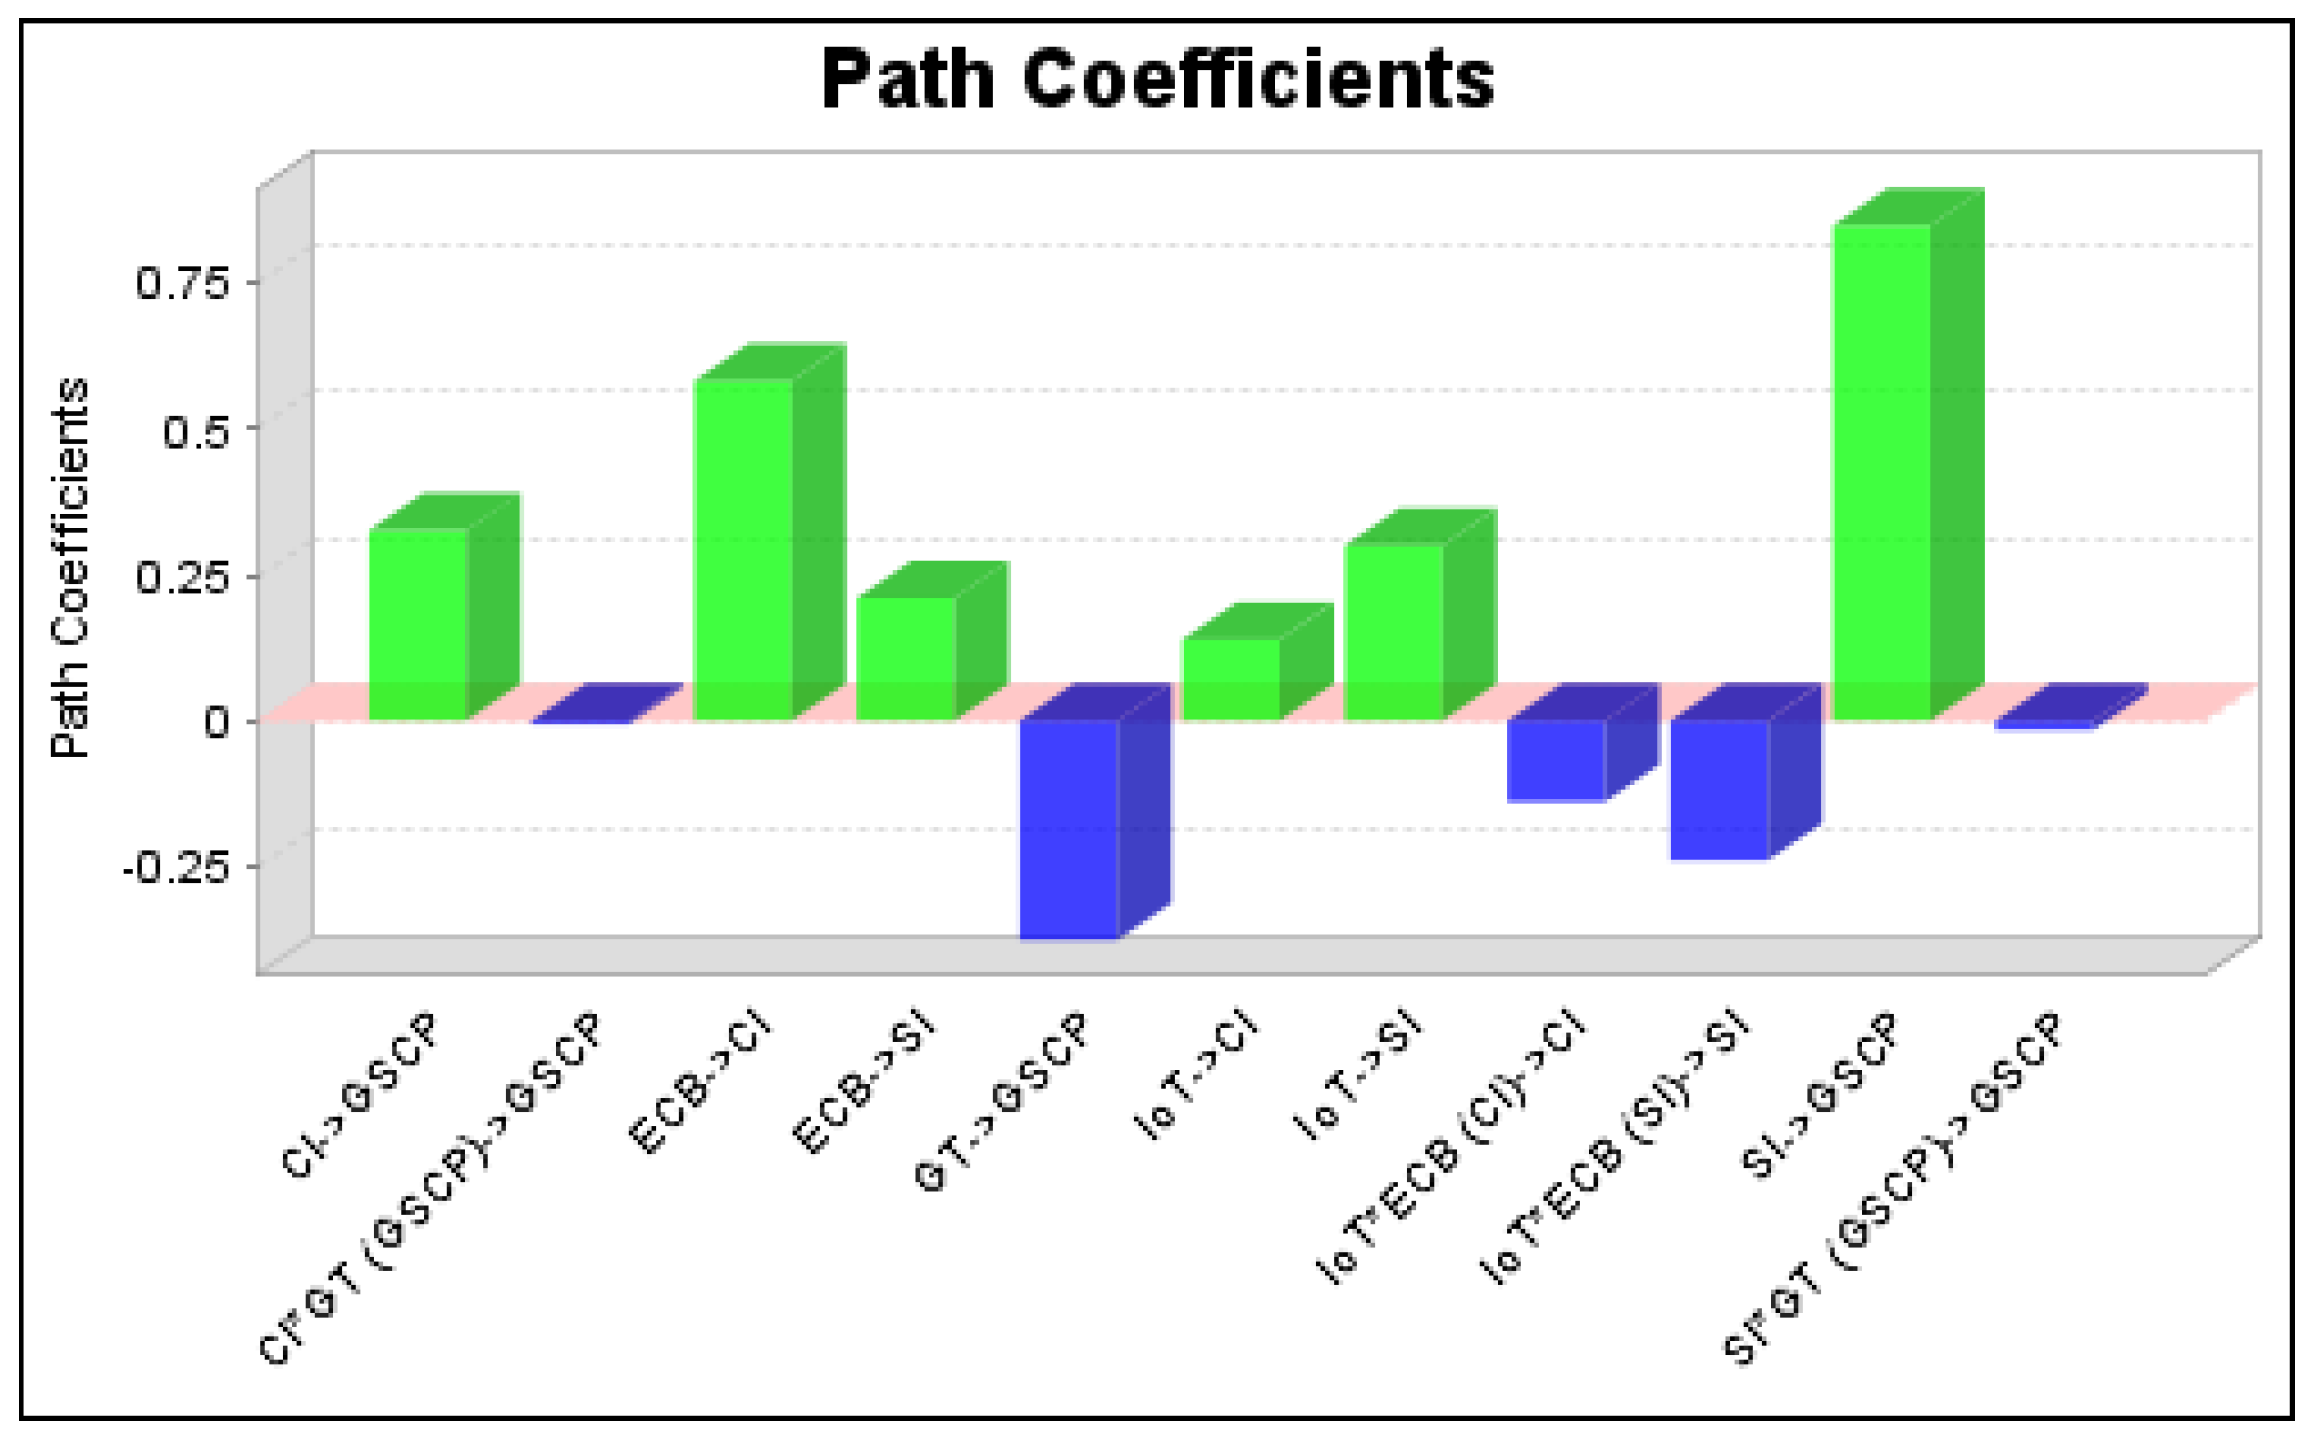
| Path Coefficients | t-Statistics | p Values | Results | |
|---|---|---|---|---|
| CI → GSCP | 0.326 | 4.603 | 0.000 | Supported |
| ECB → CI | 0.586 | 11.90 | 0.000 | Supported |
| ECB → SI | 0.210 | 3.122 | 0.002 | Supported |
| GT → GSCP | −0.362 | 1.691 | 0.091 | Supported |
| IoT → CI | 0.141 | 3.148 | 0.002 | Supported |
| IoT → SI | 0.306 | 5.371 | 0.000 | Supported |
| SI → GSCP | 0.838 | 3.437 | 0.001 | Supported |
| CI*GT (GSCP) → GSCP | −0.007 | 0.063 | 0.950 | Not Supported |
| SI*GT (GSCP) → GSCP | −0.025 | 0.163 | 0.870 | Not Supported |
| IoT*ECB (CI) → CI | −0.138 | 6.543 | 0.000 | Supported |
| IoT*ECB (SI) → SI | −0.237 | 8.008 | 0.000 | Supported |
| ECB → CI → GSCP | 0.191 | 4.684 | 0.000 | Supported |
| IoT → CI → GSCP | 0.047 | 2.127 | 0.033 | Supported |
| IoT*ECB (CI) → CI → GSCP | −0.045 | 3.875 | 0.000 | Supported |
| ECB → SI → GSCP | 0.178 | 2.164 | 0.030 | Supported |
| IoT → SI → GSCP | 0.256 | 2.928 | 0.003 | Supported |
| IoT*ECB (SI) → SI → GSCP | −0.199 | 3.186 | 0.001 | Supported |
© 2018 by the authors. Licensee MDPI, Basel, Switzerland. This article is an open access article distributed under the terms and conditions of the Creative Commons Attribution (CC BY) license (http://creativecommons.org/licenses/by/4.0/).
Share and Cite
Shafique, M.N.; Rashid, A.; Bajwa, I.S.; Kazmi, R.; Khurshid, M.M.; Tahir, W.A. Effect of IoT Capabilities and Energy Consumption behavior on Green Supply Chain Integration. Appl. Sci. 2018, 8, 2481. https://doi.org/10.3390/app8122481
Shafique MN, Rashid A, Bajwa IS, Kazmi R, Khurshid MM, Tahir WA. Effect of IoT Capabilities and Energy Consumption behavior on Green Supply Chain Integration. Applied Sciences. 2018; 8(12):2481. https://doi.org/10.3390/app8122481
Chicago/Turabian StyleShafique, Muhammad Noman, Ammar Rashid, Imran Sarwar Bajwa, Rafaqat Kazmi, Muhammad Mahboob Khurshid, and Wardah Ahmad Tahir. 2018. "Effect of IoT Capabilities and Energy Consumption behavior on Green Supply Chain Integration" Applied Sciences 8, no. 12: 2481. https://doi.org/10.3390/app8122481