Article

Numerical Analysis for Shear Behavior of Binary Interfaces under Different Bonded Conditions

1
CCCC First Harbor Engineering Company Ltd., Tianjin 533000, China
2
School of Resources and Safety Engineering, Central South University, Changsha 410083, China
*
Authors to whom correspondence should be addressed.
Appl. Sci. 2024, 14(9), 3686; https://doi.org/10.3390/app14093686
Submission received: 26 March 2024 / Revised: 24 April 2024 / Accepted: 24 April 2024 / Published: 26 April 2024

Abstract

:
The shear performance of the binary interface formed by mortar and rock cementation is a key factor influencing the stability and safety of basic engineering projects related to livelihood and economy since concrete has become one of the most widely used materials in engineering. Therefore, it is an urgent practical problem to further explore and clarify the shear failure mechanism of the mortar–rock binary interface. In response to the current research objective focused on fully bonded interfaces, this paper constructed binary interface models with different bonded conditions to perform direct shear experiments using numerical simulation methods, and the effect of bonded conditions on the shear behavior of the mortar–rock binary interface was analyzed. The results indicate that the bonded conditions have a significant influence on the shear mechanical behavior of the mortar–rock binary interface, which is mainly reflected in the stress-displacement curve characteristics, the shear strength, the fracture development and the stress distribution state. The research findings are of great theoretical significance for the further study of shear mechanics at the mortar–rock binary interface and of great practical significance for safe construction, resource conservation and disaster warning.

1. Introduction

Structural surfaces are interfaces in the rock mass (including rock-like materials) that have been cracked or are prone to cracking, and they are the key factors influencing the stability of geotechnical engineering [1]. Generally, structural surfaces are mostly formed under geological processes, such as joints and layers [2]. With the rise of civil engineering, a large number of structural surfaces associated with human activities have emerged [3]. These structural surfaces can be categorized into two groups based on the material nature on both sides of the interface. One is the interface with the same material on both sides of the structural surface, known as the homogeneous interface, and the other is called the binary interface [4]. Concrete is one of the most commonly used materials in construction due to its ability to bond different materials together and provide excellent strength [5]. Consequently, there is also an abundance of binary structural surfaces in geotechnical engineering, such as rock–concrete interfaces, whose mechanical properties are key determinants of the effectiveness of many reinforcement measures [6]. Therefore, a huge number of scholars at home and abroad have carried out relevant research on binary interfaces from experiments, numerical simulations and theoretical analysis [7].
Based on experimental studies, Wu, Xu [8] conducted indoor experiments on the binary interface based on the investigation of the physical properties of the limestone–mudstone binary interface in the Badong area of the Three Gorges. Chang, Guo [9] investigated the damage form of rock–concrete discs under cyclic compression and discussed the effects of interface angle, roughness and concrete strength on the fatigue strength of the rock–concrete interface. Wang, Cheng [10] discussed in detail the effects of normal stress, roughness and cycle number on the cyclic shear behavior of the red clay–concrete interfaces. Qiu, Chen [11] used a combination of experimental and numerical methods to analyze the propagation law of stress waves and revealed the damage mechanism of the mortar–rock interface. Tang, Lin [12] established a quantitative relationship between the sawtooth angle and the shear strength of the rock–mortar interfaces through the AE technique, and three AE characteristic parameters that can be used to predict interface failure were proposed. Numerical simulation methods, such as discrete element and finite element analyses, were also widely used in their research [13]. Ghazvinian, Taghichian [14] carried out simulations of the shear mechanical behavior of a weak interlayer between two rocks with high strength differences and proposed an equation on the relationship between the roughness coefficient parameter and surface statistical fractal parameters. Cao, Tang [15] investigated the shear strength, shear expansion, and damage behavior of binary interfacial specimens with different bond strength ratios under different normal stresses. Yan, Long [16] found that the shear stress at the mortar–rock interface was much smaller than that at the bolt–mortar interface for bolted rock slopes containing weak interlayers, and the shear stress distribution and the debonding damage process at the bolted interface of slopes under seismic action were obtained. Wang, Wu [17] proposed a criterion for crack extension of layered mortar–rock beams based on the stress-intensity factor and, on this basis, presented a numerical method to predict the crack extension process of laminated mortar–rock beams under type I fracture. Qiu, Zhu [18] examined the dynamic behavior of flow cracks crossing the mortar–rock interface under impact loading and found that the crack expansion rate of the mortar–granite specimen was about twice as fast as that of the granite specimen, whereas the difference in the rate of the sandstone–mortar specimen was smaller. Han, Lin [19] built an empirical formula for calculating the shear strength of binary interfaces based on indoor experiments using a discrete element numerical simulation method for shear tests of binary interfaces with different roughness. Using FLAC3D, Tang and Lin [20] found that the shear strength, residual strength, peak strength displacement and strain softening degree of sawtooth rock–mortar interfaces were closely related to the internal friction angle of mortar. From the perspective of microscopic parameters, the influence of the parallel bond modulus ratio on the failure mode and failure development of binary interfaces was subsequently explored [21]. Furthermore, the constitutive modeling of binary interfaces is also an important direction [22]. For example, Yu, Liu [23] conducted triaxial compression tests on half-penetrated mudstone joints and suggested a constitutive model. In addition, Wang, Sun [24] observed the bond-slip behavior describing the seismic mechanism at the mortar–rock interface and established a micromechanical model of the bond-slip at the mortar–rock interface, which theoretically establishes the mechanism of the bond-slip behavior. Dong, Yuan [25] proposed an energy fracture criterion for crack initiation at the rock–concrete interface considering viscoelastic properties.
The above findings have greatly contributed to the research process of binary interfaces, but little attention has been paid to the bonded state of the interface. Generally, under well-protected conditions, cracks are unlikely to occur at the binary interfaces, and most studies are based on fully bonded interfaces. Specially, there are some working conditions when the interface is prone to cracks, resulting in the interface being partially bonded, such as the interfaces of dams. The concrete between pile and soil is also prone to partial bonding due to sliding or uneven shrinkage. These binary interfaces have extremely important effects on engineering safety and stability, and the bonded state is, therefore, of great research significance for the study of shear mechanics performance. In this paper, the shear models of binary interfaces with fully bonded, partially bonded and unbonded interfaces were established in PFC2D to study the effect of the bonded state of the binary interface on the shear stress–shear displacement curves, strength parameters, crack development and damage modes.

2. Numerical Modeling of Binary Interfaces with Different Bonded Conditions

Before proceeding with the modeling, the basic assumptions of the PFC2D need to be introduced. In PFC2D, models can be built to simulate the motion and interaction between various physical components and display the state and result of the motion and interaction. Basic assumptions include:
(1) The particle is an indestructible circular entity;
(2) The entities interact with each other in the form of force and moment;
(3) Contact occurs at overlapping interfaces between rigid entities;
(4) The interaction between entities meets Newton’s law of motion, and the motion state of the wall can be determined by the user.
The calculation of particle flow completes the iteration update of the force and displacement state of the particle in each finite time step. If the time step is small enough, the disturbance will not travel farther from any one particle than its neighbors in a single step.
The simulation process for the direct shear test is divided into three main stages: model building, parameter assignment and direct shear loading.
(1)
Modeling
Walls were generated in PFC2D to constitute the shear box for the direct shear test, with dimensions of 100 mm × 100 mm, consisting of eight walls. Particles with a reasonable size ratio are generated in the shear box, and loads are applied to these randomly distributed and partially overlapping particles until a static equilibrium state. Also, specific shapes of walls are generated between the upper and lower shear boxes as needed, and the particles inside the shear boxes are divided into two parts, which can be grouped together to simulate different rocks in the subsequent parameter assignments.
(2)
Parameter assignment
There are three places in the binary interface direct shear model that need to be assigned values separately: upper rock particles, lower rock particles and interface. The physical properties used for the calibration of the rock parameters in this paper are provided by the literature [8], including mudstone and limestone, with an interface friction coefficient of 0.55. The calibration parameters are shown in Table 1, and a comparison of the calibration results is shown in Table 2, from which it can be seen that the simulation results and the tests have good consistency.
After assigning the calibrated parameters in the rock in the direct shear model, a smooth joint model is generated at the interface of rocks. The parameters required for the smooth joint model include normal stiffness, tangential stiffness and friction coefficient, which are determined by comparing the agreement of the simulation curves to the test curve. The parameter calibration results of the smooth joint model in this paper are shown in Table 3. It is worth mentioning that the smooth joint model simulates the shear behavior of a flat surface considering dilatation without considering the local particle contact direction. In PFC2D, the method of artificially setting the “structural plane” by controlling the distribution of particles will produce an “internal lock” during the movement of particles due to the characteristics of non-destructive particles, resulting in a completely unreasonable steep rise and steep fall of the shear stress–shear displacement curve of the unbonded flat joint. The smooth joint model is the solution to this problem. The smooth joint model is applied between particles so that the motion between particles allows overlap. The direction of mutual motion between particles will change from the tangential direction of the relative surface between particles to the tangential direction of the smooth joint model, and the “internal lock” phenomenon will no longer occur between particles.
The generation of non-bonded binary interfaces is mostly formed by tension or sliding under the force. Considering that the model is sheared on the left, the tension region is located on the left of the interface, and therefore, the unbonded part is set on the left of the model. The bond ratio of the interface is achieved by placing spacer walls of different lengths between the upper and lower shear boxes, as shown in Figure 1. The bonded ratios were 0%, 25%, 50%, 75%, and 100. After the particles are generated in the shear box, a state of static equilibrium can be achieved by the applied forces and cyclic calculations. For the unbonded mode, the particles are fully bonded when given a planar nodal model since a hydrostatic equilibrium is reached. For the others, the particles on both sides of the wall are unable to make contact where the wall exists, thus forming a physical interface, and it is sufficient to give a smooth joint model at its corresponding location after deleting the spacing wall. Five levels of normal stress are set, respectively, for 1 MPa, 2 MPa, 3 MPa, 4 MPa, and 5 MPa.
(3)
Shear loading
Shear loading of a binary interface is realized by applying a constant rate of horizontal displacement to the upper shear box wall. The direct shear model requires constant normal stress, and the model can be considered to have reached a state of constant stress loading when the difference between the target and actual stresses is sufficiently small, although the wall cannot be stressed directly in the PFC. Wall #6 in Figure 1 was set up as a servo wall to constantly update the force state through the Fish language so that the difference between the target stress and the actual stress is controlled to be small enough for the purpose of applying a relatively constant normal stress to the model. After that, the loading stop condition is set so that the upper wall can be loaded at a constant horizontal rate. While loading, horizontal displacement, stress, and crack of the model are monitored and recorded.

3. Shear Mechanical Behavior under Different Bonded Conditions

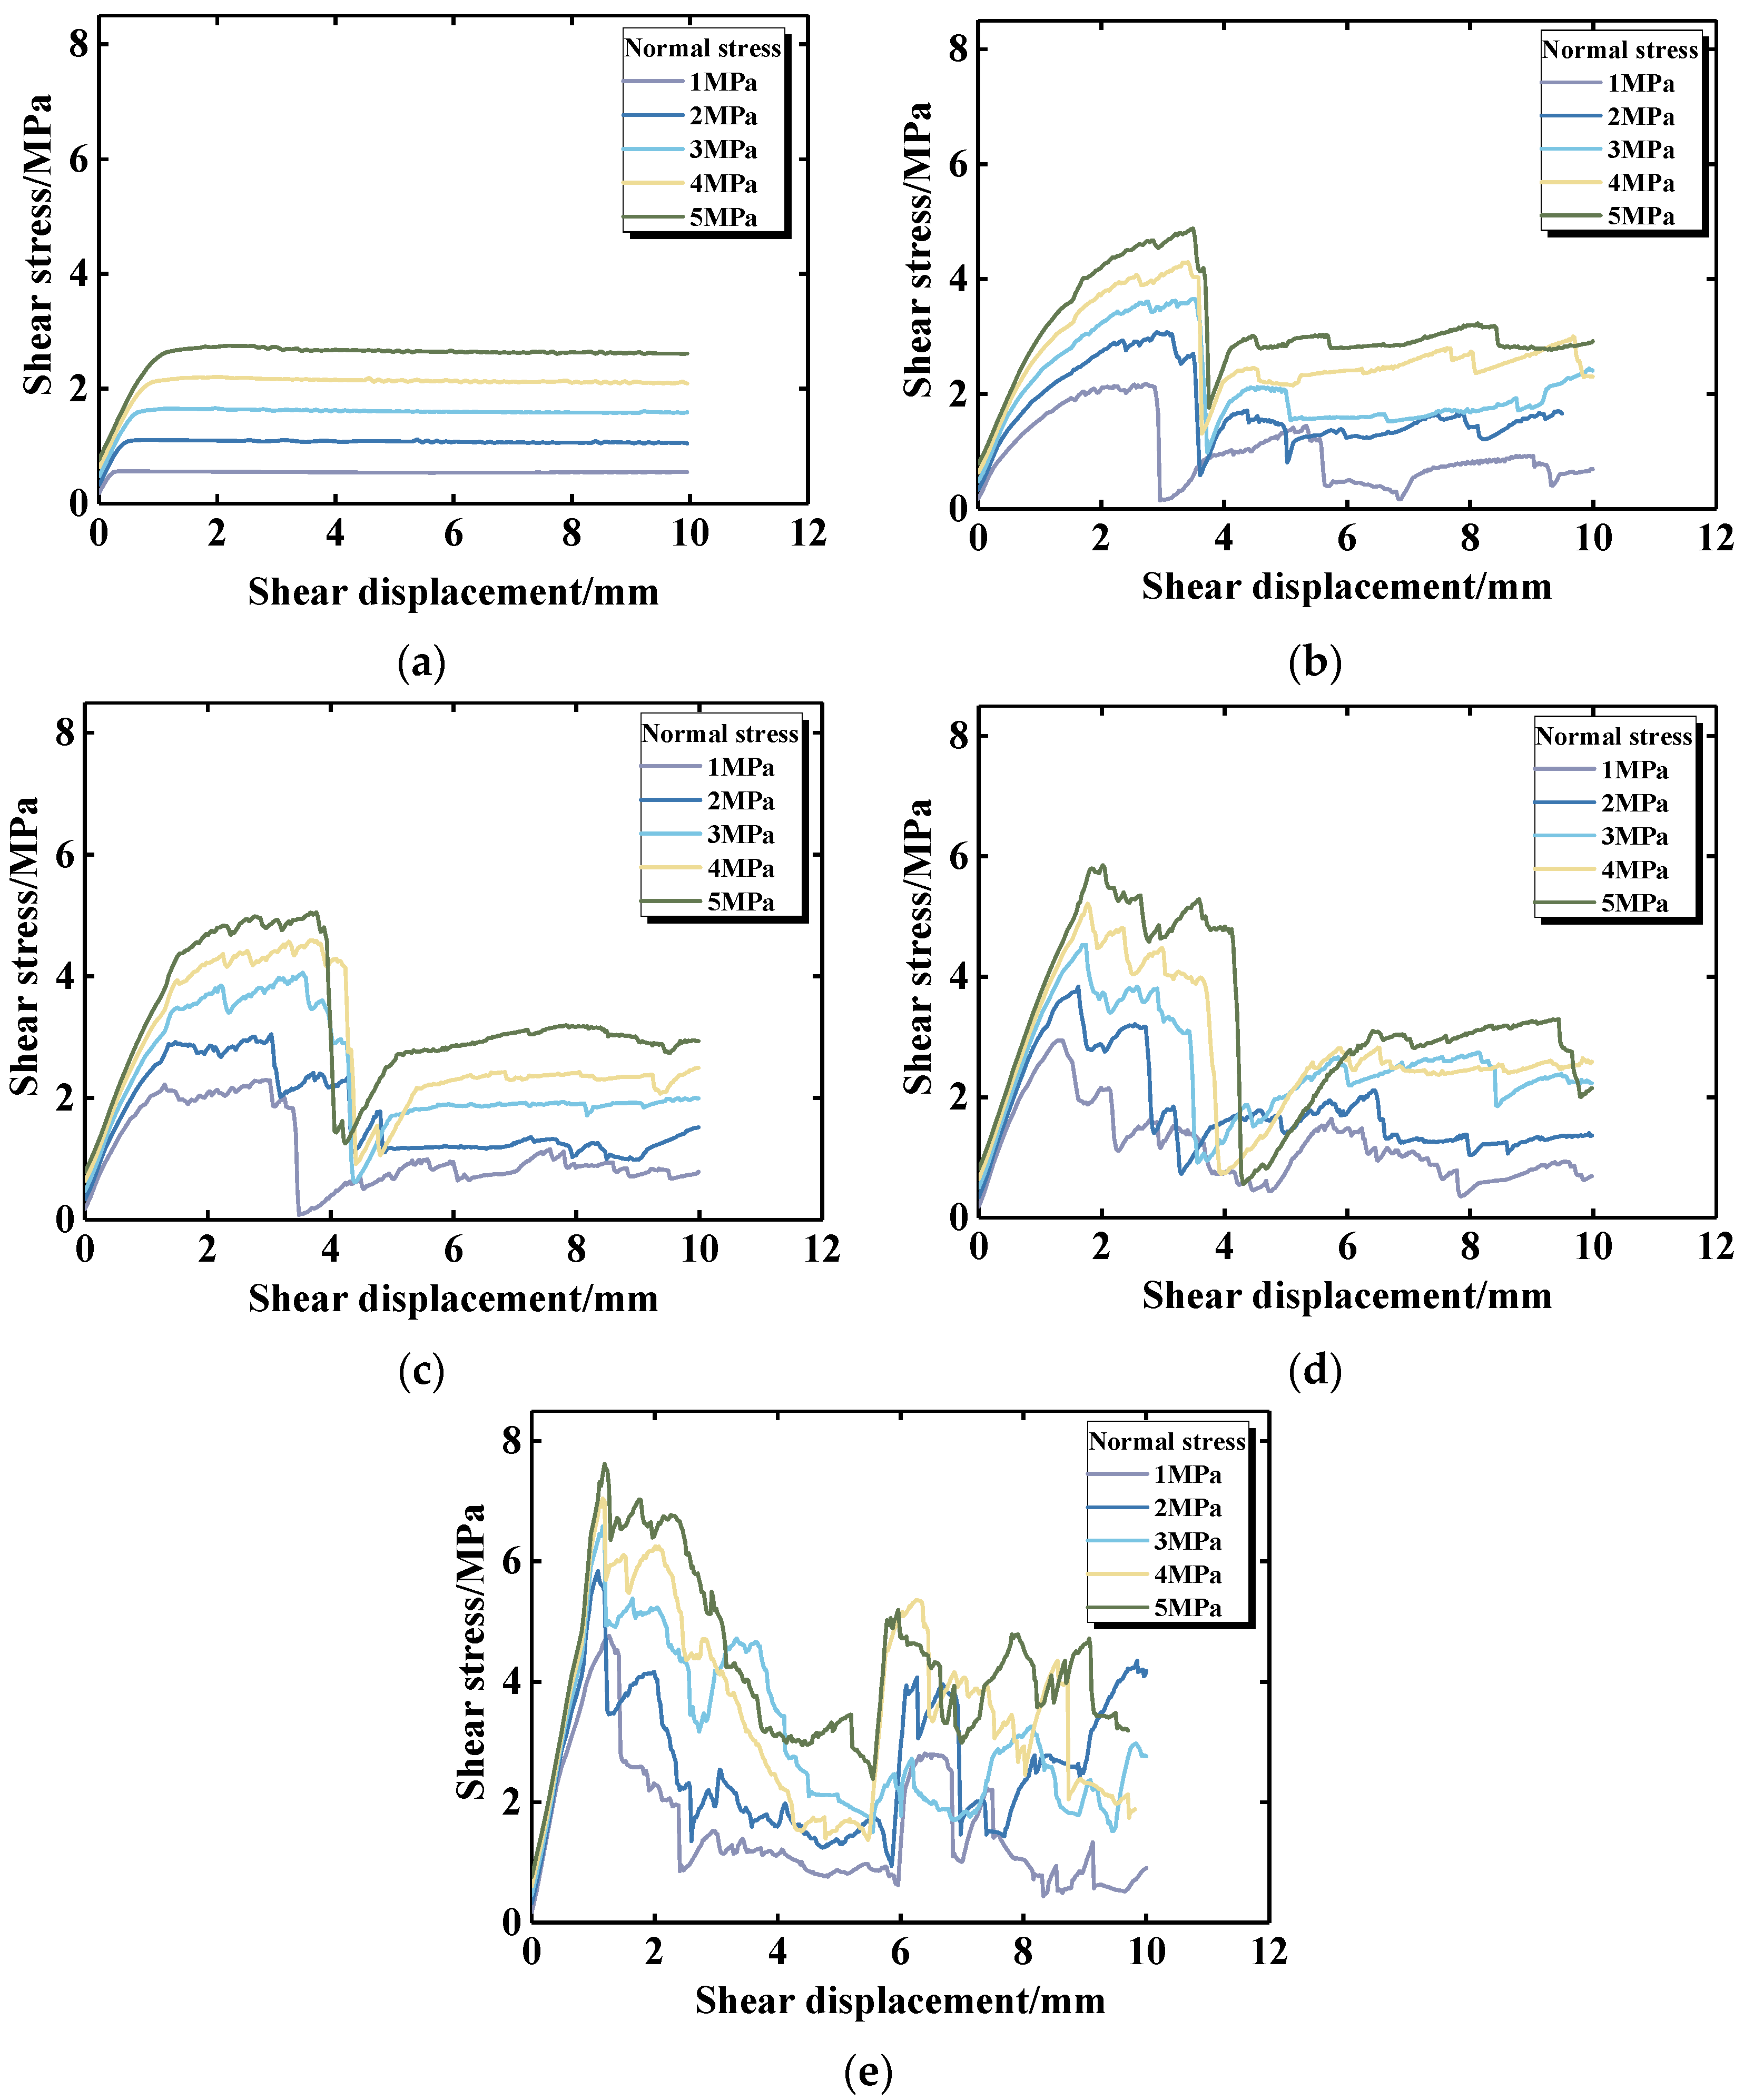
3.1. Influence of Bonded Conditions on Shear Stress–Shear Displacement Curve

In order to study the influence of bonded conditions on the shear behavior of the binary interface, the variations of shear stress–shear displacement curves of binary interfaces under different bonded conditions are firstly analyzed, which are shown in Figure 2.
Figure 2a shows that the stress–displacement curves of the binary interfaces under the unbonded condition are in the standard shear-slip state. The slope of the stress rise before the peak remained almost constant, and the stress rise slowed down near the peak with a certain degree of yielding. It showed no significant stress drop in the post-peak, and the residual strength was stable and almost equal to the peak strength. The stress–displacement curves of the binary interfaces in the fully bonded state can be seen in Figure 2e. There was a good linear relationship between shear stress and shear displacement as the stress rose, and no obvious yielding occurred around the peak. After the peak, the curves show a more pronounced stress drop due to the decrease in load-bearing capacity. However, there was a small increase in the curves throughout the stress-decrease section, which is attributed to the fact that the model has not completely failed, and the failure surface was not penetrated. With further loading, the shear stresses of the model tended to decrease in general. In the residual stage, the stress appeared to steeply rise and fall. The misalignment of the failure surface causes the model to form a structure favorable to the temporary load bearing. Although the failure surface was completely penetrated at this time, it cannot maintain long-term stability in the shear process.
Figure 2b–d show the stress–displacement curves of the binary interfaces under 25%, 50% and 75% bonded conditions, respectively. The curves of partially bonded binary interfaces are closer to that of the unbonded binary interface regarding the shape before the peak, while the post-peak performances are similar to that of fully bonded binary interfaces, which indicates a gradual transformation. For 25% bonded interfaces, the curves show obvious plastic near the peak stress, which fades as the bonded agree increases. Meanwhile, the peak displacement changes accordingly. Specifically, the peak displacement is approximately 2.5 mm at 25% bonded interfaces, 2.0 mm at 50% bonded interfaces, 1.5 mm at 75% bonded interfaces and 1.0 mm at fully bonded interfaces. This can be attributed to the fact that the bonded interface has a good overall elastic deformation capacity, so the stress can basically be maintained to grow linearly before the peak. The unbonded interface may produce localized sliding before the peak, which causes a reduction in shear stiffness, and the rate of stress rise slows down. Additionally, the unbonded region is also equivalent to a crack, which acts as a guide for the development of fractures in the shear process. As a result, the curves of binary interfaces with 25% bonded are flatter in the residual stage.

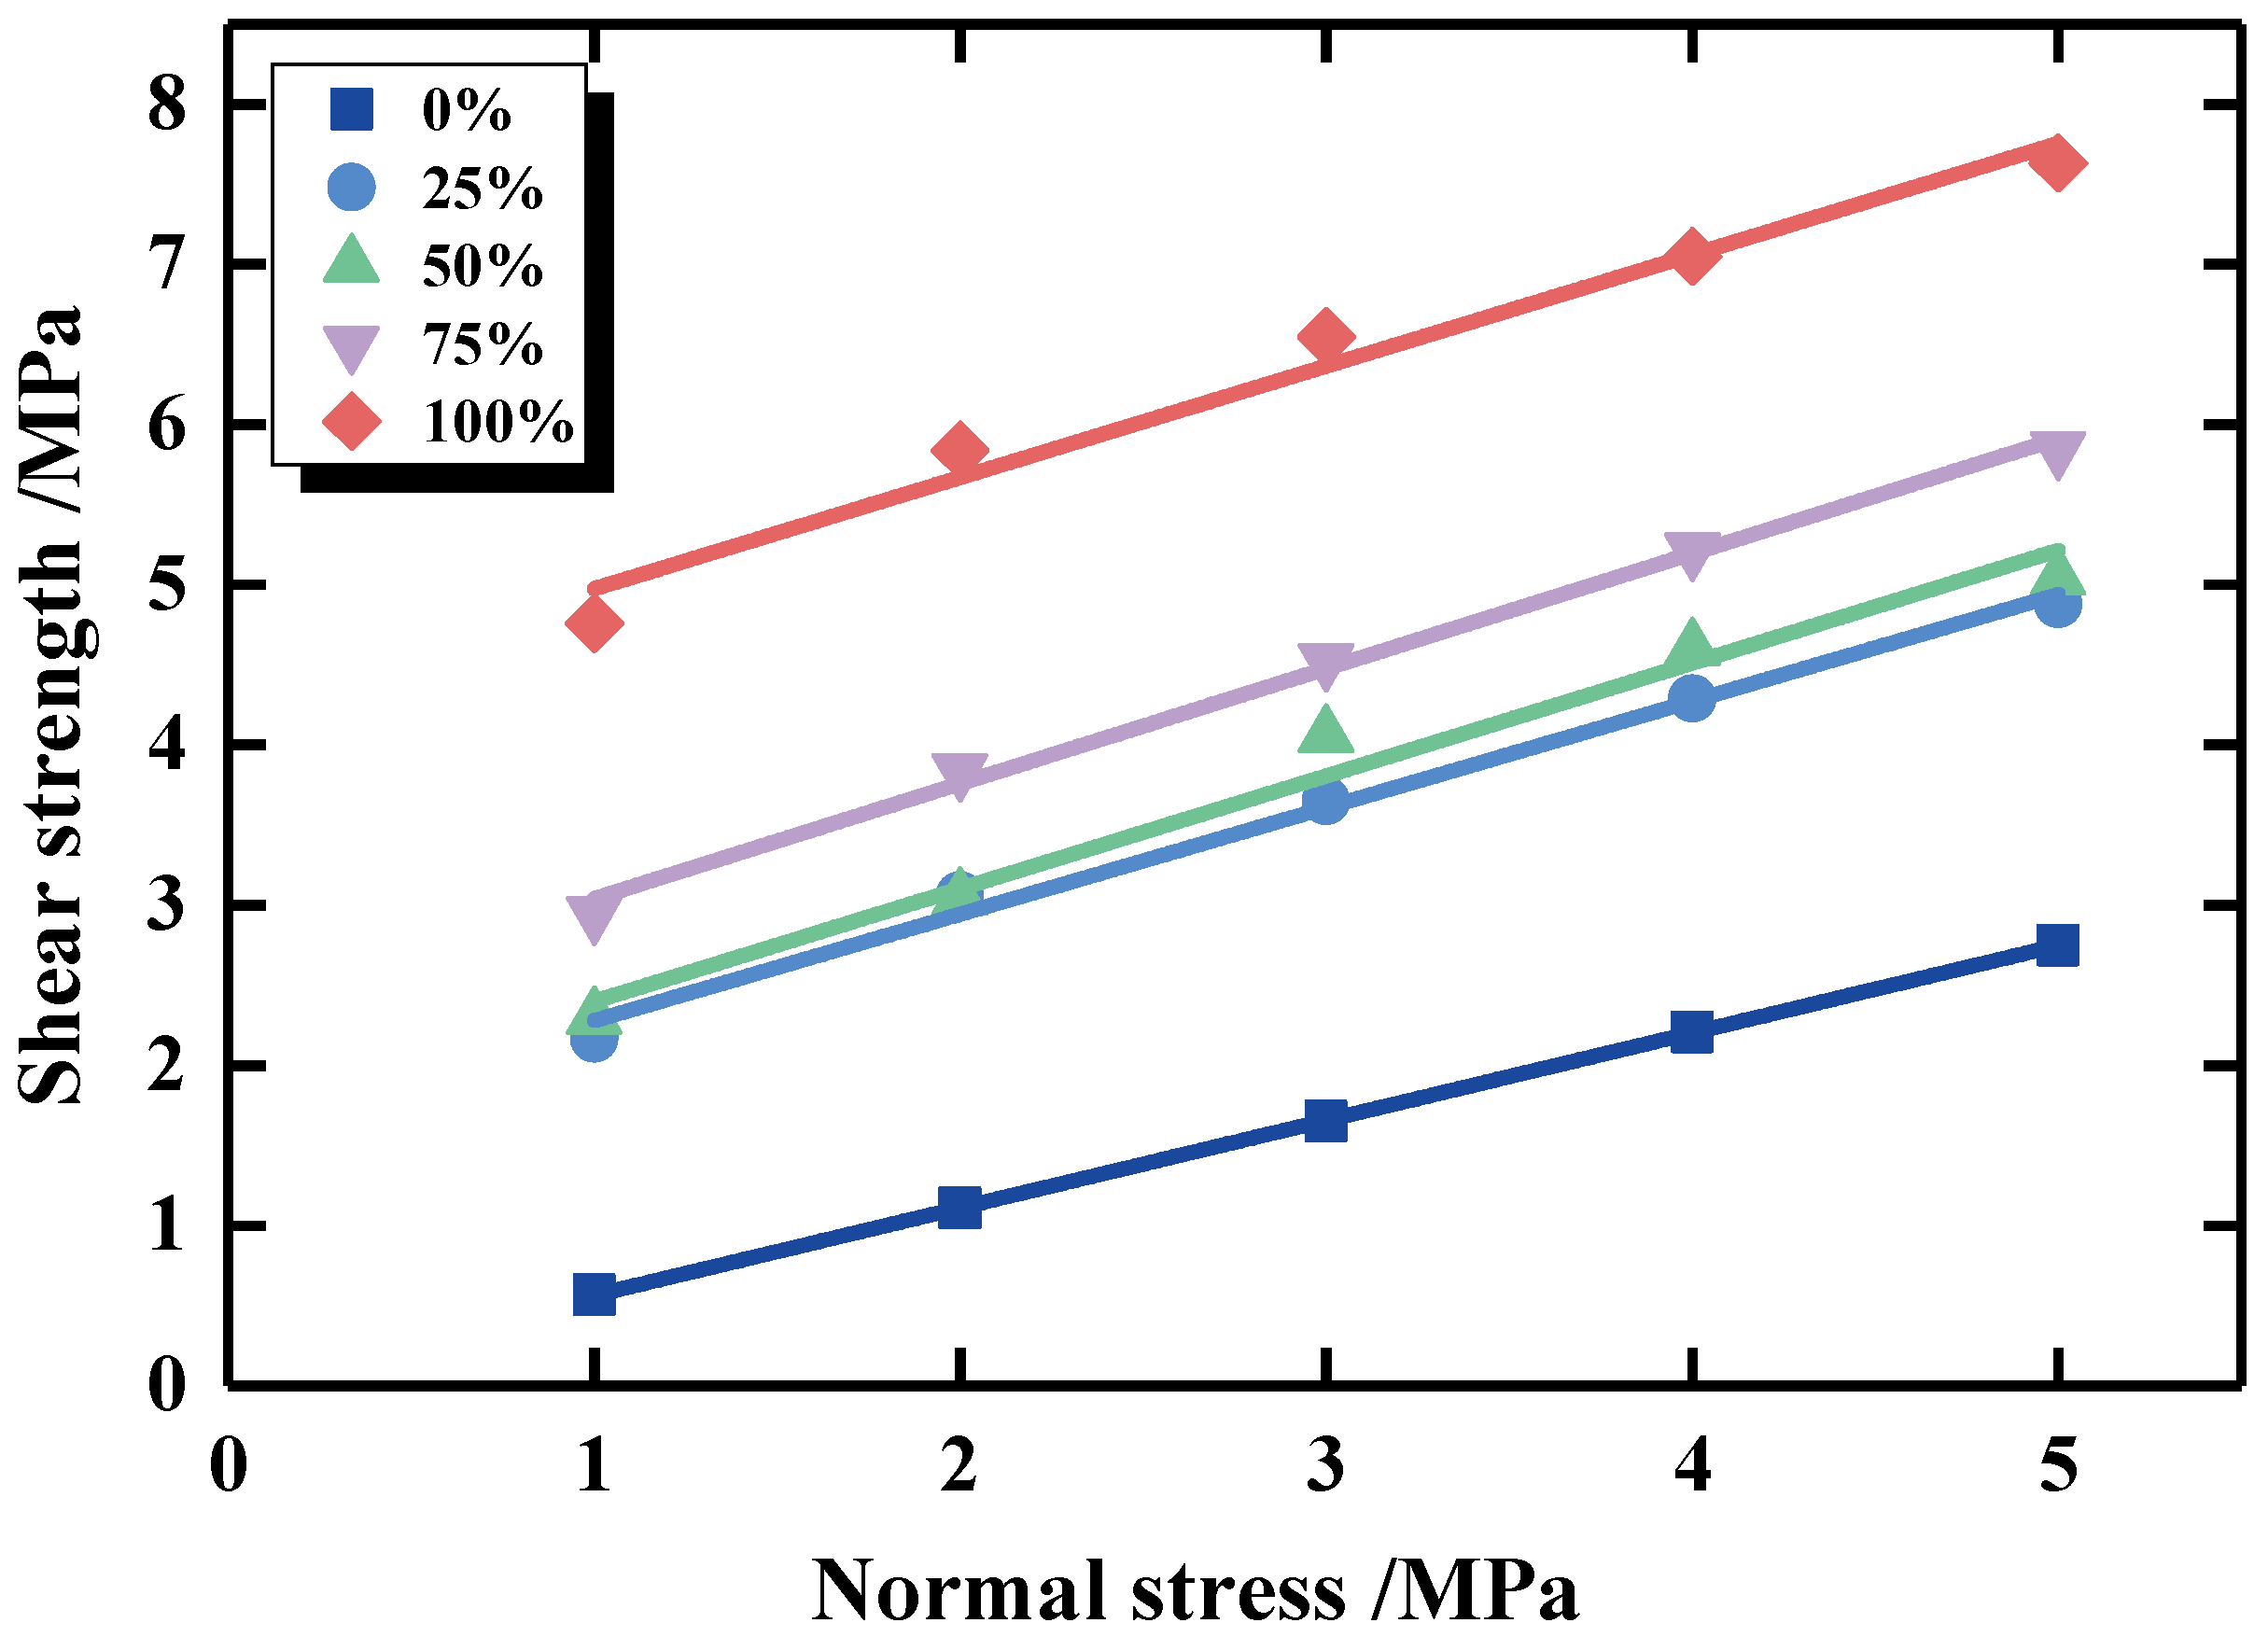
3.2. Influence of Bonded Conditions on Strength Parameters

To investigate the influence of bonded conditions on the strength parameters of the binary interfaces, the relationship between the shear strengths under different bonded conditions is firstly analyzed, and then cohesion and friction coefficients are obtained by fitting. The shear strengths of binary interfaces with various bonded degrees under different normal stresses are shown in Figure 3. Obviously, the shear strength of the binary interface shows a good linear relationship with the normal stress, which conforms to the Mohr–Coulomb criterion. This also provides further evidence of the validity of the simulation results. Beyond that, it can be seen that the bonded degree has a significant influence on the shear strength of the binary interface; the higher the bonded degree, the greater the shear strength.
For a more intuitive observation of the influence of the bonded degree on the shear strength of the binary media, the strength factor θ is established to characterize the relationship between the shear strength of the partially bonded binary interfaces and the fully bonded as well as the unbonded binary interfaces. The strength factor θ is the approximation representation of the shear strength of partially bonded binary interfaces to that of the fully bonded binary interfaces, which can be calculated by Equation (1).
θ = τ p τ u / τ b τ u
where τp is the partially bonded binary interface shear strength; τu is the unbonded binary interface shear strength; τb is the fully bonded binary interface shear strength. The strength factor of the unbonded binary interface is 0, and the strength factor of fully bonded binary interface is 1.
According to the definition of strength factor, the values of strength factor for different bonded conditions are obtained and further analyzed (as shown in Figure 4). As the bonded degree increases from 0% to 25%, the shear strength increases significantly, and the θ also greatly rises, with a slope greater than 1. Meanwhile, the increase in shear strength is relatively small when the bonded degree increases from 25% to 50% and 75%, and the rise in θ slows down, with slopes of less than 1. Additionally, the increase in shear strength is greater when the bonded degree is increased from 75% to 100%, and θ also rises significantly with a slope greater than 1. Therefore, it can be noted that the change rate of the strength factor is greater than 1, and the variation of the shear strength of the binary interface is significant when the bonded state is transformed among unbonded, partially bonded and fully bonded. While in the partially bonded state, the change in bonded degree has a relatively small effect on the shear strength. This may be attributed to the specificity of the bonded state of the interface. Relative to unbonded interfaces, partially bonded interfaces allow for a substantial increase in shear resistance due to the high cohesion that the bonded portion can provide. Compared to fully bonded interfaces, partially bonded interfaces have a substantially lower shear resistance for a certain percentage of the non-bonded region since it corresponds to a large fracture and cannot provide cohesion.
Based on the nature of the curves, the strength parameters of the interfaces are derived, which are shown in Table 4. The cohesion of binary interfaces is 0 MPa in the unbonded state and up to 4.25 MPa in the fully bonded state, while the cohesion of partially bonded interfaces ranges from 1.56 MPa to 2.25 MPa. The increase in cohesion is very significant during the transition process from an unbonded state to a partially bonded state (25%), as well as during the transition from a highly bonded state (75%) to a fully bonded state. It is evident that the influence of the bonded state on cohesion is considerable. In contrast, the bonded state has less influence on the friction coefficient and is almost the same as the other states, with a magnitude of about 0.7. This may be caused by the fact that the friction coefficient is mainly related to the nature of the material and the morphology of the damaged surface. Whether the material is bonded or not, the nature of the material remains unchanged, and the sliding surface in the unbonded state is flat and straight, while the damaged surface of the binary interface in the bonded state is not, which increases the friction coefficient.

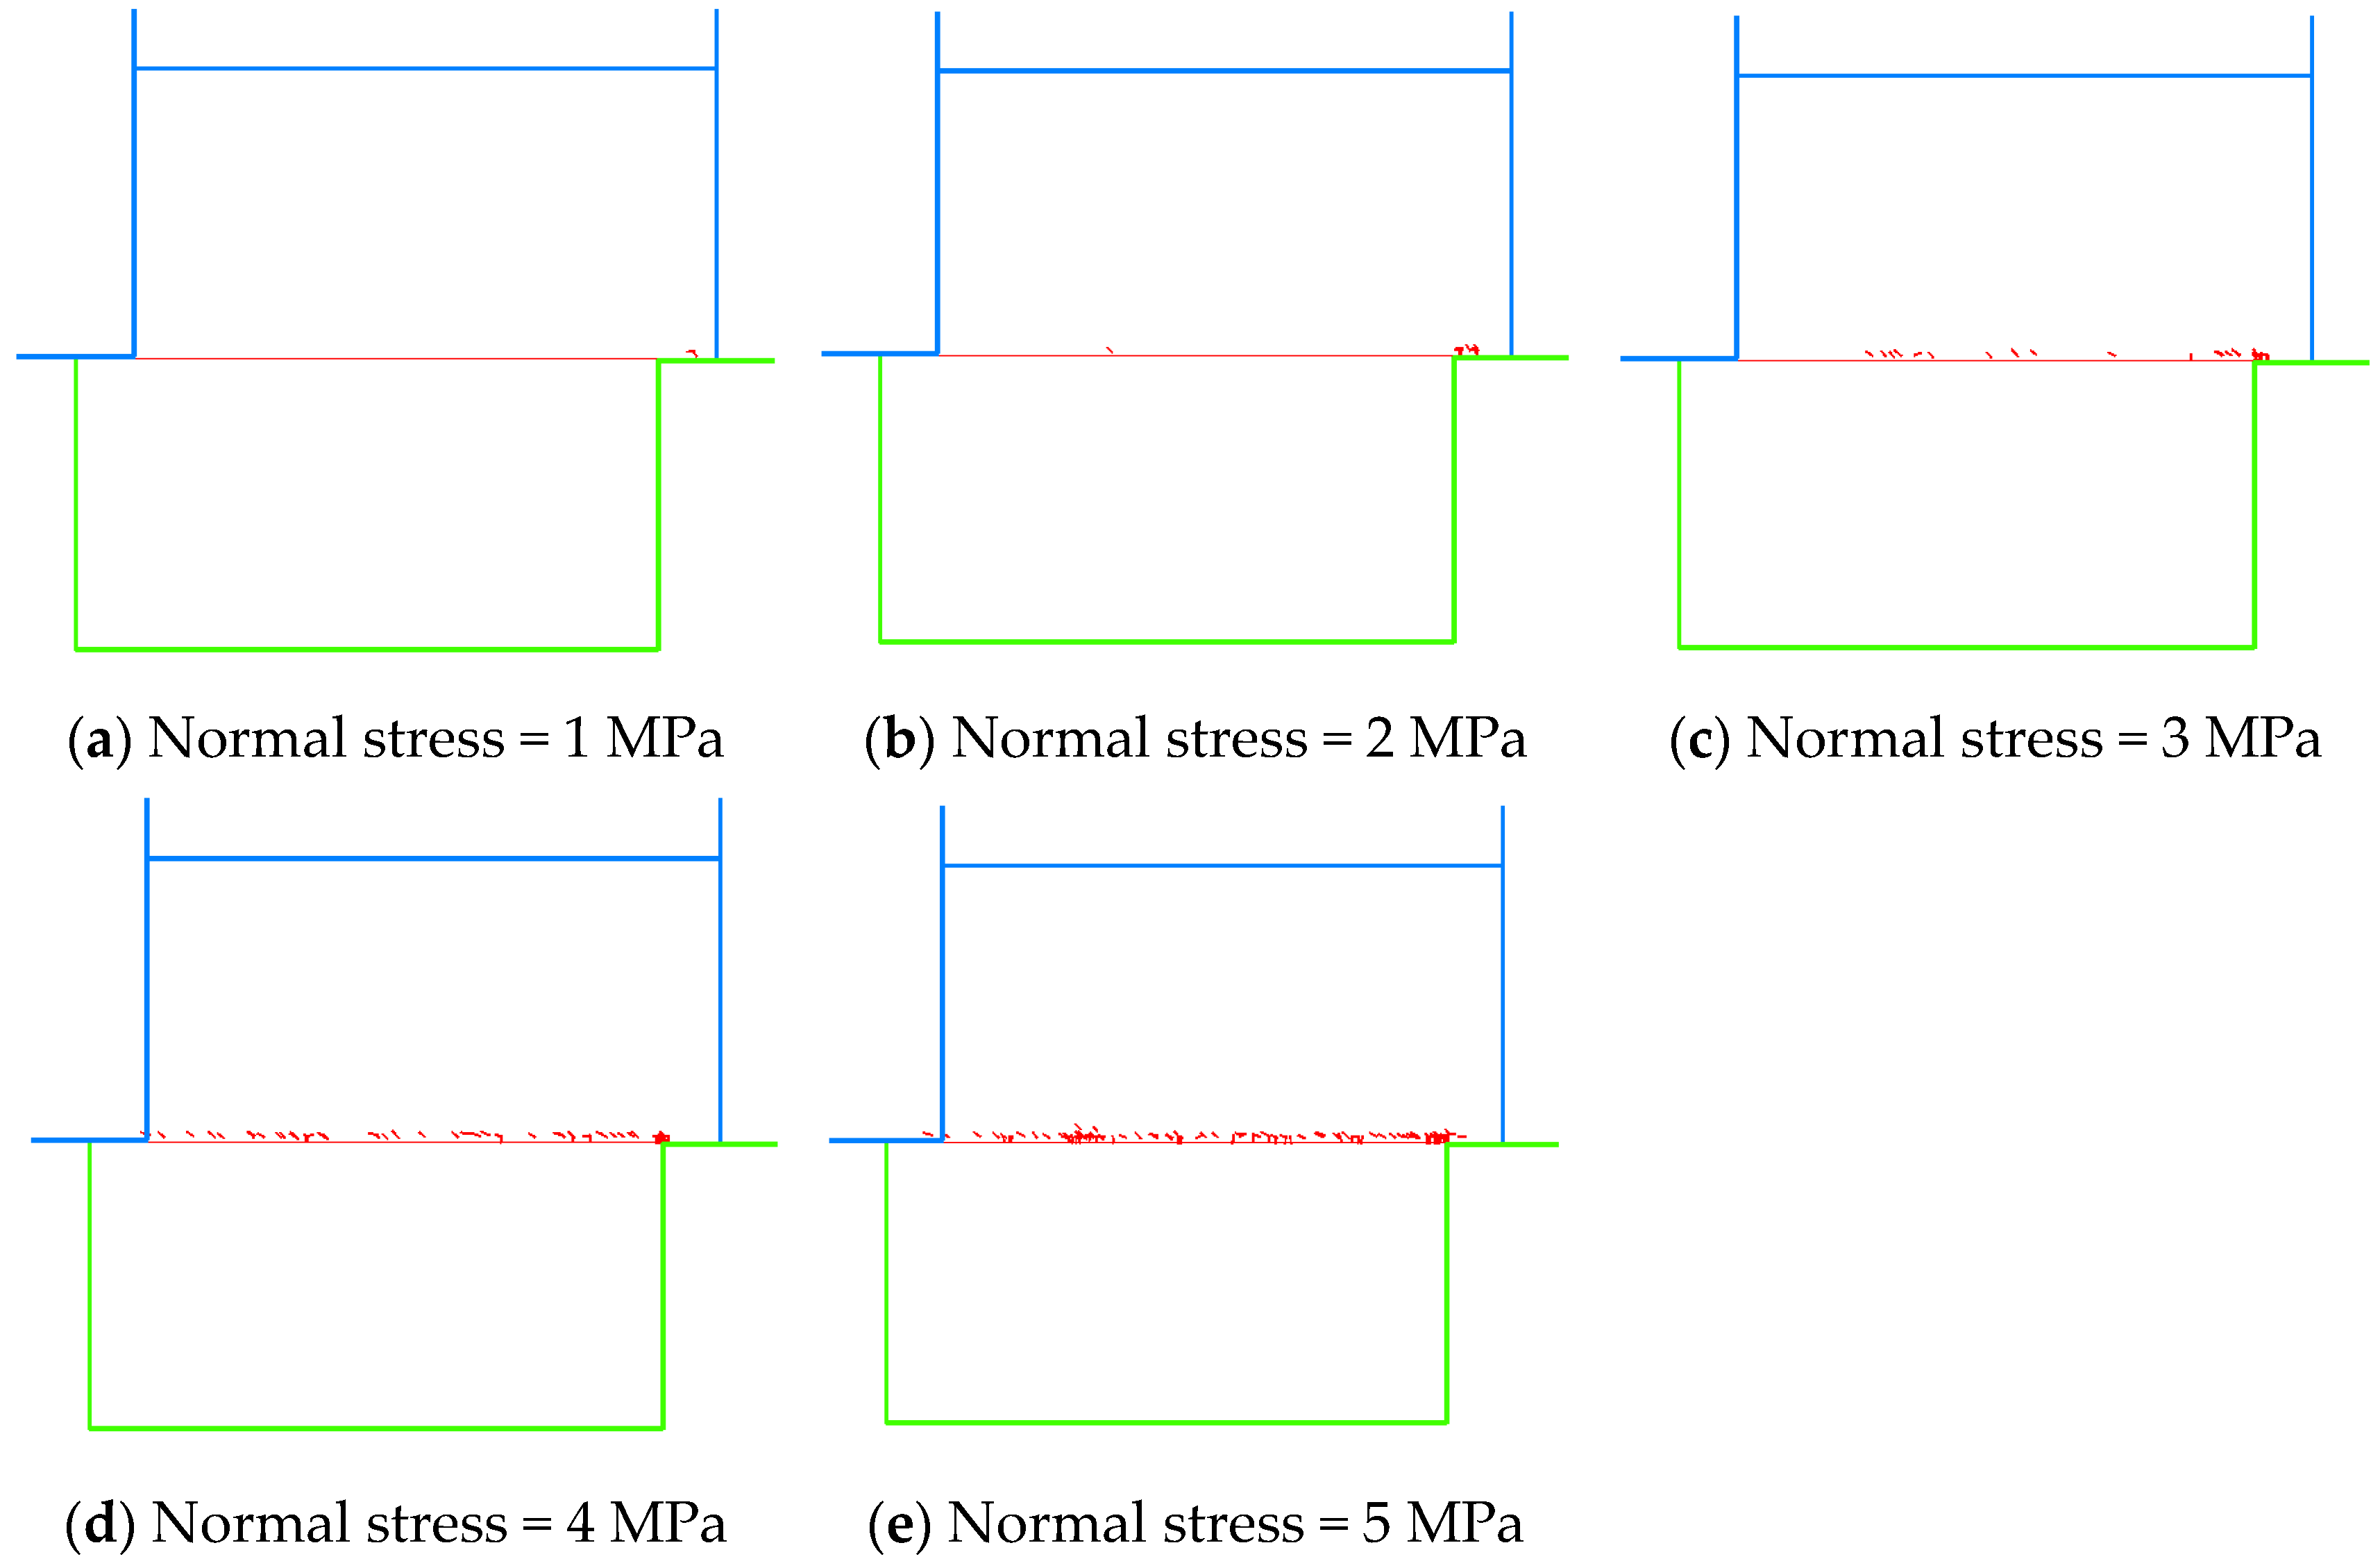
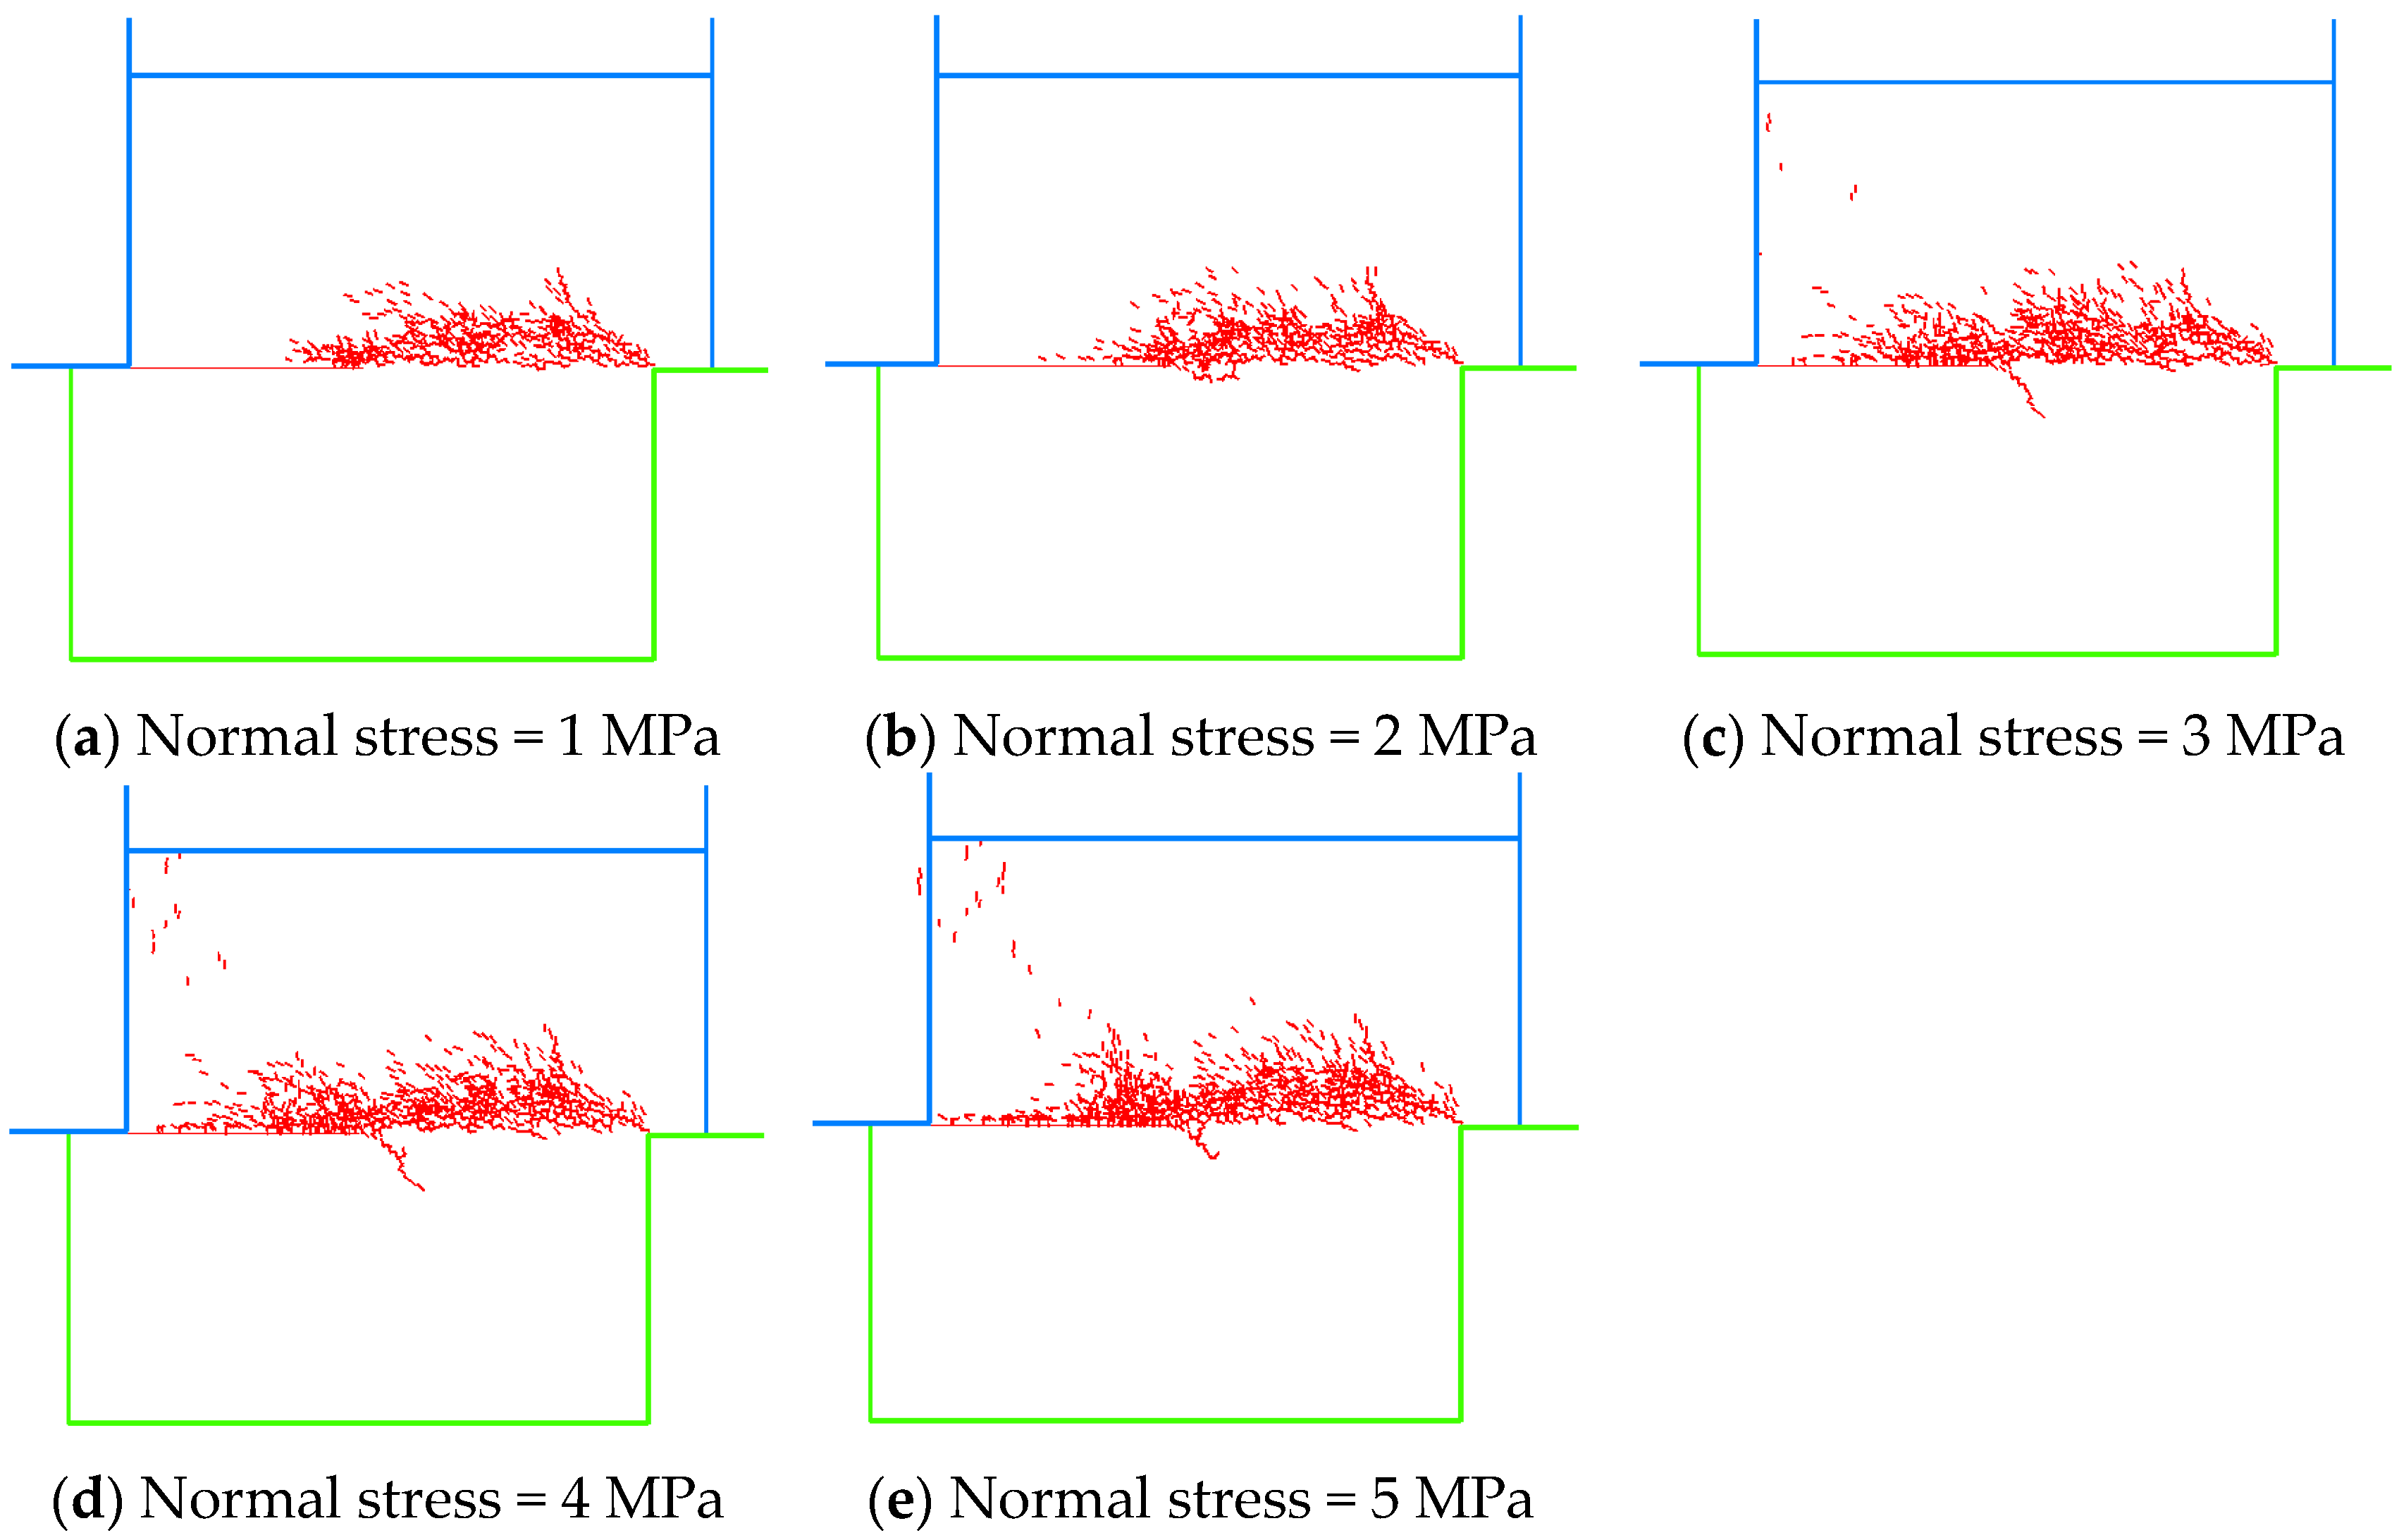
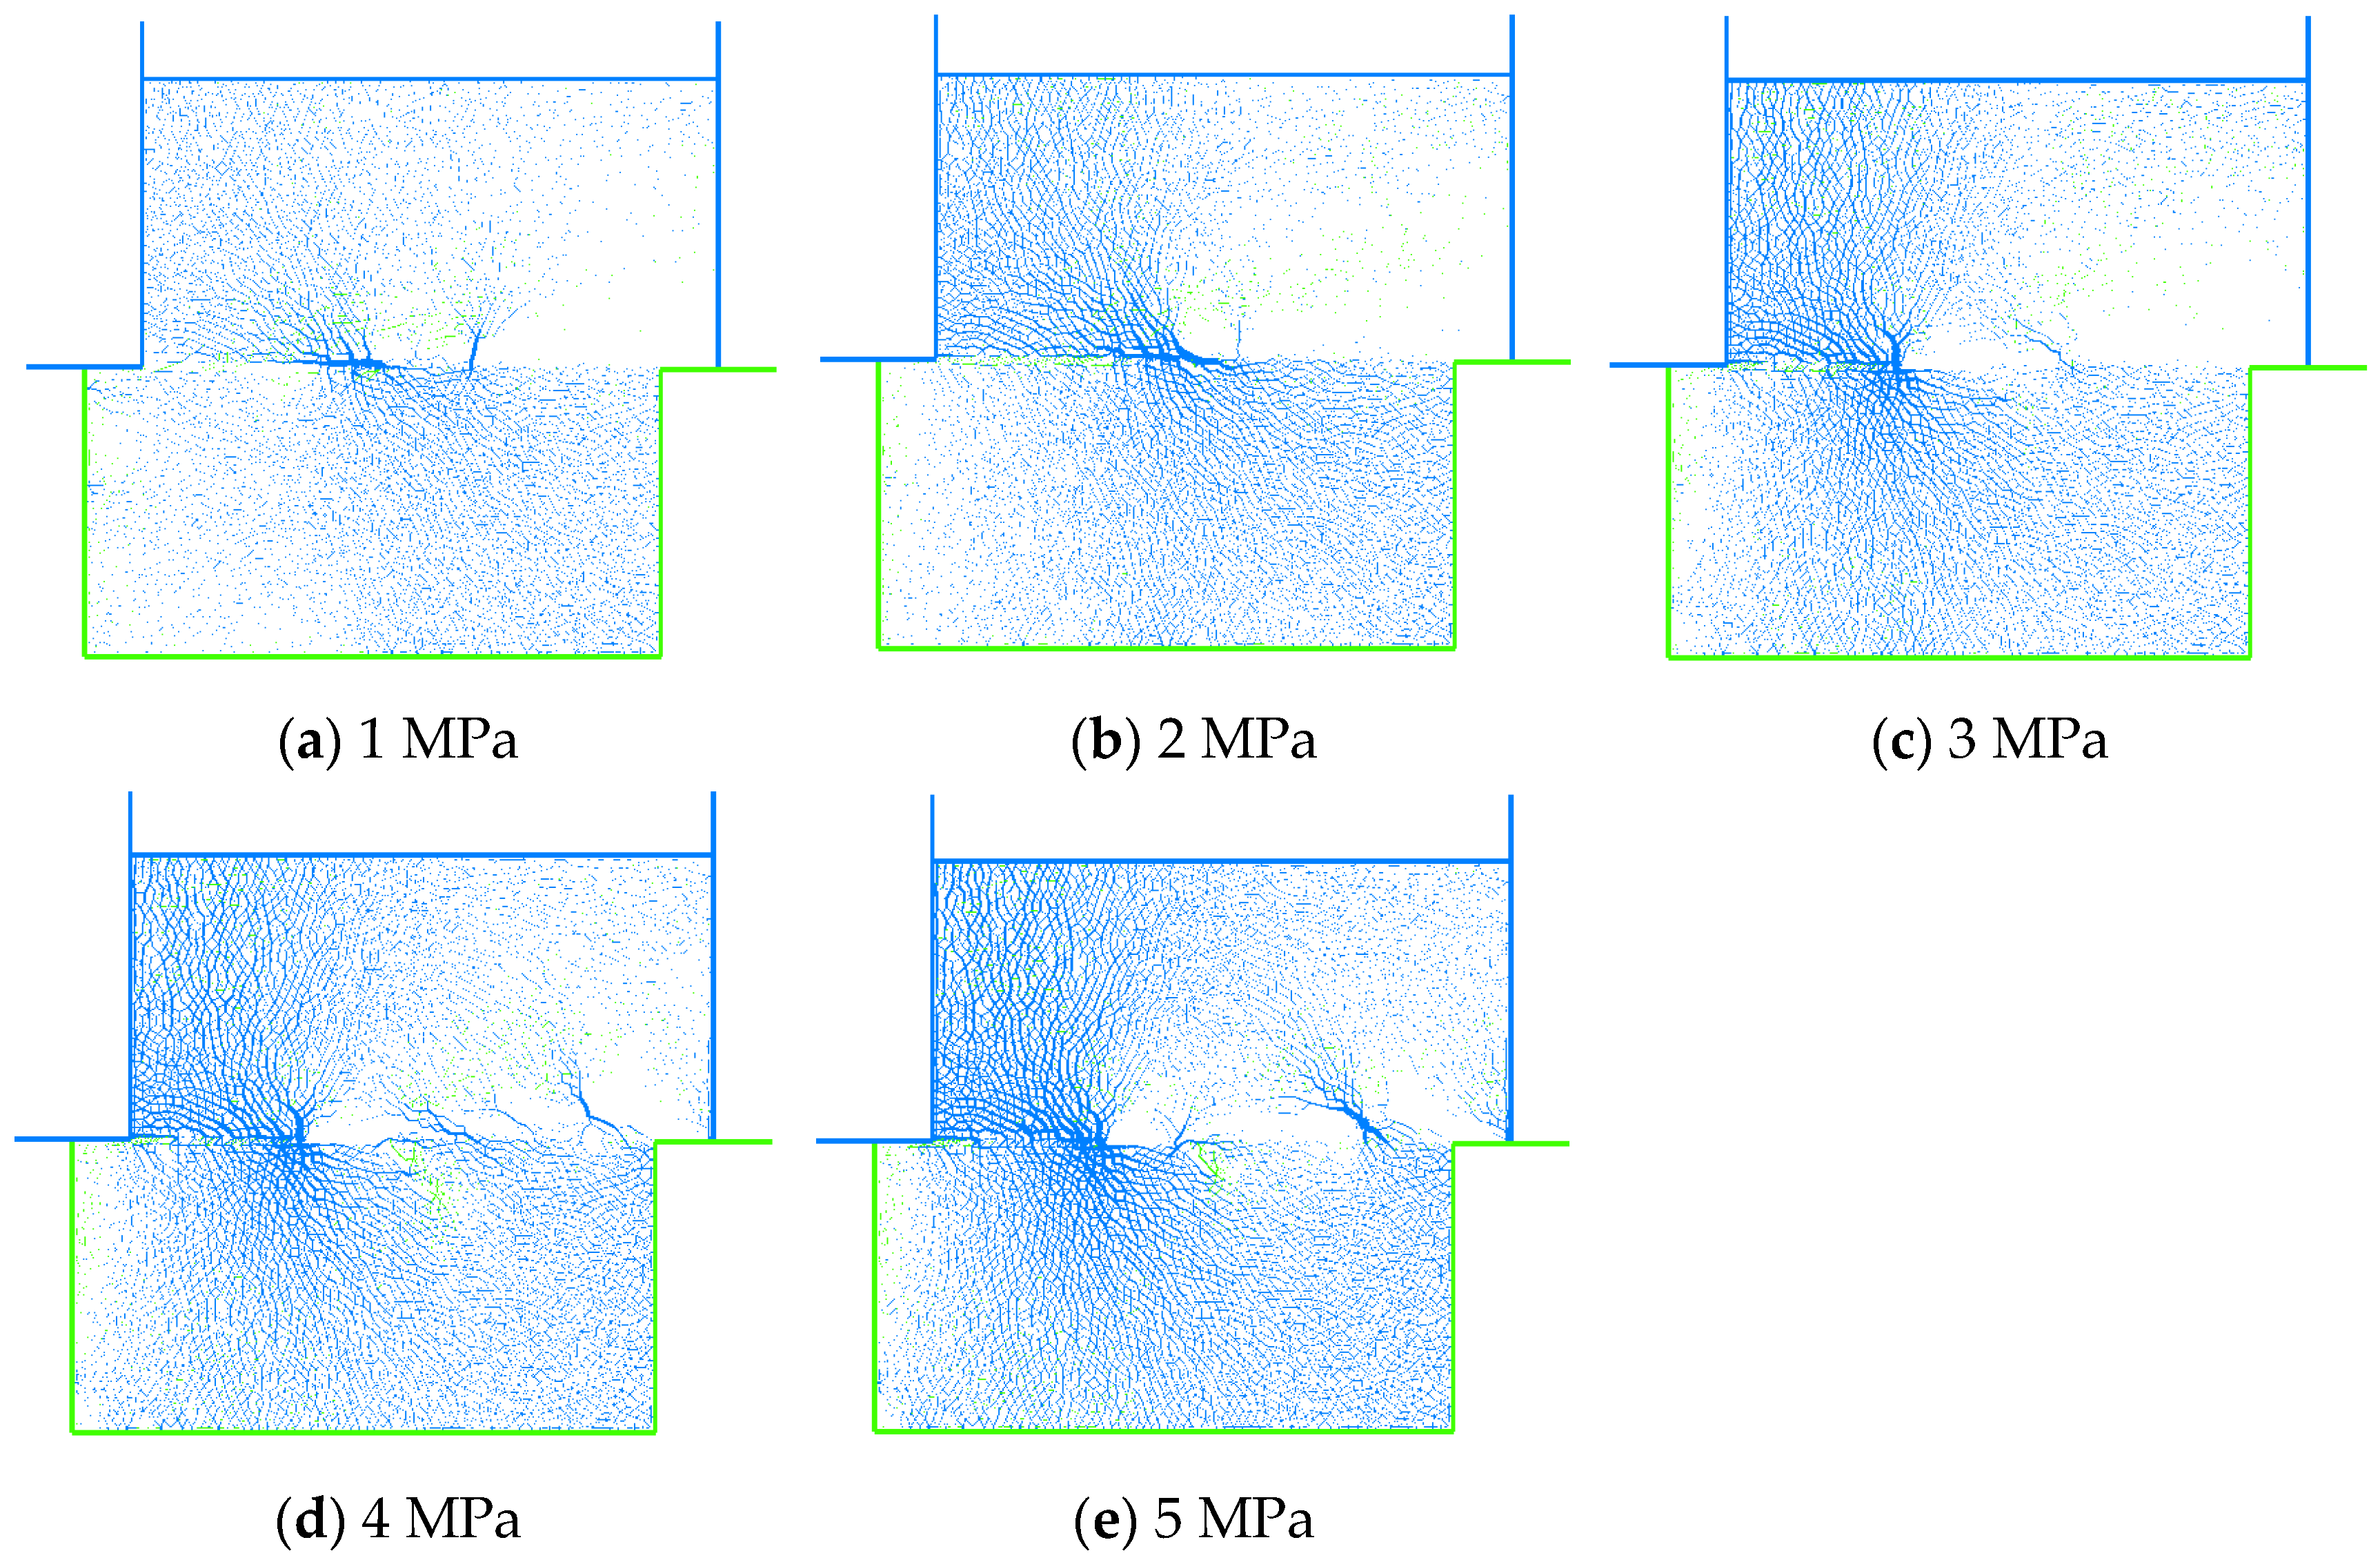
3.3. Influence of Bonded Conditions on Crack Development

For a better understanding, the change in crack number in the shear process is analyzed first, and then the influence on the damage pattern is investigated in conjunction with the distribution of the fractured region. According to Figure 3, Figure 4, Figure 5 and Figure 6, the following conclusions can be obtained.
(1) Binary interfaces in an unbonded state have almost no cracks generated during the shear process, which owes to the fact that unbonded interfaces are completely straight and penetrating, and the rock blocks on both sides are not significantly damaged during shearing. However, since the interface is not spatially “absolutely straight”, a small number of cracks can occur locally during the shearing process. This mainly occurs during the stress rise period before the peak and corresponds to a displacement interval of 0~1 mm.
(2) For bonded binary interfaces, cracks develop significantly during shear, which can be divided into three stages. The number of cracks hardly grows in the first stage, which indicates that the elastic deformation of the binary interfaces in this stage is able to resist the shear stress generated by the shear movement well. However, it is insufficient near the peak, and cracks begin to develop. The number of cracks rises sharply in the second stage, and the development of cracks further reduces the bearing capacity of the interfaces, leading to more cracks, which corresponds to the displacement interval of 1~4 mm. The growth rate of cracks in the third stage slows down substantially relative to the second stage because the bonded part of the binary interfaces has been damaged at this time, the shear failure surface has been formed, and the shear behavior in this stage is dominated by sliding, which produces fewer cracks.
The number of cracks is strongly related to the bonded condition of interfaces. As can be seen in Figure 3, Figure 4, Figure 5 and Figure 6, more cracks appear in the shear process of the binary interfaces with larger bonded degrees, which is due to the fact that the cracks mainly occur in the bonded region. From the slope of the curve, the greater the bonded degree, the greater the crack growth rate and the more complex the crack growth. At a lower bonded degree, the slope of the curve in the stress drop section changes little, indicating stable crack development. Meanwhile, in the case of a larger bonded degree, such as 75% and 100% bonded interfaces, the crack growth rate is extremely fast at the initial stage of the stress drop section and slows down significantly at the later stage. In the shear residual stage, the rate of crack development has slowed down to a great extent, but it is still increasing. In terms of the curve slope, the binary interface with a greater bonded degree has a faster crack growth rate in the residual phase, as well as for normal stress. This also indicates that the greater the bonded degree, the greater the roughness of the failure surface.
The region of crack development is influenced by the variability of the rock blocks on both sides of the interface. Crack development of interfaces when the shear displacement is 10 mm in the unbonded condition, 50% partially bonded condition and fully bonded condition are presented in Figure 7, Figure 8 and Figure 9, wherein the red line is the interface, and the red dots represent cracks. For unbonded interfaces: (1) when the normal stress is 1 MPa, almost no cracks appear; (2) when the normal stress is 2 MPa, only a small number of cracks appear on the right side of the interface; (3) when the normal stress is 3 MPa, obvious cracks appear on the interface, and there are distributions in many regions with a small number of cracks; (4) when the normal stress is 4 MPa, cracks are uniformly distributed in most of the interface; (5) when the normal stress is 5 MPa, cracks are uniformly distributed in all the regions. Hence, the number of cracks increases significantly with increasing normal stress the more uniformly they are distributed on the interface.
It can also be observed that cracks occur on the upper side of the interface, i.e., in the lower strength block. For the higher strength block, cracks rarely occur. Cracks in the unbonded state are mostly generated by friction degradation due to friction interlocking of particle bulges on both sides of the interface. Meanwhile, the particles of higher strength block have stronger cohesion and thus have higher resistance to internal locking damage, which is the reason why cracks are more likely to occur on the upper block. Moreover, the cracks basically appear near the interface and show no tendency to develop internally. This is because the generation of cracks is just the disappearance of particle friction interlocking, and the shapes of interfaces become flatter, reducing the possibility of further particle friction interlocking.
The development of cracks in the 50% bonded binary interface is presented in Figure 8. Compared with the failure of the unbonded binary interface, its cracks are obviously increasing, and the distribution is more complicated. When the normal stress is 1 MPa, the cracks are distributed on the upper block of the interface and concentrated around the bonded part, and cracks develop upwards. At the normal stress of 2 MPa, cracks still appear mainly in the bonded region at the interface, but they also begin to appear at the boundary between the bonded and unbonded portions, with a tendency to expand further to the unbonded portion. When the normal stress is 3 MPa, cracks are no longer concentrated only in the bonded region of the interface but are also distributed in the unbonded region. There are also obvious long cracks, which initiate from the boundary between the bonded and unbonded regions. Meanwhile, a small number of cracks appear inside the upper block. At the normal stress of 4 MPa, the main features of the fracture distribution are similar to those at the normal stress of 3 MPa, while the cracks inside the upper block further increase. When the normal stress is 5 MPa, the crack distribution is also similar to that at 3 MPa or 4 MPa, and the cracks in the upper block show a tendency to penetrate along the extension direction of long cracks in the lower block.
During shearing, the unbonded portion of the interface comes into contact with the damaged surface created by the bonded portion. Since the contact surface is not smooth, new shear degradation is bound to occur, leading to the generation of new cracks. In the process, the upper block produces a large number of cracks due to its low strength. Stress concentrations occur at the boundary between the bonded and unbonded regions at the interface, which produces large bending moments and tensile stress at high normal stress, leading to long cracks in the lower block. The upper block is also subjected to a corresponding reaction force, so there is a tendency for internal cracks to penetrate.
The fully bonded binary interface shear exhibits significantly different properties from both unbonded and partially bonded binary interfaces during the shear process. Regardless of the magnitude of the normal stress, cracks are distributed throughout the interface and are mostly located in the weaker block (see Figure 9). There are obvious cracks on the left boundary, accompanied by a long crack in the lower block. As the normal stress increases, more cracks are distributed in the upper block.
In the shear process of a fully bonded binary interface, the damaged surface basically exists in the weaker block because of its low strength. Moreover, once the failure surface is formed, the ability of the weaker block to resist damage is further reduced, so the main development direction of cracks is also toward the weaker block.

3.4. Influence of Bonded Conditions on Stress Distribution

The state of stress distribution at the same displacement inside the interface model under different bonded conditions are plotted in Figure 10, Figure 11 and Figure 12, in which the stress is represented by blue. According to Figure 10, the stress distribution during shearing of the unbonded binary interface is relatively uniform, and whatever the normal stress is, there is no obvious stress concentration inside the model, with only a slight tendency on the right, which corresponds to a larger number of cracks. This stress concentration is mainly caused by the lower rock mass being subjected to the shear and pressure of the upper rock mass, as well as the absolute restriction by the right wall.
At a bonded degree of 50%, a significant stress concentration occurs during shear at the binary interface, which is located in the middle of the interface, i.e., the boundary between bonded and unbonded parts. This may be explained by the varying degrees of coordination deformation of the blocks at the boundary, which in turn leads to the concentration of compressive stresses. As the normal stress increases, the area of stress concentration will slowly move to the left, and thus, cracks start to expand to the unbonded part.
At any normal stress, the left of the binary interface model in the fully bonded state is a clear stress concentration region. This is caused by the fact that the left model is directly extruded by the wall; the upper block stays in line with the wall displacement, while the lower block remains essentially immobile, resulting in extremely non-coordinated deformation in this region. Under high stress, multiple stress concentration regions appear on the failure surface, which are caused by the interlocking of asperities on both sides of the failure surface and further shear degradation.

4. Discussion

Under the influence of a variety of factors, a large number of partially bonded rock–mortar interfaces usually exist in rock engineering structures, which is rarely explored in the current research. Therefore, by assigning different bonded conditions to the numerical models of rock–mortar interfaces, the shear behavior of partially bonded rock–mortar interfaces was investigated in this study. Meanwhile, the fully bonded binary interface in the course study was simulated by assigning a rock–mortar interface model with the 100% bonded condition. Based on the comparison between the numerical results of the rock–mortar interface model with 100% bonded conditions and those of partially bonded rock–mortar interfaces, the comparison between the simulation results of this study and those of the current work was realized so as to analyze the influence of bonded conditions on the deformation pattern, strength characteristics, fracture mode and stress distribution from both macro and micro viewpoints. This is also the most important innovation of this study, which makes up for the deficiency of current relevant research to a certain extent. It contributes to the in-depth understanding of the shear mechanical interaction between rock and mortar, especially the variation of shear mechanical properties under different bonded degrees. Meanwhile, studying the change of interface shear resistance under different bonded degrees can provide a scientific basis for optimizing the construction process and improving the quality and life of the project.
Of course, there are some areas for improvement in this study. One of the biggest shortcomings is the failure to validate the simulation results against experiments due to the difficulty of sample preparation. Nevertheless, it is still believed that the findings are of great value for the following research since some measures to ensure the validity of the simulation results have been taken. In addition, these are qualitative analyses of the rock–mortar binary interface and further research will be conducted from a quantitative perspective to form a systematic and complete theoretical system for better application in guiding engineering construction. If it can be combined with intelligent algorithms, it will greatly simplify the application and achieve more satisfactory results.

5. Conclusions

Due to the wide usage of concrete in rock-based engineering, rock–mortar binary interfaces under different bonded conditions have become a common occurrence, which greatly affects the stability of engineering structures. In this case, the shear performances of rock–mortar binary interfaces under different bonded conditions are investigated by PFC in this study, and the main conclusions are as follows.
(1) Before the peak, the shear stress–shear displacement shows an obvious plastic phase for a 25% bonded interface. With the increased bonded degree of the binary interface, the plastic phase gradually disappears, and the peak displacement is also decreasing. After the peak, the greater the bonded degree of the interface, the rougher the curve in the residual stage.
(2) Under different normal stresses, the shear strength of the binary interface increases with the increased bonded degree, which was quantitatively characterized and intuitively compared by introducing the strength factor. Additionally, the bonded condition has little influence on the friction coefficient and shows a clear positive correlation with cohesion.
(3) Unbonded binary interfaces produce fewer cracks during shear. The cracking process at a bonded binary interface can be divided into three stages: the stress rise stage produces almost no cracks, the stress drop stage produces cracks faster and the residual stage produces cracks slowly. Bonded conditions have an effect on the crack distribution at the interface. The higher the bonded degree, the more uniform the distribution and the greater the crack number.
(4) In the unbonded state, the stress distribution at the interface is relatively uniform. In the 50% bonded state, the stress concentration occurs at the midpoint of the interface, which may be caused by the uncoordinated deformation. In the fully bonded condition, the stress concentration region is mainly located on the left, as it is subjected to both the wall pressure and the lower block resistance. More stress concentrations may also occur elsewhere on the interface under higher normal stresses.

Author Contributions

Methodology, X.Z. and H.L. (Hang Lin); Software, H.L. (Haijun Lv); Validation, H.L. (Haijun Lv), L.H., X.Z. and H.L. (Hang Lin); Investigation, L.H. and X.Z.; Data curation, L.H.; Writing—original draft, H.L. (Haijun Lv), X.Z. and H.L. (Hang Lin); Writing—review & editing, H.L. (Haijun Lv), X.Z. and H.L. (Hang Lin). All authors have read and agreed to the published version of the manuscript.

Funding

This paper gets its funding from Project (2023JJ30657), supported by the Hunan Provincial Natural Science Foundation of China.

Data Availability Statement

The raw data supporting the conclusions of this article will be made available by the authors on request.

Acknowledgments

Jianhong Li, Yuanbo Wang and Qingchuan Zhang have given many good suggestions for this paper; the authors wish to acknowledge their support.

Conflicts of Interest

Author Haijun Lv was employed by the company CCCC First Harbor Engineering Company Ltd. The remaining authors declare that the re-search was conducted in the absence of any commercial or financial relationships that could be construed as a potential conflict of interest.

References

  1. Tang, Q.T.; Xie, W.B.; Jing, S.G.; Wang, X.K.; Su, Z.L. Experimental and Numerical Investigation on the Mechanical Behavior of Rock-Like Material with Complex Discrete Joints. Rock Mech. Rock Eng. 2024, 1–19. [Google Scholar] [CrossRef]
  2. Yan, Y.T.; Wang, S.W. Simulation investigation of mechanical and failure characteristics of jointed rock with different shapes of joint asperities under compression loading. Comput. Part. Mech. 2023, 10, 45–59. [Google Scholar] [CrossRef]
  3. Wang, S.C.; Yang, X.X.; Li, W.T.; Qiao, W.G. Influence of a Rock Bridge on the Shearing Behavior of Nonpersistent Rough Joints: An Experimental Study. Rock Mech. Rock Eng. 2023, 56, 2573–2588. [Google Scholar] [CrossRef]
  4. Lin, H.; Wang, M.; Xu, W. Shear Behaviors of the Binary Structural Plane. Geotech. Geol. Eng. 2018, 36, 939–948. [Google Scholar] [CrossRef]
  5. Sun, B.; Wang, P.; Zhang, G.; Deng, M.; Liu, W.; Xu, J. Endurance time history analysis of the seismic behavior and performance assessment of hydro-chemo-mechanical degradation-affected hydraulic tunnels with service time. Undergr. Space 2024, 17, 207–225. [Google Scholar] [CrossRef]
  6. Stavropoulou, E.; Dano, C.; Boulon, M. Shear Response of Wet Weak Carbonate Rock/Grout Interfaces Under Cyclic Loading. Rock Mech. Rock Eng. 2021, 54, 2791–2813. [Google Scholar] [CrossRef]
  7. Renaud, S.; Bouaanani, N.; Miquel, B. Experimental, analytical, and finite element assessment of the shear strength of concrete-rock interfaces at different scales. Int. J. Numer. Anal. Methods Geomech. 2021, 45, 1238–1259. [Google Scholar] [CrossRef]
  8. Wu, Q.; Xu, Y.; Tang, H.; Fang, K.; Jiang, Y.; Liu, C.; Wang, L.; Wang, X.; Kang, J. Investigation on the shear properties of discontinuities at the interface between different rock types in the Badong formation, China. Eng. Geol. 2018, 245, 280–291. [Google Scholar] [CrossRef]
  9. Chang, X.; Guo, T.; Lu, J.; Wang, H. Experimental study on rock-concrete joints under cyclically diametrical compression. Geomech. Eng. 2019, 17, 553–564. [Google Scholar] [CrossRef]
  10. Wang, X.; Cheng, H.; Yan, P.; Zhang, J.; Ding, Y. The influence of roughness on cyclic and post-cyclic shear behavior of red clay-concrete interface subjected to up to 1000 cycles. Constr. Build. Mater. 2021, 273, 121718. [Google Scholar] [CrossRef]
  11. Qiu, H.; Chen, B.; Wang, F.; Liao, F.; Wang, M.; Wan, D. Investigating dynamic fracture in marble-mortar interface under impact loading. Constr. Build. Mater. 2022, 336, 127548. [Google Scholar] [CrossRef]
  12. Tang, W.Y.; Lin, H.; Chen, Y.F.; Feng, J.J.; Hu, H.H. Mechanical Characteristics and Acoustic Emission Characteristics of Mortar-Rock Binary Medium. Buildings 2022, 12, 665. [Google Scholar] [CrossRef]
  13. Yuan, W.; Min, M. Investigation on the scale dependence of shear mechanical behavior of rock joints using DEM simulation. Comput. Part. Mech. 2023, 10, 1613–1627. [Google Scholar] [CrossRef]
  14. Ghazvinian, A.H.; Taghichian, A.; Hashemi, M.; Mar’ashi, S.A. The Shear Behavior of Bedding Planes of Weakness Between Two Different Rock Types with High Strength Difference. Rock Mech. Rock Eng. 2009, 43, 69–87. [Google Scholar] [CrossRef]
  15. Cao, R.; Tang, W.; Lin, H.; Fan, X. Numerical Analysis for the Progressive Failure of Binary-Medium Interface under Shearing. Adv. Civ. Eng. 2018, 2018, 4197172. [Google Scholar] [CrossRef]
  16. Yan, Z.-X.; Long, Z.; Qu, W.-R.; Zhang, S.; Jiang, P. The effect of shear on the anchorage interface of rock slope with weak layers under earthquake. Rock Soil Mech. 2019, 40, 2882–2890. [Google Scholar] [CrossRef]
  17. Wang, H.-W.; Wu, Z.-M.; Wang, Y.-J.; Yu, R.C. Investigation on crack propagation perpendicular to mortar-rock interface: Experimental and numerical. Int. J. Fract. 2020, 226, 45–69. [Google Scholar] [CrossRef]
  18. Qiu, H.; Zhu, Z.; Wang, F.; Wang, M.; Zhou, C.; Luo, C.; Wang, X.; Mao, H. Dynamic behavior of a running crack crossing mortar-rock interface under impacting load. Eng. Fract. Mech. 2020, 240, 107202. [Google Scholar] [CrossRef]
  19. Han, L.; Lin, H.; Chen, Y.; Lei, D. Effects of strength property difference on shear strength of joint of binary media. Environ. Earth Sci. 2021, 80, 712. [Google Scholar] [CrossRef]
  20. Tang, W.Y.; Lin, H. Influence of Internal Friction Angle and Interface Roughness on Shear Behavior of Mortar-Rock Binary Medium Joint. Geotech. Geol. Eng. 2021, 39, 3917–3929. [Google Scholar] [CrossRef]
  21. Lin, H.; Han, L.; Wang, Y.X.; Cao, R.H.; Zhao, Y.L.; Jiang, C. Influence of the Micro-deformation Characteristics of Binary Media on the Shear Behavior of Structural Plane. Geotech. Geol. Eng. 2021, 39, 347–358. [Google Scholar] [CrossRef]
  22. Fei, F.; Choo, J.; Liu, C.; White, J.A. Phase-field modeling of rock fractures with roughness. Int. J. Numer. Anal. Methods Geomech. 2022, 46, 841–868. [Google Scholar] [CrossRef]
  23. Yu, D.; Liu, E.; Sun, P.; Xiang, B.; Zheng, Q. Mechanical properties and binary-medium constitutive model for semi-through jointed mudstone samples. Int. J. Rock Mech. Min. Sci. 2020, 132, 104376. [Google Scholar] [CrossRef]
  24. Wang, H.; Sun, H.; He, Y.; Su, P. Stick-slip behaviour of mortar-rock interface under high loading rate. Proc. Inst. Civ. Eng.-Geotech. Eng. 2021, 174, 19–32. [Google Scholar] [CrossRef]
  25. Dong, W.; Yuan, W.; Zhang, B.; Zhong, H. Energy-Based Fracture Criterion of Rock-Concrete Interface Considering Viscoelastic Characteristics. J. Eng. Mech. 2022, 148, 04021155. [Google Scholar] [CrossRef]
Figure 1. Particle modeling of binary interface in PFC. (a) Shear model of binary interface; (b) 0% bonded ratio; (c) 25% bonded ratio; (d) 50% bonded ratio; (e) 75% bonded ratio; (f) 100% bonded ratio. (# indicates the number of different shear box blocks. The red region means the degree of bonded ratio, other colors represent different locations of the cut box).
Applsci 14 03686 g001
Figure 2. The shear stress–shear displacement curves of binary interfaces under different bonded conditions. (a) Bonded ratio = 0%; (b) bonded ratio = 25%; (c) bonded ratio = 50%; (d) bonded ratio = 75%; (e) bonded ratio = 100%.
Applsci 14 03686 g002
Figure 3. Shear strength of binary interfaces for different bonded conditions.
Applsci 14 03686 g003
Figure 4. Variation of strength factor with bonded ratio.
Applsci 14 03686 g004
Figure 5. Strength parameters of binary interfaces under different bonded conditions.
Applsci 14 03686 g005
Figure 6. Crack development in binary interfaces under different bonded states. (a) Unbonded binary interfaces; (b) 25% bonded binary interfaces; (c) 50% bonded binary interfaces; (d) 75% bonded binary interfaces; (e) 100% bonded binary interfaces.
Applsci 14 03686 g006aApplsci 14 03686 g006b
Figure 7. Crack development of interface in unbonded condition (the red region means the distribution of cracks).
Applsci 14 03686 g007
Figure 8. Crack development of interface in 50% bonded condition (the red region means the distribution of cracks).
Applsci 14 03686 g008
Figure 9. Crack development of interface in fully bonded condition (the red region means the distribution of cracks).
Applsci 14 03686 g009
Figure 10. Stress distribution in unbonded condition.
Applsci 14 03686 g010
Figure 11. Stress distribution in 50% bonded condition.
Applsci 14 03686 g011
Figure 12. Stress distribution in fully bonded condition.
Applsci 14 03686 g012
Table 1. Rock physical parameters and parameter calibration results [8].
RocksResultsPoisson RatioTangent Modulus/GPaUniaxial Compressive Strength/MPa
MudstoneTest0.3204.711.50
Simulation0.3214.711.39
LimestoneTest0.11442.651.80
Simulation0.11442.851.50
Table 2. Results of rock calibration parameters.
RocksRigidity
Ratio
Bonded
Modulus/GPa
Strength
Parameters/MPa
Max Particle Size/mmParticle Size Ratio
Mudstone80.4554.90.91.5
Limestone1.53.3017.80.91.5
Table 3. Smooth joint model parameters.
ModelNormal Stiffness/GPaTangential Stiffness/GPaFriction Coefficient
Smooth joint1000.80.54
Table 4. Fitted values of shear strength parameters.
Shear Strength ParametersBonded Conditions of Binary Interfaces
0%25%50%75%100%
Cohesion/MPa01.561.692.254.25
Friction coefficient0.530.660.690.690.69
Disclaimer/Publisher’s Note: The statements, opinions and data contained in all publications are solely those of the individual author(s) and contributor(s) and not of MDPI and/or the editor(s). MDPI and/or the editor(s) disclaim responsibility for any injury to people or property resulting from any ideas, methods, instructions or products referred to in the content.

