Article

Multi-Task Mean Teacher Medical Image Segmentation Based on Swin Transformer

1
School of Computer Science and Engineering, Xi’an University of Technology, Xi’an 710048, China
2
Shaanxi Province Key Laboratory of Network Computing and Security Technology, Xi’an University of Technology, Xi’an 710048, China
*
Author to whom correspondence should be addressed.
Appl. Sci. 2024, 14(7), 2986; https://doi.org/10.3390/app14072986
Submission received: 19 January 2024 / Revised: 1 March 2024 / Accepted: 4 March 2024 / Published: 2 April 2024
(This article belongs to the Special Issue Mobile Computing and Intelligent Sensing)

Abstract

:
As a crucial task for disease diagnosis, existing semi-supervised segmentation approaches process labeled and unlabeled data separately, ignoring the relationships between them, thereby limiting further performance improvements. In this work, we introduce a transformer-based multi-task framework that concurrently leverages both labeled and unlabeled volumes by encoding shared representation patterns. We first integrate transformers into YOLOv5 to enhance segmentation capabilities and adopt a multi-task approach spanning shadow region detection and boundary localization. Subsequently, we leverage the mean teacher model to simultaneously learn from labeled and unlabeled inputs alongside orthogonal view representations, enabling our approach to harness all available annotations. Our network can improve the learning ability and attain superior performance. Extensive experiments demonstrate that the transformer-powered architecture encodes robust inter-sample relationships, unlocking substantial performance gains by capturing shared information between labeled and unlabeled data. By treating both data types concurrently and encoding their shared patterns, our framework addresses the limitations of existing semi-supervised approaches, leading to improved segmentation accuracy and robustness.

1. Introduction

Deep convolutional neural networks have driven significant advancements in medical image analysis [1,2], substantially improving segmentation accuracy [3,4]. Numerous studies have demonstrated substantial enhancements and achieved cutting-edge performance such as cardiac [5,6,7] and abdominal [8,9] imaging. However, most deep learning systems rely on large labeled datasets to mitigate overfitting and ensure reliable generalization to unseen test data. Acquiring such extensive medical annotations poses significant challenges, as it requires domain expertise met only by well-trained specialists. Manual segmentation by radiologists is often inconsistent, resource-intensive, and time-consuming. Progress remains reliant on accessing abundant high-quality ground truths that encapsulate anatomical intricacies.
Mitigating the dependence on exhaustive annotations for training medical imaging models has garnered significant interest recently [10,11,12]. Our work targets semi-supervised learning to optimize segmentation using limited expert-labeled data and abundant unlabeled data. This approach facilitates economizing human effort while maximizing the utilization of all available samples [13].
Recent semi-supervised advances for medical segmentation focus on leveraging unlabeled data with consistency regularization. Specifically, mean teacher architectures promote consensus between student and teacher models for perturbed inputs [14]. Mean teacher paradigms utilize student–teacher frameworks to promote consensus between two networks. Alternatively, auxiliary tasks predicting boundary maps can provide additional constraints [15,16]. However, current approaches overlook inter-sample correlations and treat labeled and unlabeled data separately. Our core innovation lies in concurrently exploiting both annotated and unannotated images by deeply coupling their representations to share learned semantic patterns. We operationalize this via transformers within a mutually connected multi-task network.
Motivated by multi-task learning’s proven effectiveness in many applications of computer vision [12,17], we propose concurrently learning complementary shadow regions and shadow edge predictions to improve shadow detection using both global and local information [18]. In order to leverage multi-task learning principles, we synergistically combine a coarse global shadow region task with a fine-grained localized shadow edge task, allowing the model to integrate signals across multiple granularities and leverage both region-level and boundary-level cues to boost overall shadow segmentation accuracy through a complementary multi-task setup. Specifically, detecting shadow edges provides detailed constraints on shadow region boundaries.
To boost medical image segmentation, we develop a multi-task framework based on mean teacher called transYLmtMT. We first design a multi-task transformer-based YOLOv5 model, mt-transYL that jointly trains on two tasks: shadow region and edge detection. The mt-transYL incorporates transformers within YOLOv5 for encoding sequential interdependencies through self-attentions [19,20]. To retain fine-grained spatial details, we incorporate a hybrid architecture blending high-resolution decoders with contextual transformer encoders. This forms the base network operationalizing region and edge detection objectives. We employ the identical mt-transYL variant in a student–teacher arrangement with additional unsupervised regularizations. For labeled data, supervised losses monitor both tasks. Further, prediction consistency is enforced between student and teacher outputs on unlabeled samples.
By synergizing segmentation across granularities while concurrently leveraging labeled and unlabeled data, our framework targets advancing challenges constrained by limited annotations. The semi-supervised multi-task formulation combines benefits from transformer-based context modeling, pixel-level decoding, and transductive regularizations for optimizing utilization. Moreover, we present a segmentation framework that requires few labeled images and primarily leverages unlabeled data. Our framework uses a random propagation strategy and transformer model. Specifically, it selects a small number of labeled images at random and propagates their labels to unlabeled data to generate more supervision. The transformer model then learns from this combination of limited labeled examples and abundantly available unlabeled images.
Our major contributions can be concluded as follows:
  • We introduce a multi-task YOLOv5 with transformer (mt-transYL) framework for concurrent lesion segmentation and boundary detection from medical scans. Our experiments demonstrate enhanced diagnoses from this joint learning formulation.
  • We introduce a student–teacher semi-supervised paradigm using consistency regularizations for further leveraging unlabeled data. Our mean teacher architecture exhibits strong self-ensembling capabilities amenable to limited annotation contexts.
  • Comprehensive evaluations showcase our framework surpassing cutting-edge standards under multiple few-shot regimes by effectively amalgamating representations from related learning objectives alongside unlabeled data.
In summary, by synergizing transformers, semi-supervised concepts, and multi-task learning through mutually connected student–teacher architecture, our approach sets new benchmarks to alleviate manual annotation dependencies in medical imaging applications.
The paper is structured as follows: Section 2 surveys the existing literature on segmentation tasks in medical images, semi-supervised learning, and transformer models. Section 3 puts forth our proposed framework, a multi-task mean teacher segmentation based on a transformer. Section 4 presents implementation details of the experiments and result analysis. Finally, Section 5 concludes by summarizing our contributions and discussing future avenues.

2. Related Works

2.1. Medical Image Segmentation

Recent studies have made significant progress and demonstrated commendable performance in advancing medical image segmentation algorithms. A comprehensive overview of current artificial intelligence studies pertaining to chest and breast CT image analysis is reviewed in [21,22], including some existing medical image segmentation methods [23], probabilistic models for handling noise [24]; U-Net for semantic segmentation [25] and attention mechanism for localizing organs like the pancreas [26], attention-guided CNNs for localizing organs like the pancreas [27], output space adaptation to tackle domain shifts [28] and cross-domain X-ray segmentation by unsupervised adversarial networks [29]. In summary, current AI research on CT images covers areas such as segmentation, noise modeling, attention mechanisms, domain adaptation, and cross-modality learning. Methods leverage convolutional neural networks, probabilistic models, adversarial training, and more. There remain opportunities to further improve the accuracy, robustness, and generalization of these approaches.
Our work proposes a transformer-powered framework that synergistically leverages both labeled annotations and unlabeled medical volumes concurrently by deeply interlinking their representations to enable seamless feature propagation, improving performance under constrained expert supervision and in clinical situations with limited annotated data.

2.2. Semi-Supervised Learning

Deep learning has achieved immense success for medical image analysis by automatically learning semantically rich features [14]. Recently, most semi-supervised image segmentation methods have also adopted deep learning concepts leveraging unlabeled data [30]. Existing approaches employ adversarial learning for distribution alignment between annotated and unannotated images [31], iterative refinements using graphical models like conditional random fields [32,33] or shape priors [15]. Variants of mean teacher architectures have also gained prominence for output space regularization [14,34].
Our proposed approach concurrently encodes inter-sample relationships using transformers to facilitate seamless feature propagation from limited labeled data to abundantly available unlabeled scans, deeply coupling their representations.

2.3. Transformers

Transformers were initially introduced for machine translation and subsequently demonstrated cutting-edge performances across various natural language processing (NLP) applications [15]. In order to extend the applicability of Transformers to computer vision tasks [35,36], researchers proposed several modifications by applying self-attention on image patches [37,38] or down sampled feature maps in Vision Transformer(ViT) [39]. ViT can process images of any size, making it more suitable for image classification tasks. Swin Transformer [40] solves the problem of insufficient local attention in ViT and exhibits superior performance in various visual tasks. ViT always uses 16× down-sampling, while Swin Transformer gradually reduces resolution and uses different down-sampling times, which will have more beneficial for tasks such as instance segmentation and object detection. Swin Transformer captures multi-scale representations via a hierarchical design that gradually reduces resolution across stages. This enables the modeling of interdependencies between global and local features. By outputting multi-scale outputs, Swin transforms aid dense prediction tasks like detection and segmentation that require both high-resolution details and contextual semantics.
We incorporate Swin transformers as backbones to encode both fine-grained localization and global context for medical volumes. By building upon their representations using a semi-supervised paradigm, we target enhanced generalization from a few annotations.

3. Method

Figure 1 illustrates the work flow of the proposed multi-task mean teacher transYLmtMT framework leveraging labeled and unlabeled data synergistically for segmentation. Specifically, a multi-task network (mt-transYL) is developed with two tasks: shadow region detection and shadow edge detection.
The mt-transYL network is employed to operationalize student and teacher networks for semi-supervised learning. During training, labeled data are input to the student network, and a supervised multi-task loss is computed by amalgamating the losses from the two tasks. Subsequently, for unlabeled data, an auxiliary shadow map is produced and fed into both student and teacher networks. A consistent multi-task loss is then computed between their shadow map predictions.
At test time, only the student network is utilized to predict the shadow information. This leverages unlabeled data while jointly learning multiple shadow cues. It enforces intra-task consistency via self-ensembling the up-to-date predictions. Task-level regularization further exploits geometric shape relationships.
In summary, mt-transYL integrates semi-supervised learning, multi-task learning, and self-ensembling for shadow detection. It aligns predictions across labeled, unlabeled, and auxiliary data through supervised and consistency losses. This couples shape, illumination, and semantics to improve generalization. The framework demonstrates how effectively combining multiple learning paradigms can boost performance on vision tasks.

3.1. Multi-Task YOLOv5 with Transformer

While existing shadow detection methods achieve remarkable results, they struggle with soft shadows having weak boundaries. Additionally, these methods may overlook small shadow regions or misidentify dark non-shadow regions, significantly altering detection. We posit explicitly considering shadow edges can enhance localization and segmentation accuracy. Hence, we propose using multi-task transYL (mt-transYL) to jointly model complementary shadow edge and region cues in end-to-end networks. This proposal addresses specific limitations of overlooking subtle shadows or blurry edges that trip up current methods. By learning region and contour guidance in a fused manner, mt-transYL can effectively resolve ambiguities.
In summary, encoding both boundary and surface information compensates for individual weaknesses to improve robustness. The mt-transYL explores this to address soft shadow and peripheral shadow challenges that persist across the state of the art. The multi-task fusion provides a more comprehensive context for disambiguation.

3.1.1. Shadow Region Detection

As an input shadow image given, firstly we utilize a transYL to produce feature maps (denoted as EF1, EF2, EF3, EF4, and EF5) at different scales [41].
These layers contain complementary information for shadow detection. Shallow layers capture both shadow and non-shadow detail feature information, while deep layers focus on shadows but also overlook some regions. Hence, we adopt short connections [42] to integrate the last 4 feature maps, producing new feature maps (denoted as DF2, DF3, DF4, and DF5). Specifically, the merged feature map DFk at layer k (k = 2, …, 5) is obtained by:
D F k = C o n v ( C o n c a t ( E F k , , E F 5 ) ) .
The short connections integrate low-level spatial details with high-level semantics. This allows the network to leverage features across scales rather than just the deepest layer. By fusing coarse shadow regions and fine boundary cues, the model can comprehensively represent shadows. The multi-scale refinement compensates for lost spatial or contextual information to improve detection robustness.
The shallowest features (EF1) are merged with the deepest features (EF5) to produce a new feature map(EF1) for predicting the shadow edge map. To integrate the shadow edge with region information, we refine the {EFk, k = 2, …, 5} maps by:
  • Up-sampling EFk to match the spatial resolution DF1
  • Element-wise addition of DF1.
This produces refined feature maps {RFk, k = 2, …, 5} defined as:
R F k = u p ( D F k ) + D F 1
The up-sampling and addition injects low-level spatial details into the semantic features. This allows precise localization guided by the high-level shadow cues. By combining complementary edge and region information, the model can holistically represent and segment shadows. The multi-scale integration also enables shadows to be detected across sizes and resolutions.
Finally, from the multi-scale features DF2, DF3, DF4 and DF5, we predict four shadow region maps. We also generate an integrated map (denoted as Sf) element-wise by adding the refined feature maps:
S f = P r e d ( k = 2 5 R F k )
The prediction Pred(·) is implemented by applying three 3 × 3 convolutional layers and a 1 × 1convolutional layer with another layer of sigmoid activation [43] to the features.
In summary, shadow regions are detected at multiple scales from the merged encoder features to capture shadows across sizes. The refined maps integrate complementary boundary information to localize shadows precisely. Fusing predictions provides rich, context-aware representations of scene illumination. This comprehensive multi-scale, multi-task approach allows robust detection of subtle to large shadows in complex images.

3.1.2. Shadow Edge Detection

Soft shadows’ boundaries can be indistinguishable from non-shadowy region surroundings. Utilizing edge knowledge could enhance detection in such cases. Recently, saliency models [44,45,46] have shown that edge cues aid quality.
In our mt-transYL, low-level EF1 and high-level EF5 are fused to produce the feature map DF1 for predicting shadow edges. While EF1 captures shadow edge boundaries, using it alone is insufficient as it also encodes irrelevant background details. Meanwhile, the EF5 suppresses the non-shadow pixels with its large receptive field. Specifically, DF1 is computed by an element-wise addition of EF1 and EF5.
This leverages complementary strengths—EF1 provides localization precision while EF5 gives semantic guidance. Fusing them removes confusing backgrounds while retaining boundary details. The edge guidance focuses attention on indistinct soft shadow transitions. By explicitly modeling boundaries and filtering non-shadow textures, the model can handle subtle illumination changes. The multi-level integration produces comprehensive edge-aware features to address soft shadow ambiguity.

3.2. YOLOv5 with Transformer Detection

Figure 2 shows the overall structure of transYOLOv5, which contains three modules: Backbone, Neck, and Head, and describe how to introduce Swin Transformer to the YOLOv5 network.
The image is preprocessed through the input terminal, including data enhancement, adaptive anchor calculation, adaptive zooming, and other operations. The preprocessing effectively improves the model’s feature extraction ability by employing the CSP Market53 residual backbone structure. The Neck section uses a combined FPN and PAN structure to improve performance while maintaining efficiency. The FPN part uses a Gaussian weighted feature pyramid to enable multiscale target detection. The Head section outputs the predictions via bounding box loss and NMS suppression. However, YOLOv5 convolutional networks lack long-distance modeling and global information. Therefore, we introduce Transformer to address this limitation.
Backbone: Two CSP structures are designed in the backbone. CSP1_X is applied to the backbone and CSP2_X to the Neck. Then, 3 × 3 convolutions before each CSP module serve as a down-sampling function. With five CSP modules, the 640 × 640 input image is reduced to a 20 × 20 feature map. We mainly introduce the Swin Transformer module in the Backbone network to improve the feature extraction performance in this paper.
Neck: The CSP2 structure, SPPF module, and FPN+PAN method based on CSPnet are fused, which strengthens the network feature fusion ability.
Head: The CIoU loss is adopted for bounding boxes and NMS suppression to eliminate redundant detections. NMS finds local maxima and suppresses non-maximal elements. It eliminates overlapping detections by selecting the optimal box and removing redundant ones based on confidence scores and IOU overlaps.
The procedure is as follows: (1) All the prediction boxes are sorted by confidence in descending order. (2) With the highest confidence, we select the prediction box, confirm the prediction is correct, and calculate its IOU with other prediction boxes. (3) If the CIoU removal overlap calculated in Step 2 is high, the IOU > threshold value will be directly deleted. (4) Return to step 1 for the remaining prediction boxes until there are no more left.
TransYL: Our TransYL introduces Swin Transformer modules into Backbone layers 7 and 9, reducing computation via convolutions. The backbone extracts features, fusing local and global information through the SPPF. The Neck further fuses features before final prediction in the Head.

3.3. Multi-Task Loss

3.3.1. Multi-Task Supervised Loss of Labeled Data

About the labeled data, shadow images are input and paired with annotated binary shadow masks as region ground truth (Gr). To generate edge ground-truth (Ge), we employ the Canny operator [47] to the masks. With these targets, the multi-task supervised loss Ls for image (x) is computed by summing the supervised losses for shadow region detection (Lrs) and shadow edge detection (Les), i.e.,
L s ( x ) = L r s + α L e s + β L c s
where
L r s = j = 1 9 Φ B C E ( P r ( j ) , G r ) , L e s = Φ B C E ( P e , G e ) , L c s = Φ M S E ( P c , G c ) .
Pr(j) and Pe are the predicted shadow maps and shadow edge map, respectively. ΦBCE and ΦMSE are binary cross-entropy and MAE loss functions, respectively. We set weights α = 10 and β = 1 for training.
The region loss Lrs provides pixel-level supervision for segmentation. The edge loss Les gives boundary-aware guidance using both learning methods and focuses on accurately distinguishing subtle illumination transitions.
By coupling region and contour cues, the model learns a holistic shadow representation. The joint modeling provides complementary signals—what is shadowed and where are the edges. This combination addresses inherent ambiguities better than a single target.
In summary, shadow masks provide region supervision, Canny edges provide boundary supervision, and the multi-task loss combines BCE for regions and MAE for edges to enable holistic shadow learning through complementary region and contour cues.

3.3.2. Intra-Task Consistency Loss

For intra-task consistency, the teacher model weight θ0 are updated as an exponential moving average (EMA) of the weights θ of the student: θ0t = αθ0t − 1 + (1 − α)θt, where α is the EMA decay.
The student is trained with supervised loss and unsupervised consistency loss compared to teacher outputs. We integrate consistency for both segmentation and regression tasks. Following [14], we estimate uncertainty via Monte Carlo Dropout [48] with T stochastic passes under random dropout. The segmentation uncertainty is approximated by predictive entropy.
p i = 1 T t = 1 T p i t u = i = 1 C p i l o g ( p i )
Pit is prediction logits for class i at pass t, C is the segmentation classes number, pi is average softmax probability from T teacher passes, and U combines voxel-wise uncertainty u. Using U, unreliable high-uncertainty predictions are filtered out. The student only learns from confident predictions, defined by the intra-task consistency loss:
L i t c ( θ ; θ ; D ) = β I ( u < u t h ) | | f s e g f s e g | | 2 I ( u < u t h ) + ( 1 β ) I ( u < u t h ) | | f d i s f d i s | | 2 I ( u < u t h )
where (fseg, fdis) and (fseg, fdis) are the student and teacher outputs of segmentation and regression, respectively. I(·) selects certain predictions, β balances tasks, and τ thresholds uncertainty.

4. Experiments

4.1. Dataset and Experimental Settings

Public datasets often contain a relatively small amount of data with limited distribution, and algorithms that perform well on them also require validation on private datasets to ensure robustness and transferability. Clinical datasets better represent the real-world scenarios encountered in healthcare.
Clinical datasets may include challenges like artifacts, noise, and protocol variations that are not fully represented in curated open datasets. Testing on this real-world clinical data allows us to assess the robustness of algorithms to factors that can significantly impact segmentation accuracy and reliability. Open datasets alone may not accurately reflect the challenges of clinical practice, leading to overestimated or unrealistic performance metrics.
We assess our framework performance on two datasets, the publicly available COVID-SemiSeg Segmentation Dataset [49] and a clinical COVID-HSS image dataset. COVID—The SemiSeg dataset comprises 100 axial 2D CT images from various patients. These CT images were gathered by the Italian Society of Medicine and Interventional Radiology. Radiologists have employed diverse labels for segmenting the CT images to delineate areas of lung infection. It has a limited sample size, consisting of only 100 annotated images.
For all the experiments, we employ basic data augmentations such as random rotation and flipping. Our transYL introduces Swin Transformer modules into Backbone layers 7 and 9, reducing computation via convolutions. The input resolution is configured as 8 × 8 with patch size P 16, respectively, unless specified otherwise. Consequently, four 2× up sampling blocks are cascaded in CUP consecutively to achieve the full resolution. The default batch size is 6 and the default training iterations is 20 k for COVID-SemiSeg.
In the model training, selecting different optimizers may greatly affect network performance. Stochastic Gradient Descent (SGD) is used to update the parameters of our network based on the gradient information of backpropagation in order to reduce the calculated value of the loss function. SGD was chosen as the optimizer due to its computational efficiency with mini-batches, adaptability to noisy gradients, helping with the escape of sharp minima suited for deep neural networks, regularization benefits improving generalization, and faster convergence with momentum acceleration, striking a balance between efficiency, prevention of overfitting, and flexible tuning of hyper-parameters.
All experiments are conducted on Nvidia RTX2080s Ti.
Baselines: For the infection region experiments, we benchmark the proposed transYLmtMT against classical segmentation models in the medical domain, namely, U-Net [25], Att-UNet [26], Inf-Net [50] and Trans-Inf-Net [19].
Thorough validation is essential for developing trust in automatic segmentation models prior to clinical use. Comprehensive validation provides confidence that these models can generalize to new data while maintaining reliable performances across diverse clinical scenarios. Key validation techniques include quantitative metrics to evaluate segmentation accuracy, qualitative visual analysis for assessing clinical utility, comparisons against baseline methods, and incorporation of feedback from clinicians. Ultimately, rigorous multifaceted validation combining metrics, visual analysis, comparisons, and clinician input enables a holistic understanding of model capabilities, limitations, and clinical relevance.
Evaluation Metrics: Following [51,52], we use three widely adopted metrics, i.e., the Dice similarity coefficient, Specificity (Spec.), Sensitivity (Sen.), and Precision (Prec.) and three detection metrics, i.e., Enhance—alignment Measure(Eξ) [52], Mean Absolute Error (MAE), and Structure Measure (Sα) [51]. In our assessment, we select S3 as the final prediction (Sp) with a sigmoid function.
To evaluate the segmentation performance, we quantify the similarity/dissimilarity between the final predicted map and the pixel-level segmentation ground truth (G).
This frames segmentation as a spatial matching problem between predictions and annotations. By comparing outputs to human-labeled maps, we can effectively benchmark accuracy. The ground truth indicates precise object delineations and provides a gold standard for model alignment.
Measuring overlap and divergence from G gives an intuitive and interpretable gauge of localization and segmentation quality. This pixel-level analysis identifies which areas are correctly classified versus mislabeled. Overall, the quantitative spatial comparison reveals model strengths, limitations, and opportunities for improvement in a detailed manner.

4.2. Results on COVID-SemiSeg Dataset

In this section, we introduce quantitative and qualitative results to validate the performance of our model on COVID-SemiSeg dataset.
The quantitative results allow numerical benchmarking of segmentation accuracy compared to ground truth annotations. Metrics such as the Dice coefficient, Hausdorff distance, and boundary F1-score provide precise measures of overlap, contour adherence, and delineation quality. Together, they offer a comprehensive and reliable assessment.
We also showcase qualitative segmentation visualizations on real CT scans. These predicted maps give intuitive examples of segmentation behavior on complex shapes and textures. The visual results demonstrate generalization to variable infection morphology and localization across lung anatomy.
Through both quantitative evaluations and qualitative demonstrations, we rigorously validate effectiveness on the COVID-SemiSeg challenge. The multi-pronged evidence builds confidence by aligning numerical scores with visual segmentations. This confirms the robustness of our semi-supervised approach to inconsistent novel cases.

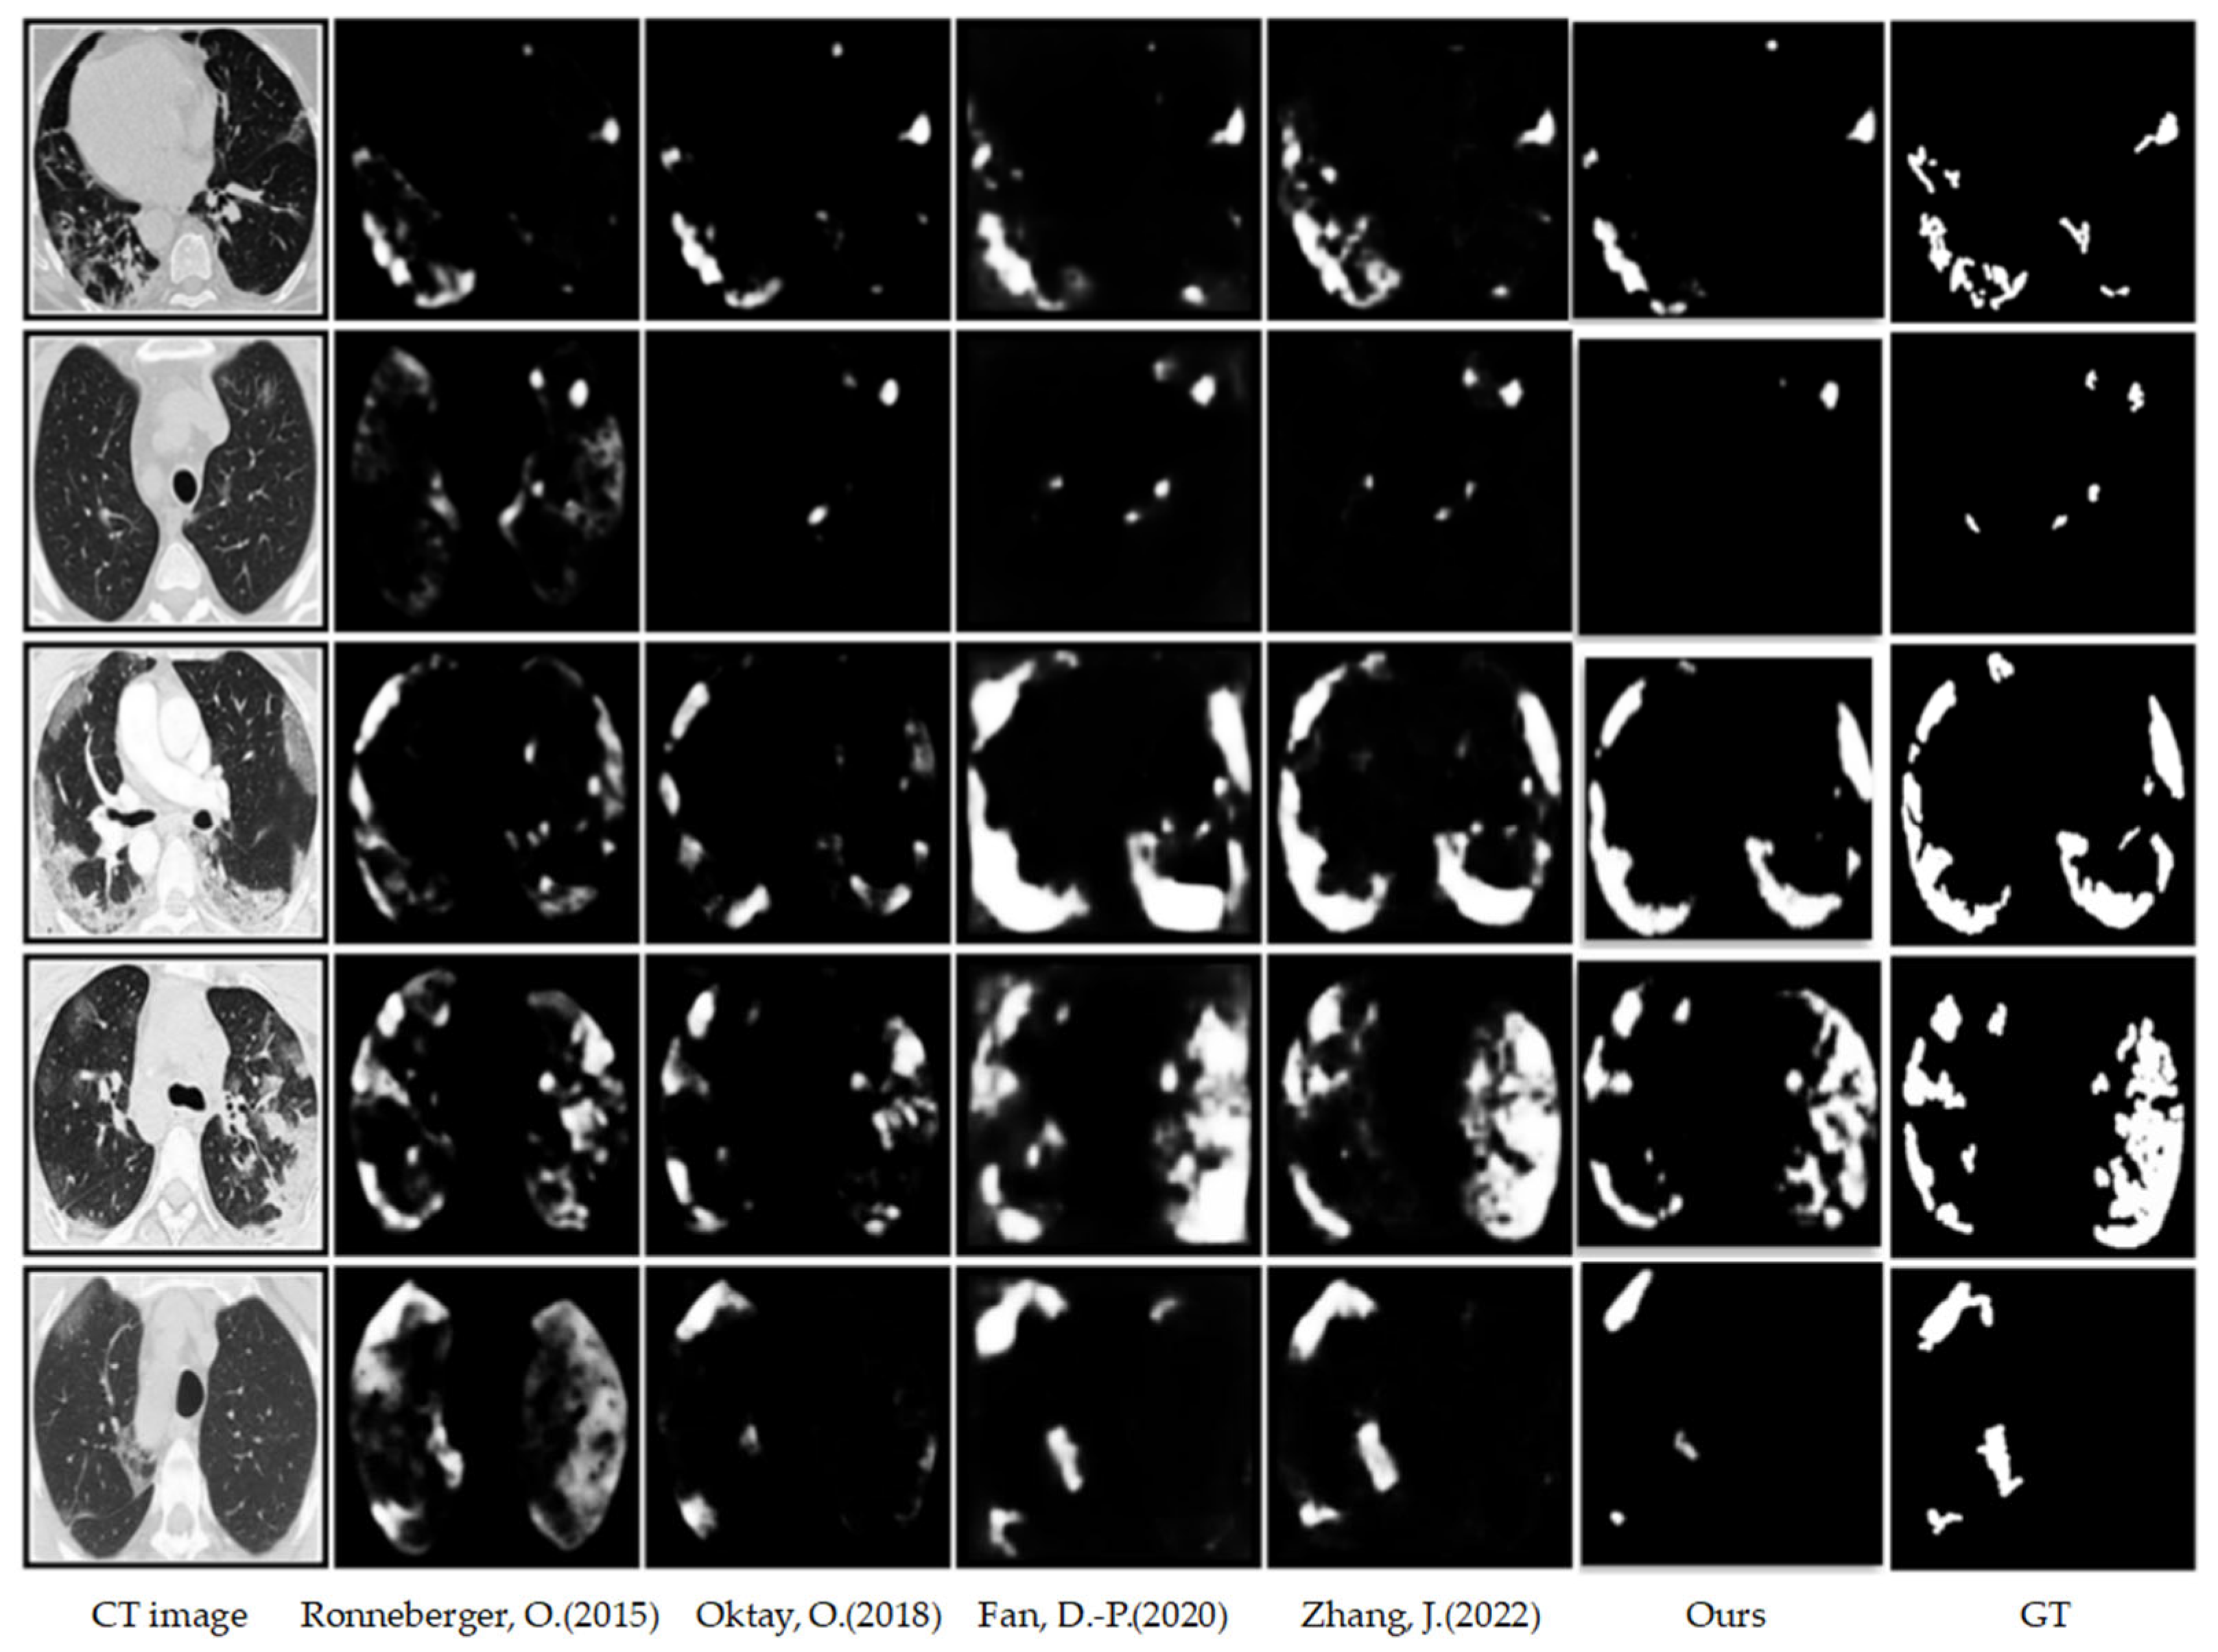
4.2.1. Qualitative Results on COVID-SemiSeg

The segmentation results of lung infection in Figure 3 show our transYLmtMT outperform the baselines, producing segmentations closely matching the ground truth with fewer errors. Meanwhile, U-Net yields unsatisfactory results with numerous mislabeled areas.
Our success is attributable to the multi-task learning between infection region and edge predictions. By modeling both cues, we can leverage complementary information to resolve ambiguities. The teacher–student semi-supervised pipeline further augments these representations through consistency regularization.
Qualitatively, our segmentations adhere better to intricate infection boundaries and distinguish subtle texture differences. This demonstrates the value of our contributions—fusing edge guidance into a semi-supervised framework improves the generalization and precision of this complex task.
In summary, concurrently harnessing localization cues alongside semi-supervised learning principles allows us to capture richer features, handle ambiguities more effectively, and delineate abnormalities with improved precision. This translates to considerable qualitative and quantitative improvements in segmentation performance.

4.2.2. Quantitative Results on COVID-SemiSeg

Table 1 illustrates quantitative results. As observed intuitively, the proposed transYLmtMT significantly outperforms U-Net, Attention-U-Net, Inf-Net and Trans-Inf-Net across key metrics including Dice, Sα, Eϕmean, and MAE.
Specifically, we achieve improvements of 1.9%, 3.1%, and 1% for the Dice score, Specificity, and Eϕmean compared to prior state-of-the-art Trans-Inf-Net. Meanwhile, we reduce the mean absolute error by 4.4% over the baselines.
These quantitative gains highlight the benefits of our multi-task semi-supervised approach. By incorporating edge information and unlabeled data in a teacher–student framework, transYLmtMT produces more accurate and consistent segmentations. The fusion of complementary regional, boundary, labeled and unlabeled cues enables robust generalization even to subtle infection characteristics.
Together, the numerical metrics validate transYLmtMT’s ability to push the state of the art forward for this critical pandemic visualization task. The system delivers reliable, precise, and interpretable CT scan infection maps to aid radiologists.

4.3. Results on COVID-HSS Dataset

In this section, we highlight the advantages of our approach using the real-world clinical COVID-HSS dataset. The clinical classification of COVID based on CT images includes: (1) Mild—with mild symptoms and no pneumonia observed in imaging. (2) Ordinary type—exhibiting symptoms like fever and respiratory issues, with pneumonia visible in imaging. (3) Severe—showing progressively worsening clinical symptoms, and significant lesion progression in lung imaging within 24 to 48 h by >50%. (4) Critically ill—experiencing respiratory failure and requiring mechanical ventilation. Since the mild type shows no pneumonia in imaging, this dataset is divided into ordinary, severe, and critical cases.
The COVID-HSS dataset comprises 595 ordinary, 640 severe, and 349 critical CT images. We apply transYLmtMT to CT images of differing severity.

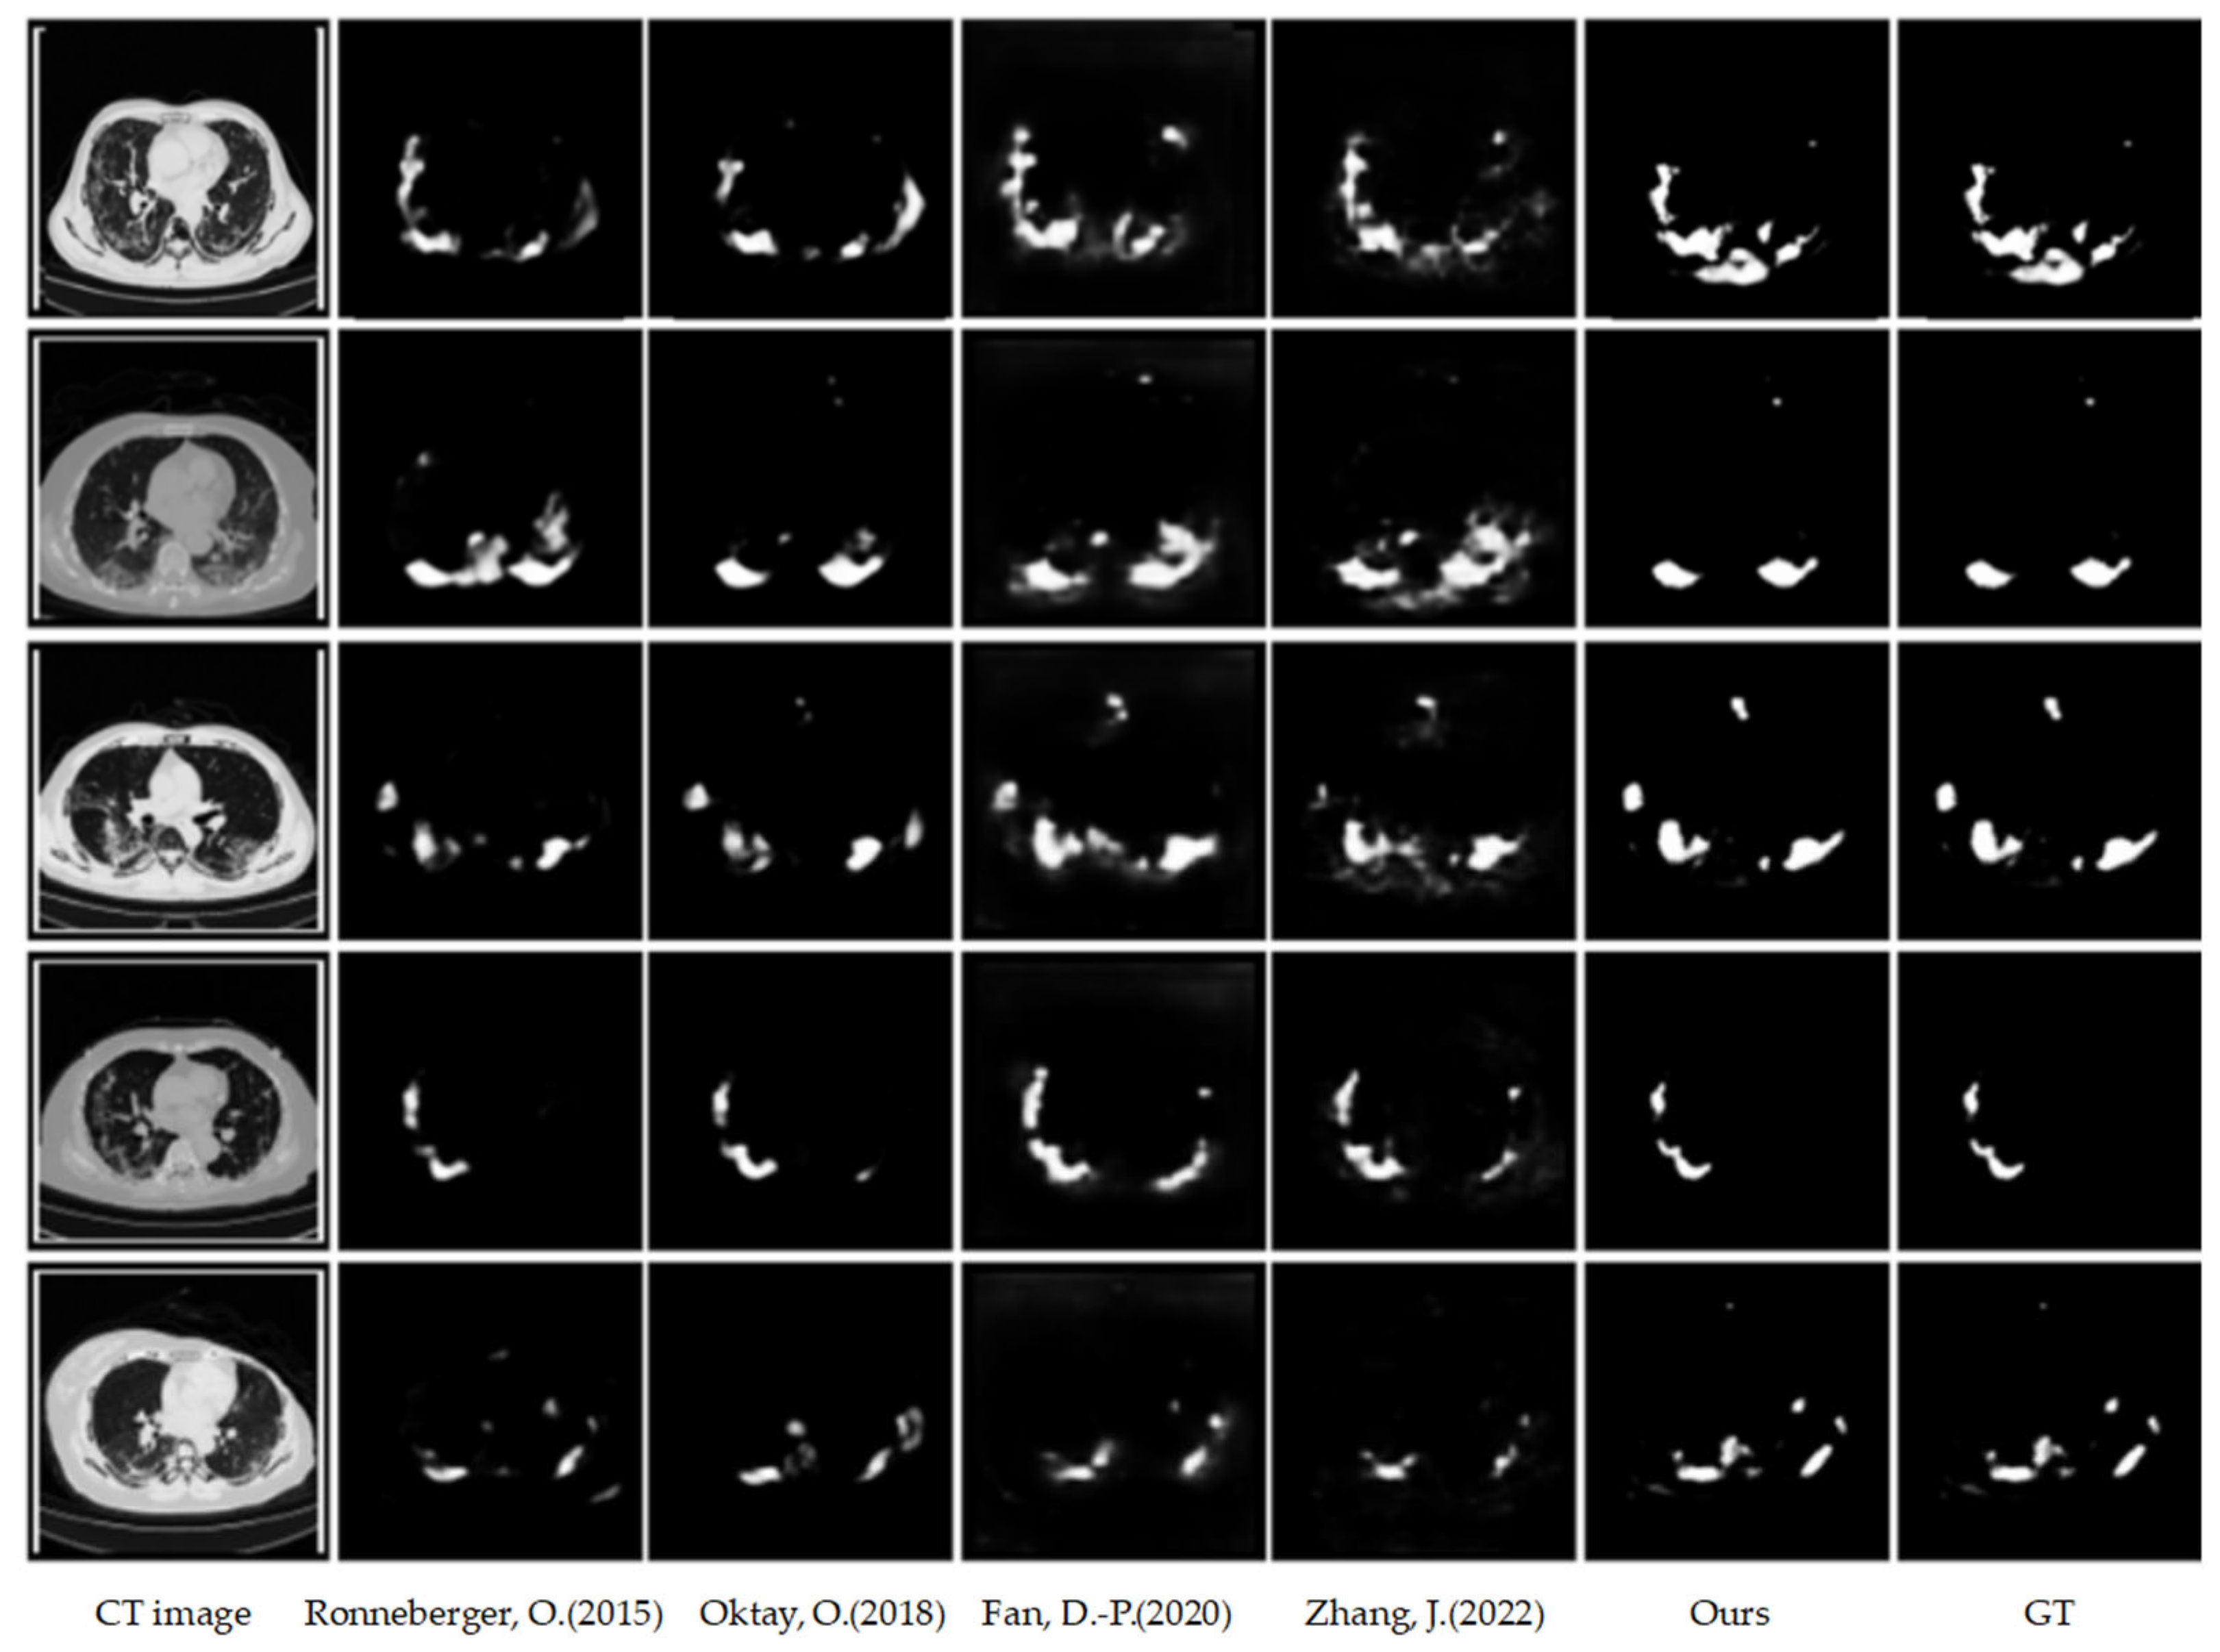
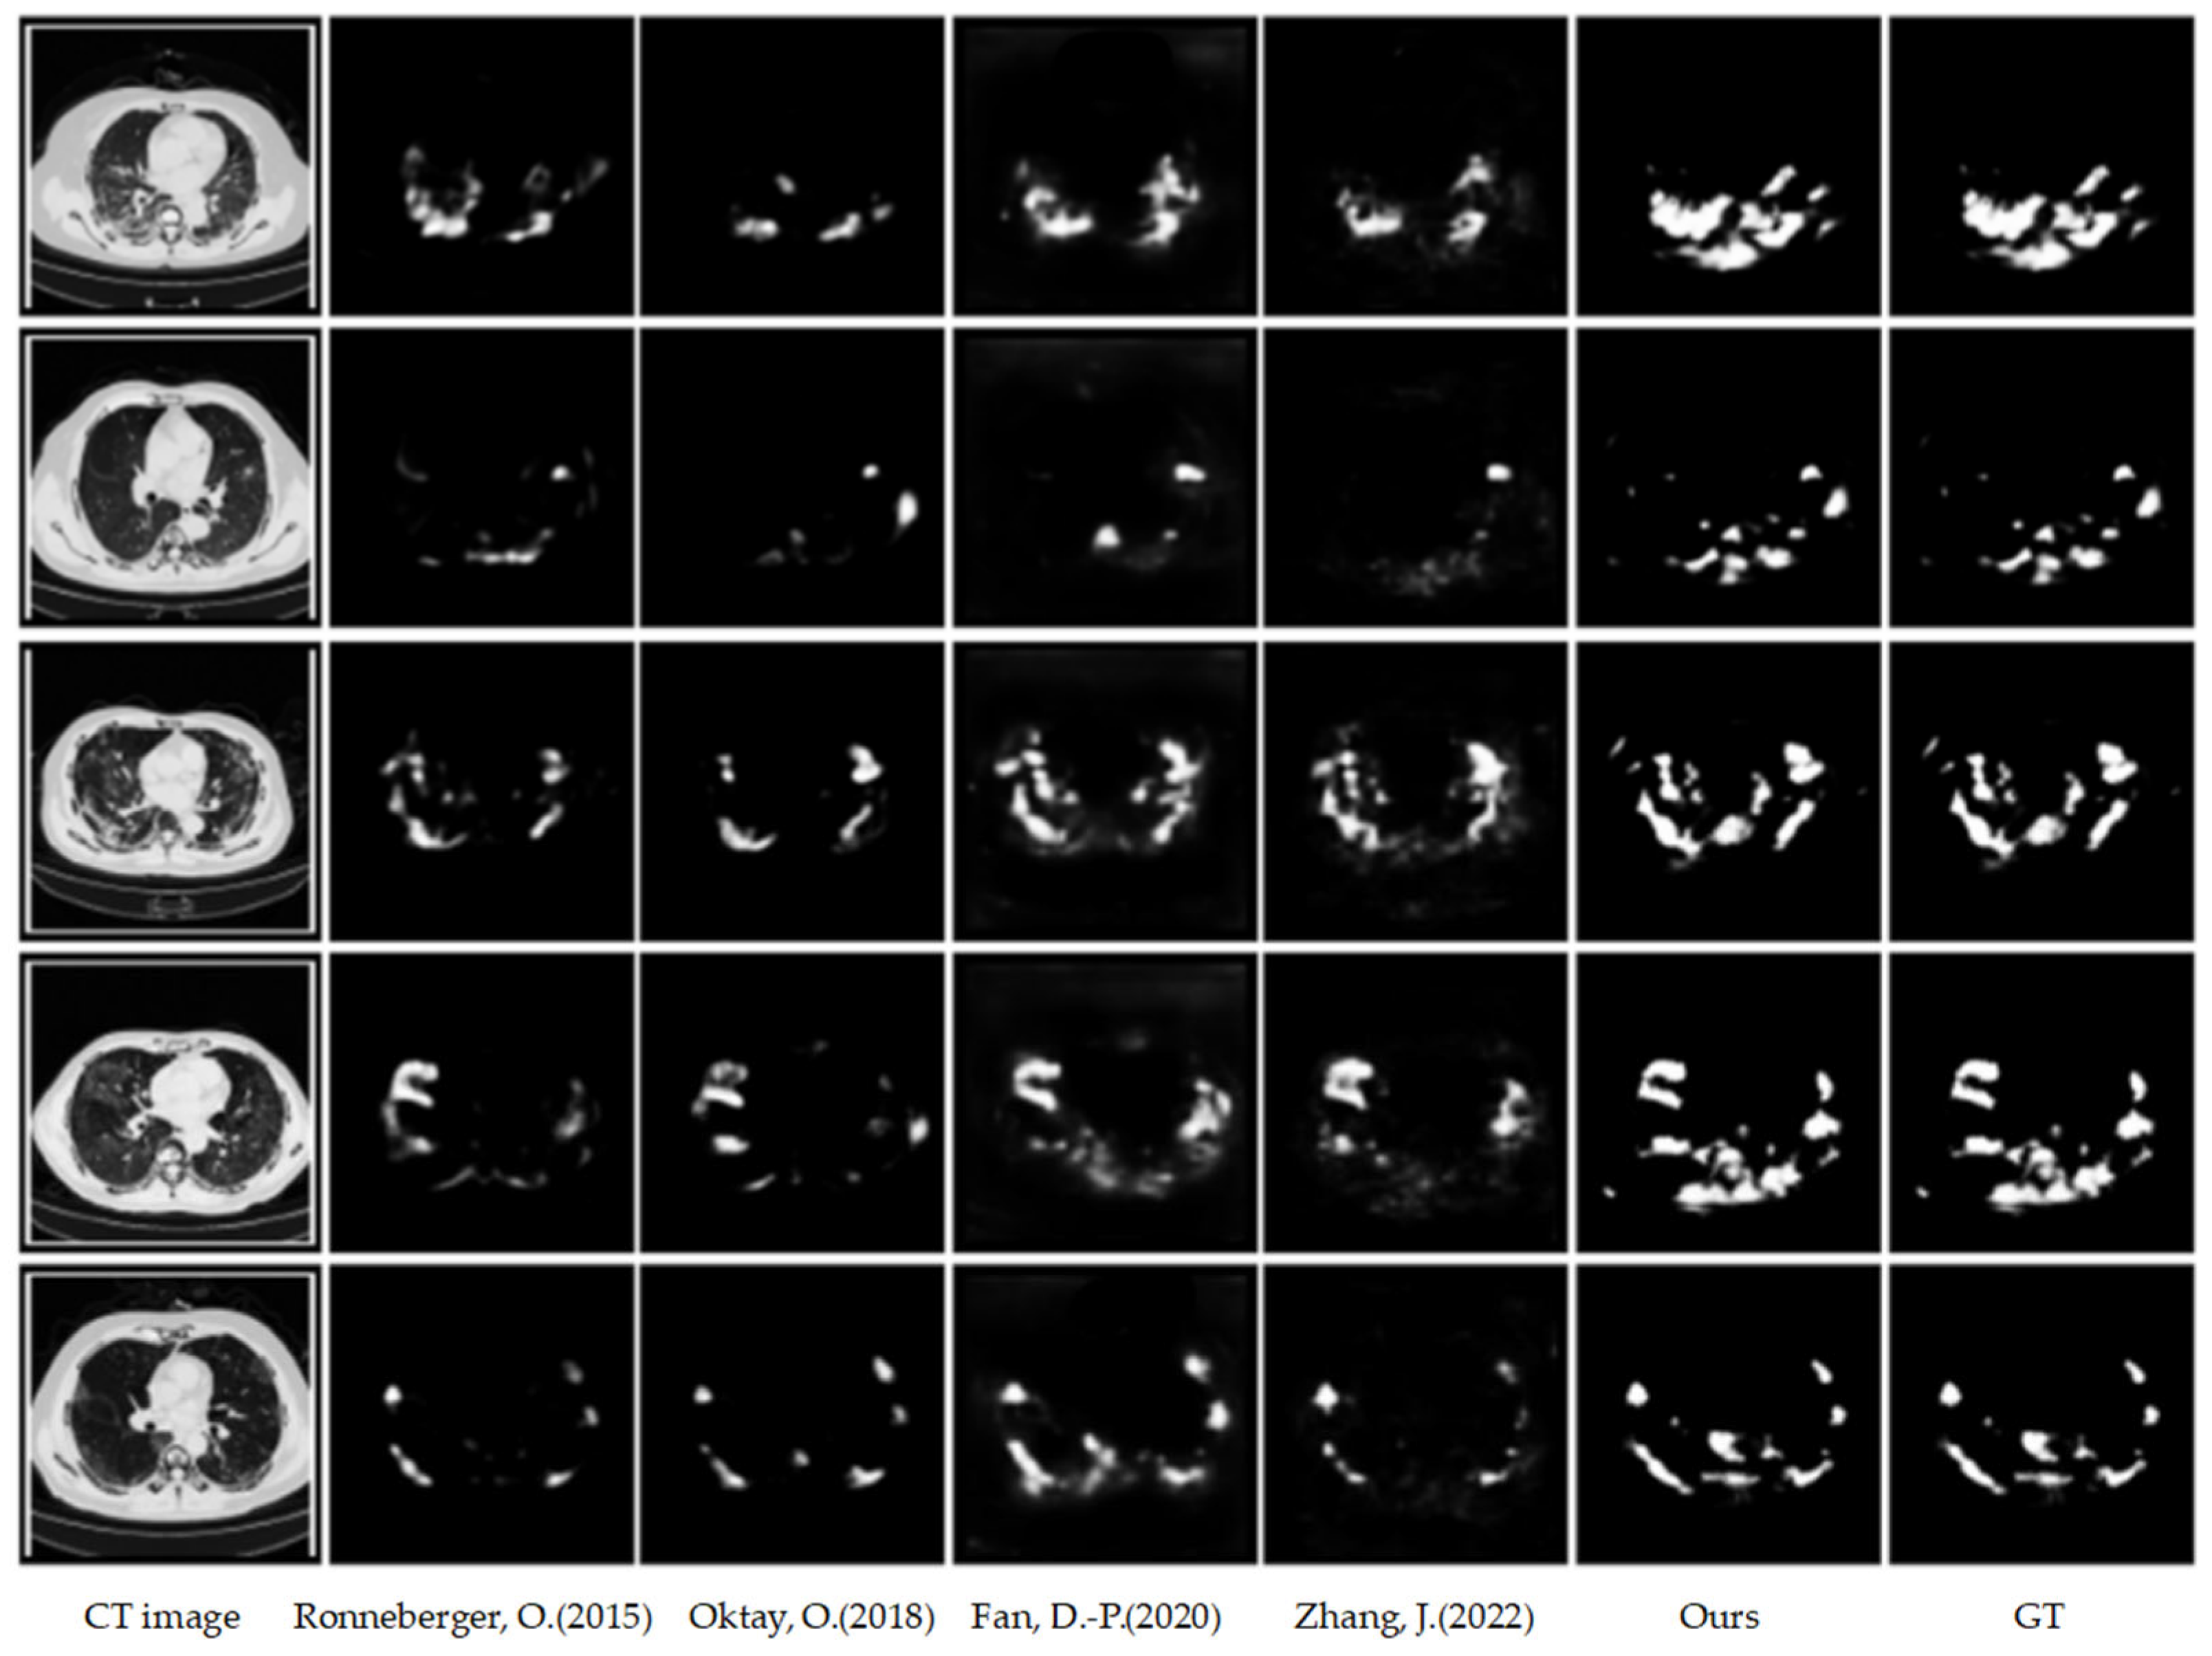
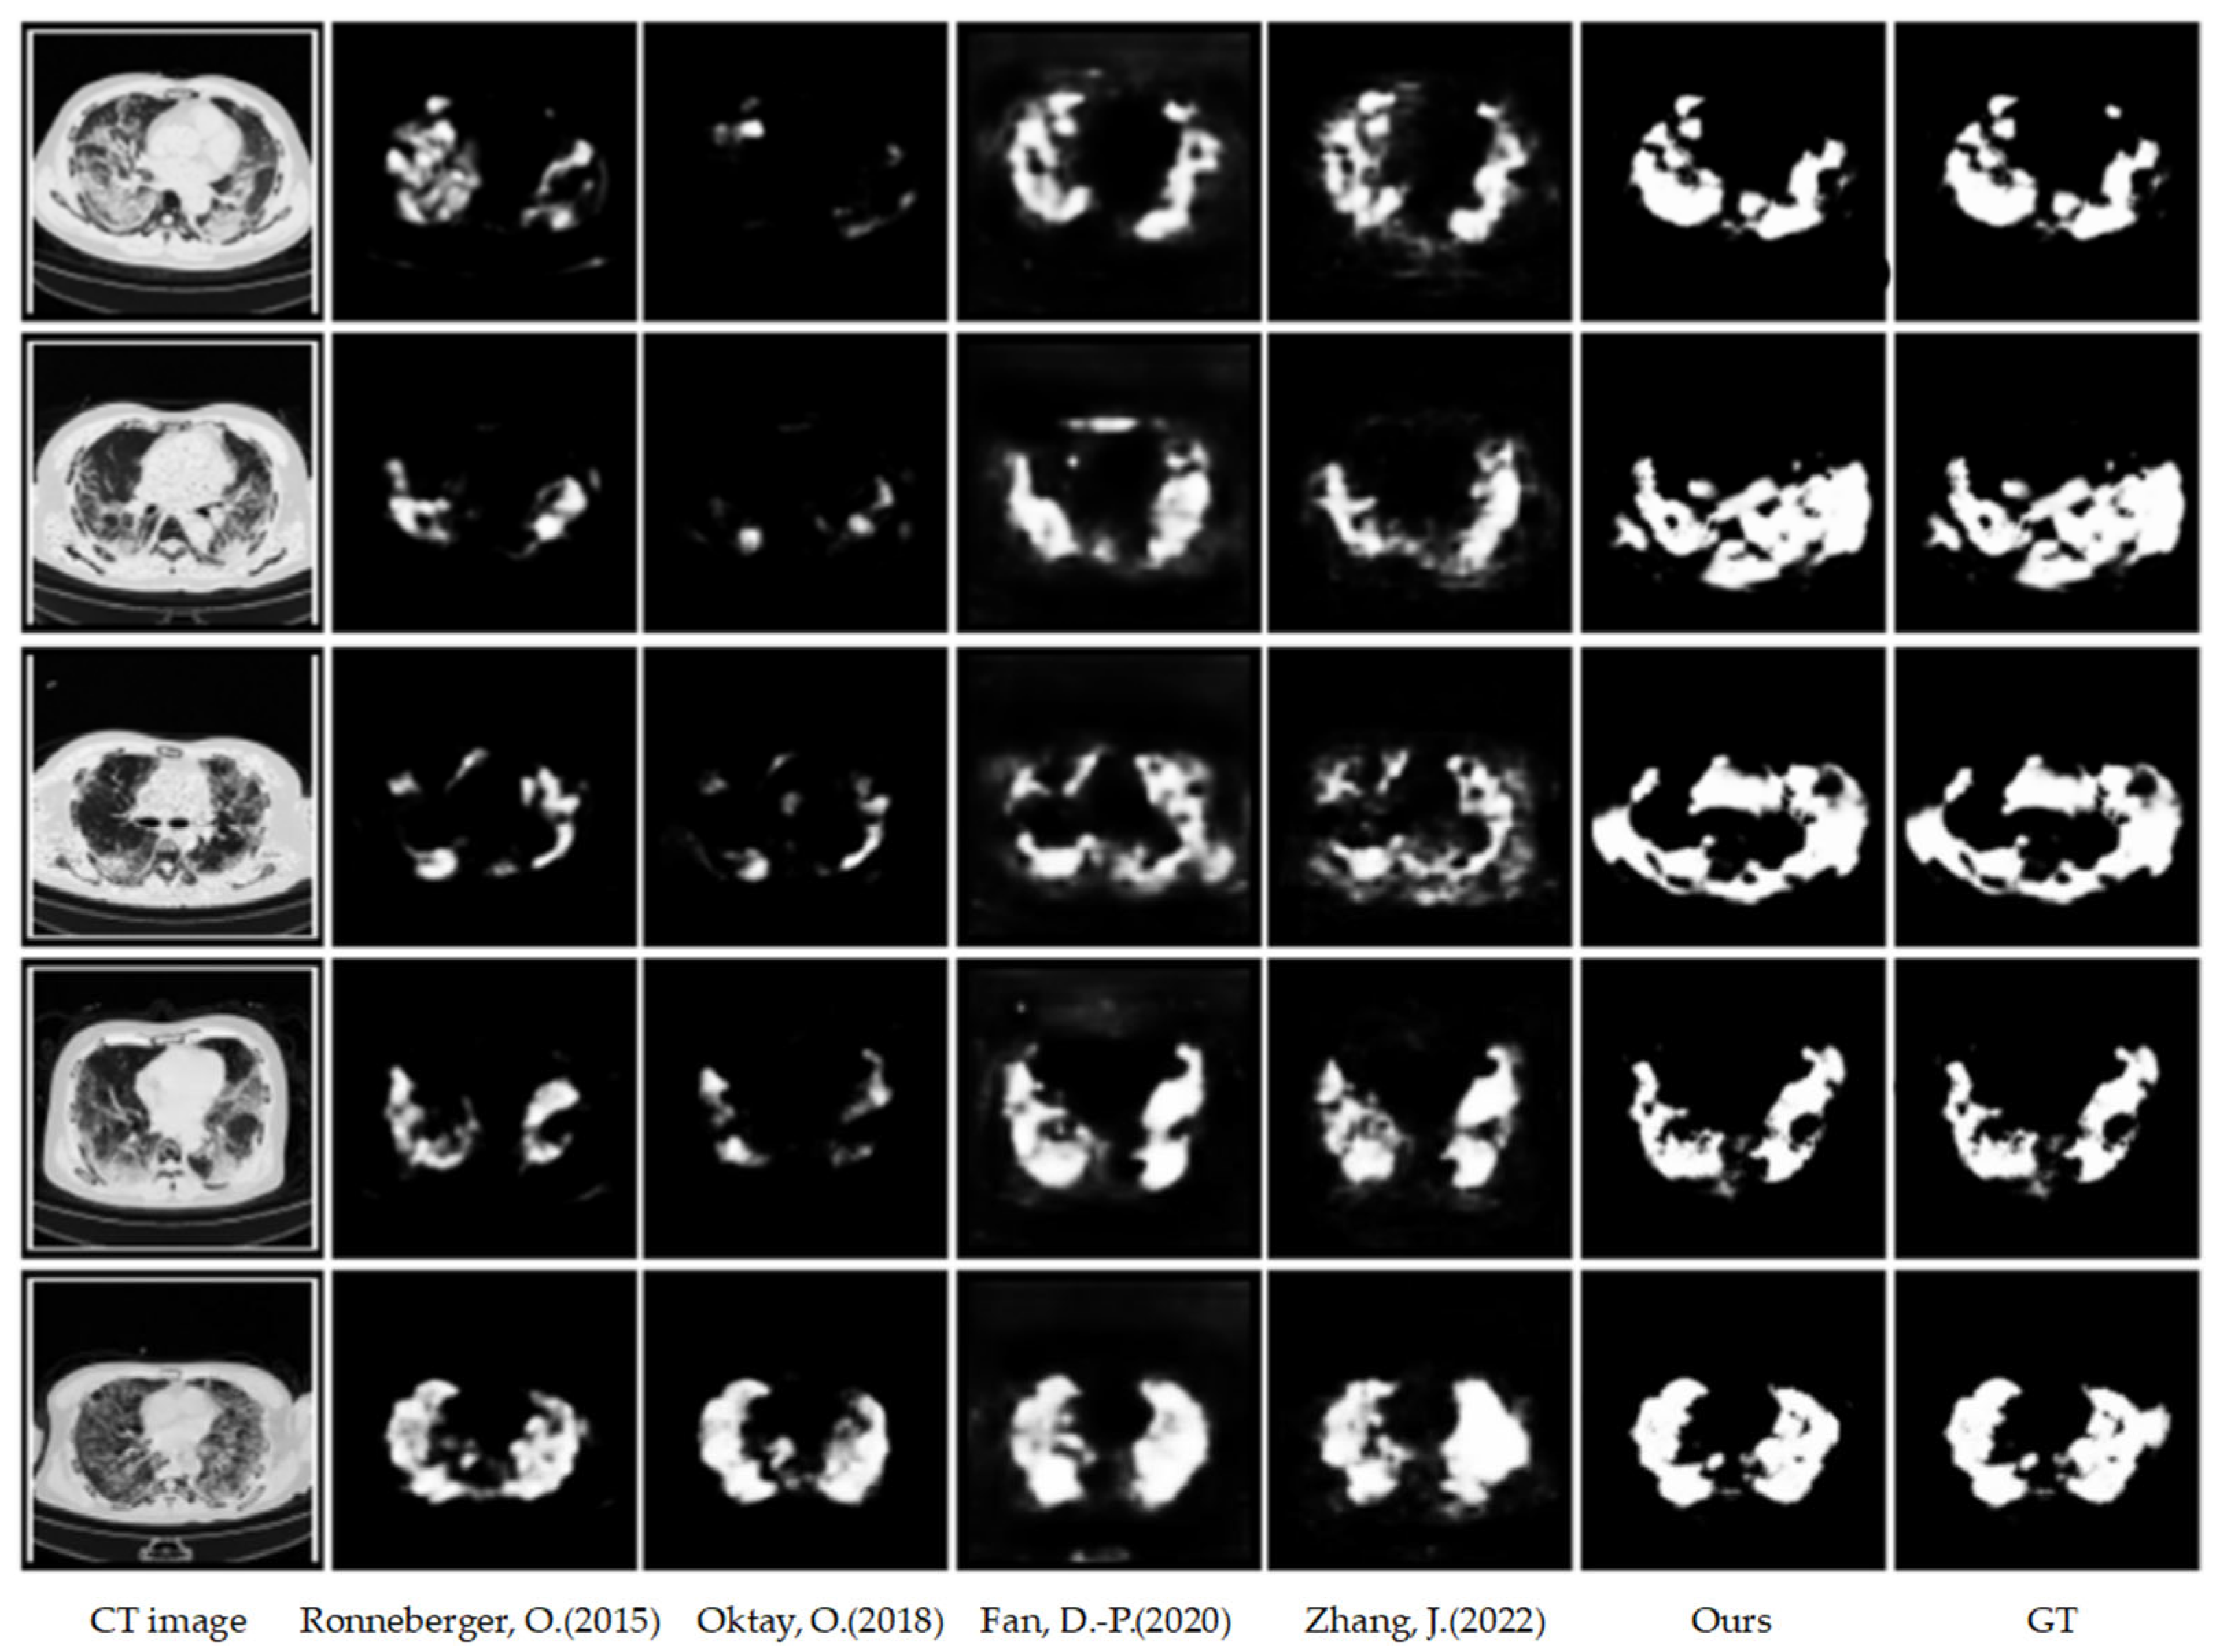
4.3.1. Qualitative Results on COVID-HSS

Figure 4, Figure 5 and Figure 6 represent the infection segmentation results of the COVID-HSS dataset. The proposed transYLmtMT demonstrates clear superiority over various baseline methods. It is evident that the transYLmtMT algorithm provides a relatively fuzzy boundary, especially in subtle infection areas. The success of transYLmtMT can be attributed to the coarse-to-fine segmentation strategy employed in this paper, that is, the transYL network first roughly locates the lung infection area, then applies multiple edge attention modules to refine the contours. This mirrors the workflow of clinicians—broadly assessing for pathology first, then scrutinizing boundaries, resulting in excellent performance.
Specifically, early coarse prediction primes the model to focus on infectious areas and provides context to guide localization. The fine-grained edge modules then adhere to subtle anatomical cues to precisely delineate tissue transitions. They capture nuanced topology critical for clinical assessment.
In summary, transYL’s hierarchical segmentation dynamically zooms in on areas of interest through learned attention. By coordinating the global and local views much like human experts, it extracts clinically valuable structure while ignoring irrelevant regions. The tailored strategy maximizes efficiency and accuracy for practical usage.
Public datasets have limited data distribution, requiring algorithm validation on private datasets; clinical datasets present real-world challenges like artifacts, noise, and protocol variations absent in open datasets, necessitating robustness assessments; false and over-segmentation arise due to various factors, addressable via robust segmentation algorithms tailored to clinical data using techniques like deep learning, multi-modal integration, context-awareness, and post-processing alongside rigorous algorithm validation.

4.3.2. Quantitative Results on COVID-HSS

As shown in Table 2, Table 3 and Table 4 along with the quantitative comparison of different dataset results, respectively, our proposed transYLmtMT achieves the best performance across key metrics compared to other methods, as indicated by the red labels. Among them, the red indicator is the best of all methods, and the blue indicator is the second best of the Sα, E ϕ m e a n and MAE indicators. The transYLmtMT indicators in this paper are better than the baseline method in this paper. This demonstrates the benefits of our implicit reverse attention and explicit edge attention modules in providing robust feature representations. By modeling region and boundary cues in a mutually reinforcing multi-task framework, we enable precise localization of infection sites.
Moreover, our transYLmtMT is a general infection segmentation approach that is easily adapted to other infections. By learning fundamental visual patterns of pathological morphology, it can transfer to related viruses or diseases that demonstrate similar imaging traits. Table 2 highlights transYLmtMT’s state-of-the-art accuracies while underscoring its interpretability and wider applicability for enhanced clinical utility across visualization challenges. The flexible self-attention approach advances the capability for AI systems to reliably aid frontline healthcare.
Our transYLmtMT uses a coarse-to-fine strategy, first roughly localizing infected areas using the transYL network, then refining the contours using multiple edge attention modules. This mirrors how clinicians work—inspecting broadly first before carefully scrutinizing the boundaries. This demonstrates the benefits of the reverse attention and edge attention modules in providing robust feature representations. By concurrently modeling infection regions and boundaries in a mutually reinforcing multi-task framework, precise localization is enabled.
In summary, harnessing localization cues and semi-supervised learning allows richer features to be captured, more effective handling of ambiguities, and the delineation of abnormalities with improved precision. This translates to considerable qualitative and quantitative improvements in segmentation performance.

4.4. Loss Function

The loss function curve during the iterative training process is shown in this section with the performance analysis of the proposed segmentation algorithm. As described in Section 3.3, the shadow edge detection loss and shadow region segmentation loss are summed to obtain the multi-task supervision loss, and then the multi-task supervision loss and intro task consistency loss are added to obtain the final total loss.
The student is trained with supervised segmentation loss and unsupervised consistency loss compared to teacher outputs. We integrate the consistency loss for segmentation and regression tasks. As shown in Figure 7, we focus on the edge_con and seg_con during the model training process.
According to the curve graph of the loss function, it can be intuitively observed that the function begins to converge when the loop is trained approximately 1000 to 4000 times, and it tends to stabilize when the loop is trained approximately 4000 to 5000 times. After 10,000 iterations of training the algorithm model in this article, the loss value reached a relatively stable state, and was considered to have achieved an ideal segmentation effect.

5. Conclusions

We propose a multi-task framework to leverage complementary shadow region and edge detection information, using a mean teacher model with unlabeled data for further performance boosts. To effectively exploit unlabeled data for training, we integrated intra-task consistency between model predictions to exploit geometric shape information by YOLOv5 with a transformer. Extensive experiments on two CT image datasets demonstrate superiority over popular baseline methods. There is significant potential to build on these strategies for augmented, explainable and practical AI assistance in medical imaging. Adapting the ideas to various domains could aid diagnosis and personalization across diseases.
In future work, we aim to tackle more diverse multi-task objectives and translational clinical applications to further advance real-world medical segmentation. There remain open challenges in adapting to variable scanning protocols, limited annotations, as well as inference speed and memory demands. Addressing these could accelerate clinical integration. We will also investigate joint biological prediction tasks beyond shadows, such as combined tissue, infection and tumor segmentation. Such capabilities can better recapitulate the holistic analysis radiologists perform.
The key directions involve developing unified AI diagnosis systems, interactive segmentation for human–AI collaboration, multimodal fusion, multi-task learning, clinical decision support, and integration into clinical workflows and mobile health applications.

Author Contributions

Conceptualization, J.Z.; methodology, J.Z. and X.Z.; software, F.L.; validation, X.Z.; resources, Y.C.; data curation, X.Z.; writing—original draft preparation, J.Z.; funding acquisition, X.H. All authors have read and agreed to the published version of the manuscript.

Funding

This work was supported by NSFC Grant No. 61702409.

Institutional Review Board Statement

Not applicable.

Informed Consent Statement

Not applicable.

Data Availability Statement

The data used to support the findings of this study are available from the authors upon request.

Conflicts of Interest

The authors declare no conflicts of interest.

References

  1. Ye, Z.; Zhang, Y.; Wang, Y.; Huang, Z.; Song, B. Chest CT manifestations of new coronavirus disease 2019 (COVID-19): A pictorial review. Eur. Radiol. 2020, 30, 4381–4389. [Google Scholar] [CrossRef]
  2. Milletari, F.; Navab, N.; Ahmadi, S.-A. V-net: Fully convolutional neural networks for volumetric medical image segmentation. In Proceedings of the 2016 Fourth International Conference on 3D Vision (3DV), Stanford, CA, USA, 25–28 October 2016; pp. 565–571. [Google Scholar]
  3. Wang, R.; Lei, T.; Cui, R.; Zhang, B.; Meng, H.; Nandi, A.K. Medical image segmentation using deep learning: A survey. IET Image Process. 2022, 16, 1243–1267. [Google Scholar] [CrossRef]
  4. Jiao, R.; Zhang, Y.; Ding, L.; Xue, B.; Zhang, J.; Cai, R.; Jin, C. Learning with limited annotations: A survey on deep semi-supervised learning for medical image segmentation. Comput. Biol. Med. 2023, 169, 107840. [Google Scholar] [CrossRef] [PubMed]
  5. Bernard, O.; Lalande, A.; Zotti, C.; Cervenansky, F.; Yang, X.; Heng, P.-A.; Cetin, I.; Lekadir, K.; Camara, O.; Ballester, M.A.G.; et al. Deep learning techniques for automatic mri cardiac multistructures segmentation and diagnosis: Is the problem solved? IEEE Trans. Med. Imaging 2018, 37, 2514–2525. [Google Scholar] [CrossRef]
  6. Lalande, A.; Chen, Z.; Pommier, T.; Decourselle, T.; Qayyum, A.; Salomon, M.; Ginhac, D.; Skandarani, Y.; Boucher, A.; Brahim, K.; et al. Deep learning methods for automatic evaluation of delayed enhancement-mri. the results of the emidec challenge. Med. Image Anal. 2022, 79, 102428. [Google Scholar] [CrossRef]
  7. Xiong, Z.; Xia, Q.; Hu, Z.; Huang, N.; Bian, C.; Zheng, Y.; Vesal, S.; Ravikumar, N.; Maier, A.; Yang, X.; et al. A global benchmark of algorithms for segmenting the left atrium from late gadolinium-enhanced cardiac magnetic resonance imaging. Med. Image Anal. 2021, 67, 101832. [Google Scholar] [CrossRef]
  8. Ma, J.; Zhang, Y.; Gu, S.; Zhu, C.; Ge, C.; Zhang, Y.; An, X.; Wang, C.; Wang, Q.; Liu, X.; et al. Abdomenct-1k: Is abdominal organ segmentation a solved problem. IEEE Trans. Pattern Anal. Mach. Intell. 2021, 44, 6695–6714. [Google Scholar] [CrossRef]
  9. Heller, N.; Isensee, F.; Maier-Hein, K.H.; Hou, X.; Xie, C.; Li, F.; Nan, Y.; Mu, G.; Lin, Z.; Han, M.; et al. The state of the art in kidney and kidney tumor segmentation in contrast-enhanced ct imaging: Results of the kits19 challenge. Med. Image Anal. 2020, 67, 101821. [Google Scholar] [CrossRef] [PubMed]
  10. Tajbakhsh, N.; Jeyaseelan, L.; Li, Q.; Chiang, J.N.; Wu, Z.; Ding, X. Embracing imperfect datasets: A review of deep learning solutions for medical image segmentation. Med. Image Anal. 2020, 63, 101693. [Google Scholar] [CrossRef] [PubMed]
  11. Zhang, Y.; Liao, Q.; Yuan, L.; Zhu, H.; Xing, J.; Zhang, J. Exploiting shared knowledge from non-covid lesions for annotation-effificient COVID-19 ct lung infection segmentation. IEEE J. Biomed. Health Inform. 2021, 25, 4152–4162. [Google Scholar] [CrossRef]
  12. Chen, Z.; Zhu, L.; Wan, L.; Wang, S.; Feng, W.; Heng, P.-A. A Multi-task Mean Teacher for Semi-supervised Shadow Detection. In Proceedings of the IEEE/CVF Conference on Computer Vision and Pattern Recognition (CVPR 2020), Seattle, WA, USA, 13–19 June 2020. [Google Scholar]
  13. You, C.; Dai, W.; Min, Y.; Liu, F.; Clifton, D.A.; Zhou, S.K.; Staib, L.H.; Duncan, J.S. Rethinking semi-supervised medical image segmentation: A variance-reduction perspective. In Proceedings of the 37th Conference on Neural Information Processing Systems (NeurIPS 2023), New Orleans, LA, USA, 10–16 December 2024; Volume 36. [Google Scholar]
  14. Tarvainen, A.; Valpola, H. Mean teachers are better role models: Weight-averaged consistency targets improve semi-supervised deep learning results. In Proceedings of the 31st International Conference on Neural Information Processing Systems, Long Beach, CA, USA, 4–9 December 2017; pp. 1195–1204. [Google Scholar]
  15. Li, S.; Zhang, C.; He, X. Shape-aware semi-supervised 3d semantic segmentation for medical images. In Proceedings of the Conference on Medical Image Computing and Computer—Assisted Intervention, Lima, Peru, 4–8 October 2020; Springer: Cham, Switzerland, 2020; pp. 552–561. [Google Scholar]
  16. Luo, X.; Chen, J.; Song, T.; Wang, G. Semi-supervised medical image segmentation through dual-task consistency. Proc. AAAI Conf. Artif. Intell. 2021, 35, 8801–8809. [Google Scholar] [CrossRef]
  17. Wu, J.; Fu, R.A.; Fang, H.; Zhang, Y.; Yang, Y.; Xiong, H.; Liu, H.; Xu, Y. Medsegdiff: Medical image segmentation with diffusion probabilistic model. In Proceedings of the Medical Imaging with Deep Learning, Tromsø, Norway, 9–11 January 2024. [Google Scholar]
  18. Schlemper, J.; Oktay, O.; Schaap, M.; Heinrich, M.; Kainz, B.; Glocker, B.; Rueckert, D. Attention gated networks: Learning to leverage salient regions in medical images. Med. Image Anal. 2019, 53, 197–207. [Google Scholar] [CrossRef]
  19. Zhang, J.; Xiang, K.; Wang, J.; Liu, J.; Kang, M.; Pan, Z. Trans-Inf-Net: COVID-19 Lung Infection Segmentation based on Transformer. In Proceedings of the 8th ICVR, Nanjing, China, 26–28 May 2022; pp. 306–312. [Google Scholar]
  20. Cao, H.; Wang, Y.; Chen, J.; Jiang, D.; Zhang, X.; Tian, Q.; Wang, M. Swin-unet: Unet-like pure transformer for medical image segmentation. In Proceedings of the European Conference on Computer Vision, Tel Aviv, Israel, 23–27 October 2022; Springer Nature: Cham, Switzerland, 2022. [Google Scholar]
  21. Shi, F.; Wang, J.; Shi, J.; Wu, Z.; Wang, Q.; Tang, Z.; He, K.; Shi, Y.; Shen, D. Review of artifificial intelligence techniques in imaging data acquisition, segmentation and diagnosis for COVID-19. IEEE Rev. Biomed. Eng. 2020, 14, 4–15. [Google Scholar] [CrossRef] [PubMed]
  22. Jiang, J.; Hu, Y.-C.; Liu, C.-J.; Halpenny, D.; Hellmann, M.D.; Deasy, J.O.; Mageras, G.; Veeraraghavan, H. Multiple resolution residually connected feature streams for automatic lung tumor segmentation from CT images. IEEE Trans. Med. Imaging 2019, 38, 134–144. [Google Scholar] [CrossRef] [PubMed]
  23. Zhang, Y.; Zhou, Z.; David, P.; Yue, X.; Xi, Z.; Gong, B.; Foroosh, H. PolarNet: An Improved Grid Representation for Online LiDAR Point Clouds Semantic Segmentation. In Proceedings of the IEEE/CVF Conference on Computer Vision and Pattern Recognition (CVPR), Seattle, WA, USA, 13–19 June 2020. [Google Scholar]
  24. Kohl, S.; Romera-Paredes, B.; Meyer, C.; De Fauw, J.; Ledsam, J.R.; MaierHein, K.; Ronneberger, O. A probabilistic u-net for segmentation of ambiguous images. In Proceedings of the 32nd Annual Conference on Neural Information Processing Systems, Montreal, QC, Canada, 2–8 December 2018; pp. 6965–6975. [Google Scholar]
  25. Ronneberger, O.; Fischer, P.; Brox, T. U-net: Convolutional networks for biomedical image segmentation. In Medical Image Computing and Computer-Assisted Intervention—MICCAI; Springer: Cham, Switzerland, 2015; pp. 234–241. [Google Scholar]
  26. Oktay, O.; Schlemper, J.; Folgoc, L.L.; Lee, M.; Heinrich, M.; Misawa, K.; Glocker, B.; Rueckert, D. Attention u-net: Learning where to look for the pancreas. arXiv 2018, arXiv:1804.03999. [Google Scholar]
  27. Zhao, N.; Tong, N.; Ruan, D.; Sheng, K. Fully Automated Pancreas Segmentation with Two-Stage 3D Convolutional Neural Networks. In Medical Image Computing and Computer Assisted Intervention—MICCAI; Springer: Cham, Switzerland, 2019; pp. 201–209. [Google Scholar]
  28. Tsai, Y.H.; Hung, W.C.; Schulter, S.; Sohn, K.; Yang, M.H.; Chandraker, M. Learning to adapt structured output space for semantic segmentation. In Proceedings of the IEEE Conference on Computer Vision and Pattern Recognition, Salt Lake City, UT, USA, 18–23 June 2018; pp. 7472–7481. [Google Scholar]
  29. Tang, Y.; Tang, Y.; Xiao, J.; Summers, R.M. TUNA-Net: Task-oriented Unsupervised Adversarial Network for Disease Recognition in CrossDomain Chest X-rays. In Proceedings of the International Conference on Medical Image Computing and Computer-Assisted Intervention, Shenzhen, China, 13–17 October 2019; pp. 431–440. [Google Scholar]
  30. Cheplygina, V.; de Bruijne, M.; Pluim, J.P. Not-so-supervised: A survey of semi-supervised, multi-instance, and transfer learning in medical image analysis. Med. Image Anal. 2019, 54, 280–296. [Google Scholar] [CrossRef] [PubMed]
  31. Zhang, Y.; Yang, L.; Chen, J.; Fredericksen, M.; Hughes, D.P.; Chen, D.Z. Deep adversarial networks for biomedical image segmentation utilizing unannotated images. In Medical Image Computing and Computer-Assisted Intervention—MICCAI; Springer: Cham, Switzerland, 2017; pp. 408–416. [Google Scholar]
  32. Bai, W.; Oktay, O.; Sinclair, M.; Suzuki, H.; Rajchl, M.; Tarroni, G.; Glocker, B.; King, A.; Matthews, P.M.; Rueckert, D. Semi-supervised learning for networkbased cardiac MR image segmentation. In Medical Image Computing and Computer-Assisted Intervention—MICCAI; Springer: Cham, Switzerland, 2017; pp. 253–260. [Google Scholar]
  33. Krähenbühl, P.; Koltun, V. Effificient inference in fully connected crfs with gaussian edge potentials. In Proceedings of the 25th Annual Conference on Neural Information Processing Systems 2011, Granada, Spain, 2–14 December 2011; pp. 109–117. [Google Scholar]
  34. Yu, L.; Wang, S.; Li, X.; Fu, C.-W.; Heng, P.-A. Uncertainty-aware self-ensembling model for semisupervised 3D left atrium segmentation. In Medical Image Computing and Computer-Assisted Intervention—MICCAI; Springer: Cham, Switzerland, 2019; pp. 605–613. [Google Scholar]
  35. Roy, S.; Koehler, G.; Ulrich, C.; Baumgartner, M.; Petersen, J.; Isensee, F.; Jaeger, P.F.; Maier-Hein, K. Mednext: Transformer-driven scaling of convnets for medical image segmentation. In Proceedings of the International Conference on Medical Image Computing and Computer-Assisted Intervention, Vancouver, BC, Canada, 8–12 October 2023; Springer Nature: Cham, Switzerland, 2023. [Google Scholar]
  36. Rahman, M.M.; Marculescu, R. Multi-scale hierarchical vision transformer with cascaded attention decoding for medical image segmentation. In Proceedings of the Medical Imaging with Deep Learning, Paris, France, 3–5 July 2024. [Google Scholar]
  37. Parmar, N.; Vaswani, A.; Uszkoreit, J.; Kaiser, L.; Shazeer, N.; Ku, A.; Tran, D. Image transformer. In Proceedings of the International Conference on Machine Learning, Stockholm, Sweden, 10–15 July 2018; pp. 4055–4064. [Google Scholar]
  38. Child, R.; Gray, S.; Radford, A.; Sutskever, I. Generating long sequences with sparse transformers. arXiv 2019, arXiv:1904.10509. [Google Scholar]
  39. Dosovitskiy, A.; Beyer, L.; Kolesnikov, A.; Weissenborn, D.; Zhai, X.; Unterthiner, T.; Dehghani, M.; Minderer, M.; Heigold, G.; Gelly, S.; et al. An image is worth 16 × 16 words: Transformers for image recognition at scale. In Proceedings of the International Conference on Learning Representations, Vienna, Austria, 4 May 2021. [Google Scholar]
  40. Liu, Z.; Lin, Y.; Cao, Y.; Hu, H.; Wei, Y.; Zhang, Z.; Lin, S.; Guo, B. Swin transformer: Hierarchical vision transformer using shifted windows. In Proceedings of the IEEE/CVF International Conference on Computer Vision, Montreal, BC, Canada, 11–17 October 2021; pp. 10012–10022. [Google Scholar]
  41. Xie, S.; Girshick, R.; Doll, P.; Tu, Z.; He, K. Aggregated residual transformations for deep neural networks. In Proceedings of the 2017 IEEE Conference on Computer Vision and Pattern Recognition (CVPR), Honolulu, HI, USA, 21–26 July 2017; pp. 5987–5995. [Google Scholar]
  42. Hou, Q.; Cheng, M.-M.; Hu, X.; Borji, A.; Tu, Z.; Torr, P. Deeply supervised salient object detection with short connections. IEEE Trans. Pattern Anal. Mach. Intell. 2019, 41, 815–828. [Google Scholar] [CrossRef]
  43. Zhu, L.; Deng, Z.; Hu, X.; Fu, C.-W.; Xu, X.; Qin, J.; Heng, P.-A. Bidirectional feature pyramid network with recurrent attention residual modules for shadow detection. In Proceedings of the European Conference on Computer Vision (ECCV), Munich, Germany, 8–14 September 2018; pp. 121–136. [Google Scholar]
  44. Fan, D.-P.; Yang, J.-F.; Cheng, M.-M.; Zhao, J.-X.; Liu, J.-J. EGNet: Edge guidance network for salient object detection. In Proceedings of the 2019 IEEE/CVF International Conference on Computer Vision (ICCV), Seoul, Republic of Korea, 27 October–2 November 2019; pp. 8779–8788. [Google Scholar]
  45. Cheng, M.-M.; Feng, J.; Jiang, J.; Liu, J.; Hou, Q. A simple pooling-based design for real-time salient object detection. In Proceedings of the 2019 IEEE/CVF Conference on Computer Vision and Pattern Recognition (CVPR), Long Beach, CA, USA, 15–20 June 2019; pp. 3917–3926. [Google Scholar]
  46. Chen, S.; Tan, X.; Wang, B.; Hu, X. Reverse attention for salient object detection. In Proceedings of the ECCV 2018 European Conference on Computer Vision, Munich, Germany, 8–14 September 2018; pp. 234–250. [Google Scholar]
  47. Canny, J. A computational approach to edge detection. IEEE Trans. Pattern Anal. Mach. Intell. 1986, 6, 679–698. [Google Scholar]
  48. Zhang, Y.; Zhang, J. Dual-task mutual learning for semi-supervised medical image segmentation. In Proceedings of the Pattern Recognition and Computer Vision: 4th Chinese Conference, PRCV 2021, Beijing, China, 29 October–1 November 2021; pp. 548–559. [Google Scholar]
  49. Yang, X.; He, X.; Zhao, J.; Zhang, Y.; Zhang, S.; Xie, P. COVID-CT-dataset: A CT scan dataset about COVID-19. arXiv 2020, arXiv:2003.13865. [Google Scholar]
  50. Fan, D.P.; Zhou, T.; Ji, G.P.; Zhou, Y.; Chen, G.; Fu, H.; Shen, J.; Shao, L. Inf-Net: Automatic COVID-19 Lung Infection Segmentation from CT Images. IEEE Trans. Med. Imaging 2020, 39, 2626–2637. [Google Scholar] [CrossRef] [PubMed]
  51. Fan, D.-P.; Cheng, M.-M.; Liu, Y.; Li, T.; Borji, A. Structuremeasure: A new way to evaluate foreground maps. In Proceedings of the 2017 IEEE International Conference on Computer Vision (ICCV), Venice, Italy, 22–29 October 2017; pp. 4548–4557. [Google Scholar]
  52. Fan, D.-P.; Gong, C.; Cao, Y.; Ren, B.; Cheng, M.-M.; Borji, A. Enhanced-alignment measure for binary foreground map evaluation. In Proceedings of the 27th International Joint Conference on Artificial Intelligence, Stockholm, Sweden, 13–19 July 2018; pp. 698–704. [Google Scholar]
Figure 1. The framework of multi-task mean teacher transYLmtMT network.
Applsci 14 02986 g001
Figure 2. The Framework of our transYL network.
Applsci 14 02986 g002
Figure 3. Segmentation results for visual comparison. Ronneberger O. [25], Oktay O. [26], Fan D.P. [50], Zhang J. [19].
Applsci 14 02986 g003
Figure 4. Visual comparison of ordinary dataset results. Ronneberger O. [25], Oktay O. [26], Fan D.P. [50], Zhang J. [19].
Applsci 14 02986 g004
Figure 5. Visual comparison of serious dataset results. Ronneberger O. [25], Oktay O. [26], Fan D.P. [50], Zhang J. [19].
Applsci 14 02986 g005
Figure 6. Visual comparison of critical dataset results. Ronneberger O. [25], Oktay O. [26], Fan D.P. [50], Zhang J. [19].
Applsci 14 02986 g006
Figure 7. Loss function during the training process.
Applsci 14 02986 g007
Table 1. Results on COVID-SemiSeg dataset.
DatasetMethodDiceSen.Spec. S α E ϕ m e a n MAE
COVID-SemiSeg DatasetU-Net [25] 0.5740.5610.9490.7060.7440.105
AttU-Net [26]0.5820.5080.9610.6840.7620.096
Inf-Net [50]0.6470.7090.9100.7370.8270.103
Trans-Inf-Net [19]0.6950.7210.9390.7780.8540.083
transYLmtMT0.7140.6510.9700.7410.8630.061
Red represents the best, blue represents the second best.
Table 2. Results on COVID-HSS ordinary dataset.
DatasetMethod DiceSen.Spec. S α E ϕ m e a n MAE
COVID-HSSOrdinaryU-Net [25] 0.2790.3380.7540.6070.6650.019
AttU-Net [26]0.2540.3080.7380.5860.6700.018
Inf-Net [50]0.3490.5900.8040.5860.6520.045
Trans-Inf-Net [19]0.5700.7370.9730.6780.6990.026
transYLmtMT0.8210.8570.9790.9300.9100.012
Red represents the best, blue represents the second best.
Table 3. Result on COVID-HSS serious dataset.
DatasetMethod DiceSen.Spec. S α E ϕ m e a n MAE
COVID-HSSSeriousU-Net [25]0.2870.3490.7840.6120.6680.019
AttU-Net [26]0.2660.3210.7550.5930.6680.019
Inf-Net [50]0.3570.5920.8160.5900.6540.046
Trans-Inf-Net [19]0.5780.7420.9730.6860.7060.026
transYLmtMT0.8240.8590.9790.9360.9120.013
Red represents the best, blue represents the second best.
Table 4. Result on COVID-HSS critical dataset.
DatasetMethod DiceSen.Spec. S α E ϕ m e a n MAE
COVID-HSSCriticalU-Net [25]0.2840.3630.7620.6130.6620.019
AttU-Net [26]0.2310.3010.7320.5830.6510.018
Inf-Net [50]0.3300.6010.7930.5750.6210.053
Trans-Inf-Net [19]0.5610.7340.9710.6700.6920.028
transYLmtMT0.8230.8620.9870.9240.9030.015
Red represents the best, blue represents the second best.
Disclaimer/Publisher’s Note: The statements, opinions and data contained in all publications are solely those of the individual author(s) and contributor(s) and not of MDPI and/or the editor(s). MDPI and/or the editor(s) disclaim responsibility for any injury to people or property resulting from any ideas, methods, instructions or products referred to in the content.

