
Investigating the Impact of Wildfires on Lake Water Quality Using Earth Observation Satellites
 , , , , and
Abstract
:1. Introduction
2. Materials and Methods
2.1. Datasets
2.2. Data and Statistical Analysis
3. Results
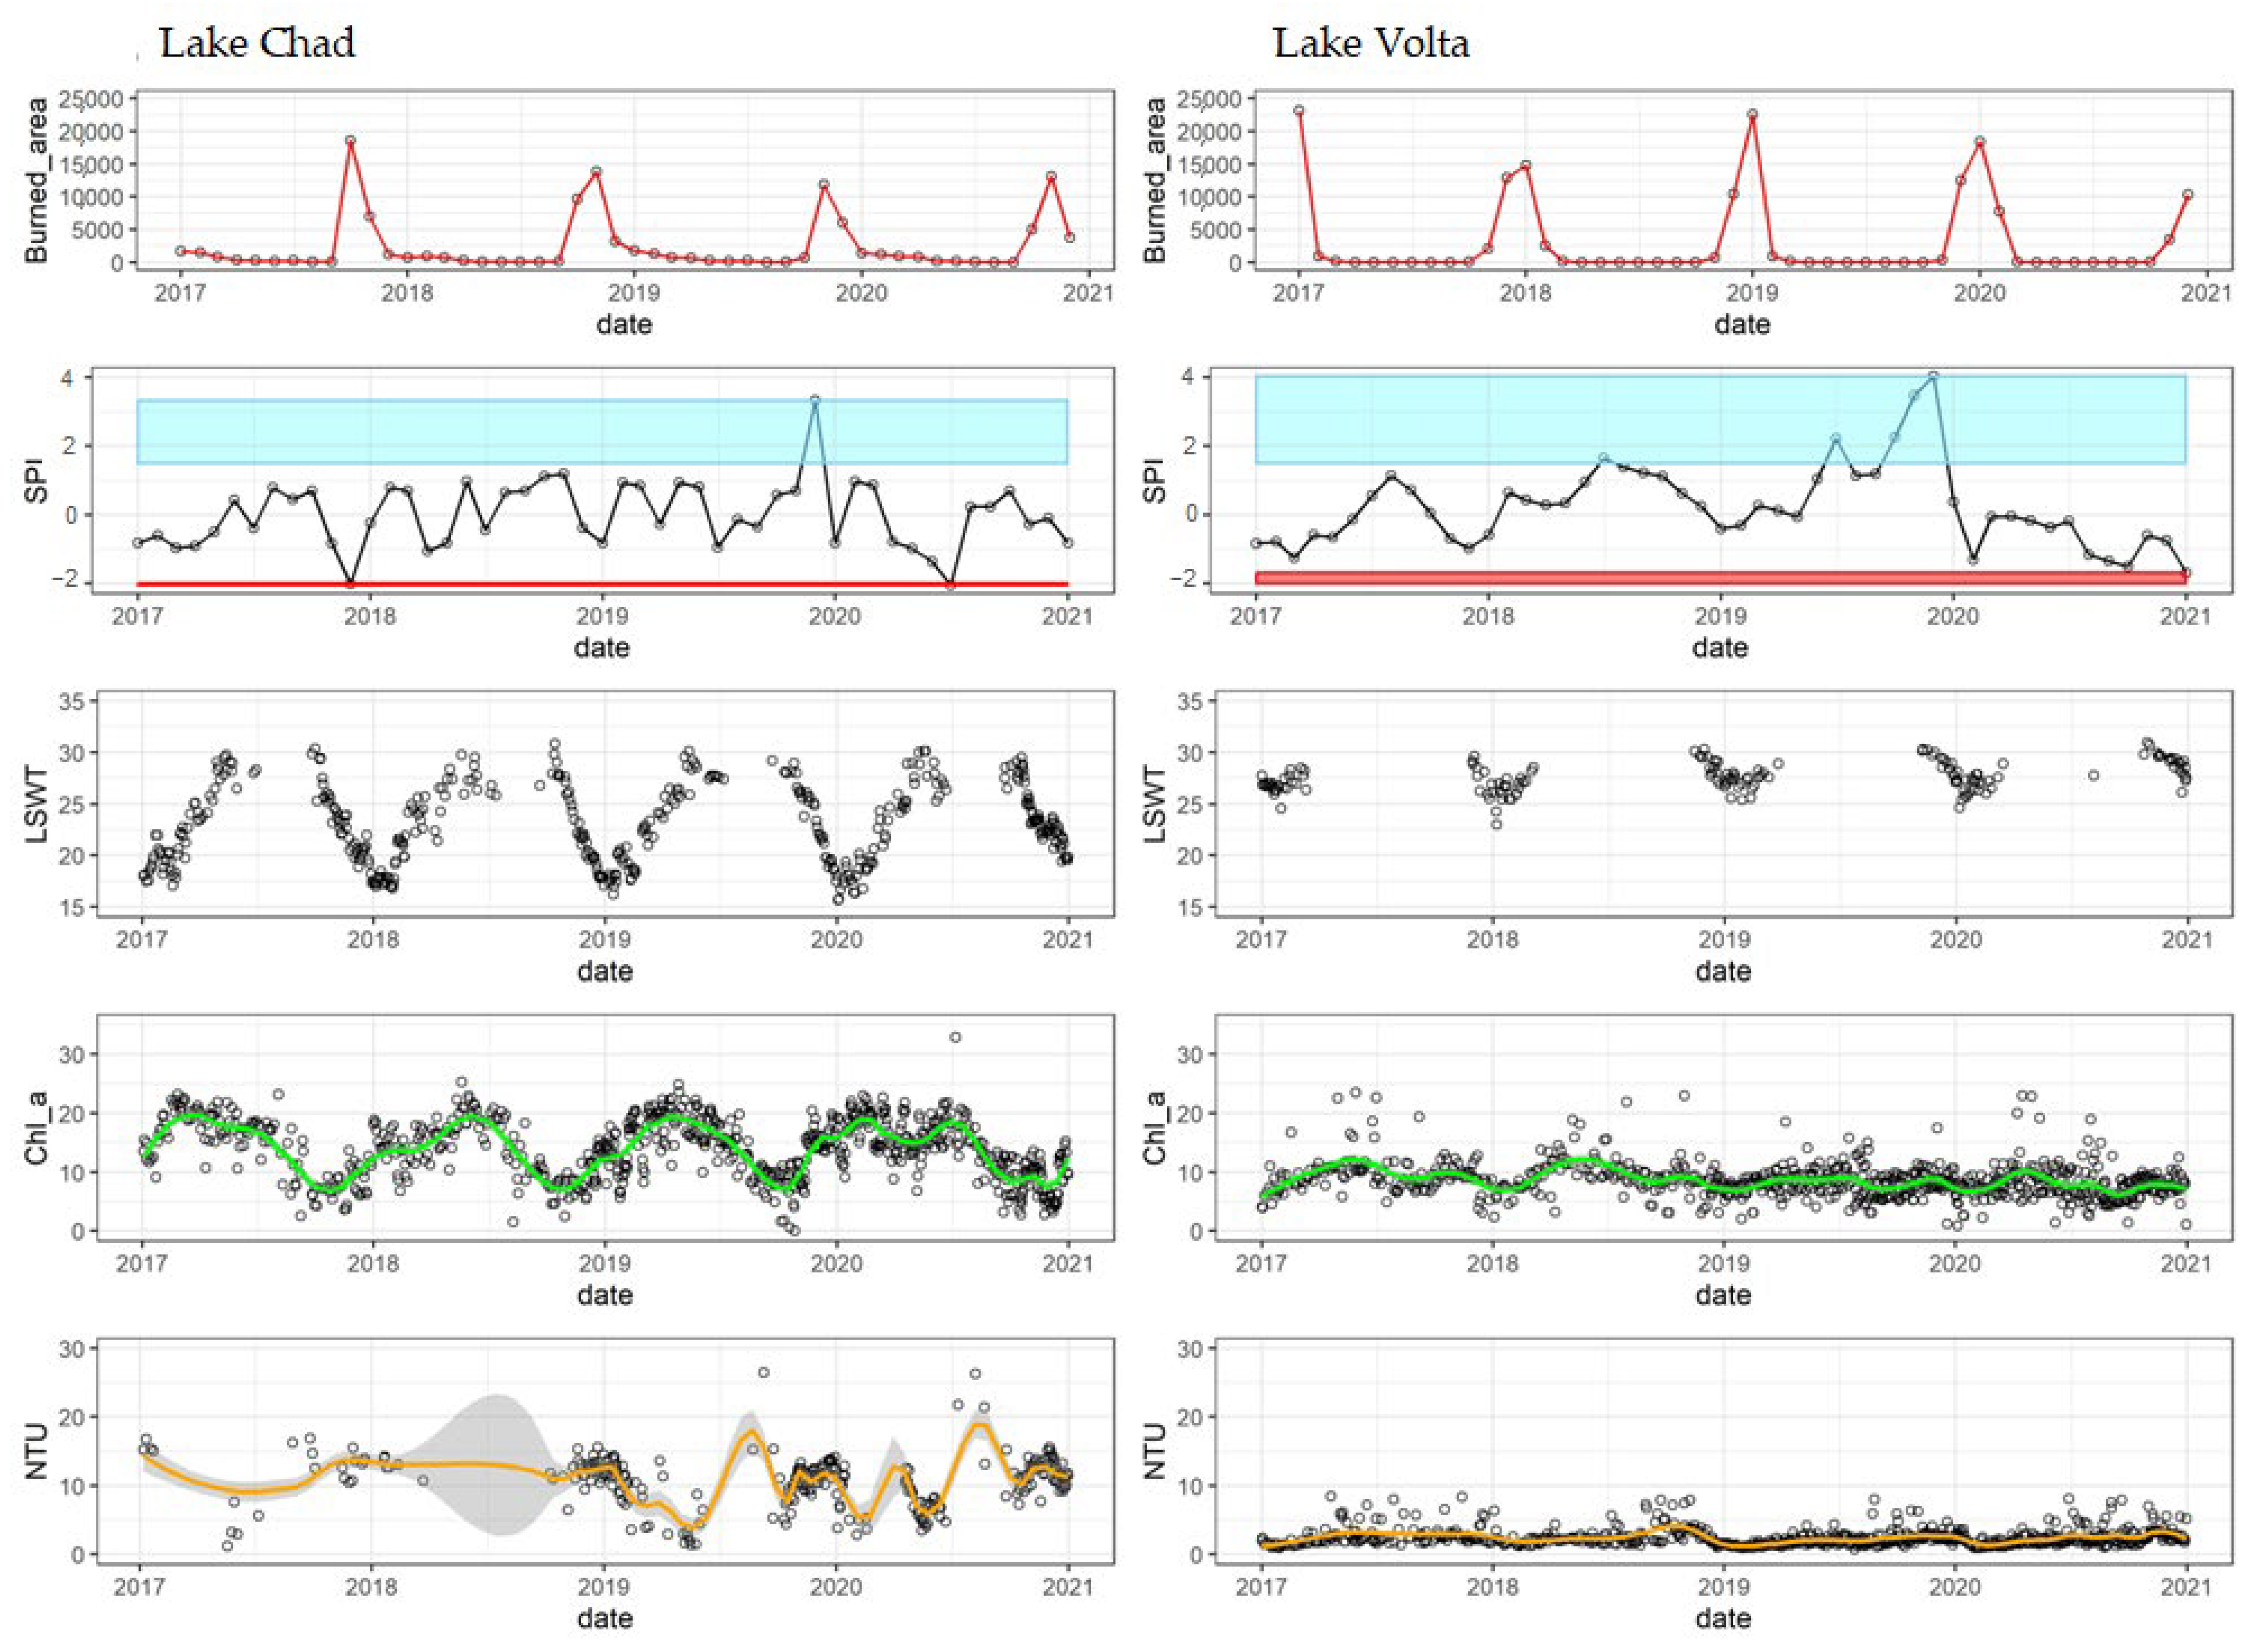
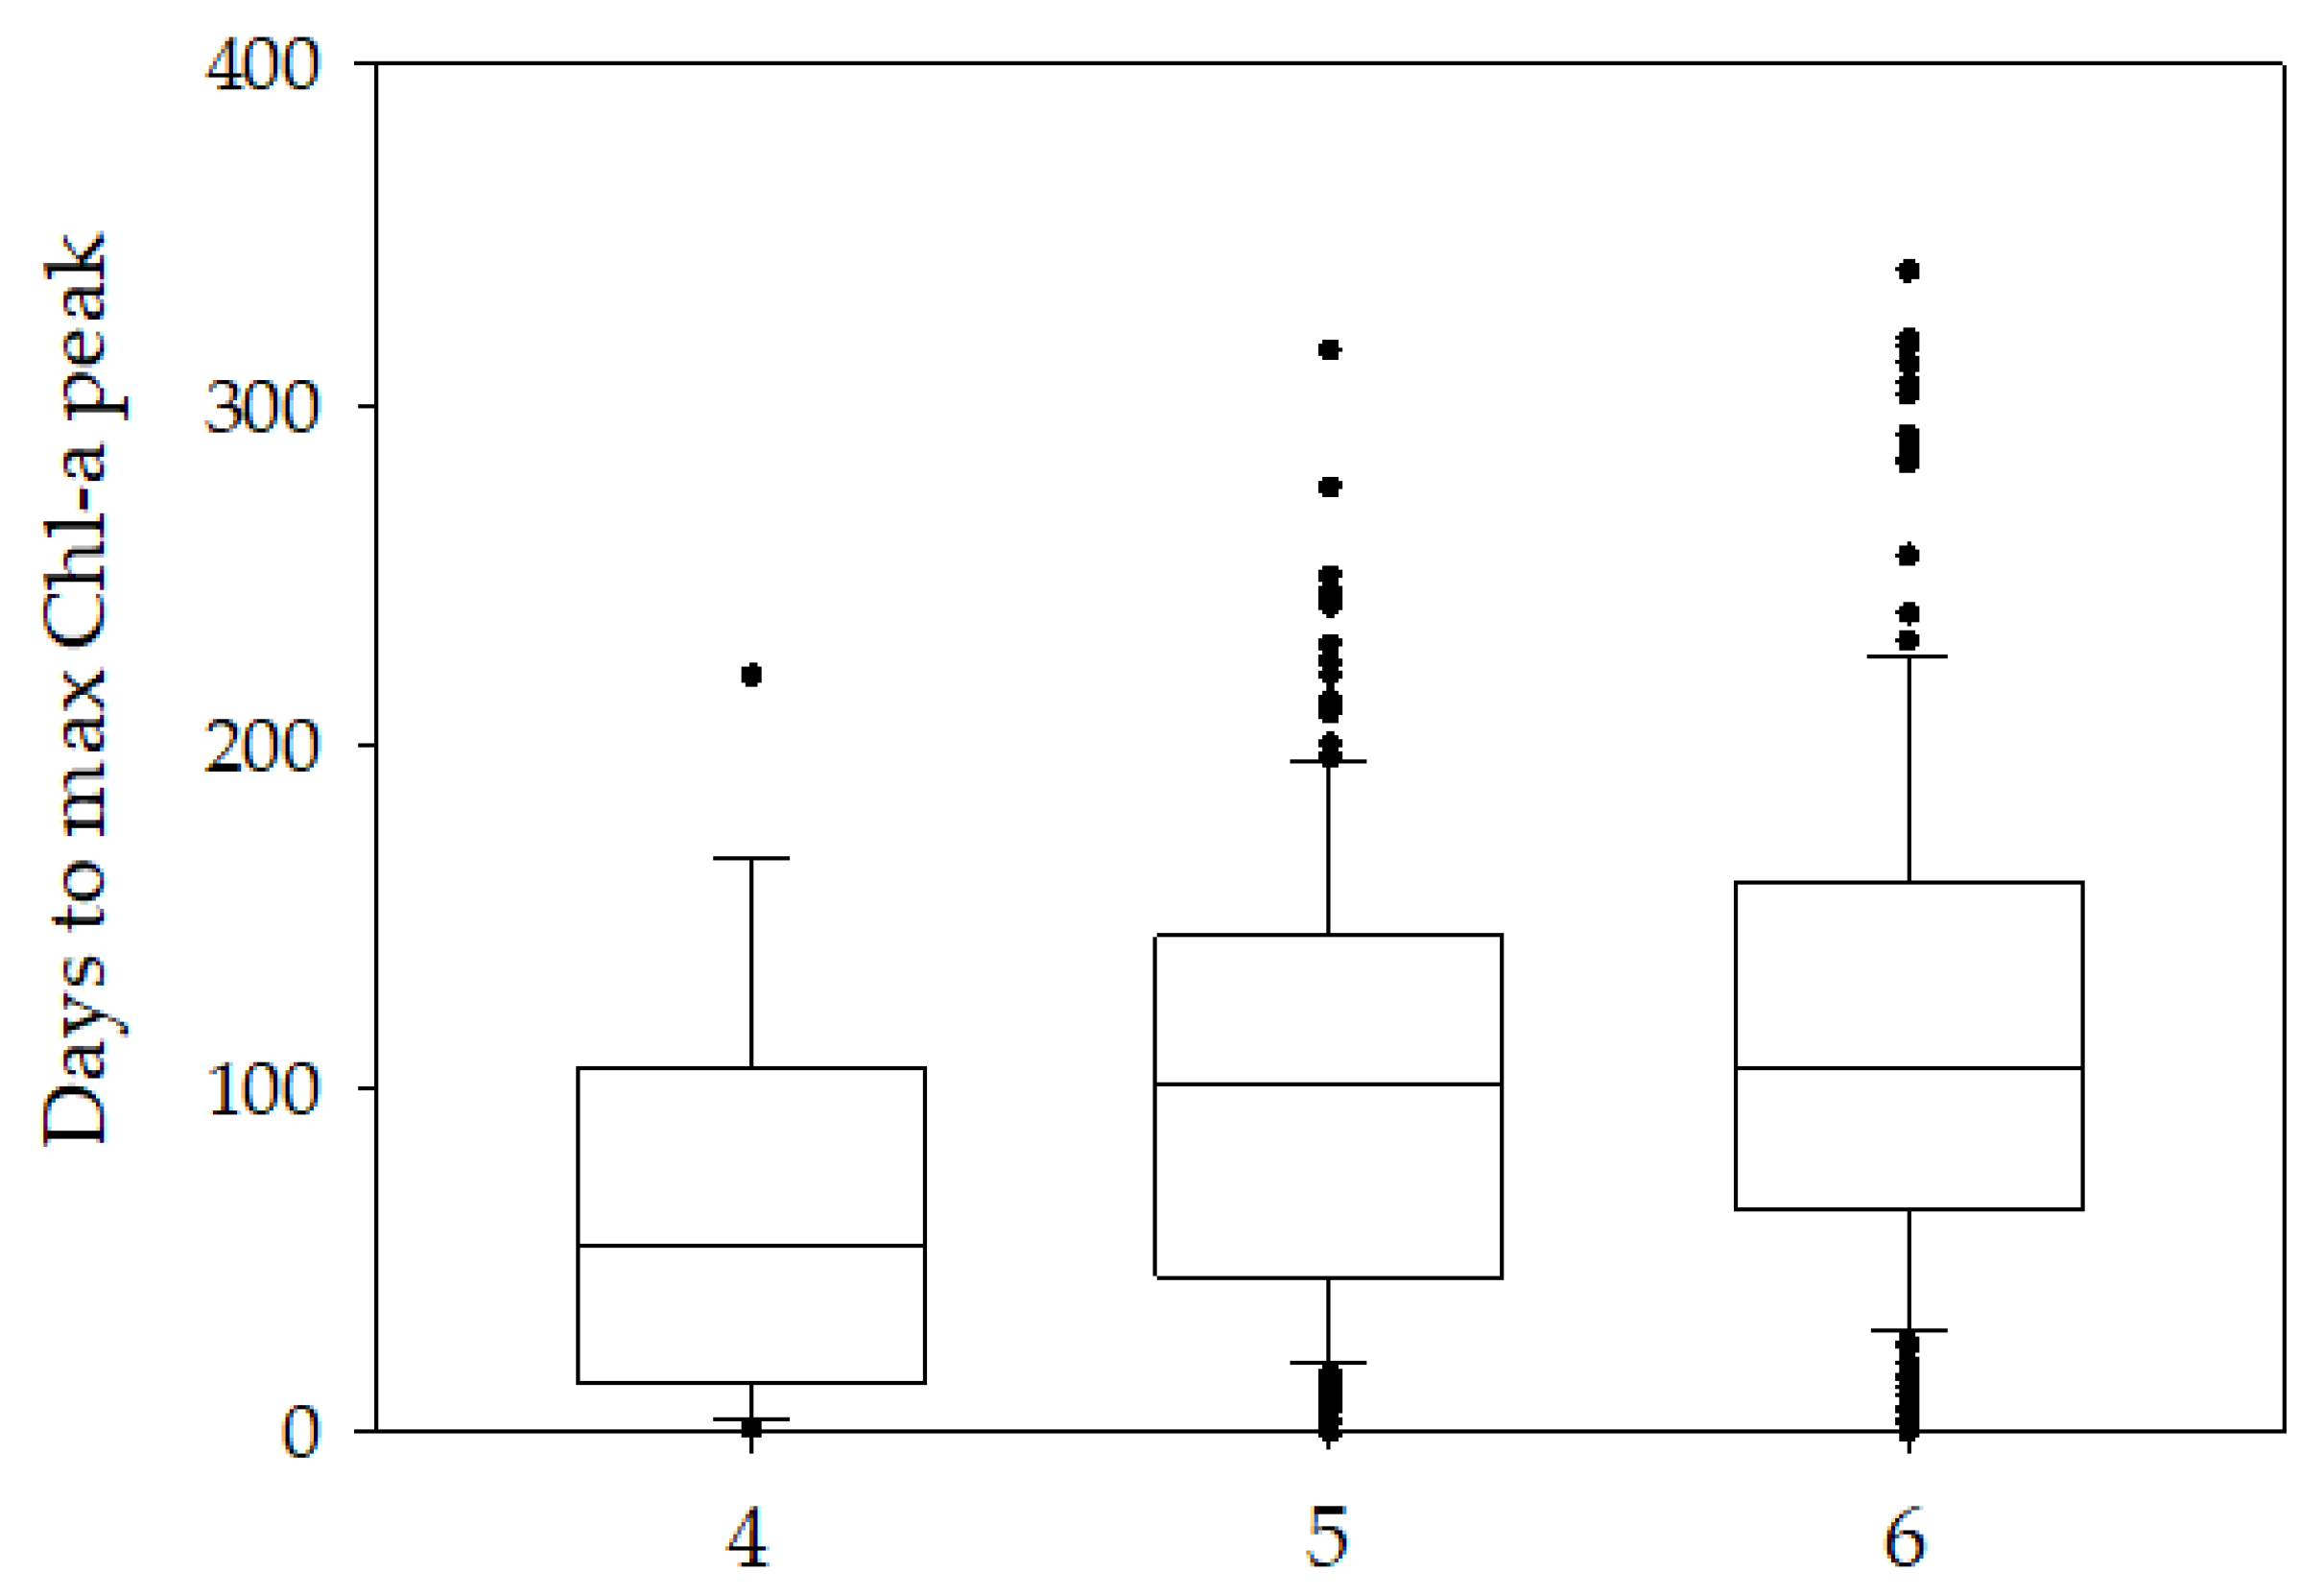
3.1. Selection of Lakes by SPR Approach
3.2. Lake Characteristics
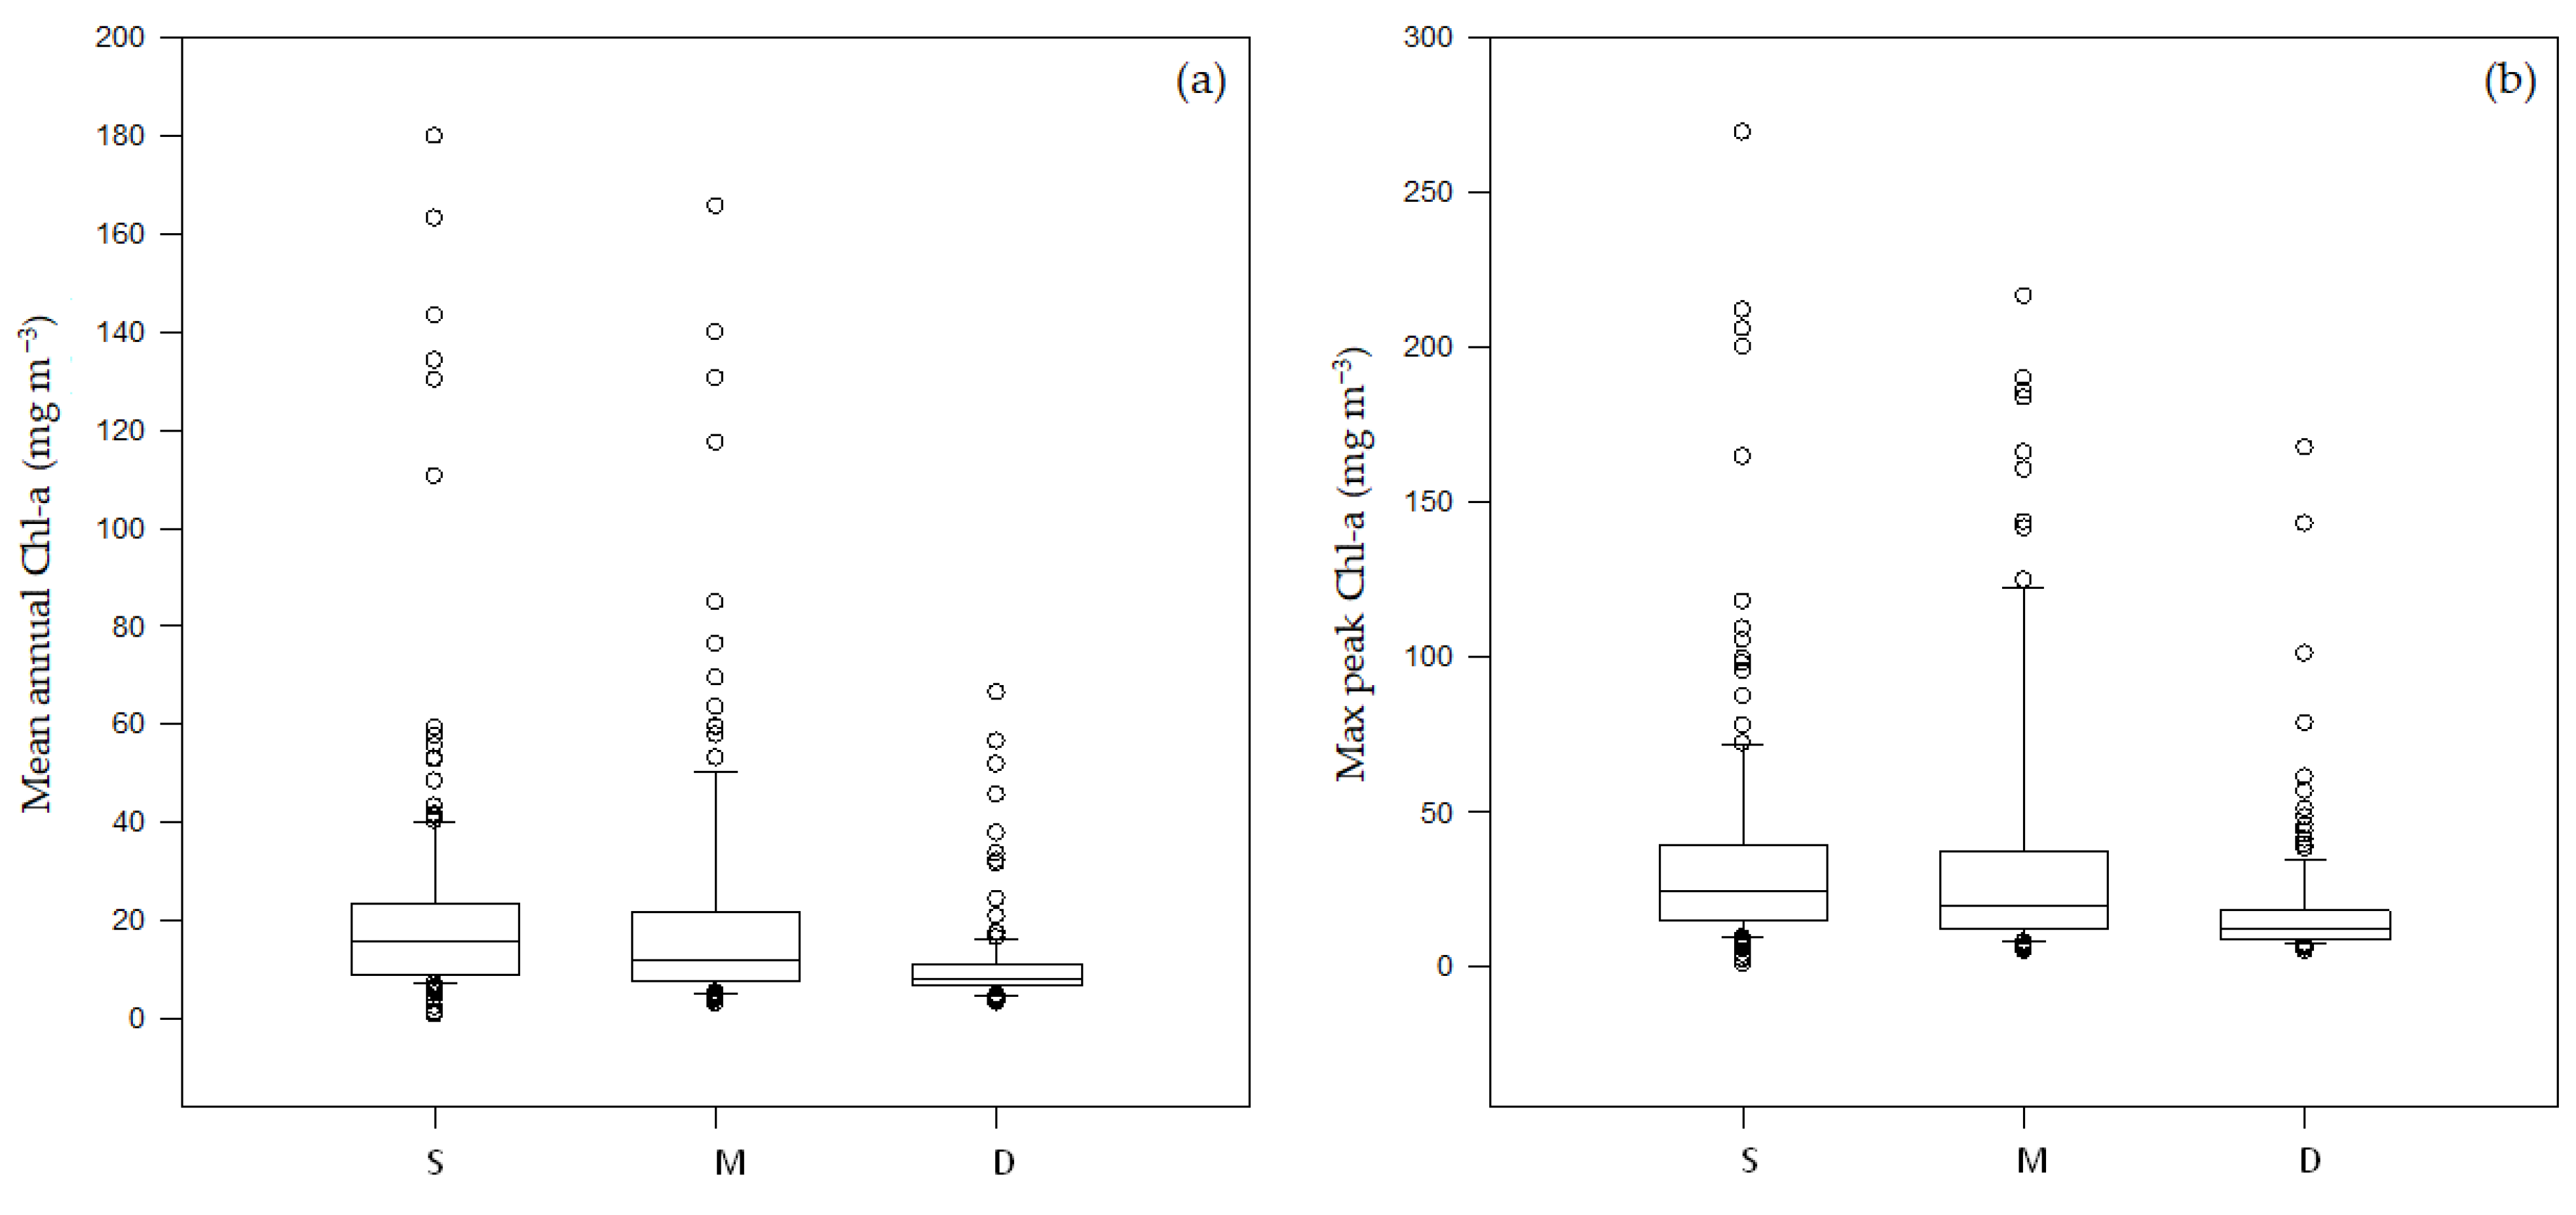
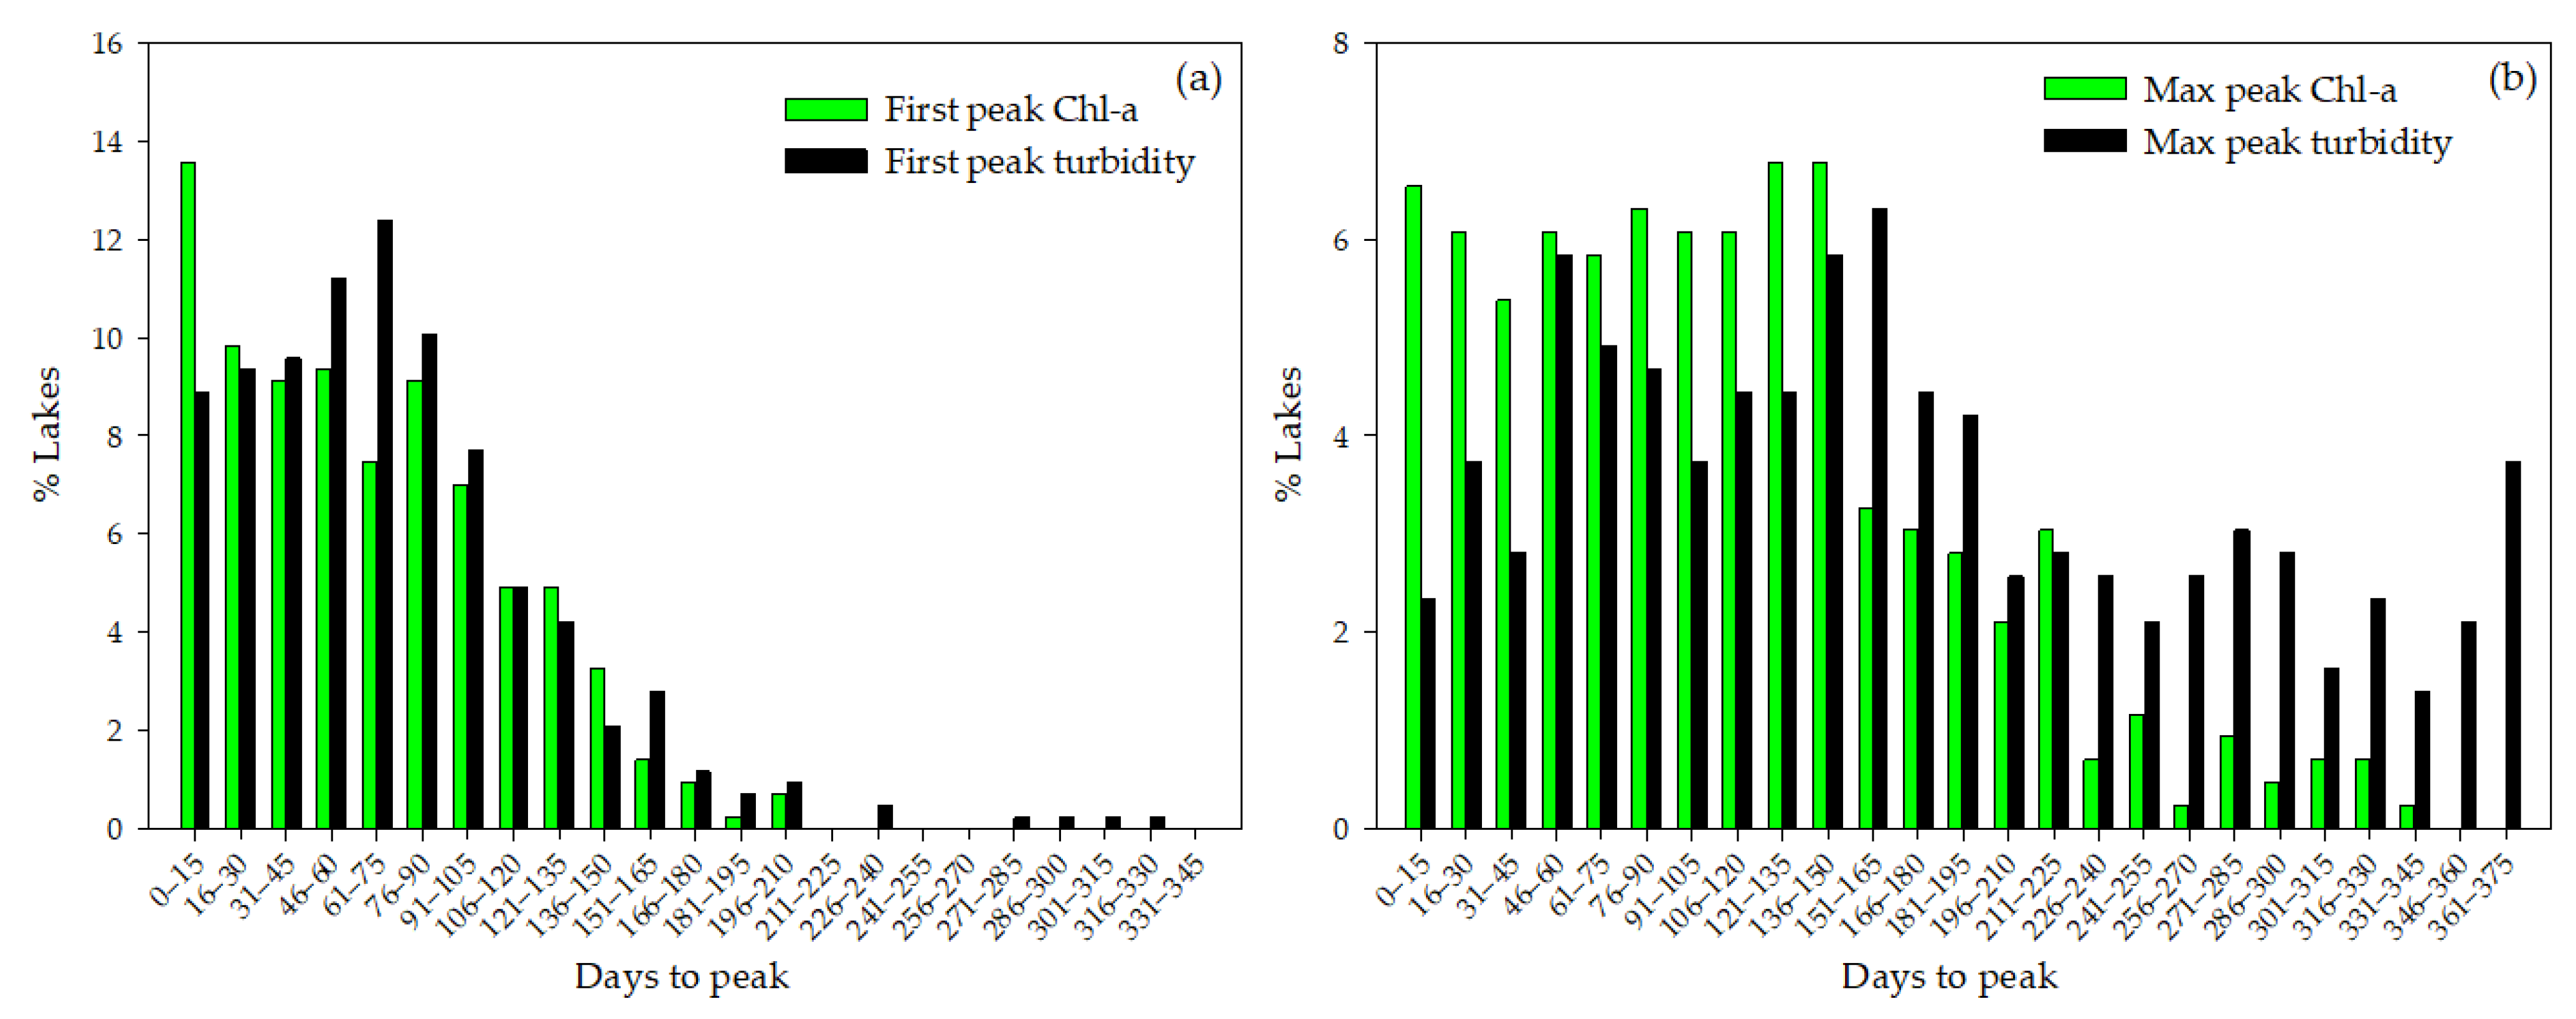
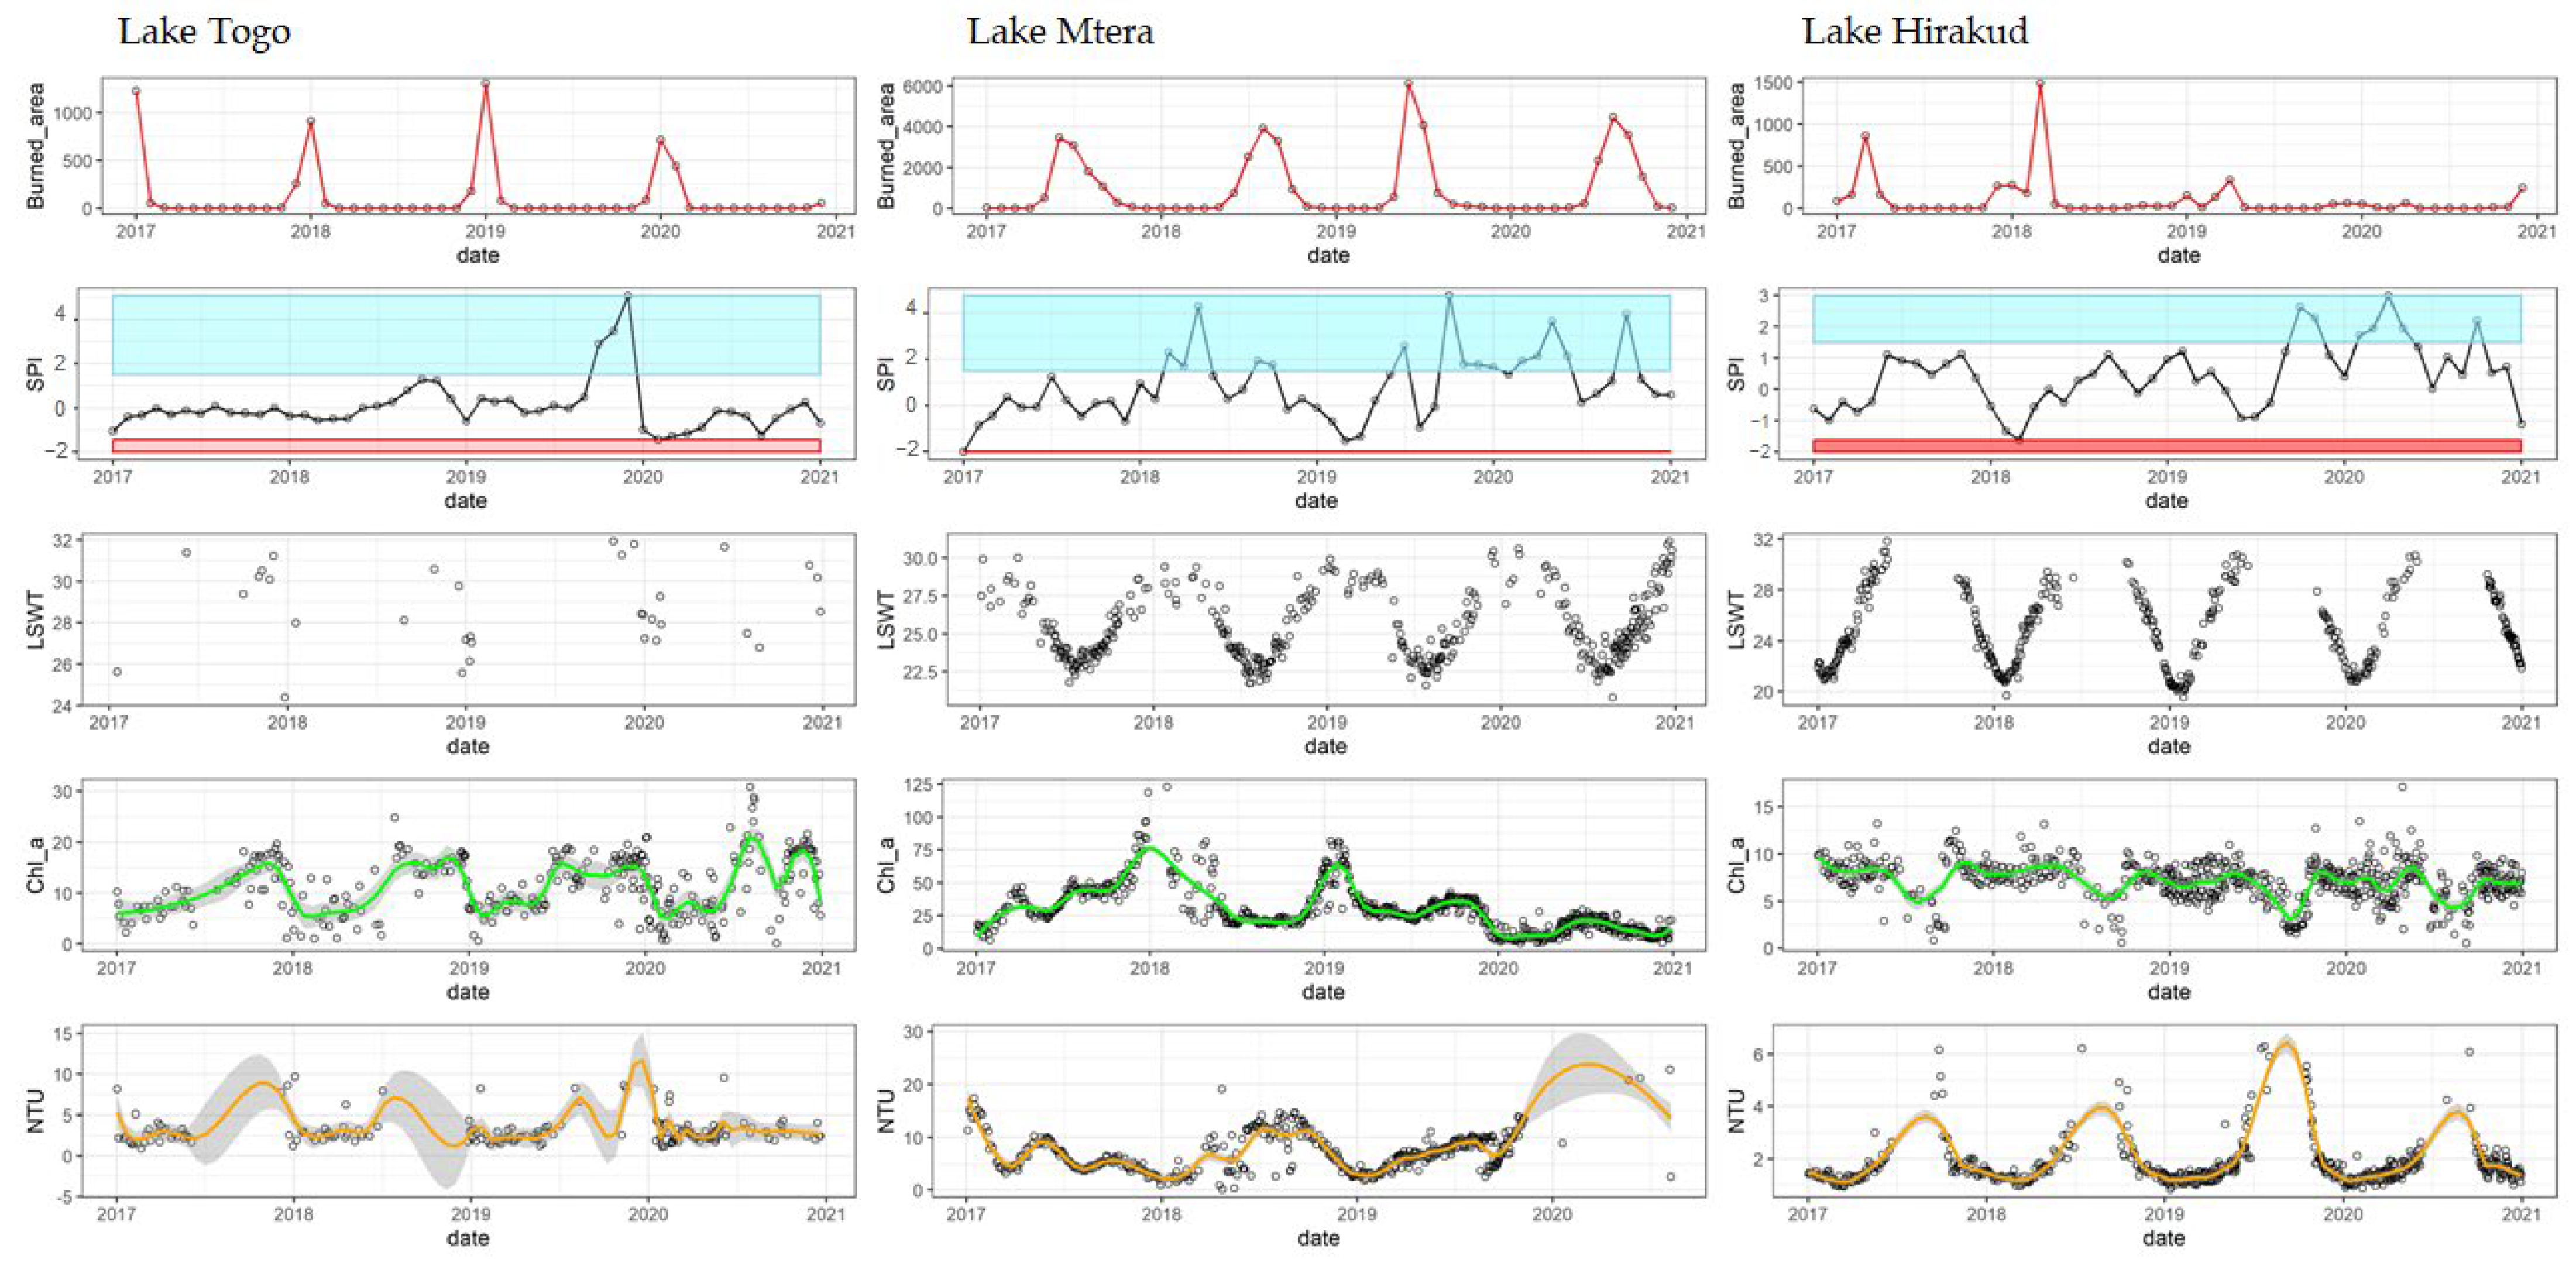
3.3. Determination of Peaks in Chl-a and Turbidity Concentrations
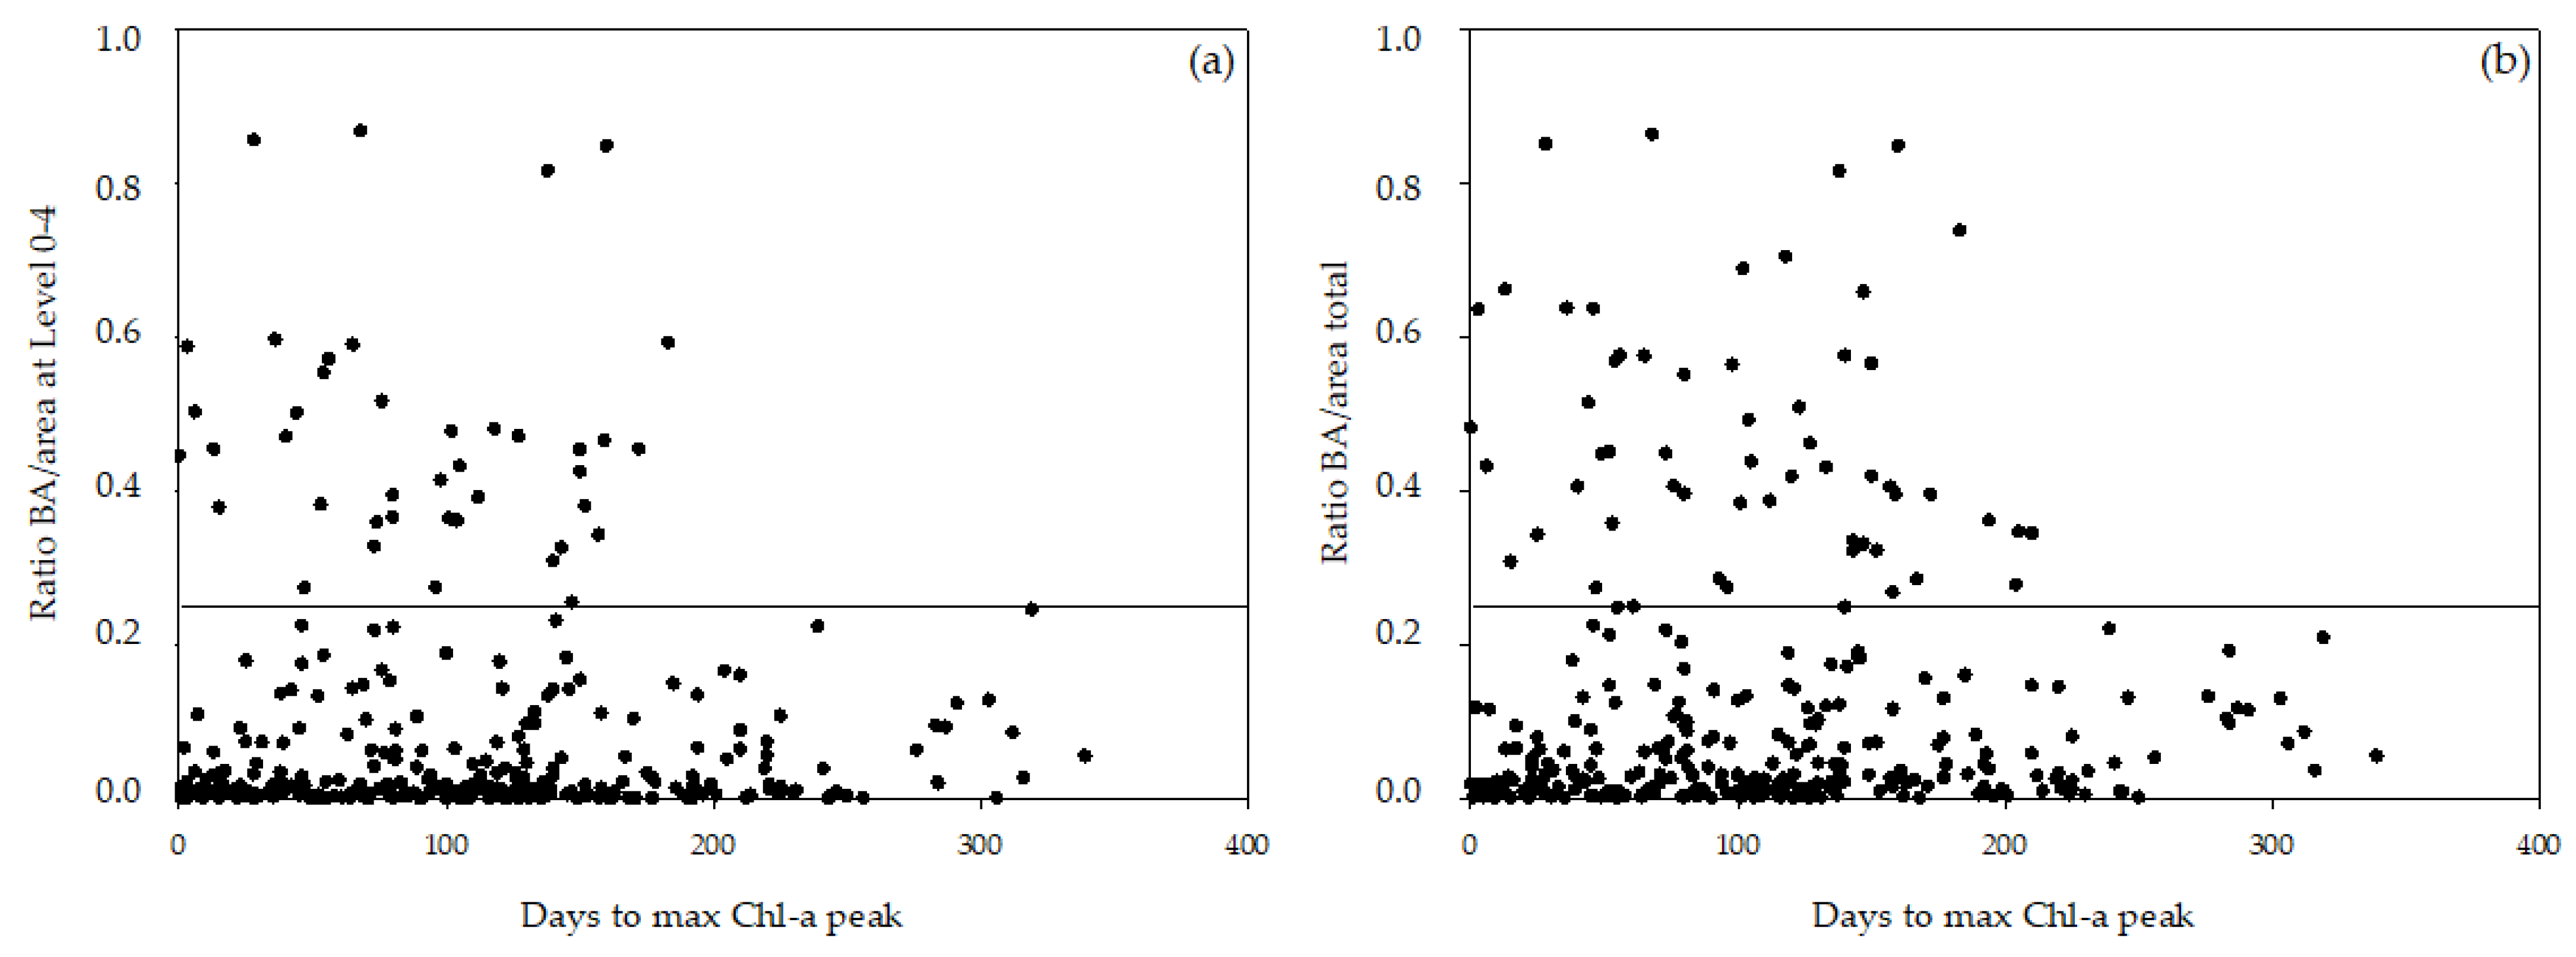
3.4. Time of Occurrence of Chl-a and Turbidity Peaks after a Fire
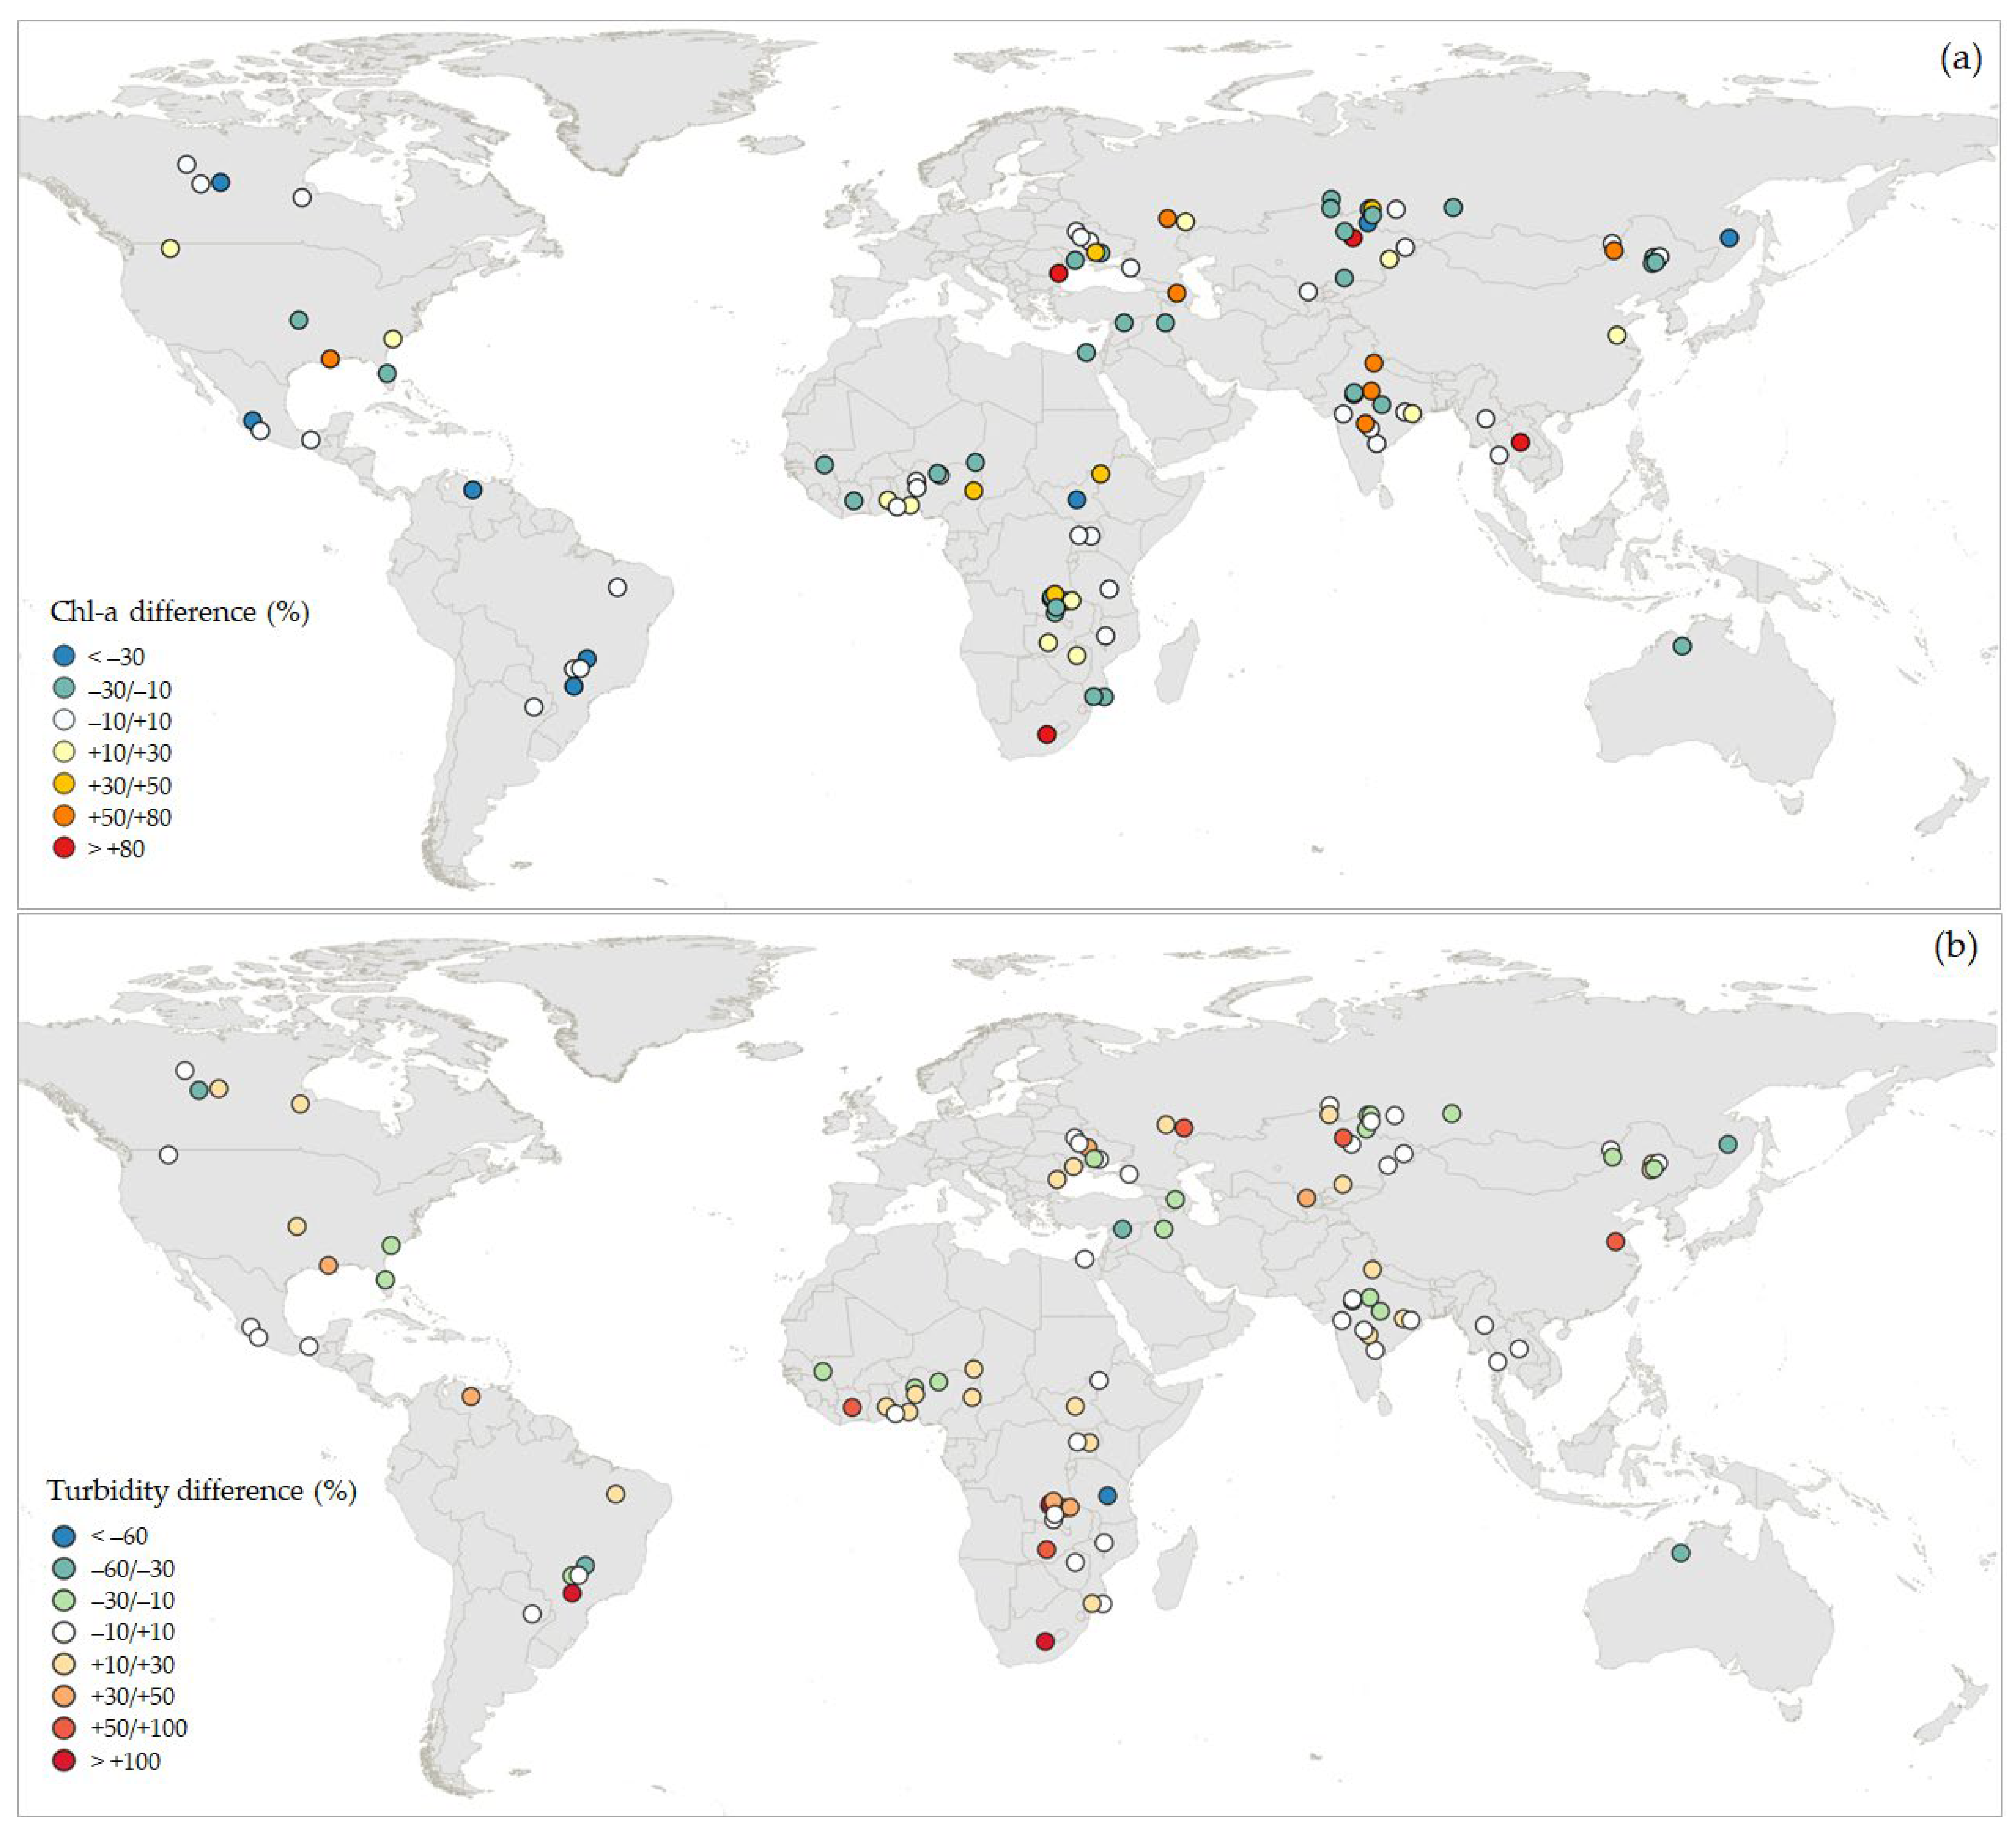
3.5. Post-Fire Water Quality Assessment
3.6. In-Lake Interactions between Chl-a and Turbidity
4. Discussion
5. Conclusions
Supplementary Materials
Author Contributions
Funding
Institutional Review Board Statement
Informed Consent Statement
Data Availability Statement
Acknowledgments
Conflicts of Interest
References
- Brown, K.P.; Gerber, A.; Bedulina, D.; Timofeyev, M.A. Human impact and ecosystemic health at Lake Baikal. WIREs Water 2021, 8, 1528. [Google Scholar] [CrossRef]
- Woolway, R.I.; Jennings, E.; Shatwell, T.; Golub, M.; Pierson, D.C.; Maberly, S.C. Lake heatwaves under climate change. Nature 2021, 589, 402–407. [Google Scholar] [CrossRef]
- McCullough, I.M.; Cheruvelil, K.S.; Lapierre, J.-F.; Lottig, N.R.; Moritz, M.A.; Stachelek, J.; Soranno, P.A. Do Lakes Feel the Burn? Ecological Consequences of Increasing Exposure of Lakes to Fire in the Continental United States. Glob. Chang. Biol. 2019, 25, 2841–2854. [Google Scholar] [CrossRef]
- Liu, D.; Zhou, C.; Keesing, J.K.; Serrano, O.; Werner, A.; Fang, Y.; Chen, Y.; Masque, P.; Kinloch, J.; Sadekov, A.; et al. Wildfires Enhance Phytoplankton Production in Tropical Oceans. Nat. Commun. 2022, 13, 1348. [Google Scholar] [CrossRef] [PubMed]
- Raoelison, O.D.; Valenca, R.; Lee, A.; Karim, S.; Webster, J.P.; Poulin, B.A.; Mohanty, S.K. Wildfire Impacts on Surface Water Quality Parameters: Cause of Data Variability and Reporting Needs. Environ. Pollut. 2023, 317, 120713. [Google Scholar] [CrossRef] [PubMed]
- Bixby, R.J.; Cooper, S.D.; Gresswell, R.E.; Brown, L.E.; Dahm, C.N.; Dwire, K.A. Fire Effects on Aquatic Ecosystems: An Assessment of the Current State of the Science. Freshw. Sci. 2015, 34, 1340–1350. [Google Scholar] [CrossRef]
- Williamson, C.E.; Overholt, E.P.; Brentrup, J.A.; Pilla, R.M.; Leach, T.H.; Schladow, S.G.; Warren, J.D.; Urmy, S.S.; Sadro, S.; Chandra, S.; et al. Sentinel Responses to Droughts, Wildfires, and Floods: Effects of UV Radiation on Lakes and Their Ecosystem Services. Front. Ecol. Environ. 2016, 14, 102–109. [Google Scholar] [CrossRef]
- Pinardi, M.; Stroppiana, D.; Caroni, R.; Parigi, L.; Tellina, G.; Free, G.; Giardino, C.; Albergel, C.; Bresciani, M. Assessing the Impact of Wildfires on Water Quality Using Satellite Remote Sensing: The Lake Baikal Case Study. Front. Remote Sens. 2023, 4, 1107275. [Google Scholar] [CrossRef]
- Holdgate, M.W. A Perspective of Environmental Pollution; Cambridge University Press: Cambridge, UK, 1979. [Google Scholar]
- Sneddon, J. Source-Pathway-Receptor Investigation of the Fate of Trace Elements Derived from Shotgun Pellets Discharged in Terrestrial Ecosystems Managed for Game Shooting. Environ. Pollut. 2009, 157, 2663–2669. [Google Scholar] [CrossRef] [PubMed]
- Environment Agency. Guidance on Assessment of Risks from Landfill Sites—External Consultation Report; Environment Agency: Bristol, UK, 2004.
- Scottish Government. Strategic Environmental Assessment (SEA) of Draft Plan for Offshore Wind Energy in Scottish Territorial Waters; Scottish Government: Edinburgh, UK, 2010; Volume 1.
- Narayan, S.; Hanson, S.; Nicholls, R.J.; Clarke, D.; Willems, P.; Ntegeka, V.; Monbaliu, J. A Holistic Model for Coastal Flooding Using System Diagrams and TheSource-Pathway-Receptor (SPR) Concept. Nat. Hazards Earth Syst. Sci. 2012, 12, 1431–1439. [Google Scholar] [CrossRef]
- Horrillo-Caraballo, J.M.; Reeve, D.E.; Simmonds, D.; Pan, S.; Fox, A.; Thompson, R.; Hoggart, S.; Kwan, S.S.H.; Greaves, D. Application of a Source-Pathway-Receptorconsequence (SPRC) Methodology to the Teign Estuary. UK J. Coast. Res. 2013, 65, 1939–1944. [Google Scholar] [CrossRef]
- Sun, D.; Wang, H.; Huang, J.; Zhang, J.; Liu, G. Urban Road Waterlogging Risk Assessment Based on the Source–Pathway–Receptor Concept in Shenzhen, China. J. Flood Risk Manag. 2023, 16, 12873. [Google Scholar] [CrossRef]
- Shakesby, R.A.; Doerr, S.H. Wildfire as a Hydrological and Geomorphological Agent. Earth-Sci. Rev. 2006, 74, 269–307. [Google Scholar] [CrossRef]
- Smith, H.G.; Sheridan, G.J.; Lane, P.N.J.; Nyman, P.; Haydon, S. Wildfire Effects on Water Quality in Forest Catchments: A Review with Implications for Water Supply. J. Hydrol. 2011, 396, 170–192. [Google Scholar] [CrossRef]
- Robichaud, P.R.; Elliot, W.J.; Pierson, F.B.; Hall, D.E.; Moffet, C.A. Predicting Postfire Erosion and Mitigation Effectiveness with a Web-Based Probabilistic Erosion Model. Catena 2007, 71, 229–241. [Google Scholar] [CrossRef]
- Malmon, D.V.; Reneau, S.L.; Katzman, D.; Lavine, A.; Lyman, J. Suspended Sediment Transport in an Ephemeral Stream Following Wildfire. J. Geophys. Res. Earth Surf. 2007, 112, F02006. [Google Scholar] [CrossRef]
- Cannon, S.H.; Gartner, J.E.; Wilson, R.C.; Bowers, J.C.; Laber, J.L. Storm Rainfall Conditions for Floods and Debris Flows from Recently Burned Areas in Southwestern Colorado and Southern California. Geomorphology 2008, 96, 250–269. [Google Scholar] [CrossRef]
- Moody, J.A.; Martin, D.A. Synthesis of Sediment Yields after Wildland Fire in Different Rainfall Regimes in the Western United States. Int. J. Wildland Fire 2009, 18, 96–115. [Google Scholar] [CrossRef]
- Ebel, B.A.; Moody, J.A.; Martin, D.A. Hydrologic Conditions Controlling Runoff Generation Immediately after Wildfire. Water Resour. Res. 2012, 48, W03529. [Google Scholar] [CrossRef]
- Bormann, F.H.; Likens, G.; Siccama, T.; Pierce, R.; Eaton, J. The Export of Nutrients and Recovery of Stable Conditions Following Deforestation at Hubbard Brook. Ecol. Monogr. 1974, 44, 255–277. [Google Scholar] [CrossRef]
- Lewis, T.L.; Lindberg, M.S.; Schmutz, J.A.; Bertram, M.R. Multi-Trophic Resilience of Boreal Lake Ecosystems to Forest Fires. Ecology 2014, 95, 1253–1263. [Google Scholar] [CrossRef]
- Carignan, R.; D’Arcy, P.; Lamontagne, S. Comparative Impacts of Fire and Forest Harvesting on Water Quality in Boreal Shield Lakes. Can. J. Fish. Aquat. Sci. 2000, 57, 105–117. [Google Scholar] [CrossRef]
- McEachern, P.; Prepas, E.E.; Gibson, J.J.; Dinsmore, W.P. Forest Fire Induced Impacts on Phosphorus, Nitrogen, and Chlorophyll a Concentrations in Boreal Subarctic Lakes of Northern Alberta. Can. J. Fish. Aquat. Sci. 2000, 57, 73–81. [Google Scholar] [CrossRef]
- De Palma-Dow, A.; McCullough, I.M.; Brentrup, J.A. Turning up the Heat: Long-term Water Quality Responses to Wildfires and Climate Change in a Hypereutrophic Lake. Ecosphere 2022, 13, e4271. [Google Scholar] [CrossRef]
- McCullough, I.M.; Brentrup, J.A.; Wagner, T.; Lapierre, J.; Henneck, J.; Paul, A.M.; Belair, M.; Moritz, M.A.; Filstrup, C.T. Fire Characteristics and Hydrologic Connectivity Influence Short-Term Responses of North Temperate Lakes to Wildfire. Geophys. Res. Lett. 2023, 50, 103953. [Google Scholar] [CrossRef]
- Zhao, Q.; Yu, L.; Du, Z.; Peng, D.; Hao, P.; Zhang, Y.; Gong, P. An Overview of the Applications of Earth Observation Satellite Data: Impacts and Future Trends. Remote Sens. 2022, 14, 1863. [Google Scholar] [CrossRef]
- Plummer, S.; Lecomte, P.; Doherty, M. The ESA Climate Change Initiative (CCI): A European Contribution to the Generation of the Global Climate Observing System. Remote Sens. Environ. 2017, 203, 2–8. [Google Scholar] [CrossRef]
- Lizundia-Loiola, J.; Otón, G.; Ramo, R.; Chuvieco, E. A Spatio-Temporal Active-Fire Clustering Approach for Global Burned Area Mapping at 250 m from MODIS Data. Remote Sens. Environ. 2020, 236, 111493. [Google Scholar] [CrossRef]
- Carrea, L.; Crétaux, J.-F.; Liu, X.; Wu, Y.; Calmettes, B.; Duguay, C.R.; Merchant, C.J.; Selmes, N.; Simis, S.G.H.; Warren, M.; et al. Satellite-Derived Multivariate World-Wide Lake Physical Variable Timeseries for Climate Studies. Sci. Data 2023, 10, 30. [Google Scholar] [CrossRef]
- Giglio, L.; Schroeder, W.; Justice, C.O. The Collection 6 MODIS Active Fire Detection Algorithm and Fire Products. Remote Sens. Environ. 2016, 178, 31–41. [Google Scholar] [CrossRef] [PubMed]
- Defourny, P.; Lamarche, C.; Bontemps, S.; Maet, T.; Bogaert, E.; Moreau, I.; Brockmann, C.; Boettcher, M.; Kirches, G.; Wevers, J.; et al. Land Cover Climate Change Initiative—Product User Guide v2; ESA-UCLouvain-Geomatics: Louvain-la-Neuve, Belgium, 2017; Issue 2.0. [Google Scholar]
- Baston, D.; ISciences, L.L.C. Exactextractr: Fast Extraction from Raster Datasets Using Polygons. R Package Version. 2022. Available online: https://CRAN.R-project.org/package=exactextractr.34 (accessed on 1 January 2022).
- Messager, M.L.; Lehner, B.; Grill, G.; Nedeva, I.; Schmitt, O. Estimating the Volume and Age of Water Stored in Global Lakes Using a Geo-Statistical Approach. Nat. Commun. 2016, 7, 13603. [Google Scholar] [CrossRef] [PubMed]
- Copernicus Climate Change Service Land Cover Classification Gridded Maps from 1992 to Present Derived from Satellite Observation. Copernicus Climate Change Service (C3S) Climate Data Store (CDS) 2019. Available online: https://cds.climate.copernicus.eu/portfolio/dataset/satellite-land-cover (accessed on 1 January 2022).
- Edwards, D.C.; McKee, B.T. Characteristics of 20th Century Drought in the United States at Multiple Time Scales; Department of Atmospheric Science, Colorado State University: Fort Collins, CO, USA, 1997. [Google Scholar]
- McCune, B.; Mefford, M.J. Multivariate Analysis of Ecological Data. Version 7; MjM Software Design: Gleneden Beach, OR, USA, 2016. [Google Scholar]
- Free, G.; Bresciani, M.; Pinardi, M.; Simis, S.; Liu, X.; Albergel, C.; Giardino, C. Investigating Lake Chlorophyll-a Responses to the 2019 European Double Heatwave Using Satellite Remote Sensing. Ecol. Indic. 2022, 142, 109217. [Google Scholar] [CrossRef]
- R Core Team. R: A Language and Environment for Statistical Computing; R Core Team: Vienna, Austria, 2019. [Google Scholar]
- Zeileis, A.; Grothendieck, G. Zoo: S3 Infrastructure for Regular and Irregular Time Series. J. Stat. Softw. 2005, 14, 1–27. Available online: http://www.jstatsoft.org/v14/i06/ (accessed on 14 September 2023). [CrossRef]
- Stockwell, J.D.; Doubek, J.P.; Adrian, R.; Anneville, O.; Carey, C.C.; Carvalho, L.; De Senerpont Domis, L.N.; Dur, G.; Frassl, M.A.; Grossart, H.-P.; et al. Storm Impacts on Phytoplankton Community Dynamics in Lakes. Glob. Chang. Biol. 2020, 26, 2756–2784. [Google Scholar] [CrossRef]
- Council of the European Communities. Directive 2000/60/EC of the European Parliament and of the Council of 23 October 2000 Establishing a Framework for Community Action in the Field of Water Policy. Off. J. Eur. Union 2000, L327, 72. [Google Scholar]
- Moss, B.; Stephen, D.; Alvarez, C.; Becares, E.; Bund, W.V.; Collings, S.E.; Donk, E.V.; Eyto, E.D.; Feldmann, T.; Fernández-Aláez, C.; et al. The Determination of Ecological Status in Shallow Lakes—A Tested System (ECOFRAME) for Implementation of the European Water Framework Directive. Aquat. Conserv. Mar. Freshw. Ecosyst. 2003, 13, 507–549. [Google Scholar] [CrossRef]
- Donis, D.; Mantzouki, E.; McGinnis, D.F.; Vachon, D.; Gallego, I.; Grossart, H.-P.; de Senerpont Domis, L.N.; Teurlincx, S.; Seelen, L.; Lürling, M.; et al. Stratification Strength and Light Climate Explain Variation in Chlorophyll a at the Continental Scale in a European Multilake Survey in a Heatwave Summer. Limnol. Oceanogr. 2021, 66, 4314–4333. [Google Scholar] [CrossRef]
- Elith, J.; Leathwick, J.R.; Hastie, T. A Working Guide to Boosted Regression Trees. J. Anim. Ecol. 2008, 77, 802–813. [Google Scholar] [CrossRef] [PubMed]
- Ridgeway, G.; Southworth, M.H.; RUnit, S. Package ‘Gbm’. Viitattu 2013, 10, 40. [Google Scholar]
- Wickham, H.; Romain, F.; Lionel, H.; Kirill, M. Dplyr: A Grammar of Data Manipulation; R Package Version; 2018. Available online: https://cran.r-project.org/web/packages/dplyr/index.html (accessed on 14 September 2023).
- Ripley, B.; Venables, W.; Ripley, M.B. Package ‘Nnet’; R Package Version; 2016; Volume 7, p. 700. Available online: https://cran.r-project.org/web/packages/nnet/ (accessed on 14 September 2023).
- Wickham, H. Data Analysis. In Ggplot2; Elegant Graphics for Data Analysis; Springer International Publishing: Cham, Switzerland, 2016; pp. 189–201. [Google Scholar]
- Kurz, I. Phosphorus Exports from Agricultural Grassland with Overland Flow and Drainage Water (Johnstown Castle). In Quantification of Phosphorus Loss from Soil to Water, Final Report and Literature Review; EPA: Wexford, Ireland, 2000; pp. 9–56. [Google Scholar]
- Schindler, D.W. A Hypothesis to Explain Differences and Similarities Among Lakes in the Experimental Lakes Area, Northwestern Ontario. J. Fish. Res. Board Can. 1971, 28, 295–301. [Google Scholar] [CrossRef]
- Engstrom, D.R. Influence of Vegetation and Hydrology on the Humus Budgets of Labrador Lakes. Can. J. Fish. Aquat. Sci. 1987, 44, 1306–1314. [Google Scholar] [CrossRef]
- Rasmussen, J.B.; Godbout, L.; Schallenberg, M. The Humic Content of Lake Water and Its Relationship to Watershed and Lake Morphometry. Limnol. Oceanogr. 1989, 34, 1336–1343. [Google Scholar] [CrossRef]
- Carvalho, L.; Solimini, A.; Phillips, G.; Berg, M.; Pietiläinen, O.-P.; Lyche Solheim, A.; Poikane, S.; Mischke, U. Chlorophyll Reference Conditions for European Lake Types Used for Intercalibration of Ecological Status. Aquat. Ecol. 2008, 42, 203–211. [Google Scholar] [CrossRef]
- Nõges, T. Relationships between Morphometry, Geographic Location and Water Quality Parameters of European Lakes. Hydrobiologia 2009, 633, 33–43. [Google Scholar] [CrossRef]
- Schindler, D.E.; Scheuerell, M.D. Habitat Coupling in Lake Ecosystems. Oikos 2002, 98, 177–189. [Google Scholar] [CrossRef]
- Mehner, T.; Diekmann, M.; Brämick, U.; Lemcke, R. Composition of Fish Communities in German Lakes as Related to Lake Morphology, Trophic State, Shore Structure and Human-Use Intensity. Freshw. Biol. 2005, 50, 70–85. [Google Scholar] [CrossRef]
- Vollenweider, R.A. Scientific Fundamentals of the Eutrophication of Lakes and Flowing Waters, with Particular Reference to Nitrogen and Phosphorus as Factors in Eutrophication; Organisation for Economic Co-operation and Development: Paris, France, 1968; Volume 192, p. 14. [Google Scholar]
- Horne, A.J.; Goldman, C.R. Limnology, 2nd ed.; McGraw-Hill: New York, NY, USA, 1994. [Google Scholar]
- Lewis, W.M., Jr. Tropical Lakes: How Latitude Makes a Difference. Perspect. Trop. Limnol. 1996, 4364, 43–64. [Google Scholar]
- Abell, J.M.; Özkundakci, D.; Hamilton, D.P.; Jones, J.R. Latitudinal Variation in Nutrient Stoichiometry and Chlorophyll-Nutrient Relationships in Lakes: A Global Study. Fundam. Appl. Limnol. 2012, 181, 1–14. [Google Scholar] [CrossRef]
- Crisman, T.L.; Chapman, L.J.; Chapman, C.A. Predictors of Seasonal Oxygen Levels in Small Florida Lakes: The Importance of Color. Hydrobiologia 1998, 368, 149–155. [Google Scholar] [CrossRef]
- Søndergaard, M.; Jensen, J.P.; Jeppesen, E. Role of Sediment and Internal Loading of Phosphorus in Shallow Lakes. Hydrobiologia 2003, 506, 135–145. [Google Scholar] [CrossRef]
- Grangeon, T.; Vandromme, R.; Cerdan, O.; Lo Porto, A. Modelling Forest Fire and Firebreak Scenarios in a Mediterranean Mountainous Catchment: Impacts on Sediment Loads. J. Environ. Manag. 2021, 289, 112497. [Google Scholar]
- Lathrop, R. Impacts of the 1988 Wildfires on the Water-Quality of Yellowstone and Lewis Lakes, Wyoming. Int. J. Wildland Fire 1994, 4, 169–175. [Google Scholar] [CrossRef]
- Agbeshie, A.A.; Abugre, S.; Atta-Darkwa, T.; Awuah, R. A Review of the Effects of Forest Fire on Soil Properties. J. For. Res. 2022, 33, 1419–1441. [Google Scholar] [CrossRef]
- Noske, P.J.; Lane, P.N.; Nyman, P.; Van der Sant, R.E.; Sheridan, G.J. Predicting Post-wildfire Overland Flow Using Remotely Sensed Indicators of Forest Productivity. Hydrol. Process. 2022, 36, e14769. [Google Scholar] [CrossRef]
- Allen, E.W.; Prepas, E.E.; Gabos, S.; Strachan, W.; Chen, W. Surface Water Chemistry of Burned and Undisturbed Watersheds on the Boreal Plain: An Ecoregion Approach. J. Environ. Eng. Sci. 2003, 2, 73–86. [Google Scholar] [CrossRef]
- Ranalli, A.J. A Summary of the Scientific Literature on the Effects of Fire on the Concentration of Nutrients in Surface Waters; US Geological Survey: Reston, VA, USA, 2004. [Google Scholar]
- Mishra, A.; Alnahit, A.; Campbell, B. Impact of Land Uses, Drought, Flood, Wildfire, and Cascading Events on Water Quality and Microbial Communities: A Review and Analysis. J. Hydrol. 2021, 596, 125707. [Google Scholar] [CrossRef]
- Sheridan, G.J.; Nyman, P.; Langhans, C.; Cawson, J.; Noske, P.J.; Oono, A.; Van der Sant, R.; Lane, P.N. Is Aridity a High-Order Control on the Hydro–Geomorphic Response of Burned Landscapes? Int. J. Wildland Fire 2015, 25, 262–267. [Google Scholar] [CrossRef]


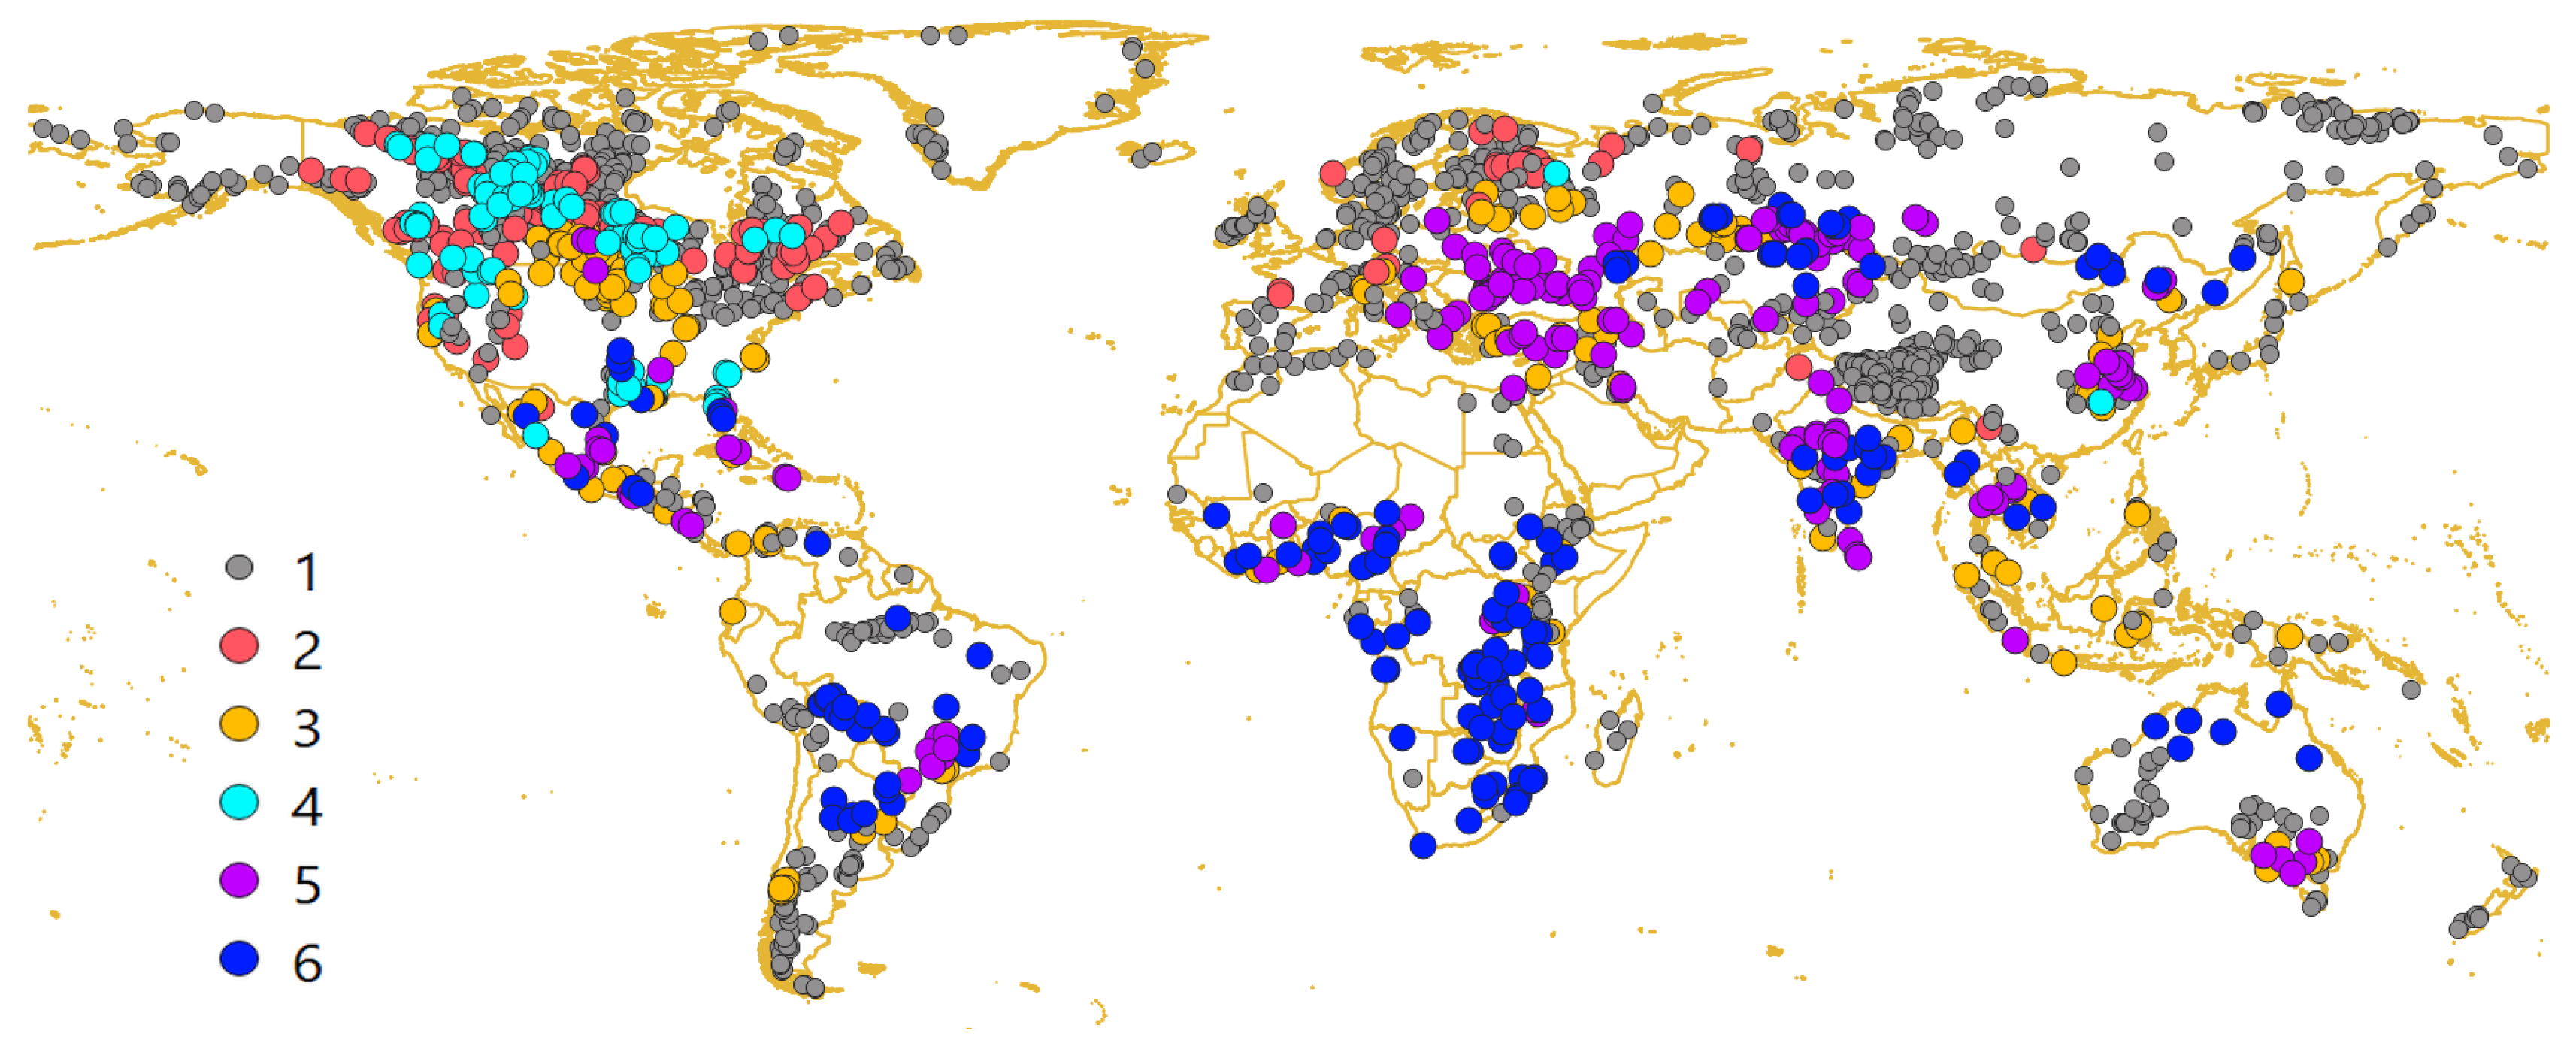
| Vegetation Type and Distribution | Rare Fires and Low BA | Rare Fires and Very Low BA | Limited Regular Annual Fires and Medium BA | Significant Regular Annual Fires and High BA | Limited Fire Peaks and Medium BA | Total | |
|---|---|---|---|---|---|---|---|
| Cluster | I | II | III | IV | V | ||
| Needleleaf deciduous (Global) | 1 | 383 | 698 | 128 | 15 | 57 | 1281 |
| Needleleaf, evergreen (Northern temperate) | 2 | 43 | 48 | 14 | 0 | 40 | 145 |
| Crops/Herbaceous (Global) | 3 | 71 | 19 | 53 | 6 | 3 | 152 |
| Boreal forest (Canada) | 4 | 54 | 10 | 13 | 0 | 18 | 95 |
| Crops—natural shrubbery (Eurasia) | 5 | 51 | 0 | 114 | 13 | 2 | 180 |
| Deciduous broad leaves (Africa, India, South America) | 6 | 17 | 0 | 93 | 61 | 0 | 171 |
| Total | 619 | 775 | 415 | 95 | 120 | 2024 |
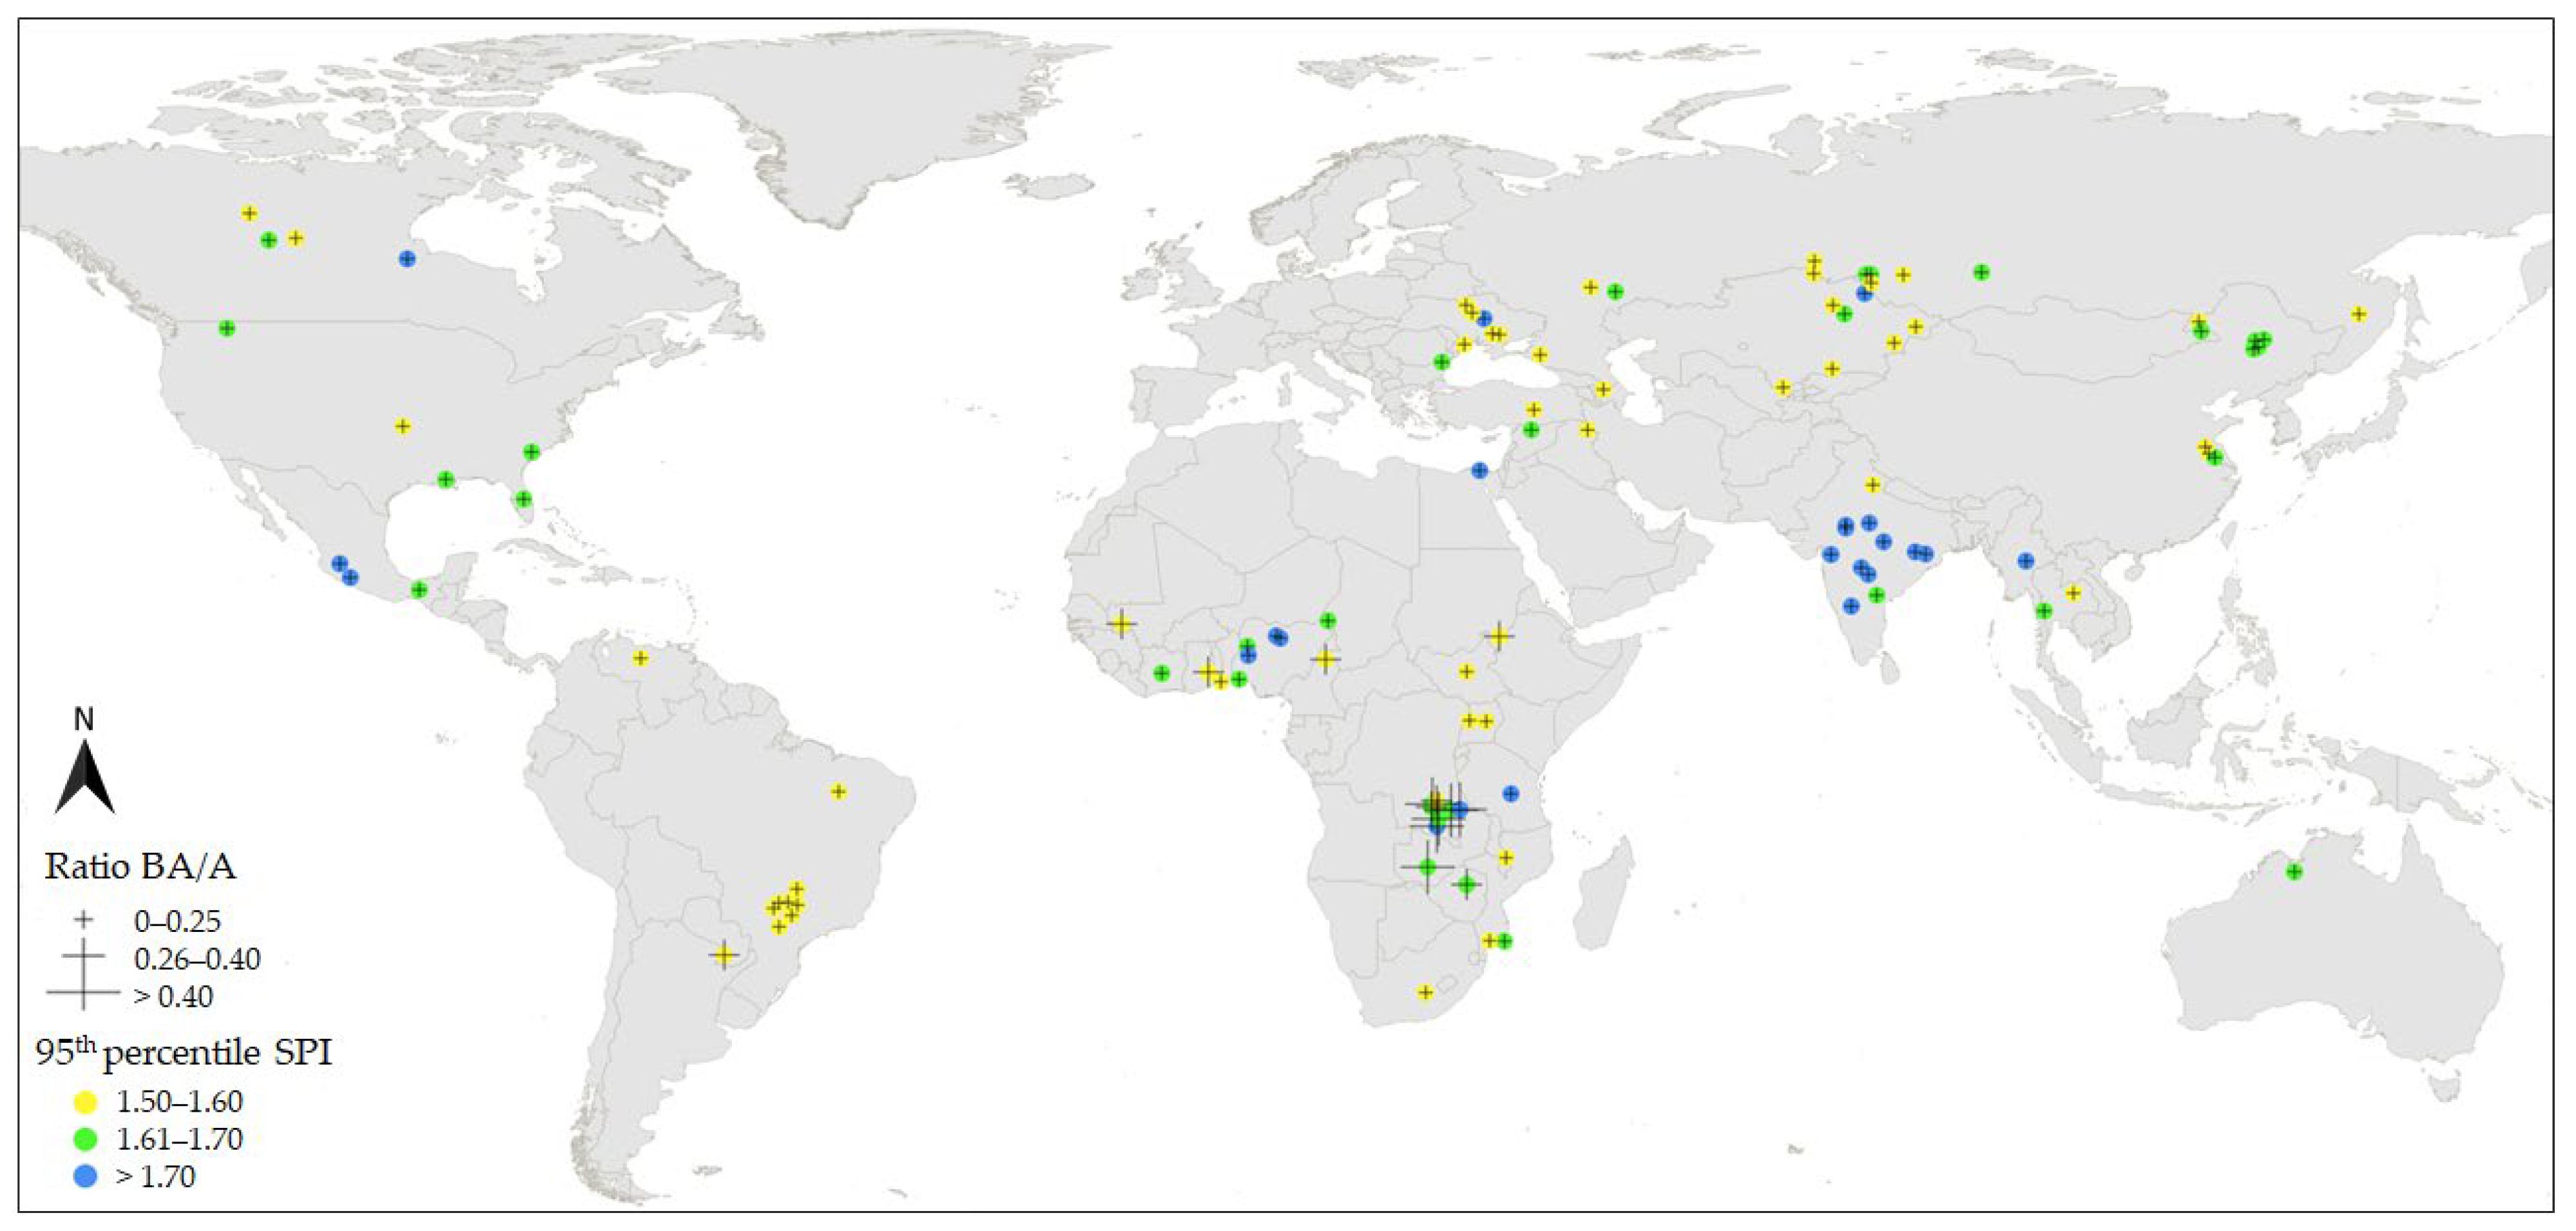
| Mean Chl-a 2017–2020 (mg m−3) | Mean Turbidity 2017–2020 (NTU) | Lake Area (km2) | Total Volume (km3) | Mean Depth (m) | Residence Time (Days) | Elevation (m a.s.l.) | |
|---|---|---|---|---|---|---|---|
| Mean | 18.6 | 4.6 | 1005 | 23,691 | 13.9 | 536 | 318 |
| Min | 1.7 | 0.6 | 15 | 34 | 0.1 | 0.2 | −2 |
| Max | 146.9 | 39.0 | 26,734 | 1,580,000 | 59.2 | 11,794 | 1518 |
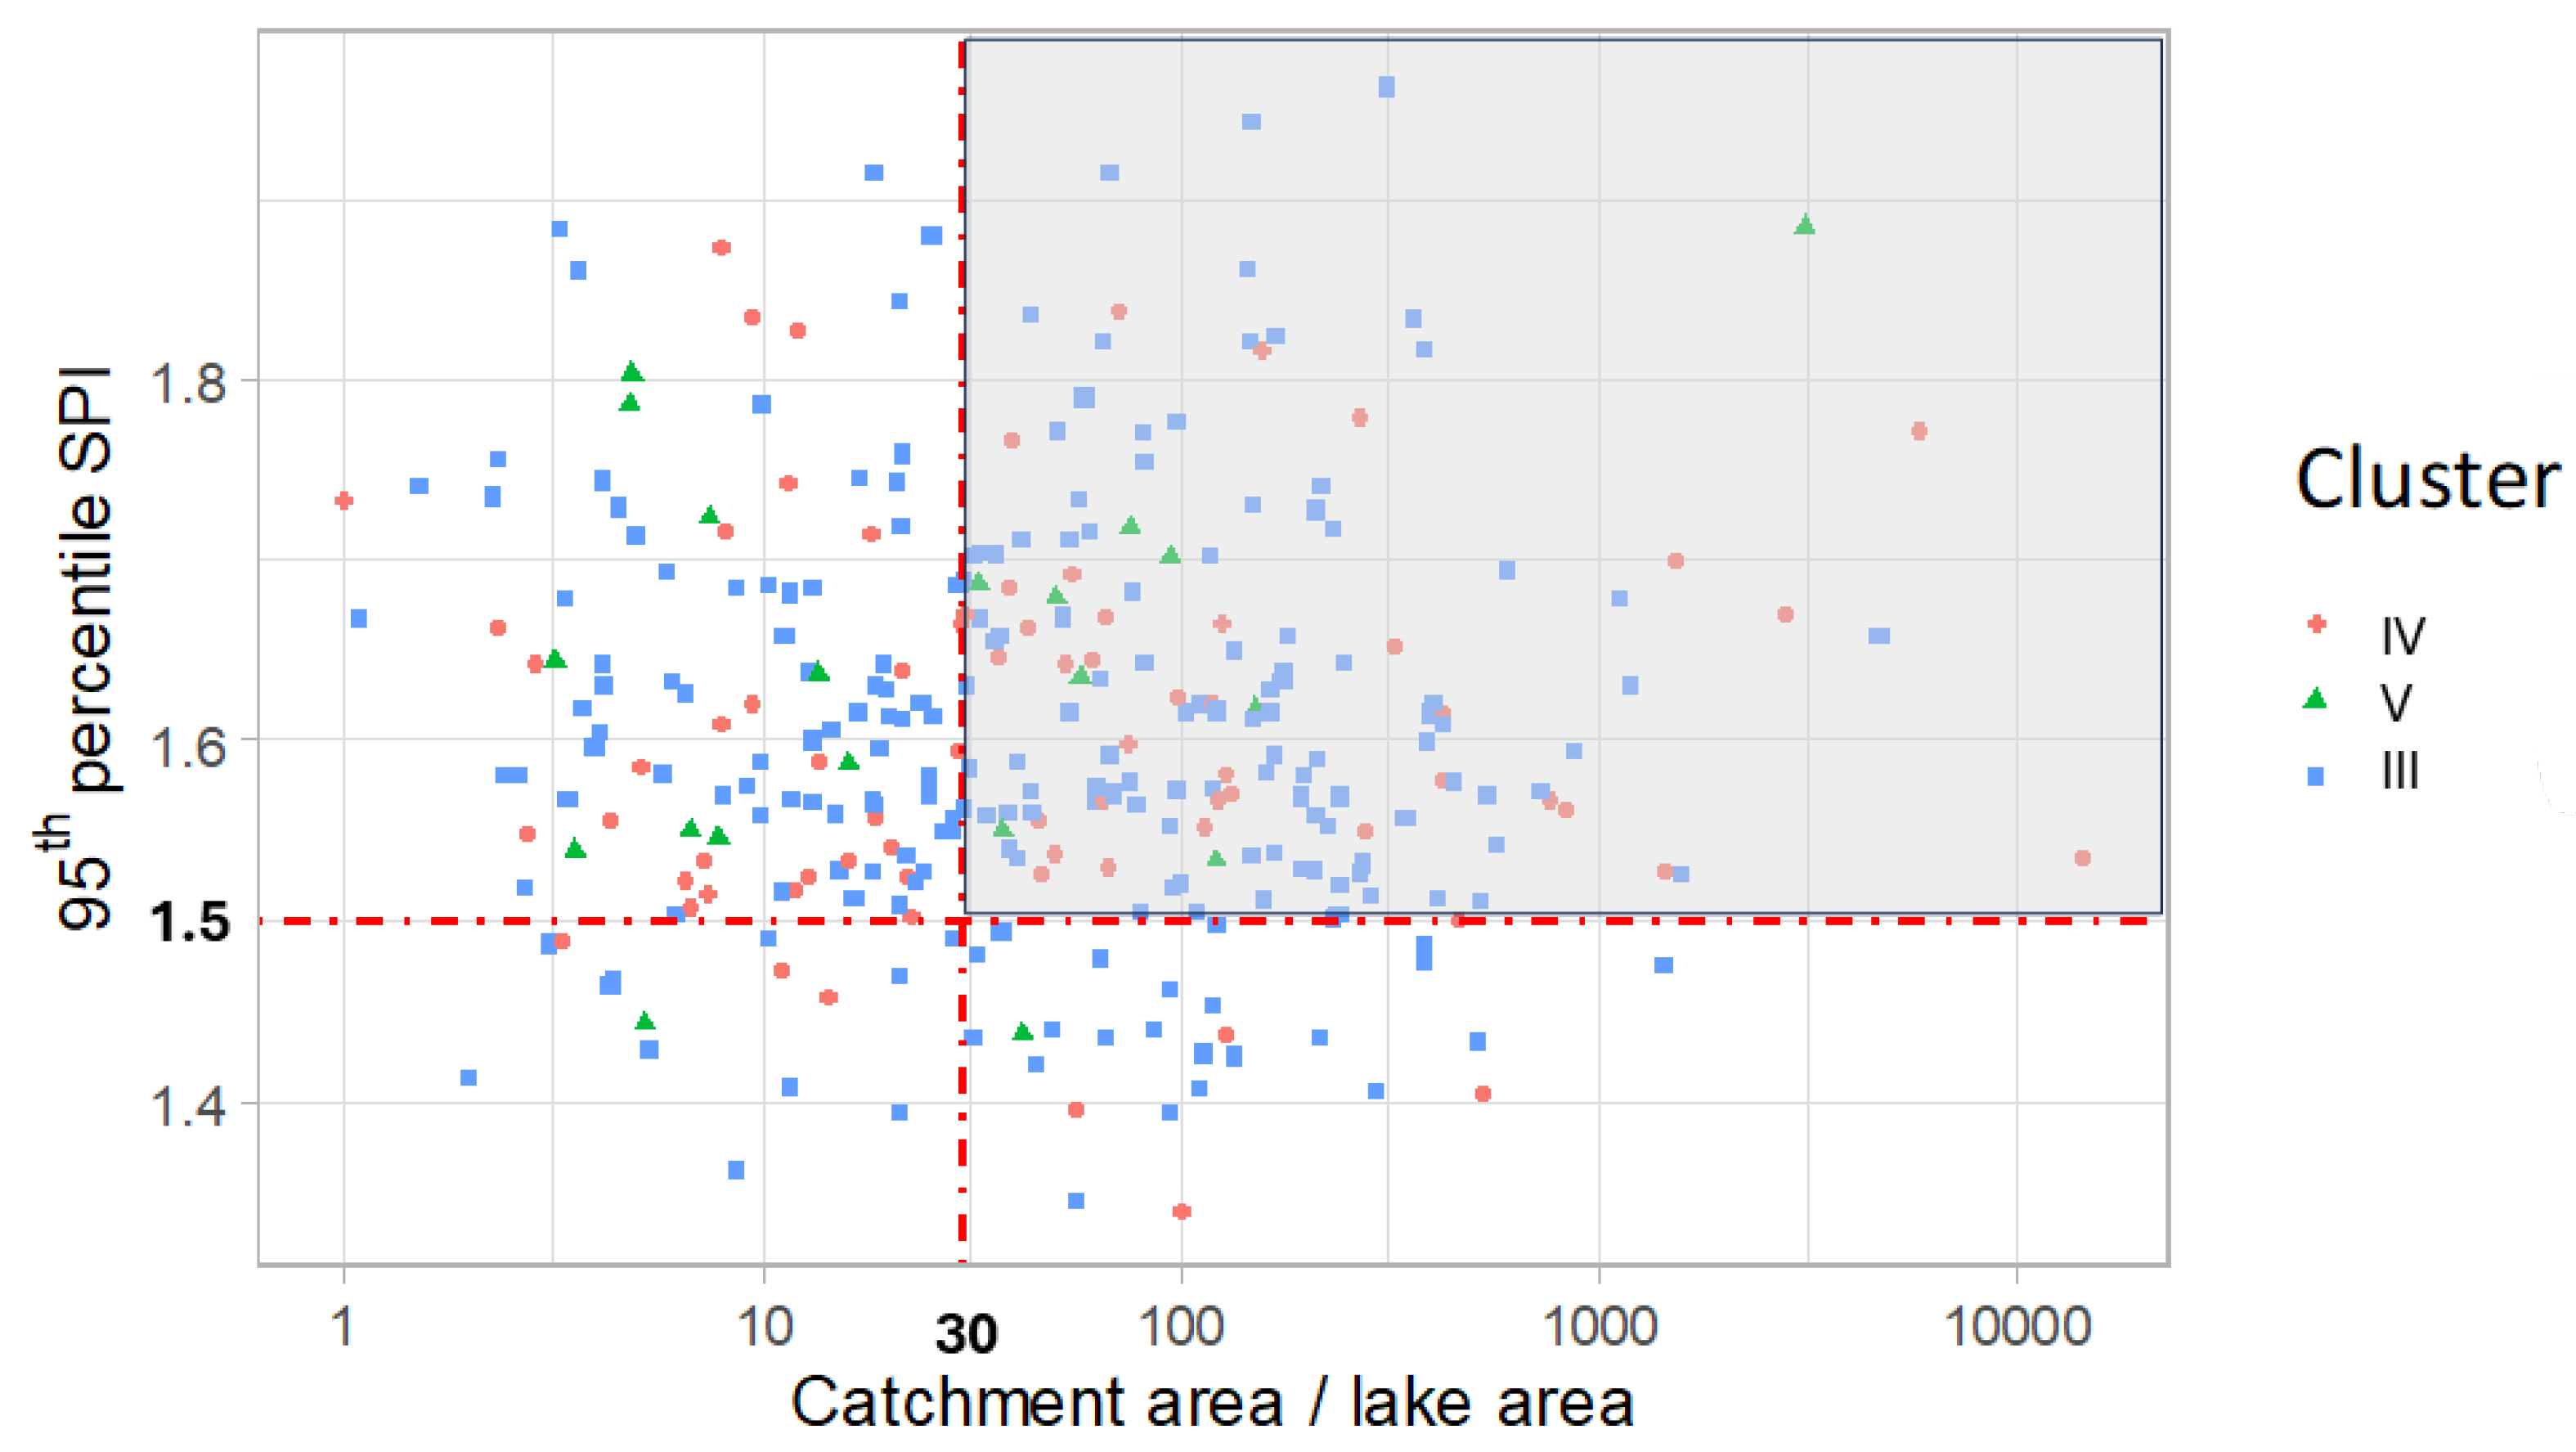
| Chl-a Peak (Log) | R2 = 19.5% | Chl-a Peak (Log) (Cluster IV) | R2 = 45.8% | ||
|---|---|---|---|---|---|
| Variable | Coefficient | p | Variable | Coefficient | p |
| Depth_mean | −0.0067 | 0.0001 | Depth_mean | −0.4107 | 0.0001 |
| Latitude | 0.0046 | 0.0001 | Residence time (Log) | 0.2341 | 0.0001 |
| BA/A_mean | 0.2652 | 0.0218 | BA level 0–4 (Log) | −0.1310 | 0.0001 |
| SPI_mean | −0.0676 | 0.0057 | SPI (90th percentile) | 0.6872 | 0.0279 |
| Turbidity (NTU) | R2 = 1.2% | Turbidity (NTU) (Cluster IV) | R2 = 42.3% | ||
| Variable | Coefficient | p | Variable | Coefficient | p |
| SPI_mean | 0.5341 | 0.0275 | Elevation | −0.0004 | 0.0001 |
| Log Catchment/lake area | 0.3511 | 0.0001 | |||
| SPI_mean | 1.9097 | 0.0001 |
Disclaimer/Publisher’s Note: The statements, opinions and data contained in all publications are solely those of the individual author(s) and contributor(s) and not of MDPI and/or the editor(s). MDPI and/or the editor(s) disclaim responsibility for any injury to people or property resulting from any ideas, methods, instructions or products referred to in the content. |
© 2024 by the authors. Licensee MDPI, Basel, Switzerland. This article is an open access article distributed under the terms and conditions of the Creative Commons Attribution (CC BY) license (https://creativecommons.org/licenses/by/4.0/).
Share and Cite
Caroni, R.; Pinardi, M.; Free, G.; Stroppiana, D.; Parigi, L.; Tellina, G.; Bresciani, M.; Albergel, C.; Giardino, C. Investigating the Impact of Wildfires on Lake Water Quality Using Earth Observation Satellites. Appl. Sci. 2024, 14, 2626. https://doi.org/10.3390/app14062626
Caroni R, Pinardi M, Free G, Stroppiana D, Parigi L, Tellina G, Bresciani M, Albergel C, Giardino C. Investigating the Impact of Wildfires on Lake Water Quality Using Earth Observation Satellites. Applied Sciences. 2024; 14(6):2626. https://doi.org/10.3390/app14062626
Chicago/Turabian StyleCaroni, Rossana, Monica Pinardi, Gary Free, Daniela Stroppiana, Lorenzo Parigi, Giulio Tellina, Mariano Bresciani, Clément Albergel, and Claudia Giardino. 2024. "Investigating the Impact of Wildfires on Lake Water Quality Using Earth Observation Satellites" Applied Sciences 14, no. 6: 2626. https://doi.org/10.3390/app14062626